Article

Twenty Years of Thermal Infrared Observations (2004–2024) at Campi Flegrei Caldera (Italy) by the Permanent Surveillance Ground Network of INGV-Osservatorio Vesuviano

Istituto Nazionale di Geofisica e Vulcanologia-Sezione di Napoli Osservatorio Vesuviano, 80124 Napoli, Italy
*
Author to whom correspondence should be addressed.
Remote Sens. 2024, 16(17), 3352; https://doi.org/10.3390/rs16173352
Submission received: 19 June 2024 / Revised: 31 July 2024 / Accepted: 16 August 2024 / Published: 9 September 2024

Abstract

:
Thermal infrared (TIR) time series images acquired by ground, proximal TIR stations provide valuable data to study evolution of surface temperature fields of diffuse degassing volcanic areas. This paper presents data processing results related to TIR images acquired since 2004 by six ground stations in the permanent thermal infrared surveillance network at Campi Flegrei (TIRNet) set up by INGV-Osservatorio Vesuviano. These results are reported as surface temperature and heat flux time series. The processing methodologies, also discussed in this paper, allow for presentation of the raw TIR image data in a more comprehensible form, suitable for comparisons with other geophysical parameters. A preliminary comparison between different trends in the surface temperature and heat flux values recorded by the TIRNet stations provides evidence of peculiar changes corresponding to periods of intense seismicity at the Campi Flegrei caldera. During periods characterized by modest seismicity, no remarkable evidence of common temperature variations was recorded by the different TIRNet stations. Conversely, almost all the TIRNet stations exhibited common temperature variations, even on a small scale, during periods of significant seismic activity. The comparison between the seismicity and the variations in the surface temperature and heat flux trends suggests an increase in efficiency of heat transfer between the magmatic system and the surface when an increase in seismic activity was registered. This evidence recommends a deeper, multidisciplinary study of this correlation to improve understanding of the volcanic processes affecting the Campi Flegrei caldera.

1. Introduction

Campi Flegrei caldera (CFc) is an active volcanic area connected to the Plio–Quaternary volcanism of the Campanian Plain, originating from the opening of the Tyrrhenian basin [1,2]. The Campi Flegrei area has been active for no less than 80 ka, and its current morphology is the result of volcanism following at least two high-energy eruptions, the Campanian Ignimbrite and the Neapolitan Yellow Tuff eruptions, which occurred at 40 and 15 ka, respectively. The last eruption occurred in 1538, generating the Monte Nuovo volcanic edifice at the end of a very intense volcanic activity period, which lasted 5.5 ka and was characterized by more than 27 eruptions [3,4,5,6,7,8,9,10,11,12]. The CFc is affected by ground movement [13,14,15,16,17,18,19,20], seismic activity [21,22,23,24,25,26], hot fumarole fields, and diffuse degassing [27,28,29,30,31]. The main degassing sites are the Solfatara crater, the Pisciarelli area, the via Antiniana, the Agnano area, and Mt. Olibano (Figure 1) [32,33,34,35,36]. The CFc is associated with high volcanic risk, as it is a densely populated area that includes part of the city of Napoli, inhabited by more than 1.5 million people [37,38,39,40,41,42,43,44].
A new ground uplift phase at the CFc began in 2005, characterized by intense seismicity and degassing activity [45,46,47,48,49]. From November 2005 to May 2024, the ground uplift reached a total maximum displacement of about 127 cm, and during the period January 2016–May 2024 the maximum displacement was 94 cm [14,45]. This increase in ground uplift velocity over recent years brought progressively increasing seismicity, which reached a climax during the periods August–November 2023 and May 2024 [45].
In recent decades, the Osservatorio Vesuviano, a section of the Istituto Nazionale di Geofisica e Vulcanologia (INGV-OV), has mainly focused its efforts on improving monitoring networks in this area to better understand the evolution of the volcanic system. Since 2004, the INGV permanent thermal infrared surveillance network (TIRNet) has been monitoring the surface temperatures of the main diffuse degassing sites in the CFc. Camera-generated proximal thermal infrared (TIR) observations are widely used to monitor and study volcanoes, and several studies have reported the use of TIR observations to follow evolutions of volcanic activity and to map distributions of volcanic products [50,51,52,53,54,55,56,57,58]. In contrast, very few volcanic areas are currently being monitored with permanent, ground, proximal networks of TIR cameras during non-eruptive periods to detect surface temperature variations as indicators of possible changes in the volcanic system [59,60,61,62,63,64,65,66,67,68,69,70,71,72,73,74,75,76].
The aim of this paper is to present the data collected by the TIR stations in the TIRNet permanent thermal infrared monitoring network, set up by INGV-Osservatorio Vesuviano, during the period 2004–2024. The time series of the surface temperature and heat flux parameters obtained by processing twenty years of the TIR images at the CFc are reported and discussed. Moreover, analysis methodologies are discussed in detail. Finally, the processed data are provided and can be downloaded, as they are a useful contribution to the study of the volcanic evolution of the Campi Flegrei volcanic area.

2. The TIR Surveillance Network (TIRNet) in the Campi Flegrei Area

2.1. TIR Data Acquisition System

The current INGV-OV TIRNet at Campi Flegrei is composed of six TIR stations that acquire daily, nighttime TIR frames of the diffuse degassing areas characterized by significative thermal anomalies (Figure 1) [77]. The stations’ locations are illustrated in Figure 1, where the monitored diffuse degassing areas of Solfatara, Mt. Olibano, Pisciarelli, and Antiniana are mapped.
The target area of the SF1 station is the northeastern side of the Solfatara crater, where the Bocca Grande and Bocca Nuova fumaroles are located [33]; the SF2 station acquires frames of the northern inner slope of the Solfatara crater (cryptodome area, [33]); the SOB station targets the eastern rim of the Solfatara crater [33]; the PIS station targets the western slope of the Pisciarelli hot mud pool [32,35,36]; the target area of the OBN station is the southern slope of the Mt. Olibano lava dome [33]; and the ANTN station acquires frames of the Antiniana area. SF1 was the first station installed, in September 2004, and ANTN was the last installed, in October 2020.
The development chronogram of the TIRNet network is reported in Table 1. The SF1 and PIS stations have been equipped with different TIR sensors and camera models during their respective operational periods. In Table 2, technical specifications of the different TIR camera models are reported; among these, resolution and thermal sensitivity (ability of the sensor to detect small temperature differences) are characteristics that strongly influence quality of the TIR images. Detailed technical specifications of the current TIRNet stations and their target areas are reported in Table 3, including field of view of the lenses, data transmission types (Wi-Fi or LTE mobile network), UTM station coordinates, sensor–target average distances, and average pixel sizes.
FLIR cameras perform real-time environmental correction (algorithm FLIR LOWTRAN, [78]) of TIR frames using the following parameters: (a) sensor–target distance, (b) emissivity of target area, (c) air temperature, and (d) relative air humidity. The emissivity of the volcanic rocks in the target areas (thermally altered pyroclastic deposits) is assumed to be 0.9 [50,79,80,81]. Probes installed close to the TIR stations collect air temperature and relative humidity values a few seconds before the acquisition of a TIR image.
Every TIRNet station acquires three daily, nighttime TIR frames of its target area (00:00, 02:00, and 04:00 UTC time) and instantly uploads them to the TIR surveillance server at INGV-Osservatorio Vesuviano where they are processed to generate the temperature time series for volcanic surveillance and research purposes.
The installation sites of the TIRNet stations were carefully chosen to meet specific criteria necessary to guarantee high-quality data. First, each target area must have a thermal anomaly with very low water vapor emission, as water vapor can interpose between a sensor and its target area, reducing the TIR data quality. Each installation site must also offer efficient insolation to solar panels and ensure stable Wi-Fi or LTE connections to the surveillance server.

2.2. TIR Data Processing

The question of how best to process a long time series of thermal infrared (TIR) images from ground stations in volcanic areas has been a focus of study over the last 15 years. In the early days, image processing techniques used for satellite images and photogrammetry were not applicable to the TIR images acquired by the ground stations of the thermal infrared surveillance network (TIRNet) at the Campi Flegrei volcanic area. Researchers at the Thermal Infrared Laboratory (TIRLab) of INGV-Osservatorio Vesuviano [75] began to develop new, specific methodologies aimed at characterizing the behaviors, both in time and space, of the surface thermal anomalies in the TIR images [75,76,77,78,79]. Current procedures used to analyze the TIR images acquired by the TIRNet ground stations are the result of more than a decade of constant technical evolution, both in the laboratory and in the field. The state-of-the-art processing methods of the TIRLab are detailed in [78], although several experimental procedures are currently underway. The challenge is to maximize the high potential inherently possessed by TIR images by developing new processing techniques.
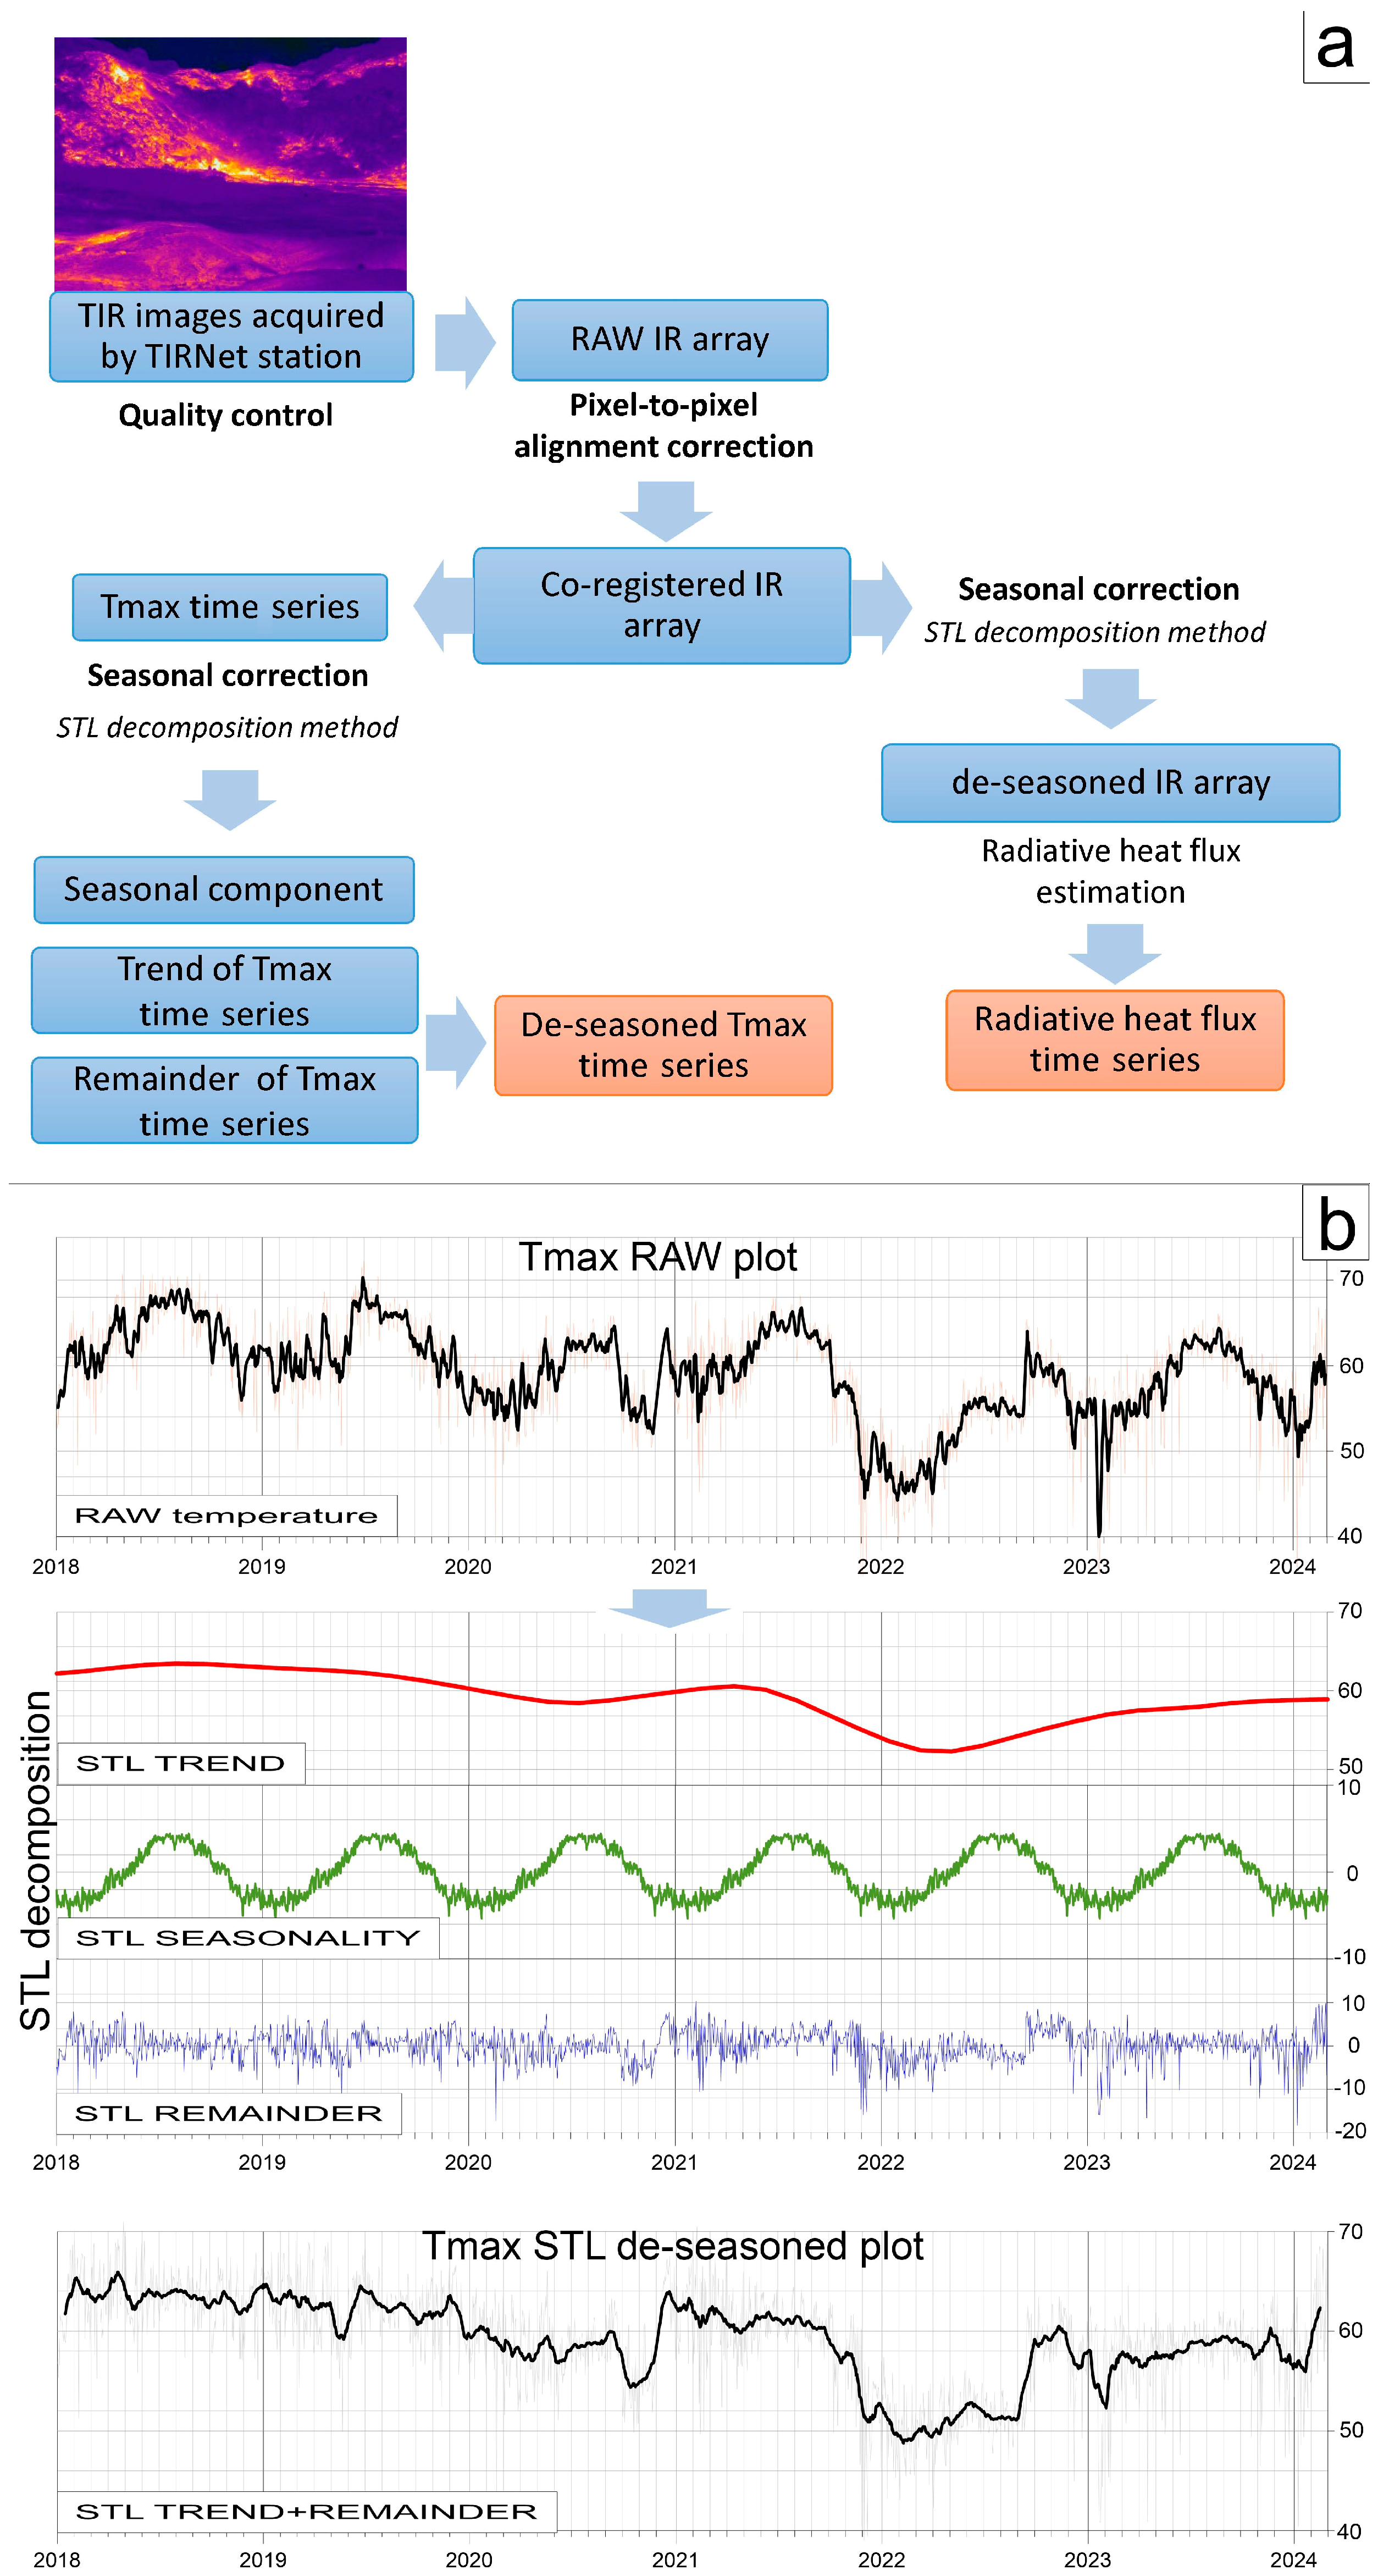
In this study, data processing is executed by the fully automated Matlab software ASIRA (Automated System of InfraRed Analysis, v. 5.5) developed by the TIRLab of INGV-Osservatorio Vesuviano [75,79]. ASIRA is a modular software with a friendly user interface. Its code is freely available under the Creative Commons Attribution 4.0 International License, as reported in [79], where individual processing steps are described in detail. For additional information on ASIRA and processing methodologies, please refer to [79]. The steps performed by ASIRA are reported in Figure 2a below, and can be briefly listed as follows: (1) conversion of FLIR radiometric JPEG raw files acquired by sensors in the field into temperature matrix files (.csv); (2) quality control of the TIR frames and exclusion of low quality frames; (3) co-registration of the TIR frames compared to a reference frame, to correct pixel alignment between all frames in the time series; (4) extraction of the continuous apparent temperature time series (both maximum and average values) from anomaly areas inside the TIR frames; (5) removal of seasonal components in the temperatures time series using statistical methods; and (6) evaluation of radiative heat flux.
The co-registration of the TIR frames becomes necessary due to ground movements, which affect the studied volcanic area, and it is performed by applying the SIFT Flow Matlab algorithm [82]. The SIFT flow algorithm matches pixel-to-pixel correspondences between the TIR frames of the whole time series to a reference frame, finding the scene correspondences despite significant differences in spatial organizations in the images.
The main final products of ASIRA are time series of the maximum apparent surface temperatures that are not affected by the seasonal influences, due to application of the STL algorithm (“Seasonal and Trend decomposition using Loess” [83,84,85]). The processing step related to the removal of the seasonal component is a key step as it allows highlighting of endogenous thermal anomalies by removing the seasonal influences over the temperature time series. This step is described in-depth in [79] and consists of two different procedures, both based on the STL algorithm. The first STL procedure (STLp1) starts with creation of the maximum raw temperature time series (TmaxRAW TS) by selecting the highest temperature value related to a pixel inside the area of analysis for each TIR frame [79]. Then the STL statistical algorithm is applied to the TmaxRAW TS. The STL algorithm basically decomposes the TmaxRAW TS into three different time series (Figure 2b): Trend TS, Seasonality TS, and Remainder TS. The Trend TS represents the smoothed general tendency of the temperature values to move in a certain direction; the Seasonality TS represents the seasonal recurring temperature pattern due to exogenous factors; and the Remainder TS represents the remnant residual values after Seasonality and Trend removal. STLp1 combines the Trend TS values with the Remainder TS values and produces the time series of maximum temperatures (TmaxSTL TS; Figure 2b) that is not affected by the seasonal influences.
The second STL procedure (STLp2) removes the seasonal component from all the temperature values in the time series. First, average temperatures from a background area in all the TIR frames are extracted and a time series is created (BKG TS); then the STL algorithm is applied to BKG TS. The result is the decomposition of BKG TS into three components: BKG Trend TS, BKG Seasonality TS, and BKG Remainder TS. By removing the values of the BKG Seasonality TS from all pixels of the TIR frames, a new time series of temperature arrays, representative of de-seasoned TIR frames, is created. Availability of the de-seasoned TIR frames makes it possible to evaluate radiative heat flux due to endogenous sources, only, related to the specific areas of analysis in the de-seasoned TIR frames. In short, the radiative heat flux time series (HFlux TS) is estimated by applying the Stephan–Boltzmann equation to the surface temperature values extracted from selected pixels inside an anomaly area of the de-seasoned TIR frames, following the methodology discussed in detail in [79]. Pixel selection is made considering only the pixels whose temperature values are greater than 2SD, where SD is the standard deviation of all the temperatures extracted from the areas of analysis.
Automated data processing is performed daily by ASIRA immediately after the last frame is uploaded from the remote stations to the server. At the end of the daily processing, the plots of TmaxSTL TS, related to selected stations, are updated on a monitor located in the surveillance room of INGV-Osservatorio Vesuviano.

3. The Products of TIRNet Data Processing

Processing the TIRNet images produces a large amount of data that can be treated and displayed in several ways by using several different methodologies [75,79]. Among these products, spatial distribution of the thermal anomalies within the TIR frames, the time series of the maximum surface de-seasoned temperatures (TmaxSTL TS), and the time series of the radiative heat flux (HFlux TS) are likely the most interesting.
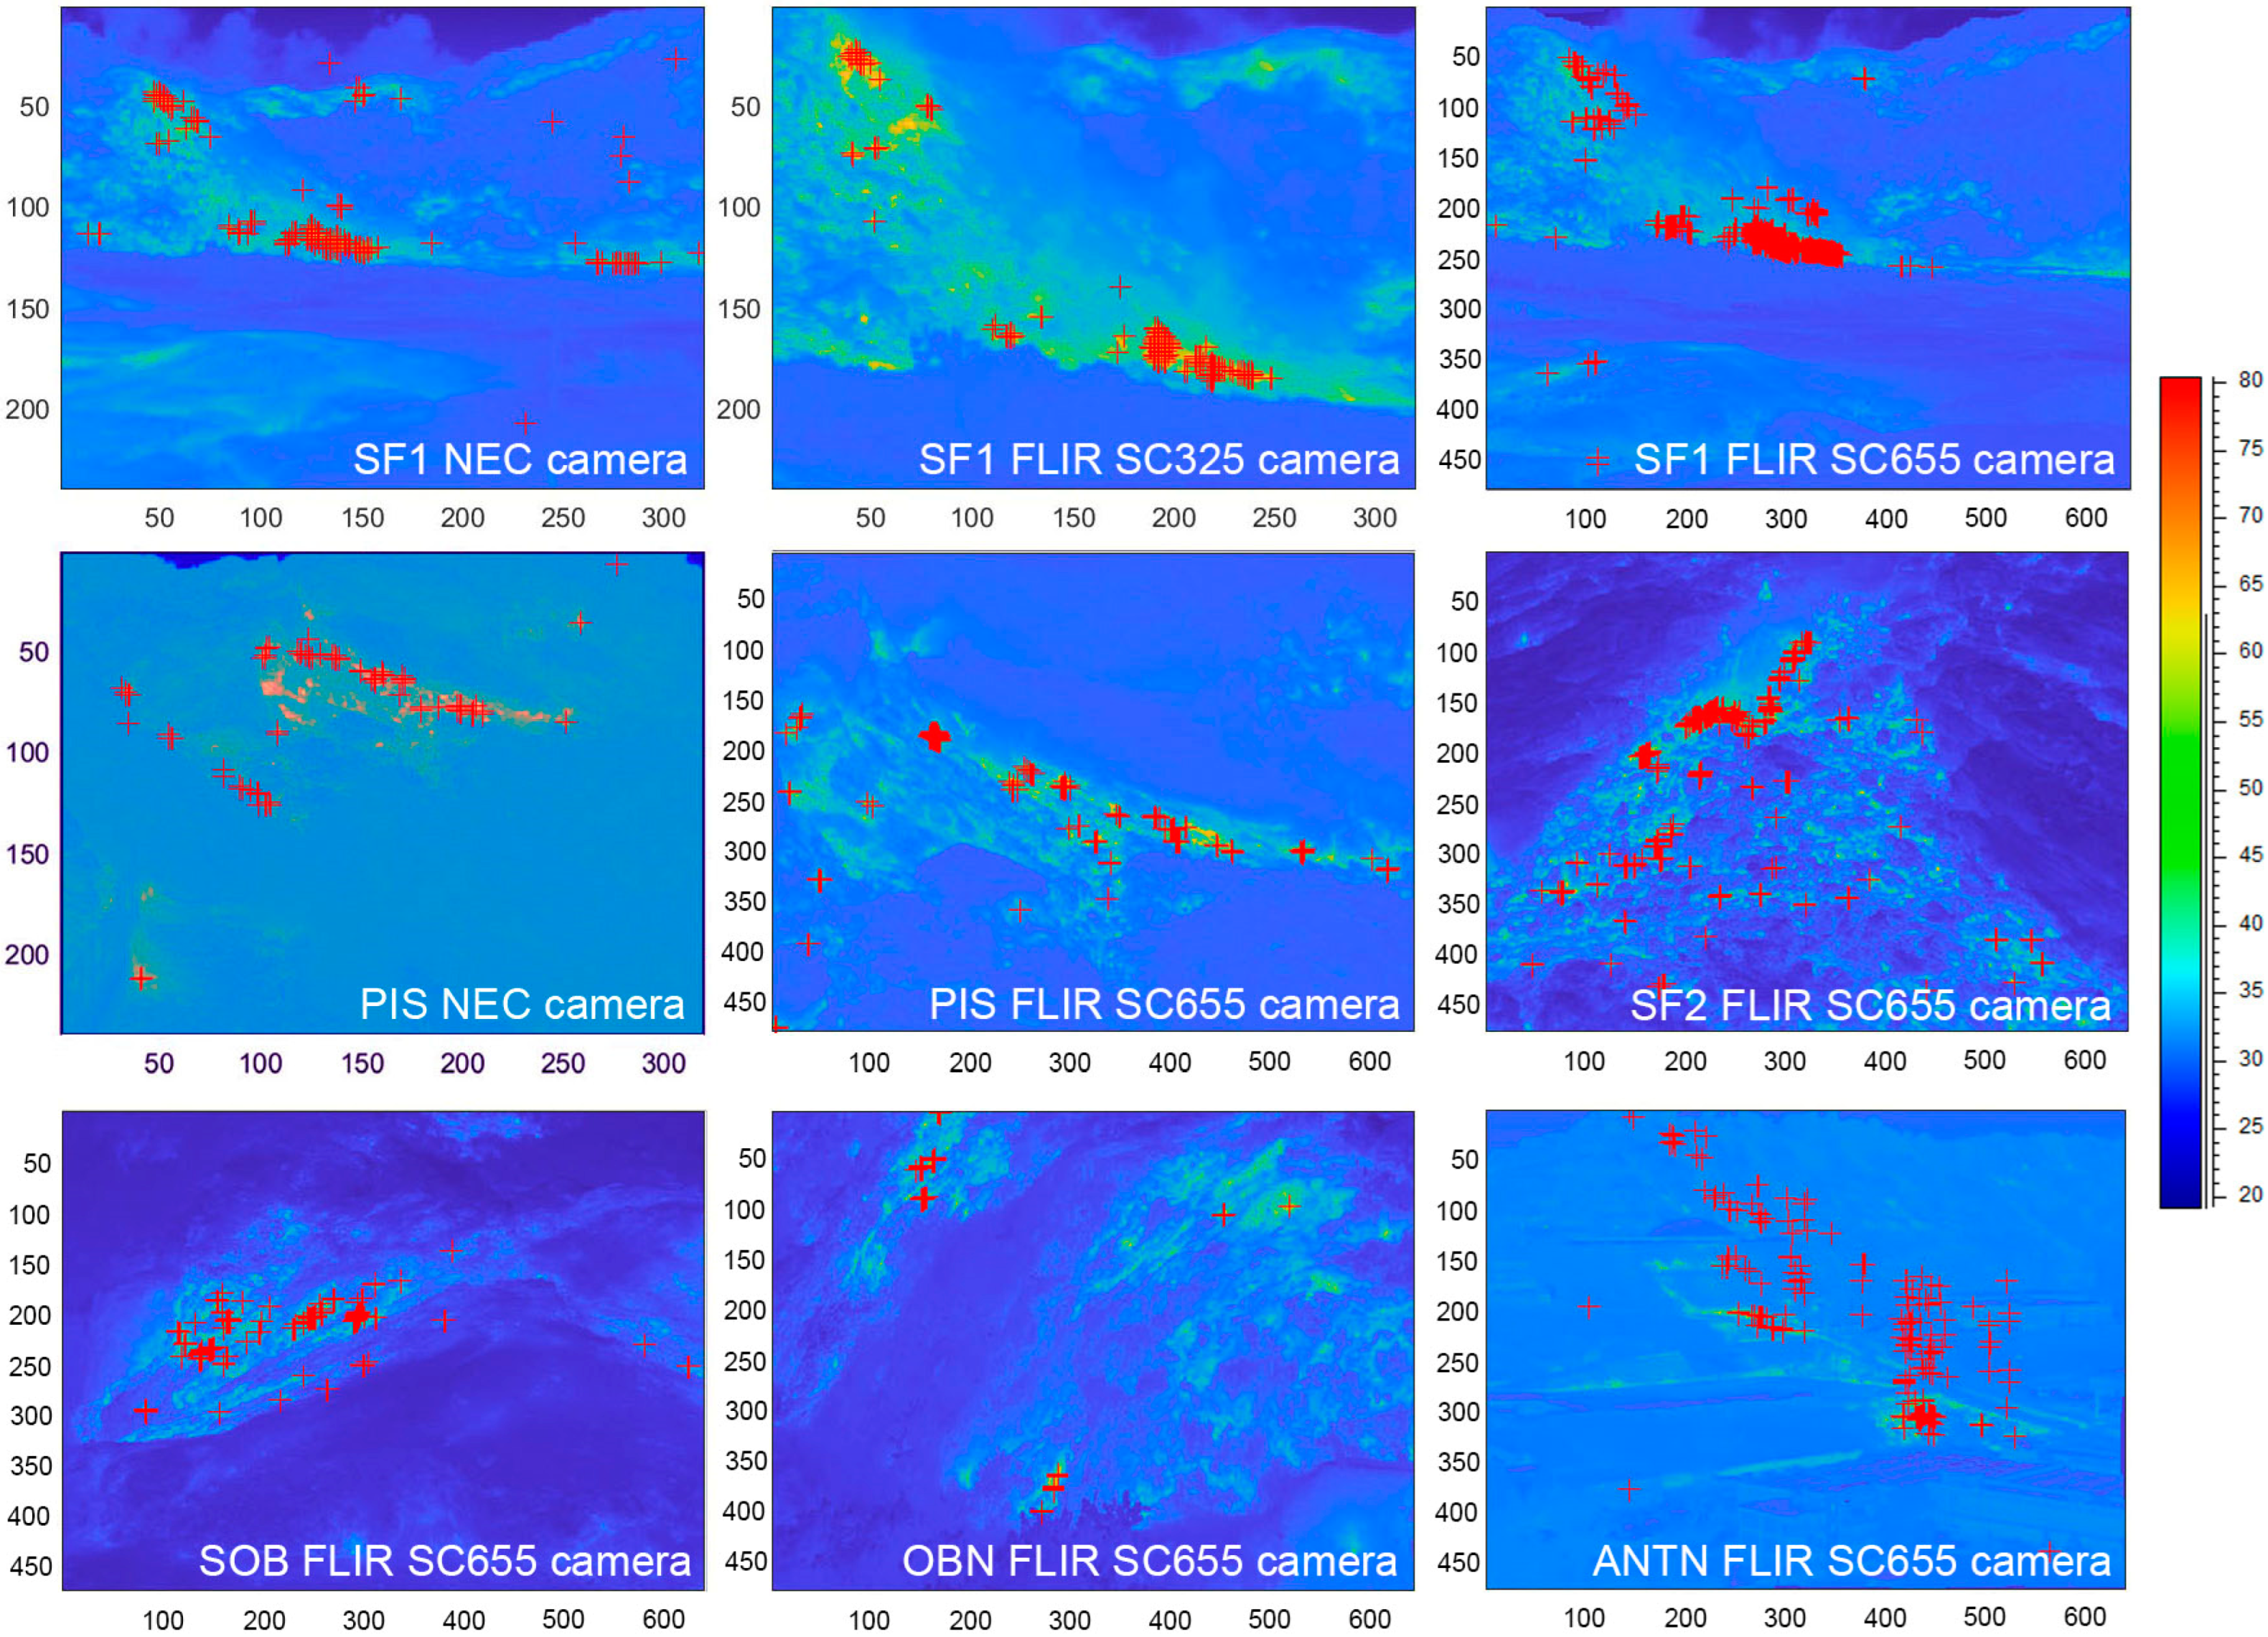
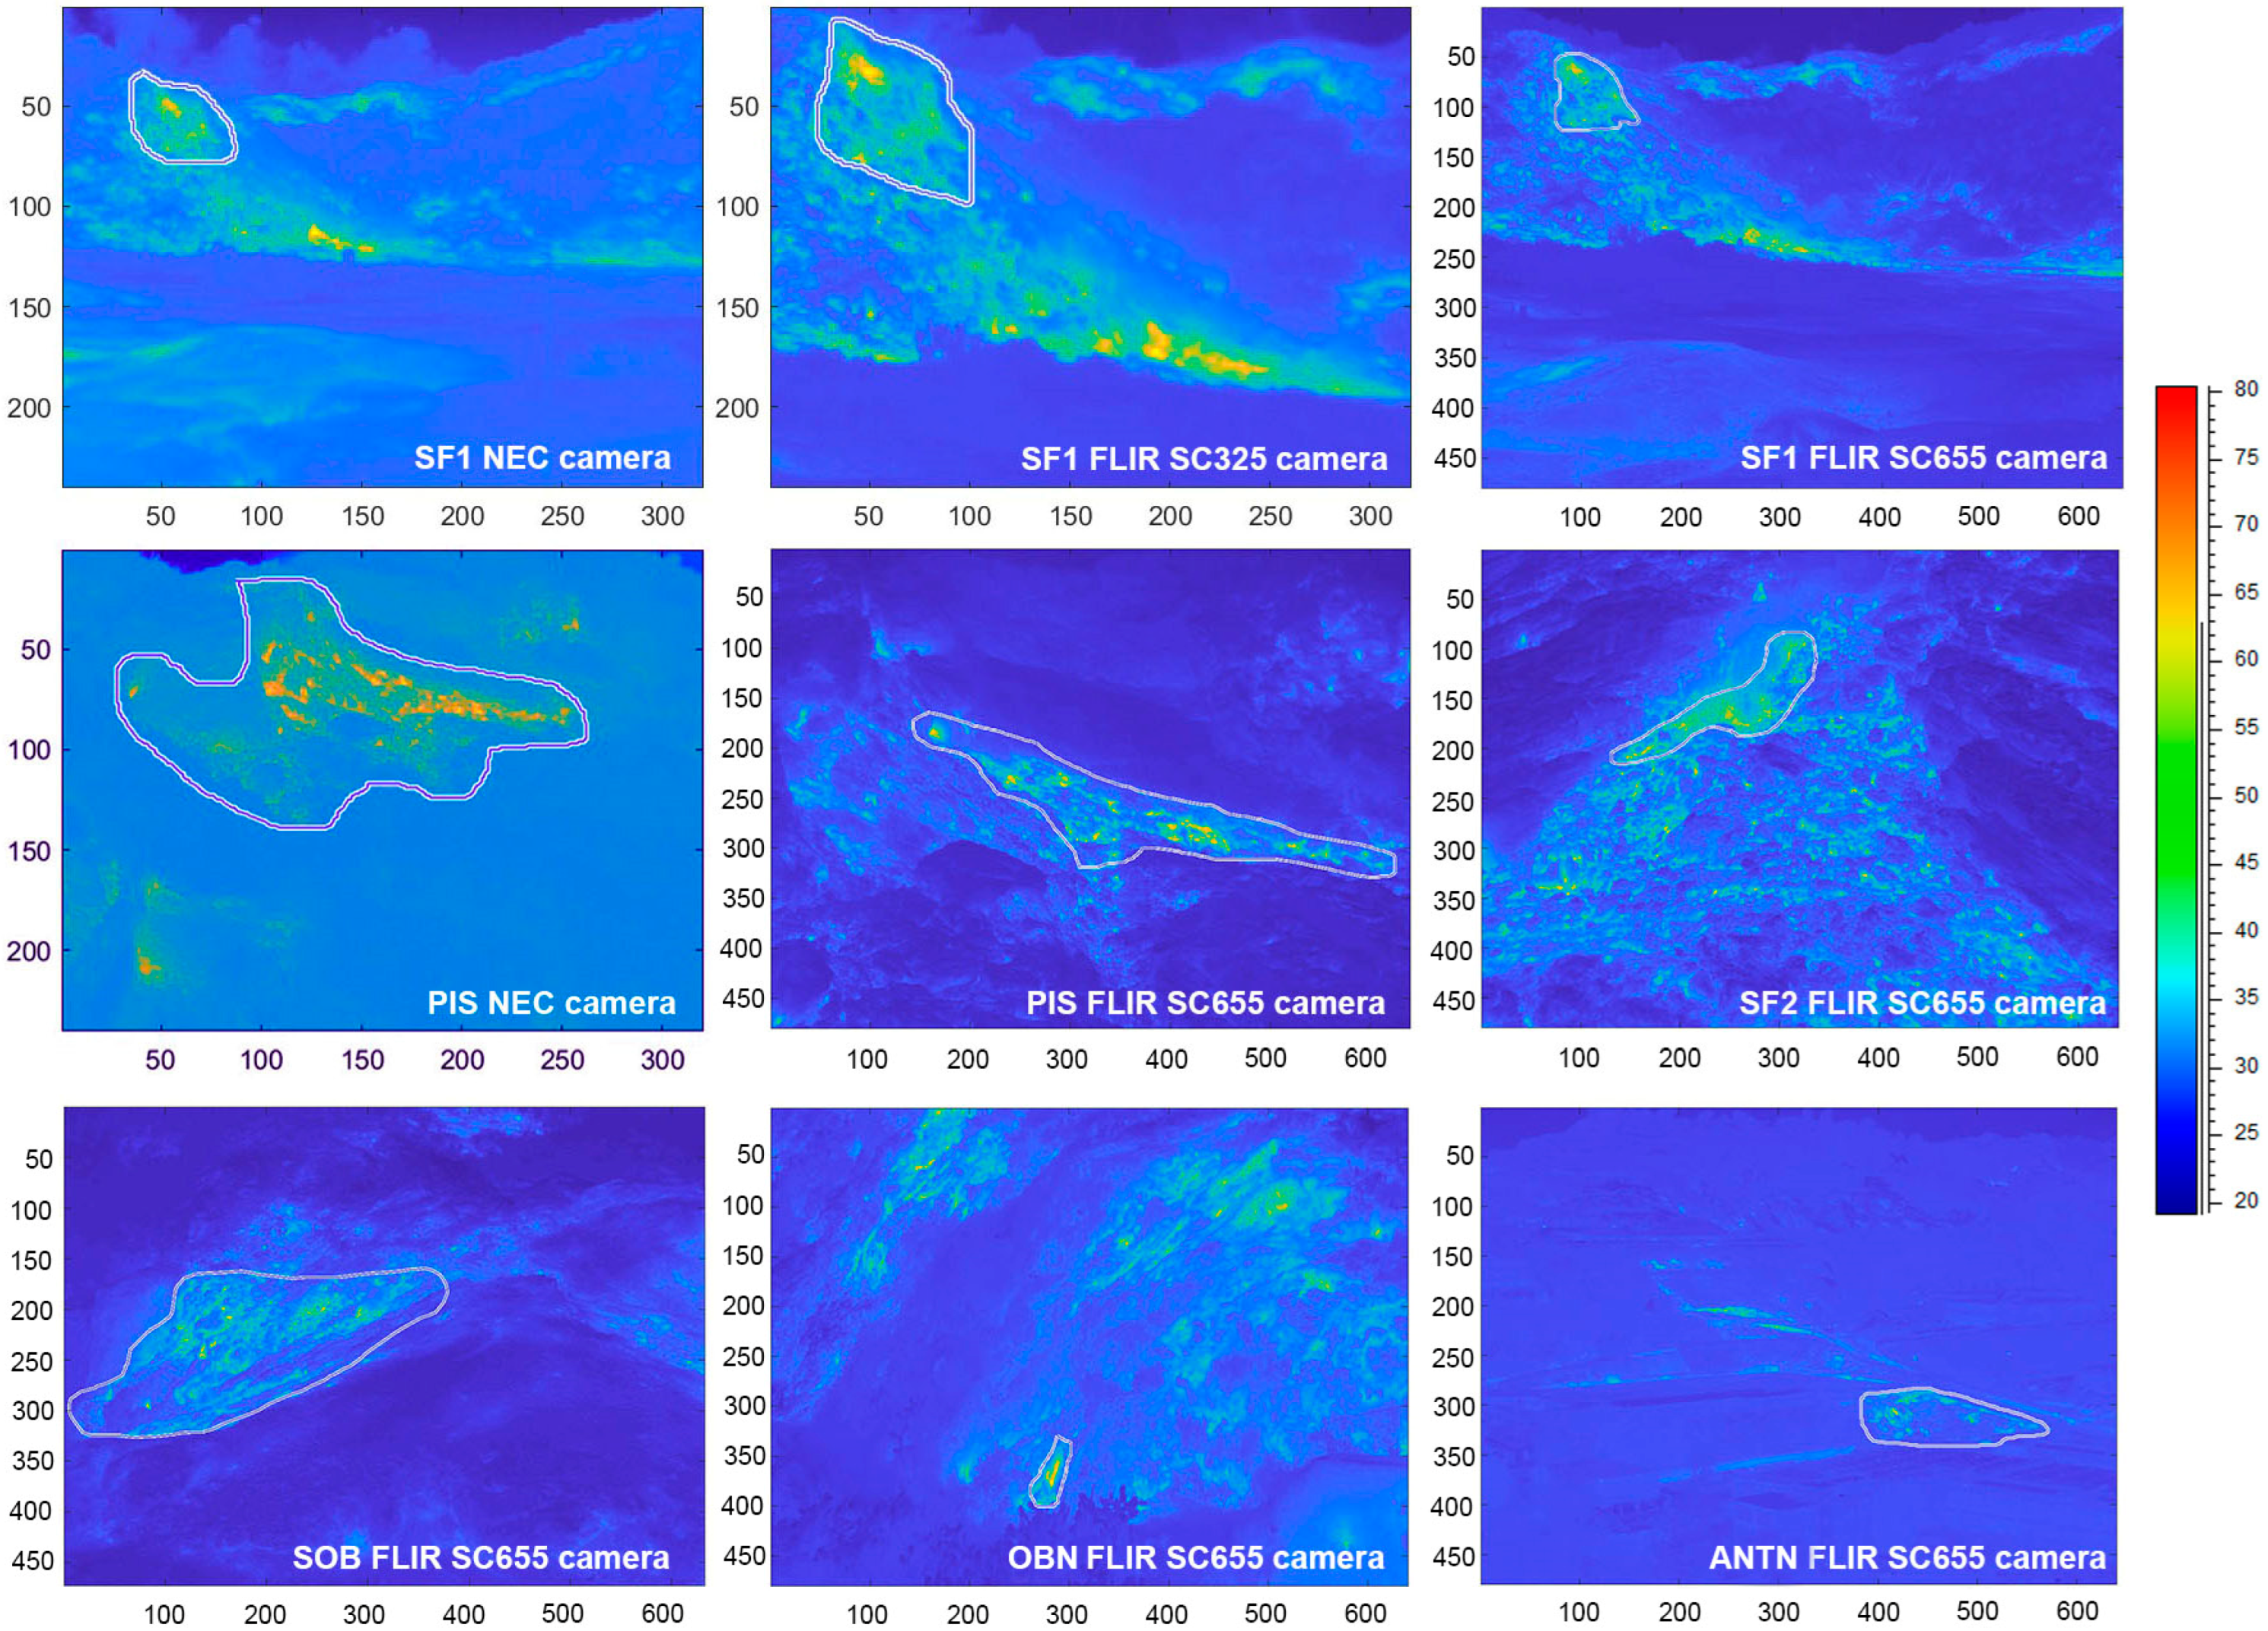
Figure 3 shows the locations of the maximum raw temperatures extracted from the time series of the TIR frames belonging to all the TIRNet stations. These maps are of fundamental importance as they allow us to understand the spatial distribution of the thermal anomalies and to identify the areas of the TIR frames which are primarily characterized by high temperature values. This enables us to delineate limits of the regions of anomaly (RoAs) for all the TIR scenes (Figure 4) and use them for analysis.
Choosing the appropriate RoA for analysis is an important phase in the data processing, as the RoA must possess specific attributes. To evaluate these attributes, it is necessary to compare a TIR image with a photograph of the same area. Main criteria used to identify a good RoA are as follows: (a) high density of high temperature pixels, (b) absence of vegetation, (c) absence of high water vapor emission from fumaroles, (d) no anthropogenic objects, and (e) not subject to possible morphological changes. Incorrect choice of the RoA can lead to low-quality final data. Due to marked clustering of the high-temperature pixels in some TIR frames, these frames can host more than one RoA. In such cases, comparing data extracted from the different RoAs in the same frame can be useful.
As previously mentioned, the temperatures extracted from the TIR frames may be underestimated due to the presence of water vapor from fumaroles between the sensor and the target area, which can partially hide the thermal anomalies [52,58,62,64]. The amount of water vapor can vary significantly depending on air temperature, humidity, and wind directions. In Figure 4, the SF1 and OBN TIR frames clearly show areas affected by this problem. In these cases, the TIR temperatures can differ considerably from actual surface temperatures of the target area. This problem was solved by finding the RoAs within the TIR frames which were not significantly affected by the presence of water vapor (Figure 4) and then processing the temperatures extracted from those RoAs only.
The maps in Figure 4 are also crucial for identifying the background areas necessary for the above-discussed methodology of the seasonal component removal. The same criteria used to select the RoAs are used for the background areas, except for criterion (a), which is replaced by “(a) absence of thermal anomaly”. Figure 5 shows the locations of the background areas (white polylines) identified in different TIR frames acquired by the six TIRNet stations. The SF1 station includes three different TIR frames, as three different TIR cameras have been used (Table 1); similarly, the PIS station includes two different TIR frames, as two different TIR cameras have been used (Table 1).
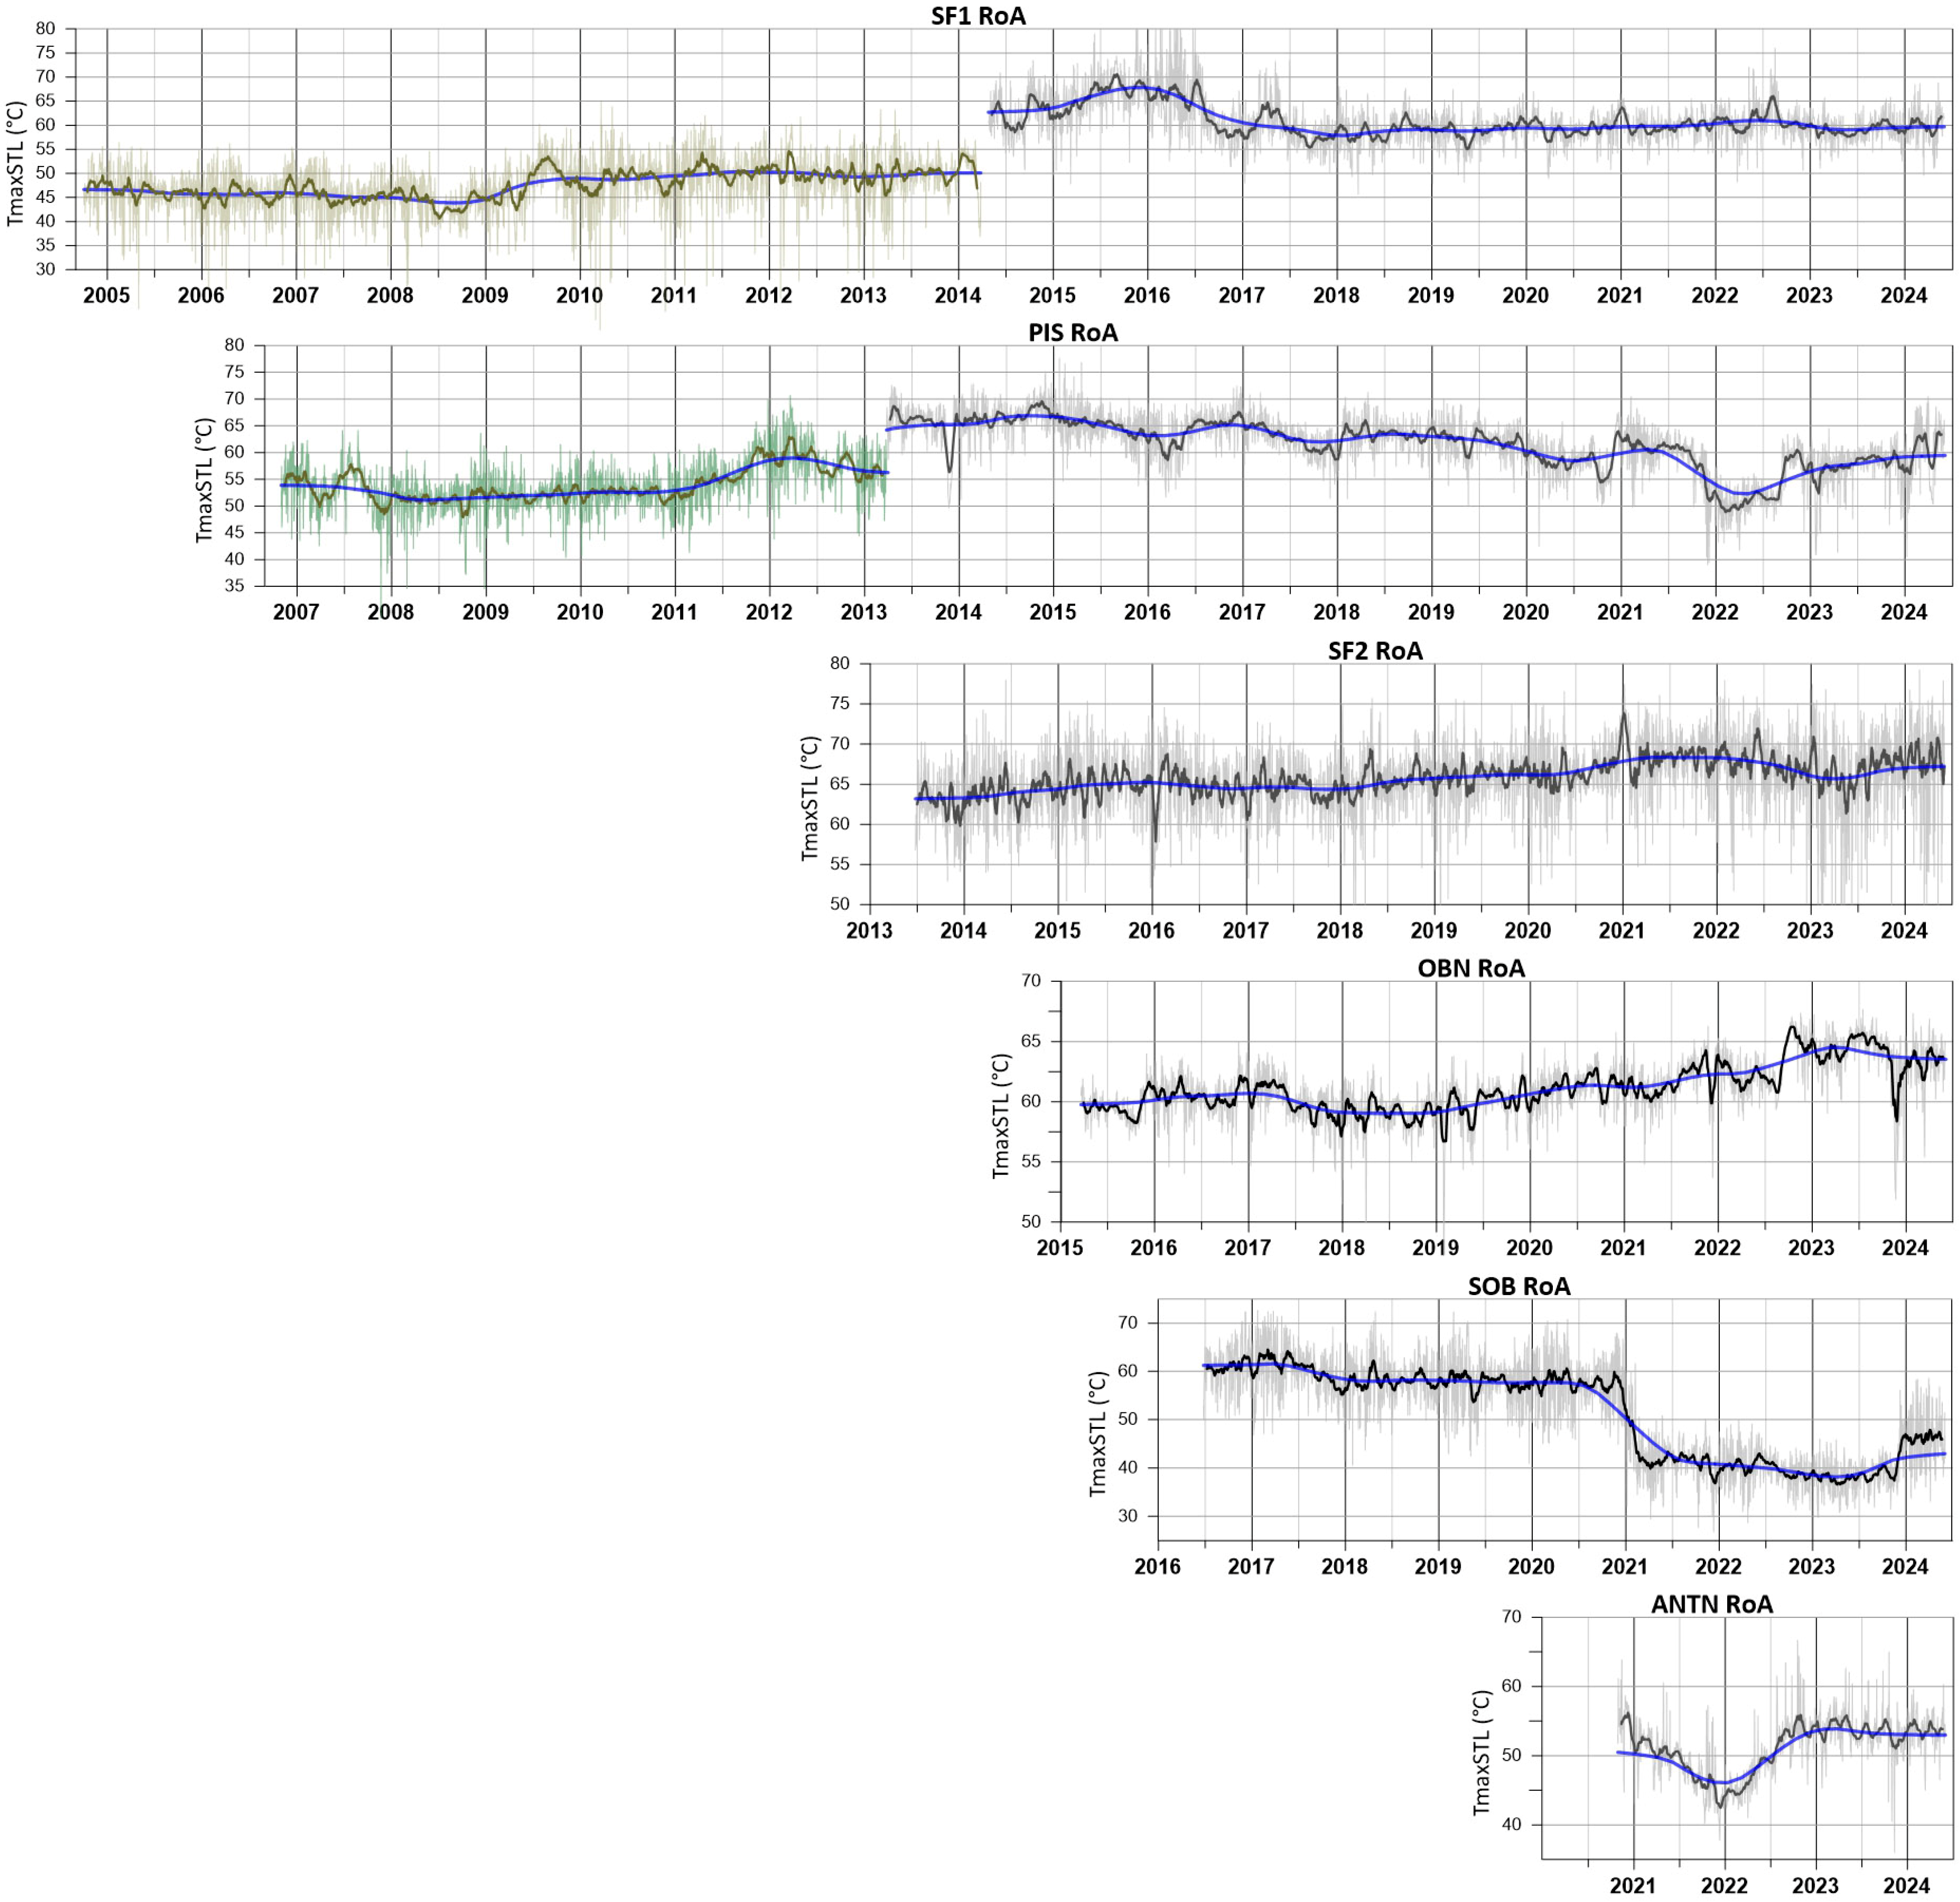
The processed data acquired by the six stations of the TIRNet surveillance network at Campi Flegrei are plotted in Figure 6. Light gray lines represent the TmaxSTL TS values of the RoAs, and black lines are related running average values (window = 21 days); blue lines represent the STL trend TS values of the same RoAs. All the data represented in these plots were acquired by FLIR SC655 TIR cameras, except for the first portion of the data in the SF1 and PIS station plots (green lines). In fact the SF1 plot is composed of the data acquired by the three different TIR cameras. Light green and dark green lines are related to the TmaxSTL TS and its running average (window = 21 days), respectively, extracted from the TIR images acquired by the NEC TS7302 camera during the period 2004–2014. Light gray and black lines of the SF1 plot are related to the TmaxSTL TS and its running average (window = 21 days), respectively, extracted from the TIR images acquired by the FLIR SC325 camera during the period April 2014–January 2016 and the FLIR SC655 camera during the remaining period. Blue lines show STL trends. Since the TIR image time series acquired by the FLIR SC325 camera is less than two years in duration and cannot be processed by the STL algorithm, removal of the seasonal component was achieved by adding the FLIR SC325 maximum temperature time series to the succeeding FLIR SC655 camera time series and processing them together. As a FLIR SC655 camera’s resolution (640 × 480) is four times higher than that of a FLIR SC325 (320 × 240), the FLIR SC655 camera installed in 2016 acquired finer details and clearer images containing a larger number of pixels per unit of area; therefore, a gap between the temperature time series obtained from the two different cameras was observed and was offset by adding 10 °C to the FLIR SC325 dataset.
The PIS plot is composed of data acquired by the two different TIR cameras. Light green and dark green lines are related to TmaxSTL TS and its running average (window = 21 days), respectively, extracted from the TIR images acquired by the NEC TS7302 camera during the period 2006–2013. Light gray and black lines are related to the TmaxSTL TS and its running average (window = 21 days), respectively, extracted from the TIR images acquired by the FLIR SC655 camera during the remaining period. Additionally, a gap was found between the two time series at the PIS station due to the different camera resolutions and was offset by adding 10 °C to the NEC TS7302 dataset.
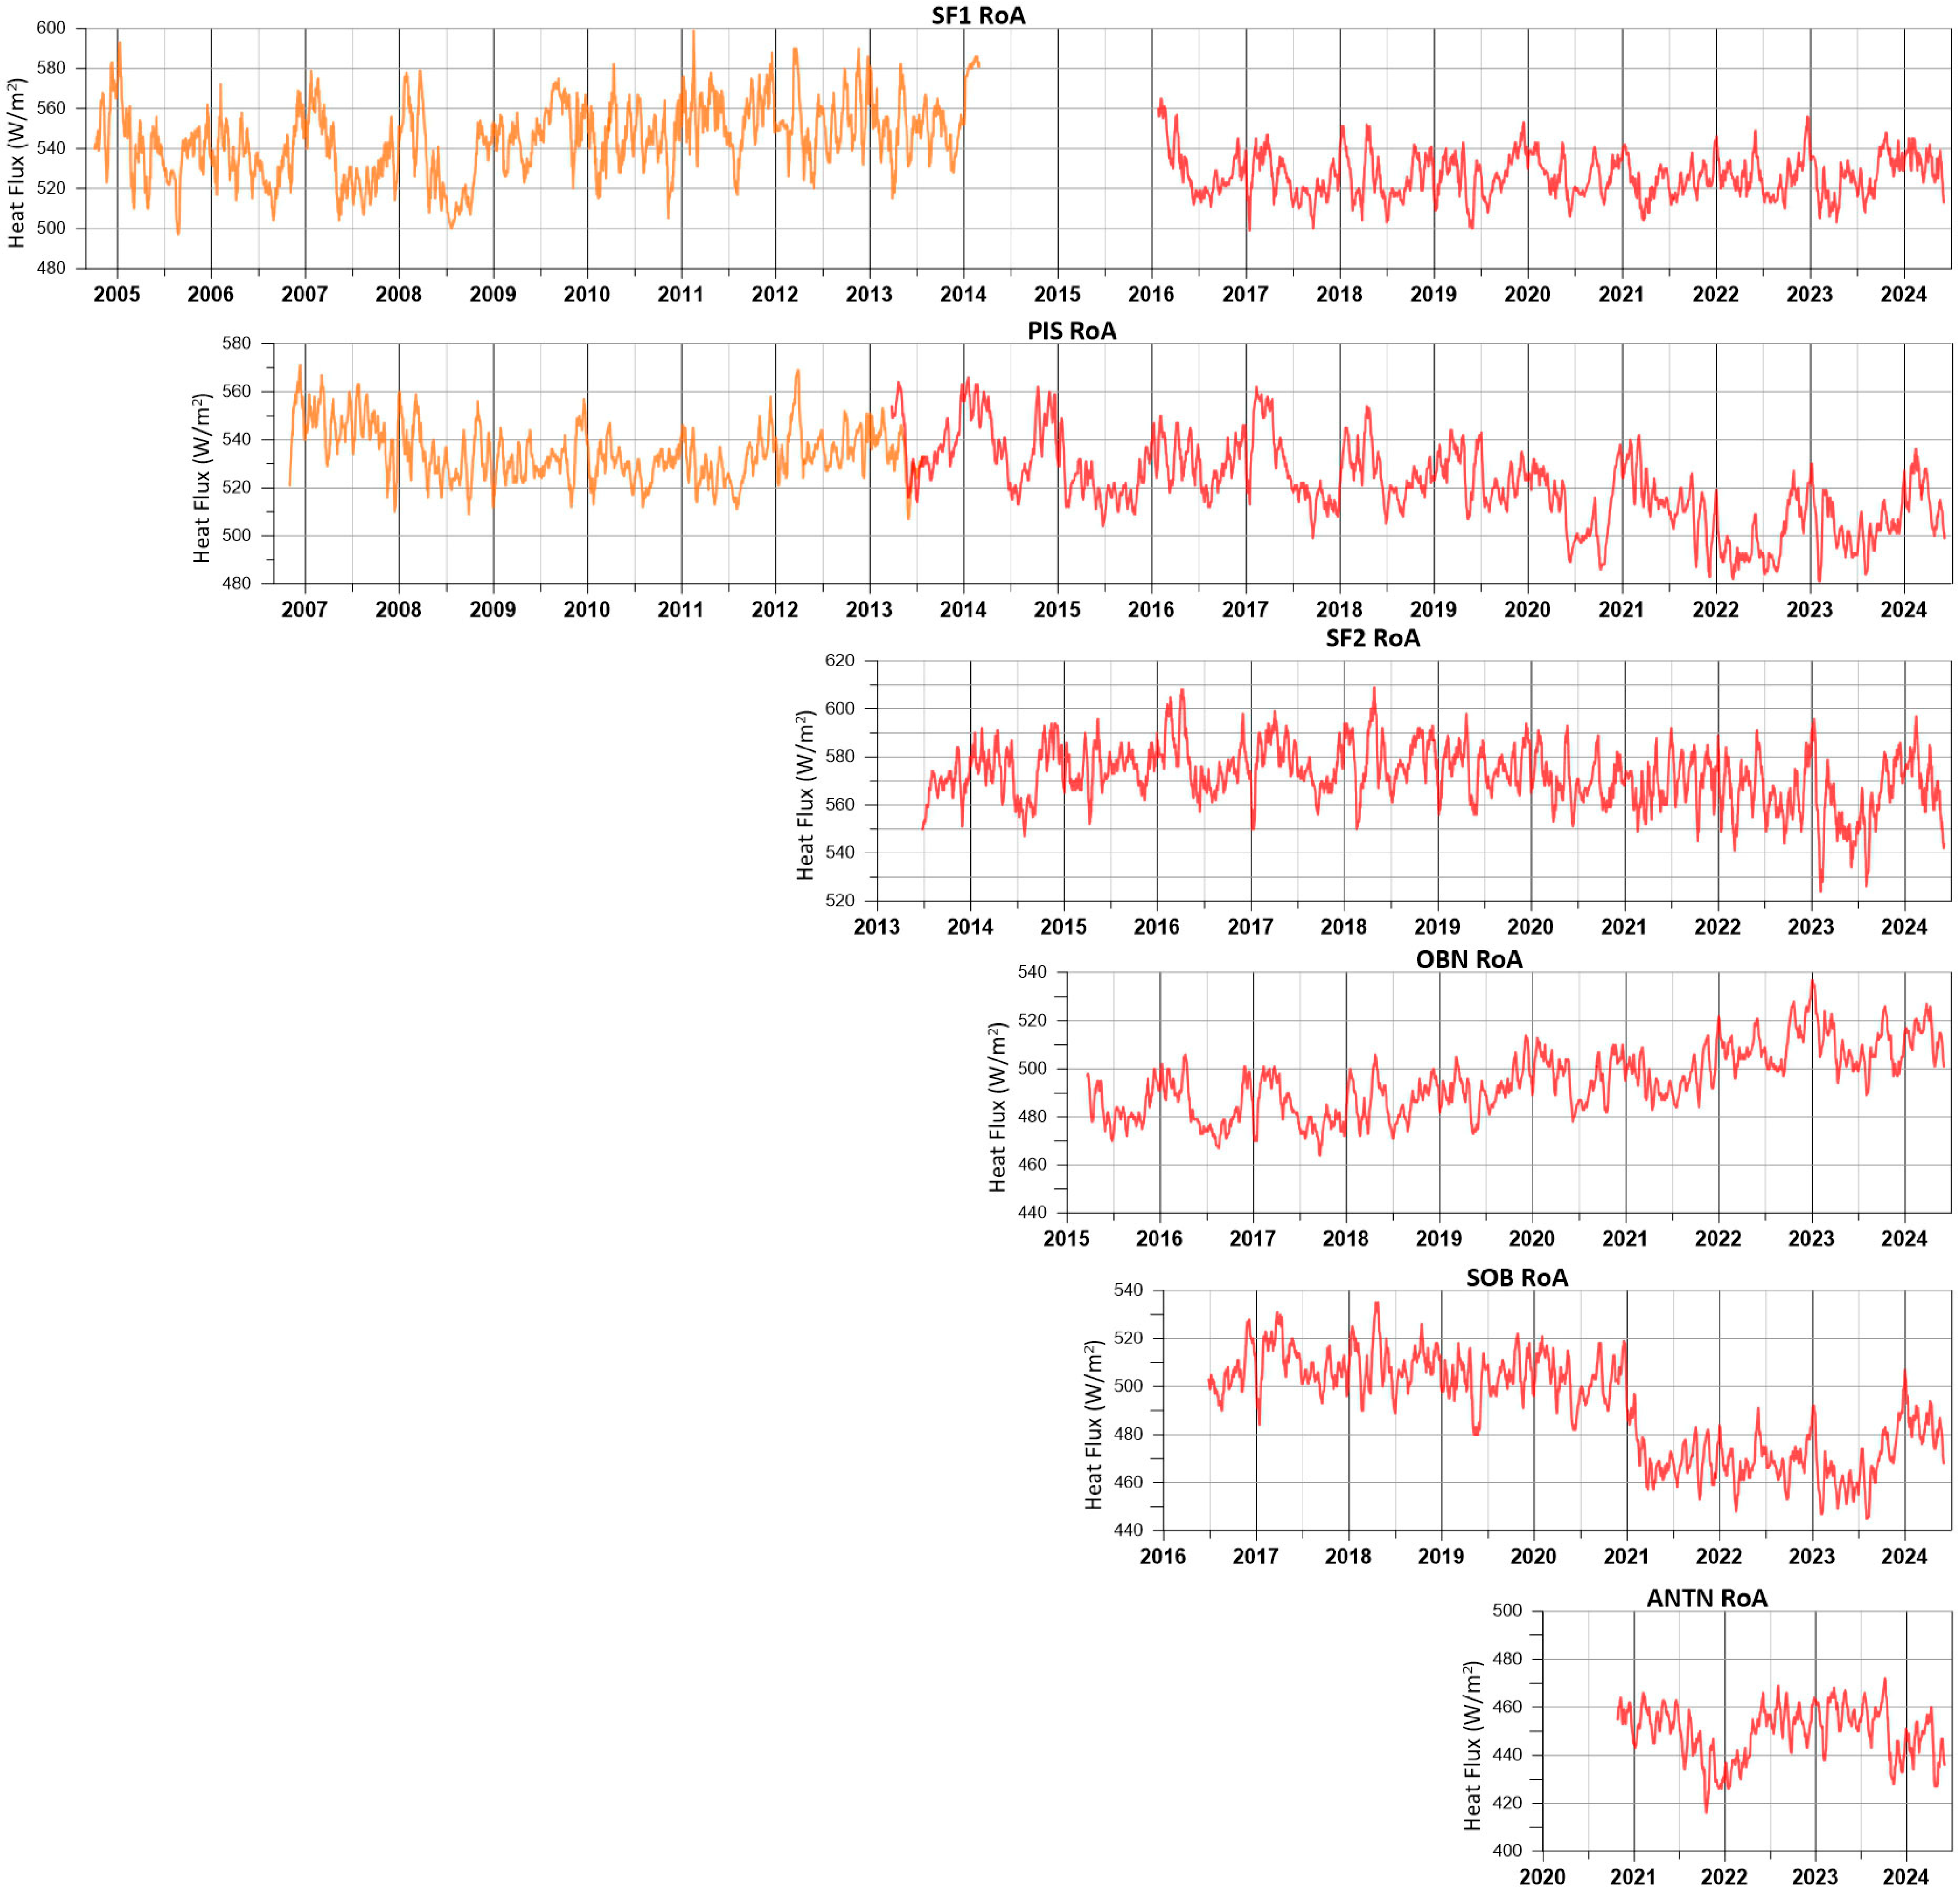
Plots of the radiative heat flux time series (HFlux TS) evaluated in the selected RoAs are shown in Figure 7. Light gray lines represent HFlux TS, black lines are related to running average values (window = 21 days), and blue lines are HFlux TS smoothed with locally estimated scatterplot smoothing (LOESS) [83]. In the period 2014–2016, the SF1 plot shows a lack of heat flux data due to the inability of STLp2 to remove the seasonal component from the TIR image time series acquired by the FLIR SC325 TIR camera, which was less than the required duration of two years.
Although the processing methodology (STLp2) used to extract the HFlux TS was valid for almost all the data from the TIRNet stations, the heat flux plot for the OBN station could not be created by applying STLp2. This was because the TIR frames acquired at the OBN station capture a portion of the southern slope of Monte Olibano, which is entirely affected by thermal anomaly, except for some vegetated areas, making it impossible to identify a valid background area to remove the seasonal component from the TIR temperature matrixes [29]. This limitation means the seasonal component of the heat flux plot for the OBN station was removed by applying STLp1 to the Tmax TS related to every pixel inside the RoA processed for the heat flux estimation, rather than STLp2 methodology.
Comparison of the TmaxSTL TS plots and the HFlux TS plots allows for evaluation of the consistency and the reliability of these products, as the methodologies used to remove the seasonal component (STLp1 and STLp2, respectively) were different.
The processed data used to generate the plots are stored in an Excel file, available as Supplementary Materials.

4. Discussion

The goal of this paper was not to examine the relationships between the TIR data (surface temperatures and heat fluxes) and other geophysical parameters, such as seismicity. However, some simple observations regarding correlation between the variations in TIR temperature trends and heat fluxes and seismic activity can demonstrate the potential of TIR data to be used in conjunction with other geophysical observables to better model the evolution of a volcanic system. Given the recent bradyseismic dynamics of the Campi Flegrei volcanic area, which caused high rates of ground uplift followed by intense seismicity, it is interesting to highlight some basic variations in the apparent surface temperatures and radiative heat fluxes extracted from the TIR images acquired by the TIRNet stations as compared to the seismic activity in the last six years at Campi Flegrei.

4.1. De-Seasoned Surface Maximum Temperature Trends (TmaxSTL)

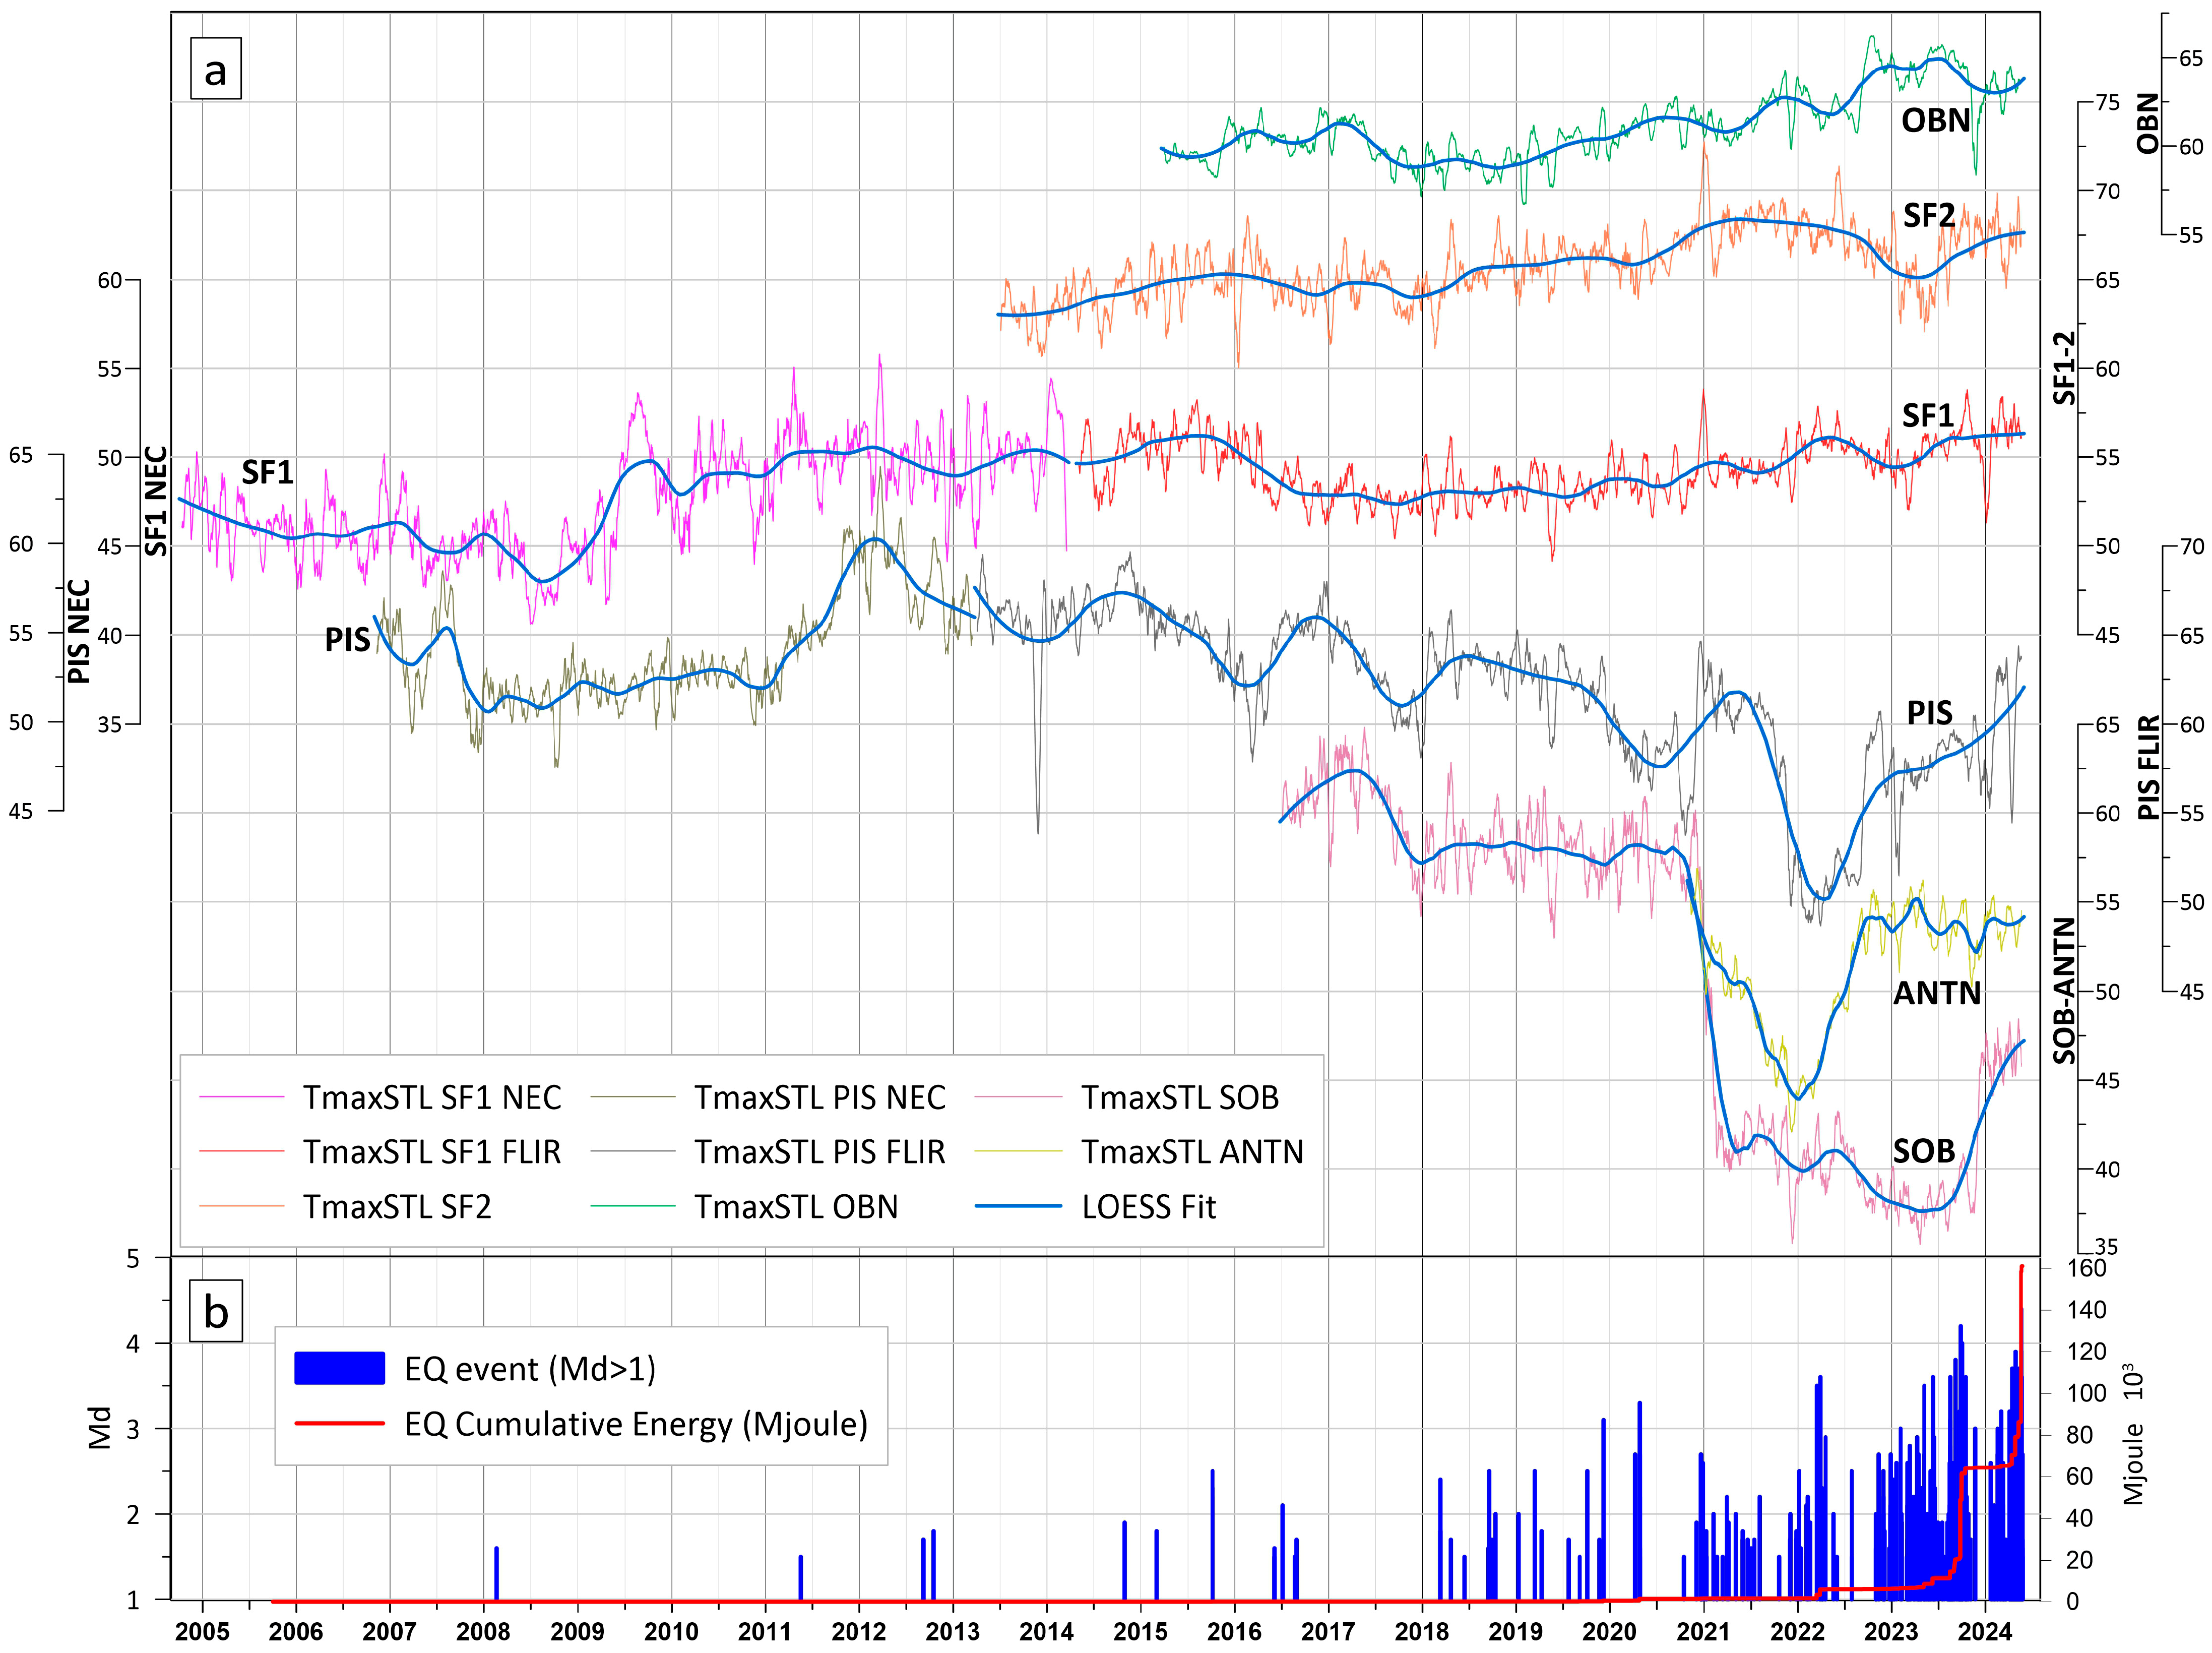
Figure 8 shows the temperature plots from all the TIRNet stations during the period October 2004–May 2024, along with seismic events whose epicenters were restricted to the area shown in Figure 1. Different colored lines (defined in the legend) represent smoothed values (running average, window = 21 days) of the TmaxSTL TS from the different TIRNet stations, and blue lines are the related LOESS trends [83]. To better show the different time series in a single graph, the plots are shifted, and the related scales of temperatures are visible on both sides of the graph. The temperature (Y-axis) scale factor is the same for all the plots. Figure 8b shows duration magnitudes (Md) and released cumulative energy (red line) related to the earthquakes whose epicenters were localized in the area shown in Figure 1 and whose Mds were higher than 1, as registered at the Campi Flegrei STH station (installed at Pisciarelli area—Campi Flegrei INGV-Osservatorio Vesuviano seismic network) [52,66].
A first basic observation is the dissimilar TmaxSTL trends from the different TIRNet stations in the period 2004–2016 (Figure 8a). During this period, the temperature trends show no common changes or variations. After year 2016, the temperature trends seem to gather into two groups showing common behavior: a first group (G1) that includes the SF1, SF2, and OBN stations and a second group (G2) that includes the PIS, ANTN, and SOB stations. The G1 group is limited to the Solfatara crater and its southern slope, while the G2 group is closely confined in the eastern area of the Solfatara crater and includes the Pisciarelli and Antiniana areas. It is interesting to note that since December 2012, the Civil Protection alert level of Campi Flegrei has changed from Green to Yellow, mainly due to changes in monitored geochemical parameters, and, starting from that year, the seismic activity has gradually increased.
Focusing on the LOESS long-term temperature trend variations at the G1 stations in the period 2016–2021 (Figure 8a, blue lines), a progressive increase in the values is clearly detectable, particularly in the plots of the OBN and SF2 stations. Conversely, during the same period, the LOESS long-term trends at the G2 stations show a significant decrease.
An evident change in the temperature trends occurred after strong seismic activity in the spring of 2022. After this period, the SF1 and SF2 stations in the G1 group show a decrease in temperature values until the beginning of 2023, whereas the PIS and ANTN stations in the G2 group exhibit a strong increase in temperature values. After the end of 2022, the seismicity became more intense and both the number and the magnitudes of the earthquakes gradually increased, culminating in a seismic crisis in the second half of 2023. During this period, all the TIRNet stations showed an increase in the TmaxSTL values, except for the ANTN and OBN stations, which maintained stable trends. In November 2023, the seismicity declined drastically, and the TmaxSTL values decreased for almost all stations, except for SF2, which continued to increase. Renewal of the seismic activity in January and February 2024 produced a new increase in the TmaxSTL values at all the TIRNet stations.
It is also interesting to point out sudden variations in the temperature values at almost all the TIRNet stations during the periods of very intense seismicity, with the sudden positive peaks in the TmaxSTL temperature values coinciding with higher magnitude earthquakes.

4.2. Radiative Heat Flux Trends (HFlux)

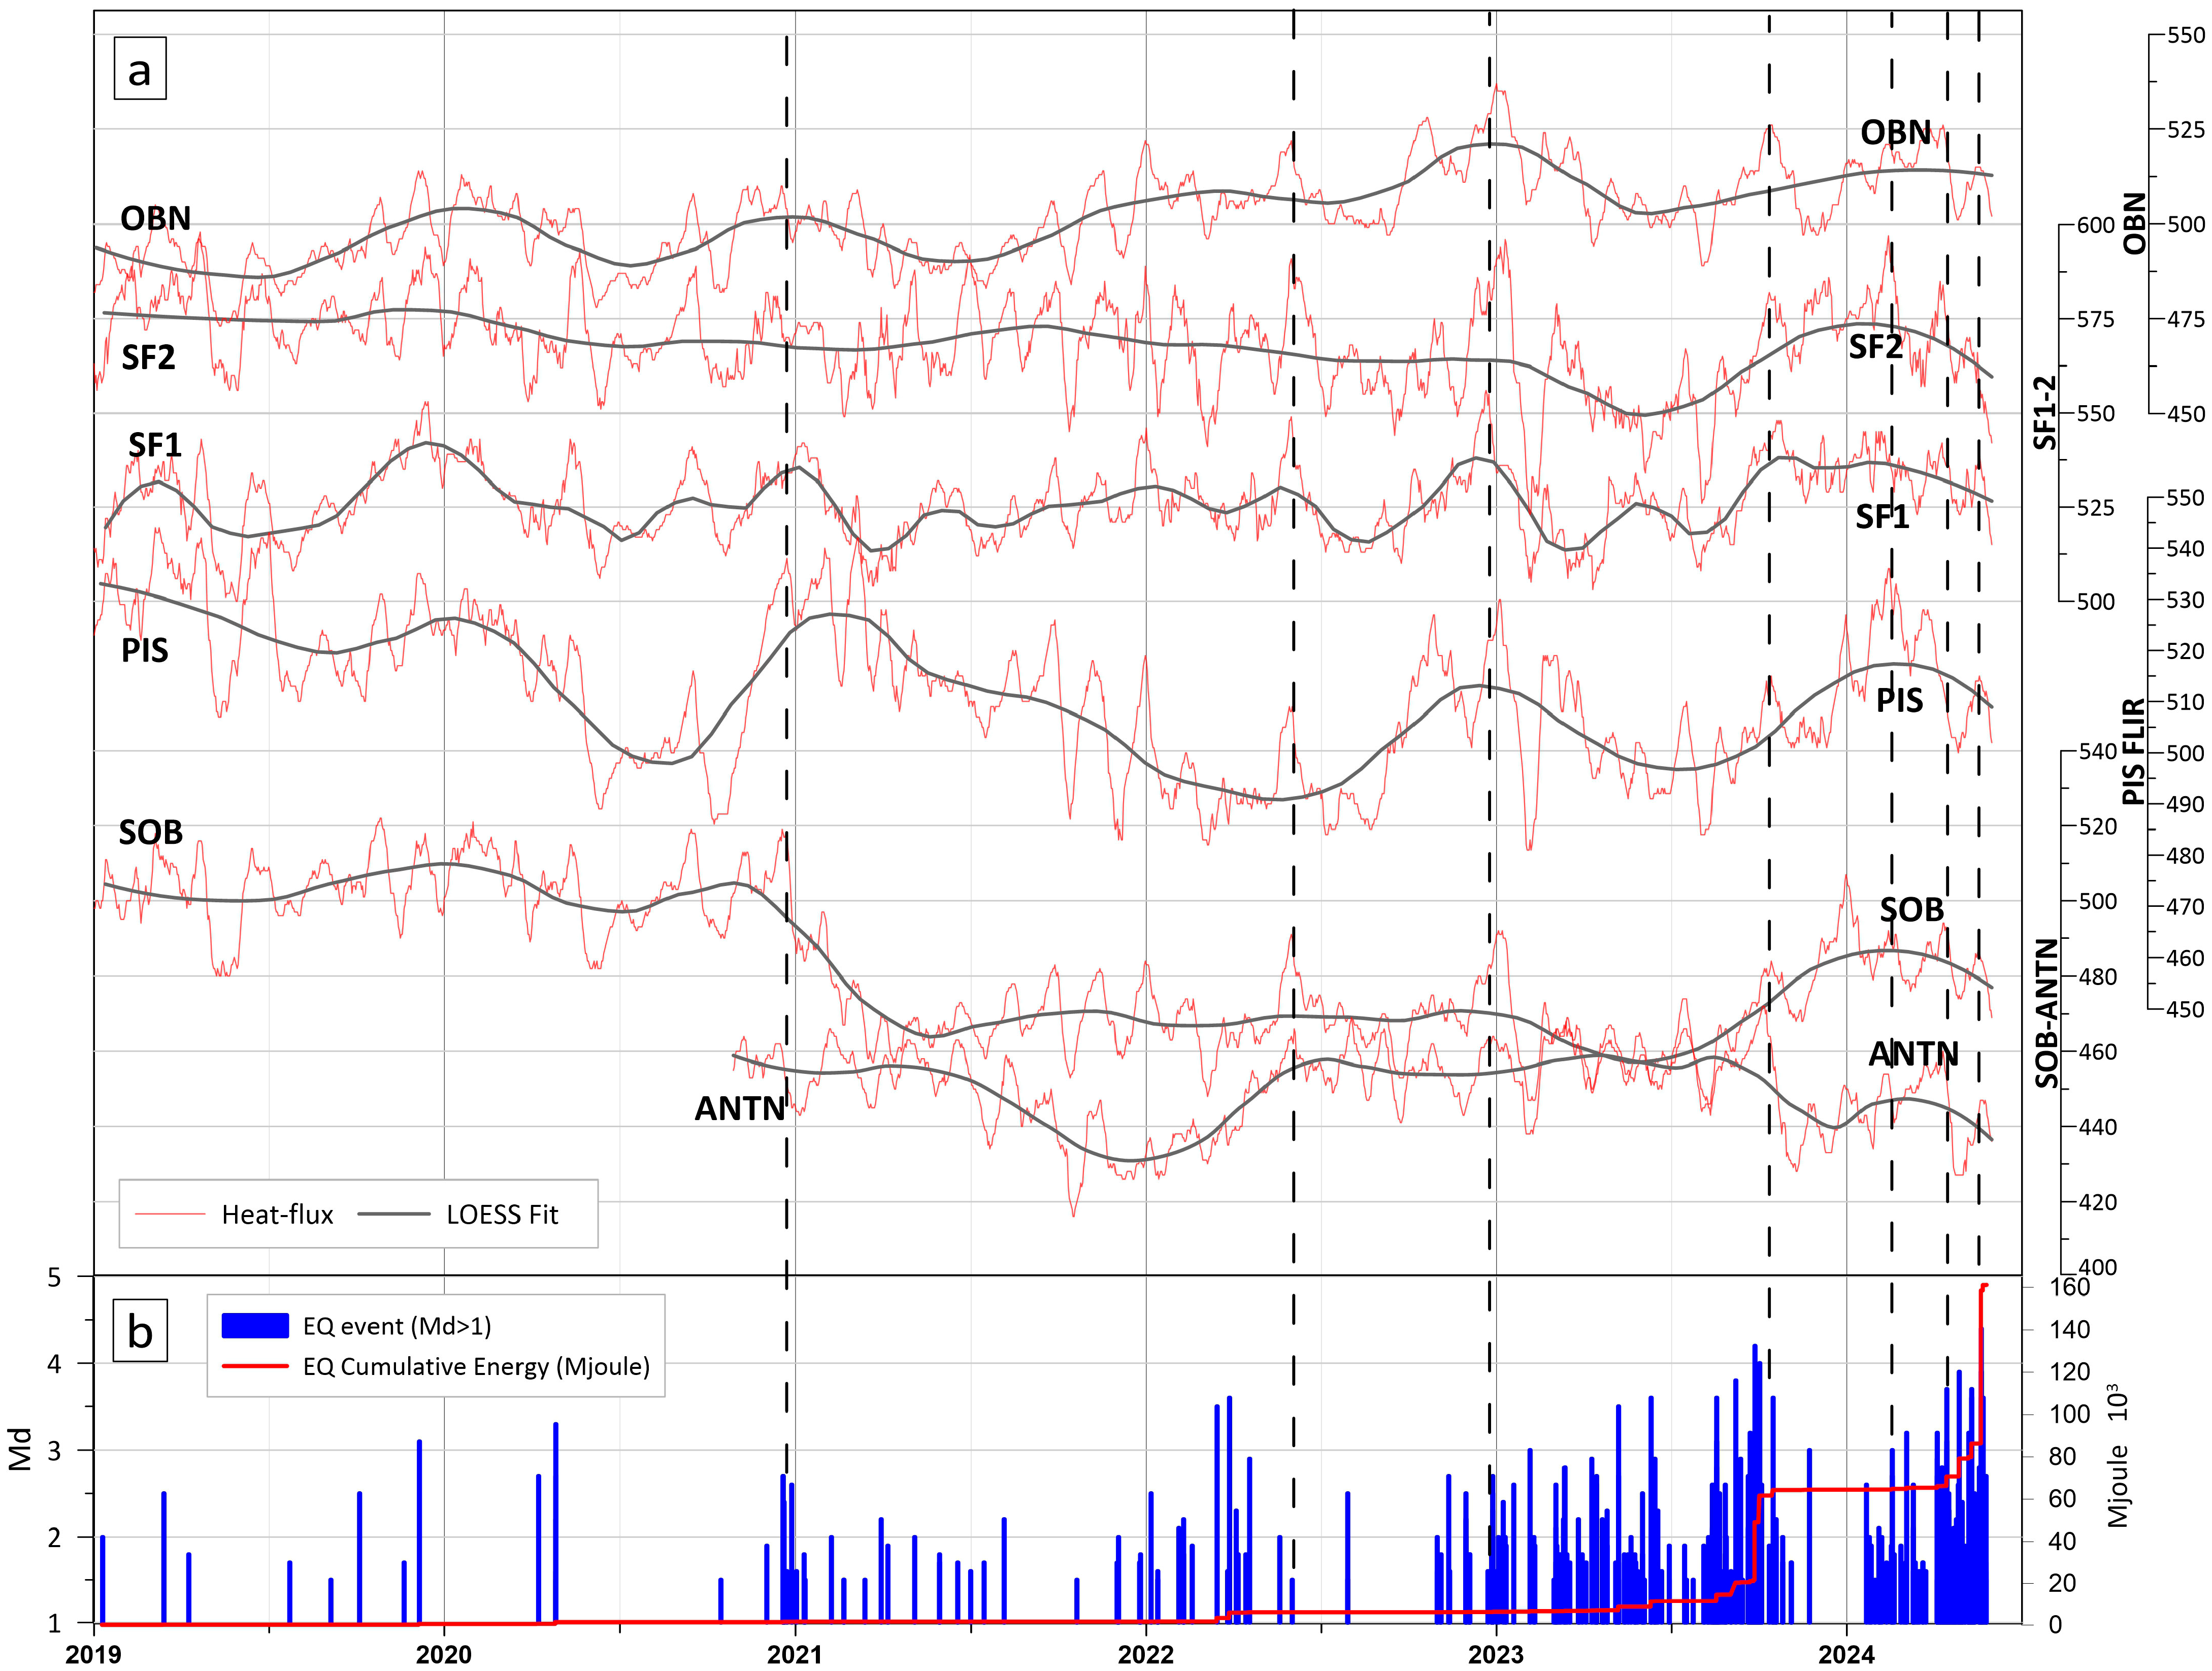
Radiative heat flux plots from all the TIRNet stations for the period January 2019–May 2024 and the seismic events that occurred in the study area (Figure 1) during the same period are reported in Figure 9a,b, respectively. In Figure 9a, red lines are the radiative heat flux plots extracted from the RoAs (Figure 4), and dark grey lines are the related LOESS trends [83]. Figure 9b shows the duration magnitudes (Md) and the released cumulative energy (red line) related to the earthquakes whose epicenters were localized in the area shown in Figure 1 and whose Mds were higher than 1 and registered at the Campi Flegrei STH TIRNet station (installed at the Pisciarelli area—Campi Flegrei) [52,66].
The period January 2019–May 2024 was chosen for the plots shown in Figure 9 due to the increase in seismicity that occurred after 2019 and the changes in the trends in heat flux values corresponding with the moments of intense seismicity. In the figure, the first significant positive heat flux trend variations are observed at the end of 2020 and in 2022. In 2023, the main peaks in the heat flux values correspond with the higher magnitude events. Interestingly, in the same year, the G2 stations’ plots show similar variations, and in some cases, they almost perfectly overlap. The G1 stations’ heat flux plots show several common peaks. Generally, all the TIRNet stations showed increasing heat flux trends after the strong seismicity from August 2023 to February 2024, except for the ANTN station, whose values began to decrease in October 2023.

5. Conclusions

In this work, time series of the maximum de-seasoned surface temperatures and the heat fluxes at diffuse degassing areas of the Campi Flegrei caldera, achieved by processing the thermal infrared raw data from the TIRNet stations, are presented both as plots and as Supplementary Materials. The reported processing methodologies have been used to transform the TIR raw data into more-understandable data forms suitable for comparison to other geophysical parameters. These data are representative of the evolution of the thermal field in the studied areas from 2004 to 2024 and are published monthly in surveillance bulletins of INGV-Osservatorio Vesuviano, as requested by the Civil Protection Department.
The main purpose of this paper is to present the TIRNet data processed using the reliable methodologies which make them suitable for further investigations; however, simple evidence is also found of complex connections between the TIR surface temperatures and the seismicity in the studied areas. The authors deemed it interesting to report a straightforward comparison of the main variations evidenced by the processed TIRNet data and the seismic activity at Campi Flegrei, as it can help to characterize current changes in the state of the volcanic system.
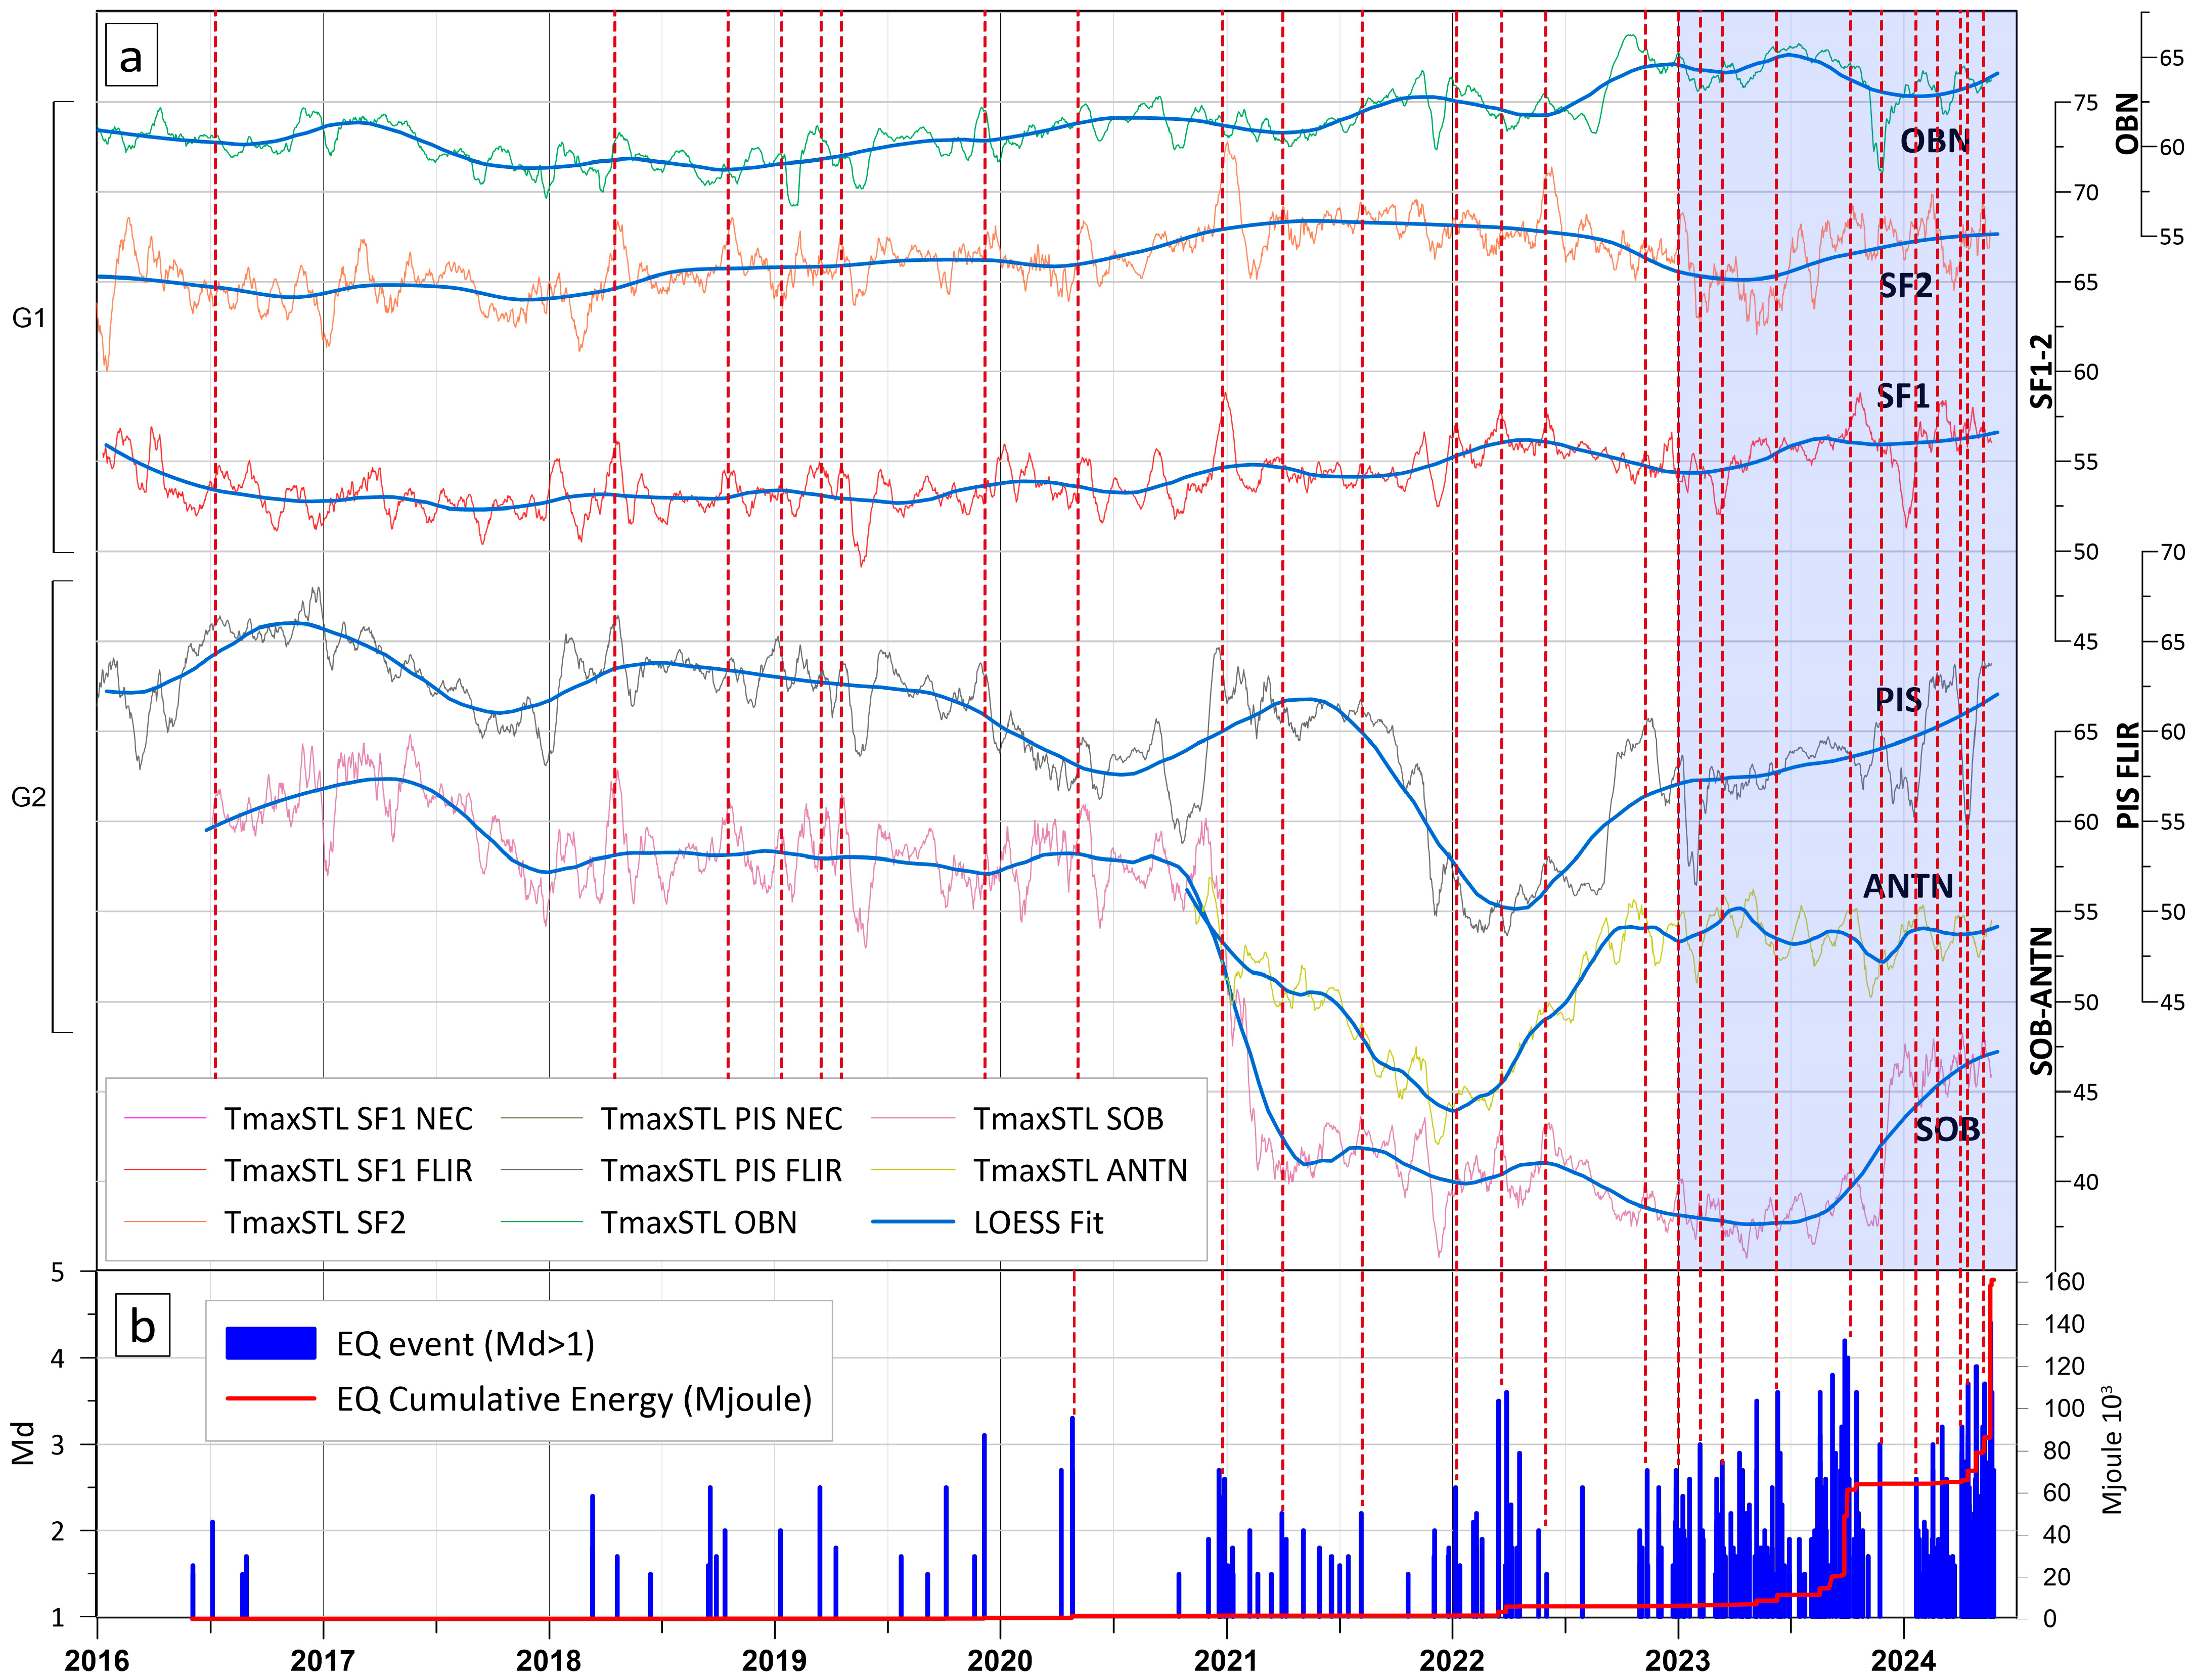
First, it is important to mention the common variations in the TIRNet temperatures and heat flux trends from almost all six TIRNet stations corresponding to the increase in seismic activity at Campi Flegrei. During periods characterized by modest seismicity, no remarkable evidence of common temperature variation is shown at the different TIRNet stations (Figure 8 and Figure 9). Conversely, in the period 2016–2024, evidence of common temperature trends among groups of TIRNet stations (Figure 9 and Figure 10) suggests that the intensification of seismicity is closely related to changes affecting the hydrothermal system at a larger scale. This hypothesis is also supported by the sudden changes in the temperature trends at almost all the TIRNet stations that occurred after several seismic events and swarms from 2018 to 2024, as evidenced by the dotted red lines in Figure 10. In most cases, these sudden changes are presented as either positive peaks or negative peaks. The increase in the occurrence of these temperature peaks is well correlated to the increase in seismicity from the end of 2023 to May 2024 (Figure 10, light blue field), concomitant with the common increase in the temperature values at almost all the TIRNet stations.
The dissimilar behavior of the TmaxSTL trends (Figure 10) of the two groups of the TIRNet stations, G1 and G2, in the period 2020–2022 suggests different local site responses to seismicity. Nevertheless, starting from 2023, the TmaxSTL values registered by almost all the TIRNet stations showed a general increase, evidencing a common reaction to the increased seismicity occurring in all the studied areas. Considering this, a quantitative analysis of the variations in the TmaxSTL trends at all the TIRNet stations during periods with different seismic activity is a challenging study to be undertaken in the future.
The heat flux plots in Figure 6 and Figure 9 substantially confirm the main variations observed in the TmaxSTL plots. The simultaneous variations in the heat flux trends and the peak TmaxSTL values at several different TIRNet stations corresponding with the moments of intense seismicity, such as in 2023 (Figure 10), provide significant evidence of a deep relationship between the hydrothermal system and the seismic activity on both large and small scales. This evidence is also supported by the very similar temperature trends and almost perfect overlap of heat flux plots for some TIRNet stations (group G2) during the period 2023–2024.
Another interesting point to highlight is the difference between the temperature trends registered at the ANTN, OBN, and PIS stations (group G2) compared to the SF1, SF2, and OBN stations (group G1) during 2021, which was characterized by a significant increase in seismicity. Despite the proximity of these two groups of stations (Figure 1), in that year the temperature trends at the G2 stations suffered a sudden decrease of several degrees while those at the G1 stations progressively increased. What made the surface temperature changes in these areas differ in relation to the increase in seismicity? Was it due to a change in structural control over fluids circulation following the increased seismicity, or did it depend on more complex causes? Equally interesting to investigate is the sudden significant increase in the temperatures at the PIS and ANTN stations that occurred at the beginning of 2022, while the SOB station temperatures continued to show a slight decrease.
In general, this evidence of an increase in the efficiency of the heat transfer between the magmatic system and the surface observed in correlation with the increase in seismic activity suggests a need to deepen our understanding of these dynamics. It is also important to determine whether this was merely due to causal interactions between different phenomena, or whether the structural, geochemical, and lithological settings of these areas influenced the variations in surface temperature trends.
These open points suggest the need for a multidisciplinary investigation to improve knowledge of the volcanic processes affecting the Campi Flegrei caldera and, in general, of processes acting in other similar volcanic areas in order to develop physical models which can be used for volcanic surveillance purposes.

Supplementary Materials

The following supporting information can be downloaded at: https://www.mdpi.com/article/10.3390/rs16173352/s1: The Excel file containing Tmax and heat flux data used in the plots of Figure 6 and Figure 7, under a Creative Commons Attribution 4.0 International License.

Author Contributions

Conceptualization, F.S.; methodology, F.S. and G.V.; software, F.S.; formal analysis, F.S. and G.V.; data curation, F.S. and G.V.; writing—original draft preparation, F.S.; writing—review and editing, F.S. All authors have read and agreed to the published version of the manuscript.

Funding

The TIRNet monitoring network was partially funded by the 2000–2006 National Operating Program (NOP); by the SISTEMA project, which has been developed in the framework of the Campania Regional Operating Program (ROP) FESR 2007–2013, ASSE I-O.O. 1.6, CUP: D65I15000010002; and by the PRESERVE project, Regione Campania POR FESR 2014/2020-SO 5.3-Action 5.3.1-CUP: D65J20000030002.

Data Availability Statement

Raw data from the TIRNet stations are available at: https://www.ov.ingv.it/ov/thermolab/index_eng.html (accessed on 1 June 2024) under a Creative Commons Attribution 4.0 International License.

Conflicts of Interest

The authors declare no conflicts of interest.

Abbreviations

ANTNAbbreviation for the Antiniana thermal infrared station targeting the via Antiniana area (Figure 1)
ASIRASoftware developed by the TIRLab of INGV-Osservatorio Vesuviano (Automated System of InfraRed Analysis). ASIRA processes TIR images and generates continuous apparent temperature and heat flux time series [79].
BKGBackground
FoVField of View of optical lenses. Defines the viewable area that can be framed by a lens system.
HFluxHeat flux
INGVNational Institute of Geophysics and Volcanology (Italy)
LOESSLocally Estimated Scatterplot Smoothing [83]
LOWTRANLow-resolution propagation model and computer code for predicting atmospheric transmittance and background radiance, used by FLIR TIR cameras for atmospheric correction of infrared images [78]
LTEData transmission standard for wireless broadband communication for mobile devices and data terminals
OBNAbbreviation for the Olibano thermal infrared station targeting the southern slope of Mt. Olibano (Figure 1)
PISAbbreviation for the Pisciarelli thermal infrared station targeting the western slope of the Pisciarelli hot mud pool (Figure 1)
RoARegion of Anomaly. Delimited area of the TIR images that is mainly composed of pixels characterized by thermal anomaly.
SF1Abbreviation for the Solfatara 1 thermal infrared station targeting the northeastern side of the Solfatara crater (Figure 1, Bocca Grande and Bocca Nuova fumaroles)
SF2Abbreviation for the Solfatara 2 thermal infrared station targeting the northern inner slope of the Solfatara crater (Figure 1, cryptodome area)
SIFT FlowSIFT flow algorithm matches pixel-to-pixel correspondences between TIR frames and a reference frame, finding the scene correspondence despite differences in spatial organization of the images [82]. It is used to align the pixels of the TIR image time series.
SOBAbbreviation for the thermal infrared station targeting the eastern rim of Solfatara crater (Figure 1)
STH stationSeismic station of the permanent seismic monitoring network of INGV-Osservatorio Vesuviano, located near the area of Pisciarelli
STLAlgorithm for Seasonal and Trend decomposition using Loess. STL decomposes TmaxRAW TS into three different time series (Figure 2b): Trend TS, representative of the smoothed general tendency of temperature values to move in a certain direction; Seasonality TS, the seasonal recurring temperature pattern due to exogenous factors; and Remainder TS, the remnant residual values after seasonality and trend removal. [83]
STLp1Procedure of data analysis based on the STL algorithm which removes the seasonal component from TmaxRAW TS extracted from TIR frames in the time series acquired by TIRNet stations
STLp2Procedure of data analysis based on the STL algorithm which removes the seasonal component from all temperature values of all the TIR frames in the time series acquired by TIRNet stations
TIRThermal Infrared
TIRLabThermal Infrared Laboratory (https://www.ov.ingv.it/ov/thermolab/index_eng.html, accessed on 1 June 2024) of INGV-Osservatorio Vesuviano
TIRNetPermanent Thermal Infrared Monitoring Network of INGV-Osservatorio Vesuviano at Campi Flegrei. It is composed of six stations: ANTN, OBN, PIS, SF1, SF2, SOB.
TmaxRAWMaximum temperature value extracted from a TIR frame without any correction
TmaxSTLMaximum temperature value extracted from a TIR frame with seasonal component removed using the STL algorithm
TSTime series
UTMMap projection system (Universal Transverse Mercator) used to assign coordinates to points on the surface of the Earth

References

  1. Stefano Branca, A.C.; Cioni, R.; Conte, A.M.; Conticelli, S.; De Astis, G.; de Vita, S.; De Rosa, R.; Di Vito, M.A.; Donato, P.; Forni, F.; et al. The italian quaternary volcanism. Alp. Mediterr. Quat. 2023, 36, 221–284. [Google Scholar]
  2. Peccerillo, A. Plio-Quaternary Volcanism in Italy; Springer: Berlin/Heidelberg, Germany, 2005; Volume 365. [Google Scholar]
  3. Acocella, V. Activating and reactivating pairs of nested collapses during calderaforming eruptions: Campi Flegrei (Italy). Geophys. Res. Lett. 2008, 35, L17304. [Google Scholar] [CrossRef]
  4. Di Vito, M.A.; Acocella, V.; Aiello, G.; Barra, D.; Battaglia, M.; Carandente, A.; Del Gaudio, C.; de Vita, S.; Ricciardi, G.P.; Ricco, C.; et al. Magma transfer at Campi Flegrei caldera (Italy) before the 1538 AD eruption. Sci. Rep. 2016, 6, 32245. [Google Scholar] [CrossRef] [PubMed]
  5. Di Vito, M.A.; Isaia, R.; Orsi, G.; Southon, J.; de Vita, S.; D’Antonio, M.; Pappalardo, L.; Piochi, M. Volcanism and deformation since 12,000 years at the Campi Flegrei caldera (Italy). J. Volcanol. Geotherm. Res. 1999, 91, 221–246. [Google Scholar] [CrossRef]
  6. Isaia, R.; Marianelli, P.; Sbrana, R. Caldera unrest prior to intense volcanism in Campi Flegrei (Italy) at 4.0 ka B.P.: Implications for caldera dynamics and future eruptive scenarios. Geophys. Res. Lett. 2009, 36, L21303. [Google Scholar] [CrossRef]
  7. Orsi, G. Volcanic and Deformation History of the Campi Flegrei Volcanic Field, Italy. In Campi Flegrei. Active Volcanoes of the World; Orsi, G., D’Antonio, M., Civetta, L., Eds.; Springer: Berlin/Heidelberg, Germany, 2022. [Google Scholar] [CrossRef]
  8. Orsi, G.; Di Vito, M.A.; Isaia, R. Volcanic hazard assessment at the restless Campi Flegrei caldera. Bull. Volcanol. 2004, 66, 514–530. [Google Scholar] [CrossRef]
  9. Smith, V.C.; Isaia, R.; Pearce, N.J.G. Tephrostratigraphy and glass compositions of post-15 kyr Campi Flegrei eruptions: Implications for eruption history and chronostratigraphic markers. Quat. Sci. Rev. 2011, 30, 3638–3660. [Google Scholar] [CrossRef]
  10. Torrente, M.M.; Milia, A.; Bellucci, F.; Rolandi, G. Extensional tectonics in the Campania Volcanic Zone (eastern Tyrrhenian Sea, Italy): New insights into the relationship between faulting and ignimbrite eruptions. Ital. J. Geosci. 2010, 129, 297–315. [Google Scholar]
  11. Trasatti, E.; Magri, C.; Acocella, V.; Del Gaudio, C.; Ricco, C.; Di Vito, M.A. Magma transfer at Campi Flegrei caldera (Italy) after the 1538 AD eruption. Geophys. Res. Lett. 2023, 50, e2022GL102437. [Google Scholar] [CrossRef]
  12. Vineberg, S.O.; Isaia, R.; Albert, P.G.; Brown, R.J.; Smith, V.C. Insights into the explosive eruption history of the Campanian volcanoes prior to the Campanian Ignimbrite eruption. J. Volcanol. Geotherm. Res. 2023, 443, 107915. [Google Scholar] [CrossRef]
  13. Del Gaudio, C.; Aquino, I.; Ricciardi, G.P.; Ricco, C.; Scandone, R. Unrest episodes at Campi Flegrei: A reconstruction of vertical ground movements during 1905–2009. J. Volcanol. Geotherm. Res. 2010, 195, 48–56. [Google Scholar] [CrossRef]
  14. De Martino, P.; Dolce, M.; Brandi, G.; Scarpato, G.; Tammaro, U. The ground deformation history of the neapolitan volcanic area (Campi Flegrei caldera, Somma–Vesuvius volcano, and Ischia island) from 20 years of continuous gps observations (2000–2019). Remote Sens. 2021, 13, 2725. [Google Scholar] [CrossRef]
  15. De Martino, P.; Guardato, S.; Donnarumma, G.P.; Dolce, M.; Trombetti, T.; Chierici, F.; Macedonio, G.; Beranzoli, L.; Iannaccone, G. Four Years of Continuous Seafloor Displacement Measurements in the Campi Flegrei Caldera. Front. Earth Sci. 2020, 8, 615178. [Google Scholar] [CrossRef]
  16. De Martino, P.; Tammaro, U.; Obrizzo, F. GPS time series at Campi Flegrei caldera (2000–2013). Ann. Geophys. 2014, 57, 213. [Google Scholar] [CrossRef]
  17. Falanga, M.; Aquino, I.; De Lauro, E.; Petrosino, S.; Ricco, C. New insights on ground deformation at Campi Flegrei caldera inferred from kinematics and dynamics investigation of borehole tilt. Earth Space Sci. 2023, 10, e2022EA002702. [Google Scholar] [CrossRef]
  18. Isaia, R.; Vitale, S.; Marturano, A.; Aiello, G.; Barra, D.; Ciarcia, S.; Iannuzzi, E.; Tramparulo, F.D.A. High-resolution geological investigations to reconstruct the long-term ground movements in the last 15 kyr at Campi Flegrei caldera (southern Italy). J. Volcanol. Geotherm. Res. 2019, 385, 143–158. [Google Scholar] [CrossRef]
  19. Mattei, G.; Caporizzo, C.; Cinque, A.; Pappone, G.; Sorrentino, A.; Troisi, S.; Aucelli, P.P.C. Historical vertical ground movements in the Campi Flegrei volcano: A new transect across the caldera rim. Geomorphology 2024, 446, 108997. [Google Scholar] [CrossRef]
  20. Perelli, F.L.; Di Maio, L.S.; De Gregorio, D.; Magliulo, G.; De Martino, P.; Zuccaro, G. Impact assessment caused by bradyseism phenomena in the Campi Flegrei area. Front. Built Environ. 2023, 9, 1129175. [Google Scholar] [CrossRef]
  21. Bellucci Sessa, E.; Castellano, M.; Ricciolino, P. GIS applications in volcano monitoring: The study of seismic swarms at the Campi Flegrei volcanic complex, Italy. Adv. Geosci. 2021, 52, 131–144. [Google Scholar] [CrossRef]
  22. Del Pezzo, E. Space distribution of the seismic source energy between 1-1-2000 and 3-7-2022 at Campi Flegrei caldera. Phys. Earth Planet. Inter. 2023, 336, 106986. [Google Scholar] [CrossRef]
  23. Ricciolino, P.; Lo Bascio, D. Cataloghi Sismici dei Vulcani Campani. Stazione STH Campi Flegrei dal 2000 al 2021 (CatSTH_2000_2021) (1.0) [Data set] 2021. Istituto Nazionale di Geofisica e Vulcanologia (INGV). Available online: https://www.ov.ingv.it/index.php/monitoraggio-sismico-e-vulcanico-2/banche-dati?id=217 (accessed on 1 June 2024).
  24. Giudicepietro, F.; Chiodini, G.; Avino, R.; Brandi, G.; Caliro, S.; De Cesare, W.; Galluzzo, D.; Esposito, A.; La Rocca, A.; Lo Bascio, D.; et al. Tracking episodes of seismicity and gas transport in Campi Flegrei caldera through seismic, geophysical, and geochemical measurements. Seismol. Res. Lett. 2021, 92, 965–975. [Google Scholar] [CrossRef]
  25. Tramelli, A.; Giudicepietro, F.; Ricciolino, P.; Chiodini, G. The seismicity of Campi Flegrei in the contest of an evolving long term unrest. Sci. Rep. 2022, 12, 2900. [Google Scholar] [CrossRef] [PubMed]
  26. Tramelli, A.; Godano, C.; Ricciolino, P.; Giudicepietro, F.; Caliro, S.; Orazi, M.; De Martino, P.; Chiodini, G. Statistics of seismicity to investigate the Campi Flegrei caldera unrest. Sci. Rep. 2021, 11, 7211. [Google Scholar] [CrossRef]
  27. Caliro, S.; Chiodini, G.; Paonita, A. Geochemical evidences of magma dynamics at Campi Flegrei (Italy). Geochim. Cosmochim. Acta 2014, 132, 1–15. [Google Scholar] [CrossRef]
  28. Cardellini, C.; Chiodini, G.; Frondini, F.; Avino, R.; Bagnato, E.; Caliro, S.; Lelli, M.; Rosiello, A. Monitoring diffuse volcanic degassing during volcanic unrests: The case of Campi Flegrei (Italy). Sci. Rep. 2017, 7, 6757. [Google Scholar] [CrossRef]
  29. Chiodini, G.; Granieri, D.; Avino, R.; Caliro, S.; Costa, A.; Werner, C. Carbon dioxide diffuse degassing and estimation of heat release from volcanic and hydrothermal systems. J. Geophys. Res. Solid Earth 2005, 110, 1–17. [Google Scholar] [CrossRef]
  30. Petrillo, Z.; Tripaldi, S.; Mangiacapra, A.; Scippacercola, S.; Caliro, S.; Chiodini, G. Principal component analysis on twenty years (2000–2020) of geochemical and geophysical observations at Campi Flegrei active caldera. Sci. Rep. 2023, 13, 18445. [Google Scholar] [CrossRef]
  31. Siniscalchi, A.; Tripaldi, S.; Romano, G.; Chiodini, G.; Improta, L.; Petrillo, Z.; D’Auria, L.; Caliro, S.; Avino, R. Reservoir structure and hydraulic properties of the Campi Flegrei geothermal system inferred by audiomagnetotelluric, geochemical, and seismicity study. J. Geophys. Res. Solid Earth 2019, 124, 5336–5356. [Google Scholar] [CrossRef]
  32. Isaia, R.; Di Giuseppe, M.G.; Natale, J.; Tramparulo, F.D.; Troiano, A.; Vitale, S. Volcano-tectonic setting of the Pisciarelli Fumarole field, Campi Flegrei Caldera, Southern Italy: Insights into fluid circulation patterns and hazard scenarios. Tectonics 2021, 40, 2020TC006227. [Google Scholar] [CrossRef]
  33. Isaia, R.; Vitale, S.; Di Giuseppe, M.G.; Iannuzzi, E.; D’Assisi Tramparulo, F.; Troiano, A. Stratigraphy, structure, and volcano-tectonic evolution of Solfatara maar-diatreme (Campi Flegrei, Italy). Geol. Soc. Am. Bull. 2015, 127, 1485–1504. [Google Scholar] [CrossRef]
  34. Tamburello, G.; Caliro, S.; Chiodini, G.; De Martino, P.; Avino, R.; Minopoli, C.; Carandente, A.; Rouwet, D.; Aiuppa, A.; Costa, A.; et al. Escalating CO2 degassing at the Pisciarelli fumarolic system, and implications for the ongoing Campi Flegrei unrest. J. Volcanol. Geotherm. Res. 2019, 384, 151–157. [Google Scholar] [CrossRef]
  35. Troiano, A.; Isaia, R.; Di Giuseppe, M.G.; Tramparulo, F.D.A.; Vitale, S. Deep electrical resistivity tomography for a 3D picture of the most active sector of Campi Flegrei caldera. Sci. Rep. 2019, 9, 15124. [Google Scholar] [CrossRef]
  36. Troiano, A.; Isaia, R.; Tramparulo, F.D.A.; Di Giuseppe, M.G. The Pisciarelli main fumarole mechanisms reconstructed by electrical resistivity and induced polarization imaging. Sci. Rep. 2021, 11, 18639. [Google Scholar] [CrossRef] [PubMed]
  37. Alberico, I.; Petrosino, P.; Lirer, L. Volcanic hazard and risk assessment in a multi-source volcanic area: The example of Napoli city (Southern Italy). Nat. Hazards Earth Syst. Sci. 2011, 11, 1057–1070. [Google Scholar] [CrossRef]
  38. Bevilacqua, A.; Isaia, R.; Neri, A.; Vitale, S.; Aspinal, W.P.; Bisson, M.; Flandoli, F.; Baxter, P.J.; Bertagnini, A.; Ongaro, T.E.; et al. Quantifying volcanic hazard at Campi Flegrei caldera (Italy) with uncertainty assessment: I. Vent opening maps. J. Geophys. Res. Solid Earth 2015, 120, 2309–2329. [Google Scholar] [CrossRef]
  39. Carlino, S. Brief history of volcanic risk in the Neapolitan area (Campania, southern Italy): A critical review. Nat. Hazards Earth Syst. Sci. 2021, 21, 3097–3112. [Google Scholar] [CrossRef]
  40. Charlton, D.; Kilburn, C.; Edwards, S. Volcanic unrest scenarios and impact assessment at Campi Flegrei caldera, Southern Italy. J. Appl. Volcanol. 2020, 9, 1–26. [Google Scholar] [CrossRef]
  41. De Siena, L.; Chiodini, G.; Vilardo, G.; Del Pezzo, E.; Castellano, M.; Colombelli, S.; Tisato, N.; Ventura, G. Source and dynamics of a volcanic caldera unrest: Campi Flegrei, 1983–1984. Sci. Rep. 2017, 7, 8099. [Google Scholar] [CrossRef]
  42. De Vivo, B.; Rolandi, G. Volcanological risk associated with Vesuvius and Campi Flegrei. In Vesuvius, Campi Flegrei, and Campanian Volcanism; Elsevier: Amsterdam, The Netherlands, 2020; pp. 471–493. [Google Scholar]
  43. Kilburn, C.R.; Carlino, S.; Danesi, S.; Pino, N.A. Potential for rupture before eruption at Campi Flegrei caldera, Southern Italy. Commun. Earth Environ. 2023, 4, 190. [Google Scholar] [CrossRef]
  44. Totaro, F.; Alberico, I.; Di Martire, D.; Nunziata, C.; Petrosino, P. The key role of hazard indices and hotspot in disaster risk management: The case study of Napoli and Pozzuoli municipalities (Southern Italy). J. Maps 2020, 16, 68–78. [Google Scholar] [CrossRef]
  45. Bollettini Settimanali di Monitoraggio Vulcanico dei Campi Flegrei—Osservatorio Vesuviano INGV. Available online: https://www.ov.ingv.it/index.php/bollettini/bollettini-di-monitoraggio/bollettini/settimanali-dei-campi-flegrei (accessed on 1 June 2024).
  46. Buono, G.; Paonita, A.; Pappalardo, L.; Caliro, S.; Tramelli, A.; Chiodini, G. New insights into the recent magma dynamics under Campi Flegrei caldera (Italy) from petrological and geochemical evidence. J. Geophys. Res. Solid Earth 2022, 127, e2021JB023773. [Google Scholar] [CrossRef]
  47. Chiodini, G.; Caliro, S.; Avino, R.; Bini, G.; Giudicepietro, F.; De Cesare, W.; Ricciolino, P.; Aiuppa, A.; Cardellini, C.; Petrillo, Z.; et al. Hydrothermal pressure-temperature control on CO2 emissions and seismicity at Campi Flegrei (Italy). J. Volcanol. Geotherm. Res. 2021, 414, 107245. [Google Scholar] [CrossRef]
  48. Danesi, S.; Pino, N.A.; Carlino, S.; Kilburn, C.R. Evolution in unrest processes at Campi Flegrei caldera as inferred from local seismicity. Earth Planet. Sci. Lett. 2024, 626, 118530. [Google Scholar] [CrossRef]
  49. Nespoli, M.; Tramelli, A.; Belardinelli, M.E.; Bonafede, M. The effects of hot and pressurized fluid flow across a brittle layer on the recent seismicity and deformation in the Campi Flegrei caldera (Italy). J. Volcanol. Geotherm. Res. 2023, 443, 107930. [Google Scholar] [CrossRef]
  50. Ball, M.; Pinkerton, H. Factors affecting the accuracy of thermal imaging cameras in volcanology. J. Geophys. Res. 2006, 111, B11203. [Google Scholar] [CrossRef]
  51. Blackett, M. An overview of infrared remote sensing of volcanic activity. J. Imaging 2017, 3, 13. [Google Scholar] [CrossRef]
  52. Bombrun, M.; Jessop, D.; Harris, A.; Barra, B. An algorithm for the detection and characterisation of volcanic plumes using thermal camera imagery. J. Volcanol. Geotherm. Res. 2018, 352, 26–37. [Google Scholar] [CrossRef]
  53. Calvari, S.; Lodato, L.; Steffke, A.; Cristaldi, A.; Harris, A.J.L.; Spampinato, L.; Boschi, E. The 2007 Stromboli eruption: Event chronology and effusion rates using thermal infrared data. J. Geophys. Res. 2010, 115, B04201. [Google Scholar] [CrossRef]
  54. Cerminara, M.; Esposti Ongaro, T.; Valade, S.; Harris, A.J.L. Volcanic plume vent conditions retrieved from infrared images: A forward and inverse modeling approach. J. Volcanol. Geotherm. Res. 2015, 300, 129–147. [Google Scholar] [CrossRef]
  55. Cirillo, F.; Avvisati, G.; Belviso, P.; Marotta, E.; Peluso, R.; Pescione, R.A. Clustering of Handheld Thermal Camera Images in Volcanic Areas and Temperature Statistics. Remote Sens. 2022, 14, 3789. [Google Scholar] [CrossRef]
  56. Della Seta, M.; Esposito, C.; Fiorucci, M.; Marmoni, G.M.; Martino, S.; Sottili, G.; Belviso, P.; Carandente, A.; de Vita, S.; Marotta, E.; et al. Thermal Monitoring to Infer Possible Interactions between Shallow Hydrothermal System and Slope-Scale Gravitational Deformation of Mt Epomeo (Ischia Island, Italy); Geological Society: London, UK, 2024; Special Publications 519.1: SP519-2020-131. [Google Scholar]
  57. Granieri, D.; Mazzarini, F.; Cerminara, M.; Calusi, B.; Scozzari, A.; Menichini, M.; Lelli, M. Shallow portion of an active geothermal system revealed by multidisciplinary studies: The case of Le Biancane (Larderello, Italy). Geothermics 2023, 108, 102616. [Google Scholar] [CrossRef]
  58. Harris, A. Thermal Remote Sensing of Active Volcanoes: A User’s Manual; Cambridge University Press: Cambridge, UK, 2013; ISBN 052185945X. [Google Scholar]
  59. Irmisch, P.; Ernst, I.; Baumbach, D.; Linkiewicz, M.M.; Unnithan, V.; Sohl, F.; Wohlfeil, J.; Grießbach, D. A Hand-Held Sensor System for Exploration and Thermal Mapping of Volcanic Fumarole Fields. In Geometry and Vision, Proceedings of the First International Symposium, ISGV 2021, Auckland, New Zealand, 28–29 January 2021; Revised Selected Papers 1; Springer International Publishing: Berlin/Heidelberg, Germany, 2021; pp. 68–84. [Google Scholar]
  60. Lewis, A.; Hilley, G.E.; Lewicki, J.L. Integrated thermal infrared imaging and structure-from-motion photogrammetry to map apparent temperature and radiant hydrothermal heat flux at Mammoth Mountain, CA, USA. J. Volcanol. Geotherm. Res. 2015, 303, 16–24. [Google Scholar] [CrossRef]
  61. Platt, U.; Bobrowski, N.; Butz, A. Ground-Based Remote Sensing and Imaging of Volcanic Gases and Quantitative Determination of Multi-Species Emission Fluxes. Geosciences 2018, 8, 44. [Google Scholar] [CrossRef]
  62. Ramsey, M.S.; Harris, A.J. Volcanology 2020: How will thermal remote sensing of volcanic surface activity evolve over the next decade? J. Volcanol. Geotherm. Res. 2013, 249, 217–233. [Google Scholar] [CrossRef]
  63. Spampinato, L.; Calvari, S.; Oppenheimer, C.; Boschi, E. Volcano surveillance using infrared cameras. Earth Sci. Rev. 2011, 106, 63–91. [Google Scholar] [CrossRef]
  64. Stevenson, J.A.; Varley, N. Fumarole monitoring with a handheld infrared camera: Volcan de Colima, Mexico, 2006–2007. J. Volcanol. Geotherm. Res. 2008, 177, 911–924. [Google Scholar] [CrossRef]
  65. Ulusoy, I.; Diker, C.; Şen, E.; Çubukçu, H.E.; Gümüş, E. Multisource and temporal thermal infrared remote sensing of Hasandağ Stratovolcano (Central Anatolia, Turkey). J. Volcanol. Geotherm. Res. 2022, 428, 107579. [Google Scholar] [CrossRef]
  66. Vaughan, R.G.; Hungerford, J.D.; Keller, W. A newly emerging thermal area in Yellowstone. Front. Earth Sci. 2020, 8, 204. [Google Scholar] [CrossRef]
  67. Zhan, Y.; Le Mével, H.; Roman, D.C.; Girona, T.; Gregg, P.M. Modeling deformation, seismicity, and thermal anomalies driven by degassing during the 2005-2006 pre-eruptive unrest of Augustine Volcano, Alaska. Earth Planet. Sci. Lett. 2022, 585, 117524. [Google Scholar] [CrossRef]
  68. Caputo, T.; Sessa, E.B.; Silvestri, M.; Buongiorno, M.F.; Musacchio, M.; Sansivero, F.; Vilardo, G. Surface temperature multiscale monitoring by thermal infrared satellite and ground images at Campi Flegrei volcanic area (Italy). Remote Sens. 2019, 11, 1007. [Google Scholar] [CrossRef]
  69. Caputo, T.; Cusano, P.; Petrosino, S.; Sansivero, F.; Vilardo, G. Spectral analysis of ground thermal image temperatures: What we are learning at Solfatara volcano (Italy). Adv. Geosci. 2020, 52, 55–65. [Google Scholar] [CrossRef]
  70. Coltelli, M.; d’Aranno, P.J.; De Bonis, R.; Guerrero Tello, J.F.; Marsella, M.; Nardinocchi, C.; Pecora, E.; Proietti, C.; Scifoni, S.; Scutti, M.; et al. The use of surveillance cameras for the rapid mapping of lava flows: An application to Mount Etna Volcano. Remote Sens. 2017, 9, 192. [Google Scholar] [CrossRef]
  71. Patrick, R.M.; Orr, T.; Antolik, L.; Lopaka, L.; Kamibayashi, K. Continuous monitoring of Hawaiian volcanoes with thermal cameras. J. Appl. Volcanol. 2014, 3, 1. [Google Scholar] [CrossRef]
  72. Sansivero, F.; Scarpato, G.; Vilardo, G. The automated infrared thermal imaging system for the continuous long-term monitoring of the surface temperature of the Vesuvius crater. Ann. Geophys. 2013, 56, S0454. [Google Scholar] [CrossRef]
  73. Vásconez, F.; Moussallam, Y.; Harris, A.J.; Latchimy, T.; Kelfoun, K.; Bontemps, M.; Macías, C.; Hidalgo, S.; Córdova, J.; Battaglia, J.; et al. VIGIA: A thermal and visible imagery system to track volcanic explosions. Remote Sens. 2022, 14, 3355. [Google Scholar] [CrossRef]
  74. Bianco, F.; Caliro, S.; De Martino, P.; Orazi, M.; Ricco, C.; Vilardo, G.; Aquino, I.; Augusti, V.; Avino, R.; Bagnato, E.; et al. The Permanent Monitoring System of the Campi Flegrei Caldera, Italy. In Campi Flegrei. Active Volcanoes of the World; Orsi, G., D’Antonio, M., Civetta, L., Eds.; Springer: Berlin/Heidelberg, Germany, 2022. [Google Scholar] [CrossRef]
  75. Vilardo, G.; Chiodini, G.; Augusti, V.; Granieri, D.; Caliro, S.; Minopoli, C.; Terranova, C. The Permanent Thermal Infrared Network for the Monitoring of Hydrothermal Activity at the Solfatara and Vesuvius Volcanoes. In Conception, Verification and Application of Innovative Techniques to Study Active Volcanoes; Marzocchi, W., Zollo, A., Eds.; DoppiaVoce: Naples, Italy, 2008; pp. 481–495. [Google Scholar]
  76. Vilardo, G.; Sansivero, F.; Chiodini, G. Long-term TIR imagery processing for spatiotemporal monitoring of surface thermal features in volcanic environment: A case study in the Campi Flegrei (Southern Italy). J. Geophys. Res. Solid Earth 2015, 120, 812–826. [Google Scholar] [CrossRef]
  77. Sansivero, F.; Vilardo, G. Ground-Based Thermal/IR Images Acquired by TIRNet Permanent Volcanic Surveillance Network. Istituto Nazionale di Geofisica e Vulcanologia (INGV), 2022. Online Web Database. Available online: https://www.ov.ingv.it/ov/thermolab/index_eng.html (accessed on 1 June 2024).
  78. Kneizys, F.; Shettle, E.; Gallery, W. Atmospheric transmittance and radiance—The LOWTRAN 5 code. Atmos. Transm. 1981, 277, 116–124. [Google Scholar]
  79. Sansivero, F.; Vilardo, G. Processing thermal infrared imagery time-series from volcano permanent ground-based monitoring network. Latest methodological improvements to characterize surface temperatures behavior of thermal anomaly areas. Remote Sens. 2019, 11, 553. [Google Scholar] [CrossRef]
  80. Merucci, L.; Bogliolo, M.P.; Buongiorno, M.F.; Teggi, S. Spectral emissivity and temperature maps of the Solfatara crater from DAIS hyperspectral images. Ann. Geophys. 2006, 49, 235–244. [Google Scholar] [CrossRef]
  81. Mineo, S.; Pappalardo, G. Rock Emissivity Measurement for Infrared Thermography Engineering Geological Applications. Appl. Sci. 2021, 11, 3773. [Google Scholar] [CrossRef]
  82. Liu, C.; Yuen, J.; Torralba, A. SIFT Flow: Dense Correspondence across Scenes and its Applications. IEEE Trans. Pattern Anal. Mach. Intell. 2011, 33, 978–994. [Google Scholar] [CrossRef] [PubMed]
  83. Cleveland, R.B.; Cleveland, W.S.; McRae, J.E.; Terpenning, I.J. STL: A seasonal-trend decomposition procedure based on loess. J. Off. Stat. 1990, 6, 3–73. [Google Scholar]
  84. Cleveland, W.S. Robust Locally Weighted Regression and Smoothing Scatterplots. J. Am. Stat. Assoc. 1979, 74, 829–836. [Google Scholar] [CrossRef]
  85. Cleveland, W.S.; Devlin, S.J. Locally-Weighted Regression: An Approach to Regression Analysis by Local Fit-ting. J. Am. Stat. Assoc. 1988, 83, 596–610. [Google Scholar] [CrossRef]
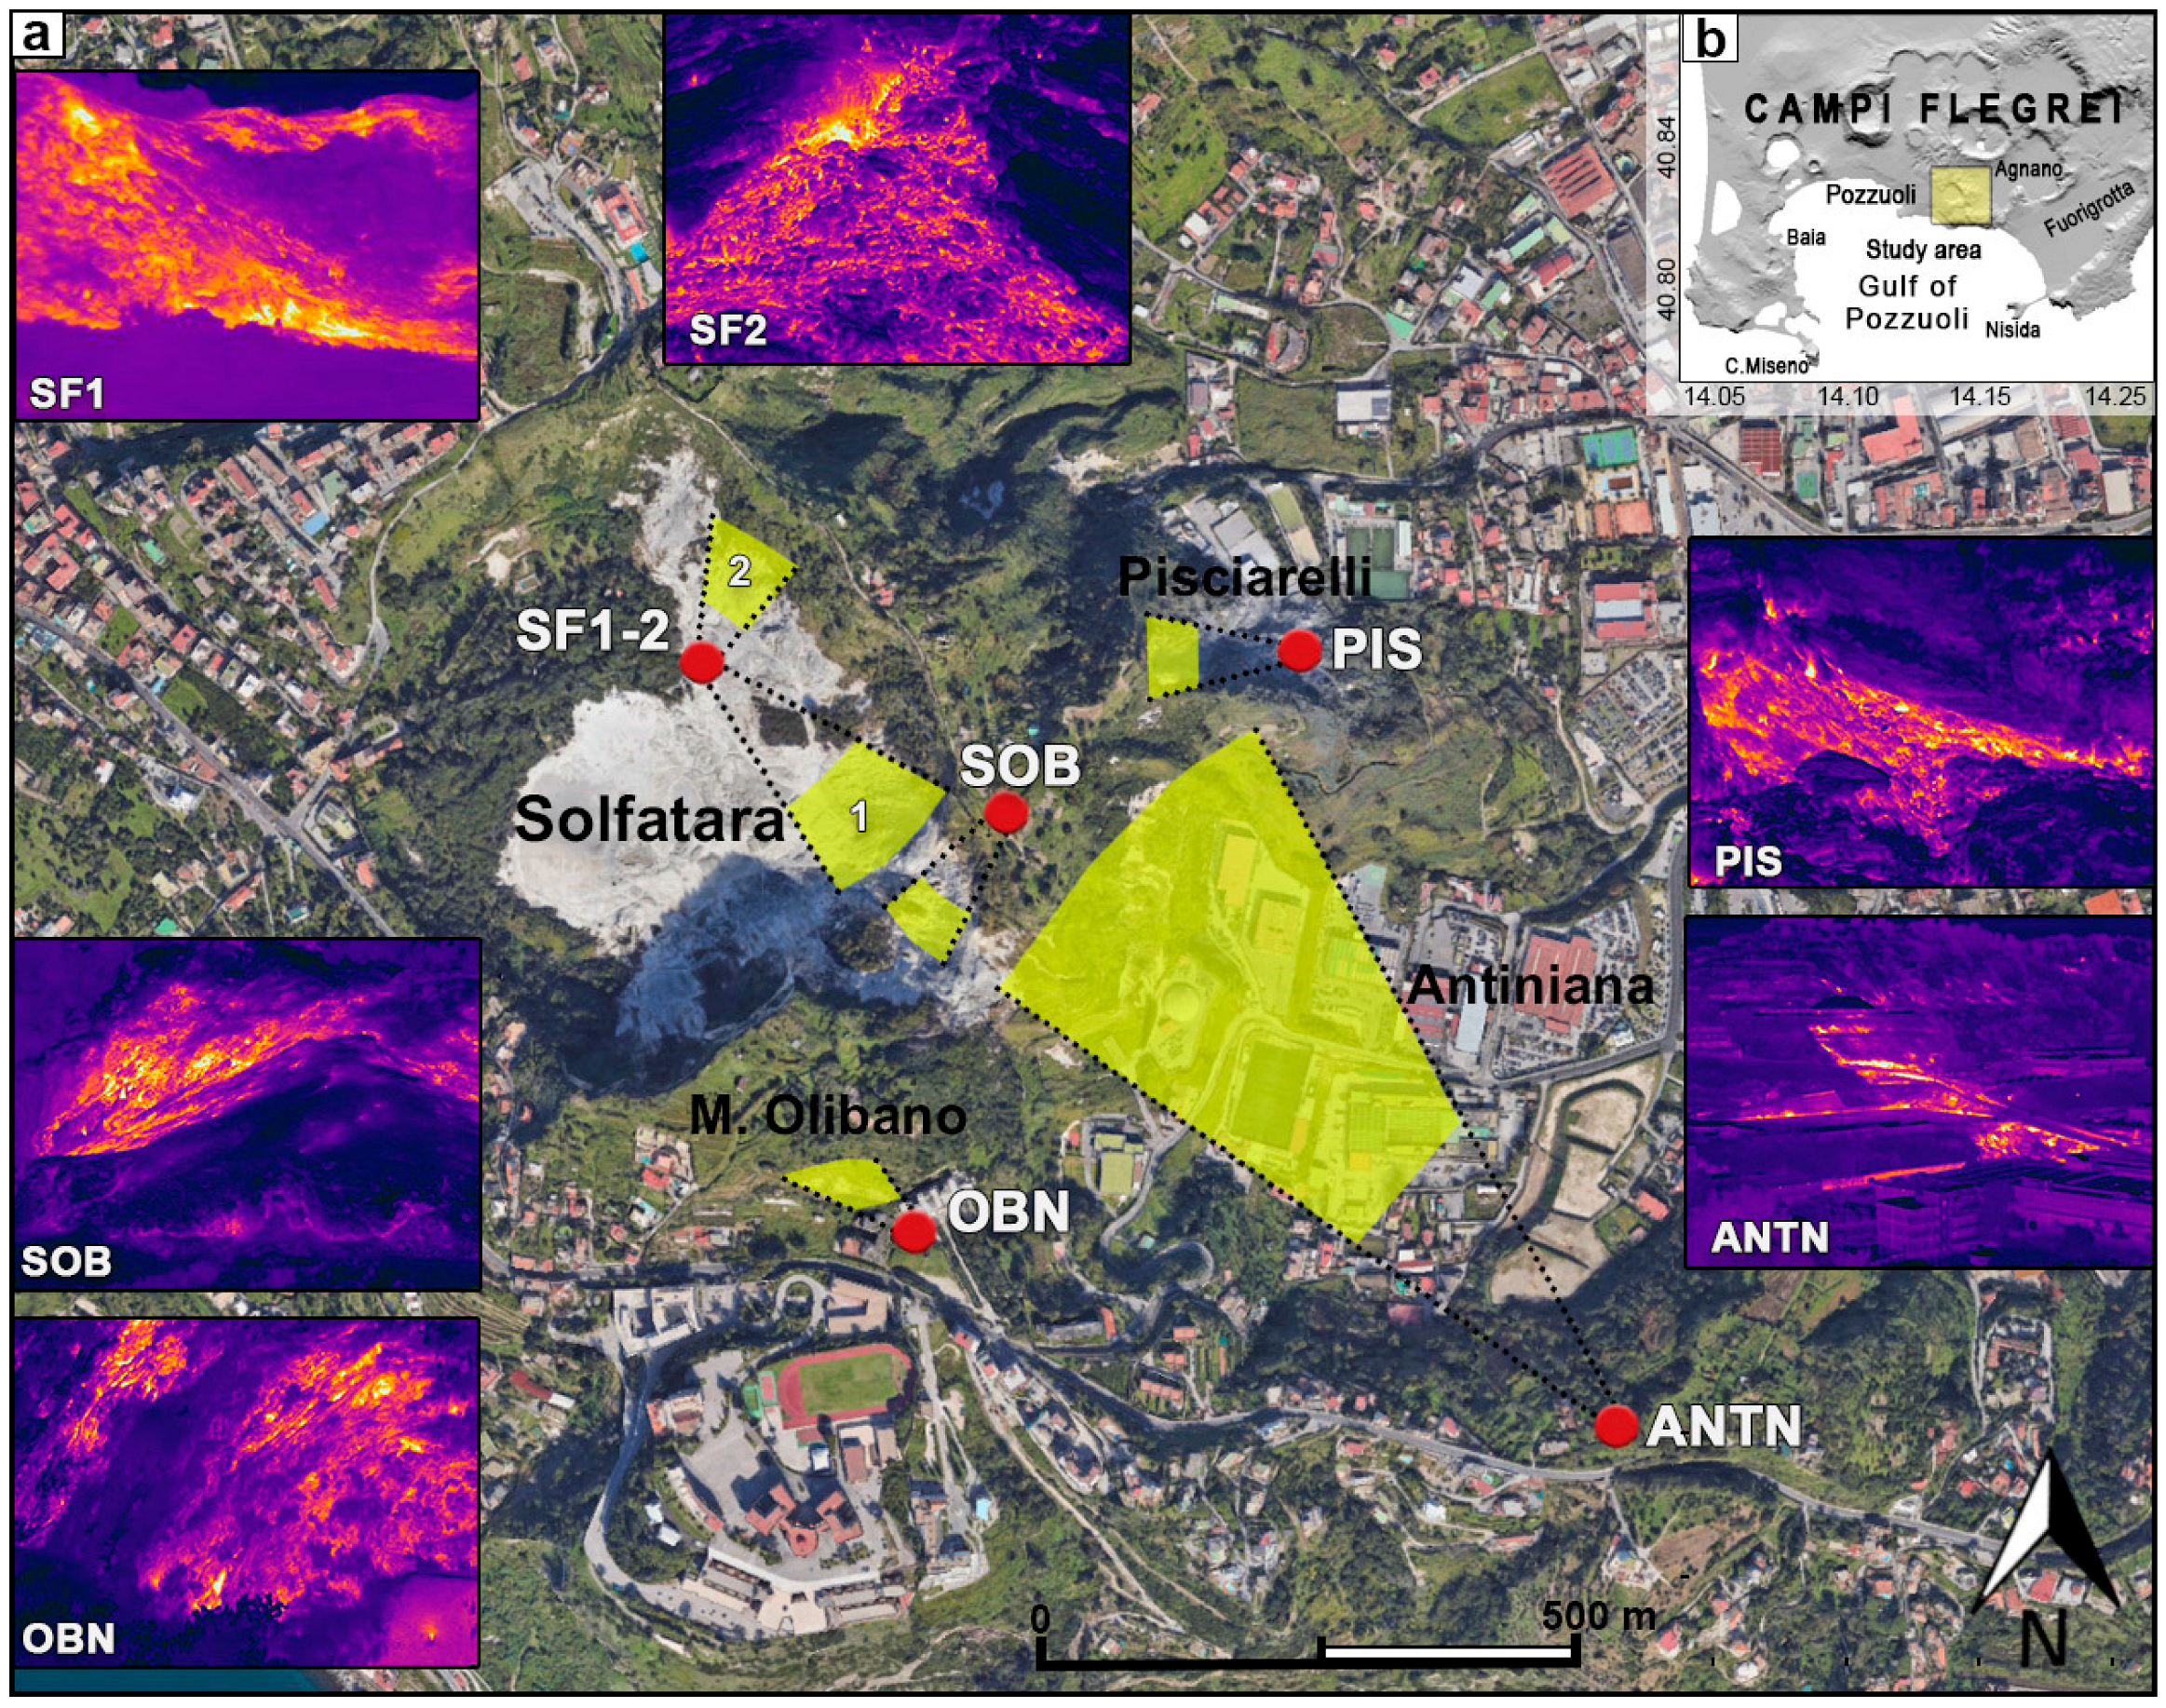
Figure 1. (a) Study area with the locations (red dots) of the TIRNet stations of INGV-Osservatorio Vesuviano. Yellow polygons define the areas monitored by the TIR cameras; inset TIR images are related to the scenes monitored by the TIRNet stations. The numbers 1 and 2 are related to the different areas monitored by the SF1 and SF2 stations, respectively. (b) Campi Flegrei map with the study area delimited by the yellow rectangle.
Remotesensing 16 03352 g001
Figure 2. (a) Simplified flow diagram of the processing steps performed by the Automated System of InfraRed Analysis (ASIRA). (b) Plots showing the decomposition of maximum raw temperatures (Tmax RAW) into three components (Trend, Seasonality, and Remainder) obtained by applying the STL algorithm and the final product (Tmax STL) representing the maximum temperatures time series not affected by the seasonal influence. Y-axis values are expressed in °C.
Remotesensing 16 03352 g002
Figure 3. Locations of daily maximum temperatures (red crosses) inside raw thermal infrared frames acquired by the stations of the permanent thermal infrared monitoring network of INGV-Osservatorio Vesuviano over the period of operation of each single-station TIR camera (see Table 1). White sub-captions inside each frame indicate the station name and the related TIR camera model. SF1 = Solfatara crater station, SF2 = Solfatara northern slope station, PIS = Pisciarelli slope station, SOB = Solfatara eastern rim station, OBN = Mt. Olibano southern slope station, ANN = Antiniana area station. X and Y axes values are column and row numbers, respectively, of pixels in the TIR frames.
Remotesensing 16 03352 g003
Figure 4. Regions of anomaly (RoAs) (inside white polylines) identified inside the raw thermal infrared frames acquired by the stations of the permanent thermal infrared monitoring network of INGV-Osservatorio Vesuviano. SF1 = Solfatara crater station, SF2 = Solfatara northern slope station, PIS = Pisciarelli slope station, SOB = Solfatara eastern rim station, OBN = Mt. Olibano southern slope station, ANN = Antiniana area station. X and Y axes values are column and row numbers, respectively, of pixels in the TIR frames.
Remotesensing 16 03352 g004
Figure 5. Background areas (white polylines) identified inside the raw thermal infrared frames acquired by the stations of the permanent thermal infrared monitoring network of INGV-Osservatorio Vesuviano. SF1 = Solfatara crater station, SF2 = Solfatara northern slope station, PIS = Pisciarelli slope station, SOB = Solfatara eastern rim station, OBN = Mt. Olibano southern slope station, ANN = Antiniana area station. X and Y axes values are column and row numbers, respectively, of pixels in the TIR frames.
Remotesensing 16 03352 g005
Figure 6. Plots of processed TIR data from all the stations of the permanent thermal infrared monitoring network of INGV-Osservatorio Vesuviano at Campi Flegrei collected during the period October 2004–February 2024. Light gray lines are de-seasoned maximum temperature values (TmaxSTL TS) of regions of anomaly (RoAs), and black lines are related to running average values (window = 21 days); blue lines are de-seasoned trends (STLtrends). Green lines in the SF1 and PIS plots are representative of TIR data acquired by the NEC TS7302 cameras. The plot of SF1 also reports data from the FLIR SC325 TIR camera acquired during the period April 2014–January 2016.
Remotesensing 16 03352 g006
Figure 7. Plots of radiative heat flux time series (red lines, HFlux TS) from regions of anomaly (RoAs) from all the stations of the permanent thermal infrared monitoring network of INGV-Osservatorio Vesuviano at Campi Flegrei during the period October 2004–February 2024. Orange lines are related to values extracted by the NEC cameras of the PIS and SF1 stations.
Remotesensing 16 03352 g007
Figure 8. (a) Comparison plot of temperature values from TIR data from all the stations of the permanent thermal infrared monitoring network of INGV-Osservatorio Vesuviano (TIRNet) at Campi Flegrei during the period October 2004–May 2024. Different colored lines (see legend) are smoothed plots (running average, window = 21 days) of de-seasoned maximum temperature values (TmaxSTL TS) from different TIRNet stations. Blue lines are LOESS trends of TmaxSTL. (b) Bar plot of duration magnitudes (Md, blue bars) and cumulative energy (red line) related to seismic events (Md > 1) localized in the area reported in Figure 1, during the period October 2004–May 2024.
Remotesensing 16 03352 g008
Figure 9. Comparison of radiative heat flux data (a) extracted from TIR images acquired by the stations of the permanent thermal infrared monitoring network of INGV-Osservatorio Vesuviano (TIRNet) and seismicity (b) at Campi Flegrei in the period January 2019–May 2024. (a) Red lines are radiative heat flux plots and dark grey lines are LOESS trends in radiative heat flux values. (b) Bar plot of duration magnitudes (Md, blue bars) and cumulative energy (red line) related to seismic events (Md > 1) localized in the area reported in Figure 1, in the period January 2019–May 2024.
Remotesensing 16 03352 g009
Figure 10. Zoomed-out view for the period January 2016–May 2024 (January 2019–May 2024 reported in Figure 8) showing (a) TmaxSTL values from TIR data and (b) bar plot of duration magnitudes (Md, blue bars) and cumulative energy (red line) related to seismic events. Refer to the caption of Figure 8 for descriptive details. Vertical dotted red lines correlate high energy seismic events to sudden temperature changes.
Remotesensing 16 03352 g010
Table 1. Development chronogram of TIRNet network (light blue bars indicate the operational periods of TIR cameras).
StationCamera200420052006200720082009201020112012201320142015201620172018201920202021202220232024Working Period
SF1NEC TS7302 Oct 2004–Jan 2014
SF1FLIR SC325 Apr 2014–Jan 2016
SF1FLIR SC655 Jan 2016–present time
PISNEC TS7302 Oct 2006–Sept 2013
PISFLIR SC655 Mar 2013–present time
SF2FLIR SC655 Jun 2013–present time
OBNFLIR SC655 Mar 2015–present time
SOBFLIR SC655 Jun 2016–present time
ANTNFLIR SC655 Oct 2020–present time
Table 2. Technical specifications of TIR cameras.
Camera ModelResolution (Pixel)Spectral RangeAccuracyThermal Sensitivity
NEC TS7302320 × 2408–14 µm±2 °C0.08 °C
FLIR SC325320 × 2407.5–13 µm±2 °C<0.05 °C
FLIR SC655640 × 4807.5–13 µm±2 °C<0.03 °C
Table 3. Technical details of current TIRNet stations and target areas (FoV = Field of View).
Remote StationFoVData
Transmission
Station UTM
Coordinates (m)
Sensor–Target Average DistanceAverage Pixel Size (cm)
SF125° × 19°Wi-Fi40.82916, 14.13971340 m23.1
SF215° × 11.9°Wi-Fi40.82916, 14.13971114 m4.6
PS115° × 11.9°LTE mobile40.82890, 14.14705140 m5.6
OBN25° × 19°Wi-Fi40.82364, 14.1425665 m4.2
SOB25° × 19°Wi-Fi40.82675, 14.1439190 m6.1
ANTN25° × 19°LTE mobile40.82194, 14.15037450 m30
Disclaimer/Publisher’s Note: The statements, opinions and data contained in all publications are solely those of the individual author(s) and contributor(s) and not of MDPI and/or the editor(s). MDPI and/or the editor(s) disclaim responsibility for any injury to people or property resulting from any ideas, methods, instructions or products referred to in the content.