Abstract
Achieving a balance between spectral resolution and spatial resolution in multi-spectral remote sensing images is challenging due to physical constraints. Consequently, pan-sharpening technology was developed to address this challenge. While significant progress was recently achieved in deep-learning-based pan-sharpening techniques, most existing deep learning approaches face two primary limitations: (1) convolutional neural networks (CNNs) struggle with long-range dependency issues, and (2) significant detail loss during deep network training. Moreover, despite these methods’ pan-sharpening capabilities, their generalization to full-sized raw images remains problematic due to scaling disparities, rendering them less practical. To tackle these issues, we introduce in this study a multi-spectral remote sensing image fusion network, termed TAMINet, which leverages a two-stream coordinate attention mechanism and multi-detail injection. Initially, a two-stream feature extractor augmented with the coordinate attention (CA) block is employed to derive modal-specific features from low-resolution multi-spectral (LRMS) images and panchromatic (PAN) images. This is followed by feature-domain fusion and pan-sharpening image reconstruction. Crucially, a multi-detail injection approach is incorporated during fusion and reconstruction, ensuring the reintroduction of details lost earlier in the process, which minimizes high-frequency detail loss. Finally, a novel hybrid loss function is proposed that incorporates spatial loss, spectral loss, and an additional loss component to enhance performance. The proposed methodology’s effectiveness was validated through experiments on WorldView-2 satellite images, IKONOS, and QuickBird, benchmarked against current state-of-the-art techniques. Experimental findings reveal that TAMINet significantly elevates the pan-sharpening performance for large-scale images, underscoring its potential to enhance multi-spectral remote sensing image quality.
1. Introduction
Currently, remote sensing images are widely used to monitor agriculture, environmental protection, industry, military protection, and other fields [1,2,3]. The accuracy of remote sensing technology applications is closely related to the quality of remote sensing images, so its improvement is the major focus of research in the field of remote sensing image processing. Due to physical constraints, it is difficult to achieve a balance between spectral resolution and spatial resolution of multispectral remote sensing images. To improve the spatial features of remote sensing image details and spectral features, many pan-sharpening methods are proposed. Their goal is to achieve panchromatic imaging with high spatial resolution but low spatial resolution multi-spectral (LRMS) images and single-band panchromatic (PAN) images are merged to obtain high-resolution multi-spectral images (HRMS) [4].
Many research efforts have been devoted to developing pan-sharpening algorithms during the last few decades. The most widely used method is the component substitution (CS) method. The CS method is the most classic and basic of the pan-sharpening methods. It mainly includes the following types: the traditional intensity–hue–saturation (IHS) algorithm [5], principal component analysis (PCA) [6], the Gram–Schmidt algorithm (GS) [7], the adaptive Gram–Schmidt algorithm (GSA) [8], and the method based on band-dependent spatial details (BDSD) [9]. While the CS method is straightforward to implement and capable of preserving the spatial details of the PAN image without sacrificing its spectrum, it does introduce distortions to both the extracted spatial information and the merged PAN image. Moreover, discrepancies arise among the components derived from the CS method [10], ultimately culminating in image distortions over time.
The MRA-based method uses spatial filters to inject spatial features into the LRMS. Representative algorithms include the generalized Laplacian pyramid (GLP) [11,12], smoothing filter-based intensity modulation (SFIM) [13], additive wavelet luminance proportional (AWLP) [14], “A-trous” wavelet transform (ATWT) [15], robust regression to GLP [16] and GLP with full-scale regression (GLP-Reg) [17], and other strategies decompose the LRMS and PAN images into multi-scale spaces and then inject the decomposed PAN images into the corresponding LRMS images for information fusion. The MRA-based method can better maintain spectral fidelity in pan-sharpening results, but high-frequency information is easily lost and cannot guarantee spatial accuracy.
When compared to CS and MRA techniques, VO-based methods exhibit a competitive edge in addressing pan-sharpening challenges. This method uses previous regularization constraints based on sparse representation theory [18] or Bayesian theory [19] to build a variational fusion energy function and uses iterative optimization algorithms such as gradient descent to minimize the energy function. The VO method is mathematically elegant but requires a considerable amount of computation, causing high costs. Therefore, most benchmarking and practical applications still use MRA and CS methods.
Considering the shortcomings of the three traditional methods above, and inspired by the super-resolution convolutional neural network (SRCNN) [20], Masi et al. [21] proposed pan sharpening using the convolutional neural network (PNN), according to the specific prior information in remote sensing images. It was the first study to apply the neural network to the pan-sharpening task. In subsequent studies, inspired by the pioneering work of PNN networks, deep-learning-based super-resolution methods have made significant progress, and researchers have proposed many advanced methods, among which residual learning, dense connections, and generative adversarial networks are commonly used. Inspired by residual learning, Yang et al. [22] proposed a deeper network than the PNN, the PanNet network. It adopts the skip connection idea from ResNet [23] to design a deeper network structure and further proposes using high-frequency information to compensate for clear spatial details. Similarly, Wei et al. [24] introduced the concept of residual learning into deep residual generalized sharpening neural networks (DRPNN) to form a very deep convolutional neural network, which can further improve the performance of generalized sharpening.
In addition to using the form of deepening the network to fully extract information, the multi-scale architecture can also be used to achieve the goal of sharpness. Yuan et al. [25] proposed a multi-scale and multi-depth convolutional neural network (MSDCNN) to explore convolutional neural network filters of different sizes. Jin et al. [26] proposed a Laplacian pyramid panchromatic network architecture, which uses the Laplacian pyramid method to split the image into multiple scales and develops a fusion convolutional neural network (FCNN) for each scale to combine them to form the final multi-scale network architecture. Cai and Huang [27] proposed a super-resolution-guided progressive pan-sharpening neural network (SRPPNN) to combine multi-scale features and obtain better pan-sharpening performance.
Furthermore, the pan-sharpening task can be considered as an imaging task, and the method based on the generative adversarial network (GAN) [28] provides striking advantages. This method uses a discriminator to distinguish the generated image from the GroundTruth image to improve image fusion quality. Due to powerful deep learning technology and a large amount of remote sensing data, pan-sharpening technology has developed rapidly. For example, PSGAN [29] uses generators and condition discriminators to reconstruct multi-band images with high spatial resolution. Ma et al. [30] proposed a new unsupervised framework for pan-sharpening based on generative adversarial networks, called Pan-GAN, through generative adversarial networks. It does not rely on so-called basic facts during network training.
Although the method based on deep learning has received wide attention and achieved reliable application results, deep-learning-based approaches have been increasingly transformed in the direction of deep networks. Therefore, this raises two questions. Deep networks focus on local features but ignore the connections between the overall and local features. Deep networks have difficulty finding which feature is the target area to focus on. Based on the problem listed above, we might consider the following ways to improve:
- Multi-spectral images are 3D data cubes, and it is difficult for ordinary CNN to extract high-fidelity detailed information. The attention mechanism can capture information from orientation and position perception, which can help the model locate and identify the target of interest more accurately.
- The traditional pan-sharpening method has the advantage of high fidelity to spatial-spectral feature information. The DL-based approach relies on large-scale dataset training to extract spectral information from LRMS images and spatial details from the PAN images. After the training phase, pan-sharpening images can be easily predicted or calculated by learning nonlinear mapping. Thus, it is an innovative idea to combine the traditional method with the DL method.
Building on the above analysis, this article proposes a new DL-based method called the multi-spectral remote sensing image pan-sharpening network (TAMINet) with two-stream attention and multi-detail injection. The main characteristics and contributions of this study are as follows:
- This study integrates the coordinate attention block in the feature extraction module, which, in turn, can effectively extract mode-specific features by encoding channel relationships and remote dependencies through accurate position information using a two-stream feature extractor to obtain mode-specific features from PAN and LRMS images.
- Our approach pays special attention to CS and MRA frameworks, and inspired by this traditional method, using a high-pass filter for detail extraction, the spectral direction features contained in LRMS images are merged (injected) with the high-resolution spatial detail pass information from PAN images several times to solve the problem of losing details in the fusing process.
- We present a combination of three simple optimization terms to constrain the spectral fidelity and spatial accuracy of pan-sharpening results. The first two optimization terms constrain the difference between predicted HRMS and LRMS, as well as PAN images to generate a similar structural distribution. Another optimization constraint provides spatial and spectral consistency between HRMS and GroundTruth images.
2. Related Work
2.1. Pan-Sharpening
Over the past few decades, various pan-sharpening algorithms have been proposed and studied. Although many scholars have developed new ways to improve the traditional method, the effect is still not ideal. Considering the different features contained in PAN and LRMS images, Liu et al. [31] proposed to use two-stream networking (TFNet) for feature extraction and perform information fusion in the feature domain. Inspired by this idea, this paper uses the two-stream network (TFNet) and adds a coordinate attention mechanism to the feature extractor to improve the ability to extract mode-specific features from PAN and LRMS images.
At the same time as the development of the multispectral remote sensing image fusion algorithm based on deep learning, the method of integrating the ideas of traditional methods has become a focus of research in recent years. Wu et al. [32] propose a general fusion framework that can perform weighted pan-sharpness tasks by combining VO with deep learning (DL), where these key weights, which directly determine the relative contribution of DL to each pixel, are estimated adaptively. Liu et al. [33] proposed a method of injecting high-pass detail from PAN images into upsampled MS images, that is, using classical injection to improve the details of merged images. This method resembles the scheme of traditional CS and MRA methods, but high-pass detail extraction is inconsistent with the classical process of CS and MRA methods. In addition, as high-pass filtering is used in the reconstruction process, the proposed architecture also shows the generalization capability of the corresponding network. He et al. [34] proposed a convolutional neural network (DiCNN) based on detail injection. The study develops an architecture based on detail injection, DiCNN1, which relies on MS and PAN images for detail injection. Benzenati et al. [35] proposed a gain injection prediction method based on CNN (GIP-CNN), which performs the injection gain by estimating the GIP feature information on a conventional grid and regularizes the grid by injecting MS image details. Compared to CS/MRA-based techniques, the GIP-CNN model shows better generalization results and provides more competitive fusion performance compared to PNN and DRPNN.
Therefore, inspired by previous innovative studies [31,32,33,34,35], we use two-stream neural networks to adjust the extraction of spatial and spectral details through the estimation of nonlinear and local injection models.
2.2. Coordinate Attention
Currently, the attention mechanism has been widely used in deep neural networks to improve model performance. However, in lightweight networks where model capacity is strictly limited, applying attention is very slow, mainly because the computational overhead of most attention mechanisms is inaccessible to lightweight networks. Considering the limited computational power of lightweight networks, Hu et al. [36] proposed squeeze-and-excitation (SE) attention, which is still the most popular attention mechanism at present. Unfortunately, SE attention only considers encoding information between channels and ignores the importance of location information, which is crucial for many visual tasks that require capturing object structure. Therefore, the convolutional block attention module (CBAM) [37] later added the spatial attention module to obtain position information through convolution. However, convolution can only capture local position relationships and cannot model long-range dependency. As the two networks outlined above still have problems, Qibin Hou et al. [38] proposed coordinate attention to solve the above problems as it provides the following advantages. First, it can capture not only channel information but also direction and position awareness information, which can help the model locate and identify the target of interest more accurately. Secondly, coordinate attention is flexible and lightweight, plug and play. Finally, coordinate attention can be a significant gain for downstream tasks based on lightweight networks.
Due to the limitation of convolution operators, it is often impossible to obtain the long-range space features accurately, thus limiting the overall performance. Therefore, coordinate attention is added to the feature extraction network to capture the remote spatial information between the channels, which enables the model to obtain the spectral information from the LRMS image and the spatial information of the PAN image.
3. Methods
3.1. Overall Network Architecture
The main task of pan-sharpening technology is to merge the LRMS image and PAN image, to obtain the same spatial resolution and PAN image and spectral fidelity and LRMS image from the same sharpness HRMS image. In this work, is used to represent LRMS images, where and represent the width and height of low-resolution images, respectively. is used to represent the corresponding PAN images and represent the HRMS images after pan-sharpening, where and respectively represent the width and height of the high-resolution image and represent the number of spectral bands of the multi-spectral image, usually . The hyperspatial resolution scale factor can be defined as , and the scale factor is usually set.
In addition, inspired by DR-NET [39,40], we designed a feature extraction network, a feature fusion network and an image reconstruction network. First, the LRMS images were upsampled using interpolation methods such as bicubic interpolation to obtain preliminary LRMS images with the same resolution as the PAN image. Second, this study adds the coordinate attention (CA) block in the feature extraction network (FEN), which can capture cross-channel data and information from direction and position perception. The efficiency of acquiring spectral features from the LRMS image and spatial feature details from the PAN image is improved. The process is mainly expressed as input from and into the FEN to obtain spectral and spatial features, respectively. Third, the feature fusion network (FN) is used to perform a feature-level fusion of the PAN image and the LRMS image. Finally, the reconstruction network (REC) is inserted to reconstruct the HRMS image after pan-sharpening. Furthermore, in the pan-sharpening reconstruction network, the spatial details of the PAN image after high-pass processing are injected many times, and the spectral feature information lost in the fusing process is injected with gain. The general form of the overall fusion process is shown in Formula (1):
where describes the two-stream encoder–decoder fusion model, that is, and are taken as inputs to generate the necessary HRMS image , with as the set of model parameters.
Among them, high-pass represents the high-pass filter, FEN represents the feature extraction network, FN represents the feature fusion network and REC represents the image reconstruction network. In this study, high-pass filtering is used to extract high-frequency details and inject high-frequency details into the FN module and REC module several times to achieve the goal of preserving many spatial feature details.
Specifically, FEN is used to extract features from the upsampled LRMS and PAN images, contributing to subsequent fusion steps. Therefore, with or as input, corresponding characteristics or can be obtained, according to Formulas (2) and (3):
where represents the operation of the FEN. It should be mentioned that and have the same structure but different parameters and extract different features from the LRMS and PAN images, respectively. After that, those obtained and were, respectively, fed into the feature fusion network. Moreover, the first PAN image detail injection gain was performed in the FN module, according to Formula (4):
where represents the feature fusion network operation, is the result obtained from the network structure, and is the high-frequency details extracted from the PAN image after the high-pass. Finally, the merged data are incorporated into the REC. Spectral and spatial feature details from the LRMS and PAN images are injected into the image reconstruction for enhancement. The network is therefore formulated as shown in Formula (5):
represents the reconstruction network and is the high-resolution multi-spectral image generated after reconstruction. Detailed architectures of the TAMINet are shown in Figure 1.
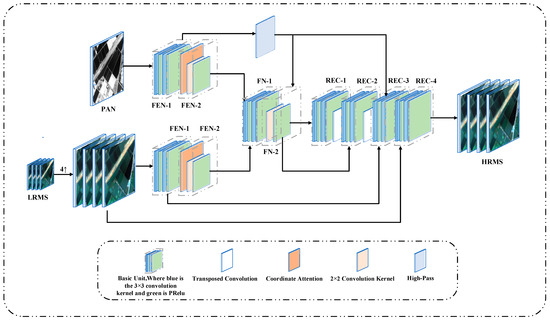
Figure 1.
Detailed architectures of the TAMINet. FEN consists of FEN-1 and FEN-2; FN consists of FN-1 and FN-2; REC consists of REC-1, REC-2, REC-3 and REC-4.
In Figure 1, “High-Pass” represents a high-pass filter, FEN represents a feature extraction network, FN represents a feature fusion network, REC represents an image reconstruction network. The Basic Unit is a convolution unit composed of two convolution kernels and two PRelu activation layers. FEN consists of FEN-1 and FEN-2, where FEN-2 consists of CA block, convolution kernel and PRelu. FN comprises two modules, FN-1 and FN-2. FN-1 consists of a Basic Unit, and FN-2 consists of a convolution layer and a PRelu activation layer. REC comprises four components: REC-1, REC-2, REC-3, and REC-4. All are composed of the Basic Unit, but there are transposed convolution layers.
3.2. Loss Function
Spatial loss () is designed to search for gradient mapping between HRMS and PAN images. The loss function is defined as follows:
where represents the HRMS image, is the PAN image, is the norm of , and represents the diagonal matrix used to weight each channel so that the size of is scaled to the size of . Note that can be learned by other parameters in the frame. represents the image gradient operator. represents spatial similarity, that is, whether finer details of spatial features can be obtained.
Spectral loss () is designed to search in this case for gradient mapping between HRMS and LRMS images. The specific loss function of this part is defined as follows:
where is the LRMS image, is the Frobenius norm and is the fuzzy spatial downsampling operator. Specifically, the main objective of is to promote spectral similarity and spatial fidelity.
The norm loss ( norm) is the average of the absolute errors of HRMS and GroundTruth. The loss function formula for this part is defined as (8):
where represents the GroundTruth image and represents the number of image pairs in the training set. represents the norm of . The main purpose of is to maintain the similarity between the HRMS image and the GroundTruth image in potential features.
The total loss function () uses spectral loss () and spatial loss () to simultaneously retrieve spatial details and retain input spectral information. In addition, a loss is used to further refine the spectral quality. Finally, the proposed pan-sharpening model is applied to minimize the following loss function (9):
where , and are the weights defined according to experience in the experiment. The setting of weights is based on references [30,41]. The purpose of the loss function used in this paper is to control the spatial accuracy through and spectral accuracy through , norm controls of the similarity of potential features between the HRMS image and the GroundTruth image to improve the model optimization effect and speed.
4. Results
To verify the effectiveness of the proposed method, simulation experiments and analysis of actual data are conducted and described in this section.
4.1. Experiment Settings
4.1.1. Datasets
We use training datasets from three different satellites to conduct simulation experiments.
The first is the IKONOS dataset [42], which utilizes multi-spectral (LRMS) and panchromatic (PAN) data from the IKONOS satellite in the United States. The IKONOS satellite, also known as IKONOS, is the first generation of high-resolution commercial earth observation satellites developed by Eartheye to provide high-resolution satellite remote sensing imagery to military and civilian users. Panchromatic band imaging band range: 0.45 μm~0.9 μm. Multi-spectral images of each wavelength range: 0.45 μm~0.53 μm (blue), 0.52 μm~0.61 μm (green), 0.64 μm~0.72 μm (red), 0.76 μm~0.86 μm (near infrared). Spatial resolution: 1 m (panchromatic), and 4 m (multi-spectral). Land cover types in this dataset include cities, vegetation, rivers, and lakes.
The second is the QuickBird dataset [27], which uses LRMS and PAN images from the QuickBird satellite. Quickbird uses the Global Aerial Imaging System 2000 (BGIS2000), which has the fourth highest Earth image resolution in the world at 0.61–0.72 m in full color and 2.44–2.88 m in multispectral. Product type: panchromatic, multi-spectral, panchromatic enhancement, panchromatic + multi-spectral bundle, and so forth. Panchromatic band imaging range: 0.405 μm~1.053 μm. Multi-spectral imaging of each wavelength range: 0.45 μm~0.520 μm (blue), 0.52 μm~0.60 μm (green), 0.63 μm~0.69 μm (red), 0.76 μm~0.90 μm (near infrared). The land cover types in this dataset include forests, farmland, buildings, and rivers.
The third is the WorldView-2 dataset [29], which uses LRMS and PAN images from the WorldView-2 satellite, providing unique 8-band high-resolution commercial satellite imagery. The spatial resolutions of LRMS and PAN are 1.84 m and 0.46 m, respectively. In this study, the panchromatic band and four commonly used bands were selected: 0.45 μm~0.74 μm (panchromatic). The wavelength range: 0.45 μm~0.51 μm (blue), 0.51 μm~0.58 μm (green), 0.63 μm~0.69 μm (red), and 0.77 μm~0.895 μm (near infrared).
Following the Wald protocol, PAN and LRMS in the training set and test set are downsampled with operator 4 to obtain new PAN and LRMS. In the simulation experiment, the original LRMS can be considered as GroundTruth, that is, the target LRMS image approximated by model training is proposed. The four pre-processing steps of the proposed network framework dataset are as follows: (1) The LRMS image is cut into an image block. (2) The PAN image is cropped into a big and small image block. (3) the training set and test set for network training are obtained by random division according to the proportion of 80% and 20%, respectively. (4) The training set is divided into training and verification sets according to the ratio of 70% and 30%, respectively. The resulting IKONOS dataset contains 200 data pairs, the QuickBird dataset contains 721 pairs, and the WorldView-2 dataset contains 1174 pairs. Details of the specific dataset are summarized in Table 1.

Table 1.
Details of datasets.
4.1.2. Comparison Method and Evaluation Index
To verify the advantages of the proposed method, we compare it with nine more advanced pan-sharpening methods proposed in recent years. The first four methods (GS, IHS, Brovey [43,44], and PRACS [45]) are the traditional pan-sharpening methods. The fifth to tenth methods (PNN, PanNet, TFNet, MSDCNN, SRPPNN, -PNN [46]) are deep learning methods.
Eight indicators are used to quantitatively evaluate the performance of the remote sensing image pan-sharpening network proposed in this paper and the corresponding comparison methods. The eight indicators are spectral angle mapper () [47], relative dimensionless global error in synthesis, [48], quality without reference () and its related indices are compared with and [49], universal image quality index () [50], the four-band expansion of the index ( index, ) [49], and the spatial correlation coefficient () [51].
is used to evaluate the spectral difference between the reference image and the pan-sharpened image. It is defined as the angle between the spectral vectors of the enhanced image and the reference image at the same pixel. The smaller the value, the more similar the spectral distribution of the enhanced image to that of the reference image. The calculation formula is (10):
where and are the pan-sharpened enhanced image and GroundTruth, respectively.
The relative dimensionless global error () is a commonly used global quality index. , like , mainly reflects spectral distortion in enhanced images. The calculation formulas are (11) and (12):
where and are the pan-sharpened and enhanced images and GroundTruth, respectively; , respectively, represent the values of the pan-sharpened enhanced image and the GroundTruth image in the first band; is the number of pixels in an image; is the root-mean-square error between the -th band of the merged image and the reference image; and are the spatial resolution of the PAN image and the MS image, respectively; is the average of the -th band of an LRMS image with a total of bands.
The Universal Image Quality Index () is an index for estimating the global spectral quality of a pan-sharpened image. It is defined as (13):
For , and represent the pan-sharpened and enhanced image and GroundTruth, respectively; and are the average values of and , respectively; and are the variances of and , respectively; represents the covariance between and .
Regarding the Universal Image Quality Index (), the index explains the correlation, average deviation, and contrast change of the resulting image relative to GroundTruth. is an enhanced iteration of designed for multi-spectral imaging with four spectral bands. The calculation formula is shown in (14):
where and are two quaternions formed by the spectral vector of the MS image. The quaternions are made up of one real number and three imaginary numbers, , , , and are generally expressed as , where , , and are real numbers. and are the average values of and ; represents the covariance between and , and are the variances of and .
There is no reference index (), which mainly reflects the fusion performance without GroundTruth, including the spectral distortion evaluation index () and spatial distortion evaluation index (). The closer the index is to 0, the better the degree of spectral fusion. The closer the index is to 0, the better the structure. The closer the index is to 1, the better the pan-sharpening image performs. The calculation formula of index is shown in (15) and the formula of index in (16). The calculation formula of index in (17).
where and represent positive integer exponents; and are PAN and MS images, respectively; and are weighted parameters to quantify spectral and spatial distortions, respectively. is the number of strips in the MS image. In this test, , , , are set to 1.
where computes the pan-sharpened image, represents the corresponding reference image; is a high-frequency core used to process images; and are the width and height of the image, respectively. and are the mean values of and , respectively.
4.1.3. Optimize the Environment and Details
This paper uses three sets of images collected from IKONOS, QuickBird and WorldView-2 to train and test the proposed method. To make a fair comparison, all traditional methods are tested in MATLAB R2017a. All DL-based comparison methods were simulated using Python 3.7 and PyTorch 1.12.1 in the Windows 10 environment. We run the program using an NVIDIA GeForce GTX 1650 graphics card. The Adam optimizer is used to adjust the entire network. The learning rate is set to 0.0001 with exponential decay and the batch size is set to 16. The MATLAB Toolbox in the MATLAB R2017 is used as a framework to obtain evaluation indicators in the experiment.
During the training process, various data enhancement techniques such as random horizontal flip, random vertical flip, 90-degree random rotation, and random cropping are used. In the process of random cropping, each training image is subsampled using bicubic interpolation with operator 4, and it is cropped into an LRMS image, PAN image and GroundTruth image.
4.2. Comparative Experiment
4.2.1. IKONOS Experiment Results
This section mainly describes the results of evaluating the eight indicators carried out using ten algorithms on the IKONOS dataset and visually displays the improved results of each algorithm. Each image is cropped and projected into a 24-bit true color image for display. Figure 2 shows the visualized results of the IKONOS dataset.
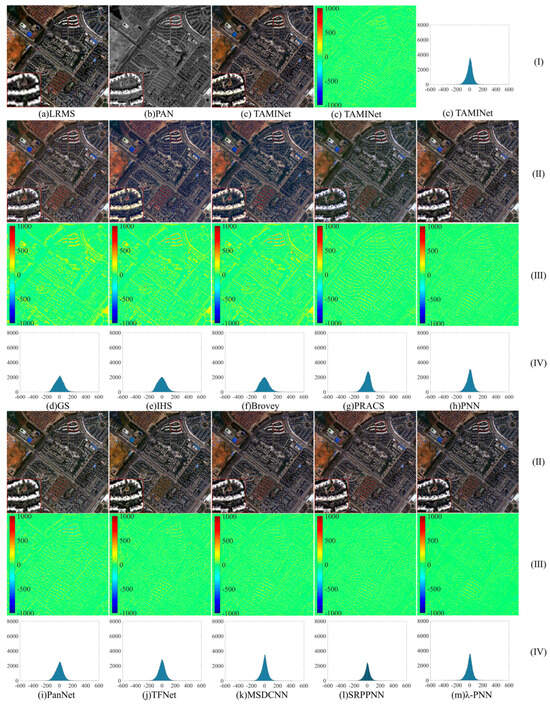
Figure 2.
The visualization of the IKONOS dataset: (I) represents the LRMS image, PAN image and the image has been sharpened by the network TAMINet. (II) represents the result graph of pan-sharpening. (III) plot of the difference between the GroundTruth image and the resulting graph in the blue band. (IV) histogram of GroundTruth image with graph of results in blue band. Where lowercase letter (a) is LRMS image, (b) is PAN image, and (c) is TAMINet. Lowercase letters (d–m) are the method of comparison. (d) GS. (e) IHS. (f) Brovey. (g) PRACS. (h) PNN. (i) PanNet. (j) TFNet. (k) MSDCNN. (l) SRPPNN. (m) -PNN.
(I) A visualization of the LRMS image and the PAN image are illustrated in Figure 2. Section (II) of Figure 2, documents some spectral distortion in the fusion results of the traditional methods such as GS, IHS, Brovey, and PRACS. In terms of spatial details, the sharpened images of GS, IHS, Brovey, PRACS, PNN, PanNet and TFNet methods differ significantly from the PAN image. Observing the spot (as highlighted in the box), it is evident that deep learning approaches excel the traditional methods in terms of spectral consistency. The reconstruction of ground objects by these methods is notably superior. However, an overview of the reconstructed pan-sharpening image reveals that some degree of spectral distortion remains. Regarding the final output, SRPPNN, -PNN and TAMINet can more effectively restore buildings and generally capture more accurate spectral information. For instance, the building restoration details of the TAMINet method (highlighted in the red box in the bottom-left corner) exhibit striking advantages over other algorithms. While both the SRPPNN and TAMINet methods excel at retrieving spatial feature details, our proposed TAMINet method is slightly superior to SRPPNN. With TAMINet, the contours of roads and buildings in remote sensing images are distinctly clear, and details of buildings are vividly visible, offering an impressive visualization effect.
We analyzed the difference graph and histogram of the fusion result graph of pan-sharpening and the GroundTruth image in the blue band in the IKONOS dataset and illustrated them in Figure 2 (III) and (IV). Among them, the GroundTruth image and the pan-sharpening fusion result produce the difference map closest to 0 (that is, the difference image closer to green). When the fusion image exhibits a smaller difference compared to the GroundTruth image; conversely, a smaller value implies a greater disparity between the images. Therefore, we can see whether the difference map is close to the full green and observe whether the image has bump detail from other colors. The closer to green the image is, the cleaner it will be and the better the fusion effect will be. From the difference graphs (III) and (IV) in the IKONOS dataset in Figure 2 the color of the difference graph of the TAMINet method is almost completely green, while the difference graph of other methods still has a lot of visible color details, thus, the difference from GroundTruth is relatively large, and the detail loss comparably severe. It is evident that the four traditional methods in line (III) of Figure 2 and the DL-based PNN method show relatively large differences in the comparison of details. Many details of building are blue or yellow. Compared to other DL algorithms that are almost entirely green, traditional methods show more loss of detail and increased spectral distortion. The spatial structure details extracted by the TAMINet method are closer to the GroundTruth image, and the histogram difference is smaller than in other methods. Therefore, the TAMINet method is superior to the other methods in extracting details of spatial features in the IKONOS dataset.
The quantitative evaluation of the IKONOS dataset is shown in Table 2. Note that the sub-optimal value is underlined and the optimal value of each indicator is marked in bold.
Table 2.
Quantitative evaluation of the IKONOS dataset.
Compared with traditional methods, the deep learning method can achieve fusion results of hyperspectral and spatial precision, which is significantly better than traditional methods (Table 2). Another problem is that PNN, PanNet, TFNet, MSDCNN and the four other methods are obviously inferior to SRPPNN, -PNN and TAMINet. In the case of less training data in the IKONOS dataset, although the TAMINet method still has advantages, minor gaps still remain in several evaluation indicators compared to the SRPPNN method.
To summarize, in case of minor training data in the IKONOS dataset, the TAMINet method excels the SRPPNN in stability and fit, although there are small gaps in various evaluation indices compared to the SRPPNN. Thus, the TAMINet method has obvious advantages compared to the other nine methods.
4.2.2. QuickBird Experiment Results
As for the IKONOS dataset, a representative pan-sharpening result is selected for the QuickBird dataset test and illustrated in Figure 3 for visual comparison. We analyze the difference graph and histogram of the fusion result graph of the GroundTruth image and pan-sharpening in the near-infrared band with the QuickBird dataset and show them in Figure 3 (III) and (IV). Among them, the difference graph information of the GroundTruth image and pan-sharpening fusion result graph is the same as in Figure 2.
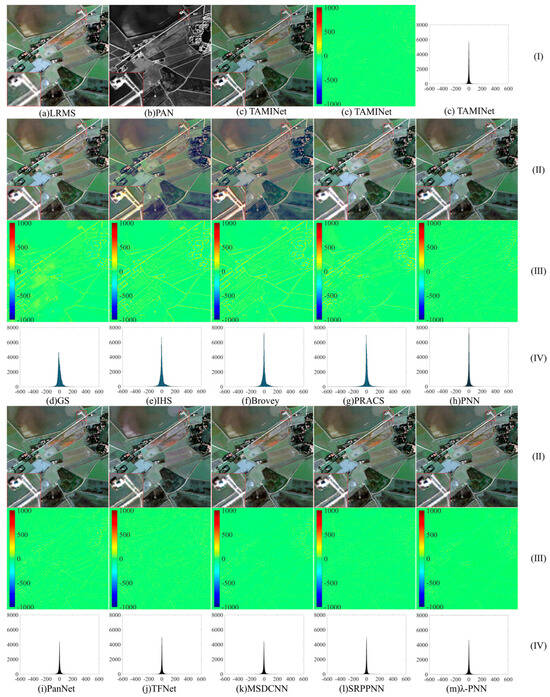
Figure 3.
The visualization of the QuickBird dataset: (I) represents the LRMS image, PAN image and the image has been sharpened by the network TAMINet. (II) represents the resulting plot of pan-sharpening. (III) plot of the difference between the GroundTruth image and the resulting graph in the NIR band. (IV) histogram of the GroundTruth image with the graph of result in the NIR band. Where lowercase letter (a) is LRMS image, (b) is PAN image, and (c) is TAMINet. Lowercase letters (d–m) are the method of comparison. (d) GS. (e) IHS. (f) Brovey. (g) PRACS. (h) PNN. (i) PanNet. (j) TFNet. (k) MSDCNN. (l) SRPPNN. (m) -PNN.
From the difference plots and histograms (III) (IV) in Figure 3, the fusion effect of the traditional methods (GS, IHS, Brovey and PRACS) is weak in the QuickBird dataset. The detail loss and spectral distortion of the two methods (GS and IHS) are comparably severe, and the colors and values of the difference charts are relatively large. However, compared to the traditional methods, the deep-learning-based method has relatively better spectral fidelity, spatial and edge details of the merged remote sensing image, and the difference map is close to full green. Despite the advantages of deep learning methods, PNN, PanNet and TFNet still exhibit serious spectral distortion and detail loss. Only the spatial structure details extracted by SRPPNN and TAMINet methods are close to the GroundTruth diagram, with comparably lower loss, and the effect of extracting spatial ground object details is better compared to the other methods.
The quantitative evaluation of the QuickBird dataset is shown in Table 3. The sub-optimal value is underlined, and the optimal value of each indicator is marked in bold.
Table 3.
Objective assessment of the QuickBird dataset.
Compared to the traditional methods, deep learning methods significantly outperform traditional methods (Table 3). With the increase in training data in the QuickBird dataset, the TAMINet method has only one evaluation index, which is slightly inadequate compared to the SRPPNN method. Meanwhile, it has a relatively better effect on spectral fidelity and detail recovery of spatial features. The TAMINet method introduced in this paper significantly outperforms the conventional fusion technique.
4.2.3. WorldView-2 Experimental Results
Similar to the IKONOS dataset, a representative pan-sharpening result was selected from the test set of the WorldView-2 data and illustrated in Figure 4 for visual evaluation.
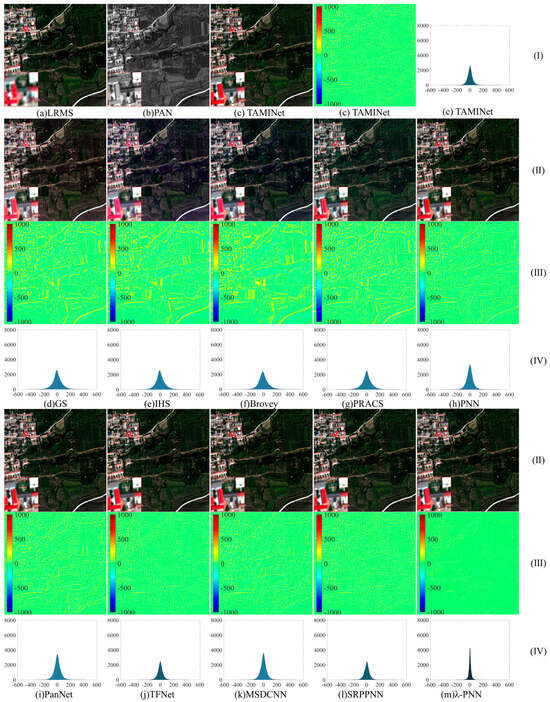
Figure 4.
The visualization of the WorldView-2 dataset: (I) represents the LRMS image, PAN image and the image has been sharpened by the network TAMINet. (II) represents the resulting plot of pan-sharpening. (III) plot of the difference between the GroundTruth image and the resulting graph in the NIR band. (IV) histogram of the GroundTruth image with result plot in the NIR band. Where lowercase letter (a) is LRMS image, (b) is PAN image, and (c) is TAMINet. Lowercase letters (d–m) are the method of comparison. (d) GS. (e) IHS. (f) Brovey. (g) PRACS. (h) PNN. (i) PanNet. (j) TFNet. (k) MSDCNN. (l) SRPPNN. (m) -PNN.
In the results (II) of Figure 4, in addition to the striking color distortion, the spectral information from the IHS and Brovey algorithm is also missing. The overall reconstruction results of the GS and PRACS algorithm are comparably poor, the visual effect is not ideal and low-quality spatial details appear. Due to the poor spectral fidelity effect, comparably bright colored spots are generated at the edges of the building. For example, both the IHS method in Figure 4d and the Brovey method in Figure 4e show the yellow road color in the enlarged image in the lower left corner, but the road in the original MS image is white. PNN, PanNet, TFNet, MSDCNN and other deep neural network algorithms exhibit better reconstruction effects. Although loss of details and incomplete information content occur in the image, the basic features of ground objects are identifiable. The SRPPNN, -PNN and TAMINet methods show the best spectral and structural information. However, the SRPPNN method exhibits minor boundary blurring problems and detail loss problems. As shown in (IV), the proposed TAMINet method has the lowest error range and lowest detail loss. For example: the building restoration details of the TAMINet method in the red box in the bottom left corner have obvious advantages compared to the other algorithms.
The difference graph and histogram of the fusion result graph of the GroundTruth image and pan-sharpening in the near-infrared band were analyzed for the WorldView-2 dataset and displayed in Figure 4 (III) and (IV). The difference graph information of the fusion result graph of the GroundTruth image and pan-sharpening is the same as in Figure 3. As shown in (III) and (IV) of Figure 4, the fusion results of traditional methods in the WorldView-2 dataset are quite different from the reference images. For example, the details of the white road in the lower right corner are slightly different from the details of the reference images. Although the spectral fidelity of traditional methods is better than in other datasets, we observe from the details that IHS and Brovey exhibit color distortion and blurring. Due to the noise suppression function of PNN, PanNet, TFNet and MSDCNN in the super-resolution process, the edge of the remote sensing image is very smooth. At the same time, in the reconstruction results, some missing details, displacements and other situations occurred in the GS, Brovey and PRACS methods, causing unrealistic visual effects in the images. SRPPNN has significantly improved these deficiencies, but the reconstruction results are still unsatisfactory. The spatial structure details extracted by the proposed TAMINet method are closer to those of GroundTruth. Thus, the effect of extracting the spatial ground object details is superior to the other methods. As indicated by the difference map, the overall effect is close to full green. Table 4 lists the results of eight evaluation indicators for ten pan-sharpening methods in the WorldView-2 dataset.
Table 4.
Objective assessment of the WorldView-2 dataset.
Table 4 enumerates the results of eight evaluation indices for ten pan-sharpening techniques tested on the WorldView-2 dataset. The best value for each exponent is marked in bold and the lowest value is underlined. The results show that the TAMINet method outperforms the traditional fusion methods. With the increase in training data in the WorldView-2 dataset, the advantages of the TAMINet method are further expanded compared to the SRPPNN method, and the effect is better on spectral fidelity and retrieval of details of spatial features.
Table 5 discusses the computational cost and number of parameters for different models on the IKONOS test set. Note that the size of the pan-sharpened image is about 256 × 256 × 4, and in order to avoid the accident of the calculation, we compare the average training time at a batch size of 16.
Table 5.
The FLOPS, Time and #Params of the IKONOS datasets.
It is evident from the experiments that although the IKONOS dataset is only slightly better than other algorithms, in the QuickBird dataset, all evaluation indices of the proposed TAMINet method significantly exceed those of the other algorithms. However, after testing on the WorldView-2 dataset, the spectral fidelity and detail sharpening of the proposed TAMINet method are significantly superior to the other algorithms. From this series of improvements, we noticed that the IKONOS dataset has only 200 data pairs, the QuickBird dataset has 721 data pairs, and the WorldView-2 training dataset has 1174 pairs of data. Therefore, although the TAMINet method is better than other algorithms by a minor margin in the case of a small amount of data, the larger the amount of data, the greater the accuracy of the TAMINet method. Thus, the algorithm introduced in this paper demonstrates more pronounced benefits when applied to a sizable dataset.
4.3. Ablation Experiments
4.3.1. Selection of the Attention Mechanism
In response to the question of innovation point 1 regarding why the coordinate attention (CA) mechanism is chosen in this study, this experiment uses the original network as the benchmark and replaces the CA mechanism in the network with SE and CBAM mechanisms for the experiment. With the exception of the CA, SE and CBAM mechanisms, all variables are trained and tested on the same network. Table 6 summarizes the findings from the ablation analysis.
Table 6.
Quantitative assessment of the attention mechanism.
The TAMINet method uses three different attention mechanisms on the backbone network and the results of the CA mechanism are superior to the SE and CBAM attention mechanisms in most indicators including benchmark indicators, such as , and (Table 6). The results show that the CA module contributes to a better performance in increasing the model accuracy and it significantly improves the quality of visual sensation and refines the quantitative results. Thus, the application of CA mechanism is the ideal method to achieve the best model performance.
4.3.2. Coordinate Attention and Detail Injection Modules
The ablation experiment was conducted based on the backbone network after removing the two main modules, the coordinate attention (CA) and detail injection (DI). CA indicates the network to which the CA module is added, DI indicates the network to which the DI module is added, and ALL indicates the network to which both modules are added. Except for the CA and DI modules, all variables are trained and tested on the same schema. Table 7 displays the results of the ablation analysis.
Table 7.
Quantitative evaluation of the CA and DI.
When the proposed framework adds CA modules to the backbone network, the benchmark metrics including , , and increase slightly. The results show that the CA module helps the model perform well in increasing accuracy. The main contribution of the CA module is to improve the quality of visual perception and quantitative results. When the DI module is added to the backbone network, most indicators obviously increase, and the increase is greater than that of the CA module. Therefore, the DI module contributes much more to the improvement of network fidelity and the quality of visual perception than the CA module. The results show that using the CA and the DI modules simultaneously is the best method to achieve the best model performance.
4.3.3. Detail Injection Module
From the above ablation experiment, the DI module achieved the highest improvement accuracy among the two main modules (CA module and DI module) added to our study. Therefore, to verify the influence and performance of each component in the DI module, three variants of the framework have been designed. The first is to use high-pass filtering to extract spatial feature details from PAN images and inject them into the backbone network, which is called DI-high-pass. The other part uses the spectral features of the LRMS image to inject into the image reconstruction stage, which is called DI-up-LRMS. Finally, two components are simultaneously added, termed DI-all. All variables are trained and tested on the same schema, except the detail injection module. Table 8 shows the results of the ablation study.
Table 8.
Quantitative evaluation of DI module.
The image quality of the DI-high-pass model is refined after fusion and the accuracy is also improved. The image quality of the DI-up-LRMS model is also improved and the accuracy is markedly increased. However, the effect is less significant compared to the use of the DI-high-pass. Ultimately, combining DI-high-pass and DI-up-LRMS simultaneously yields the optimal model performance, resulting in a notably enhanced effect.
4.3.4. Weight of the Loss Function
The sensitivities of these parameters are discussed in detail in the following subsections and detailed experimental evidence is provided. Weights are defined empirically, in Formula (9), based on studies in the field of pan-sharpening and discussions in references [30,39]. We add a discussion of these parameter choices and a detailed analysis of their impact on the model performance in this section. We use the peak signal-to-noise ratio (PSNR) to evaluate the model. Since , we fix the value and keep changing and to identify the optimal ratio. Figure 5 shows the values of weights , and .
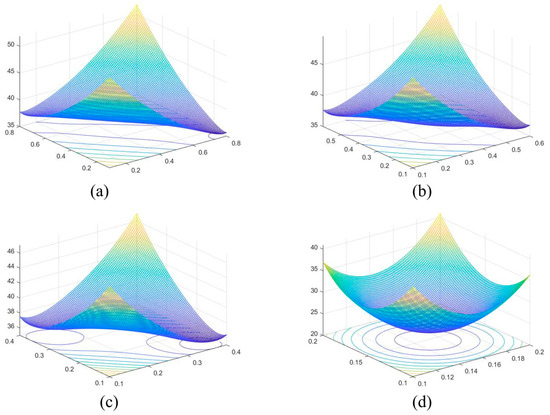
Figure 5.
The values of weights , and : (a) represents , where and vary according to formula ; (b) represents , where and vary according to formula ; (c) , where and vary according to formula ; (d) , where and vary according to formula .
The experimental result show that is the main factor that affects the model effect. and are less significant factors. Therefore, we selected the optimal ratio of weights , and of .
5. Conclusions
In this study, we introduce a pan-sharpening network for multi-spectrum remote sensing images, utilizing two-stream coordinate attention and multi-detail injection. Our exploration of various architectures reveals that the most effective enhancement in pan-sharpening is derived from the multi-detail injection. The proposed TAMINet effectively leverages the details from the original LRMS data. By incorporating the CA block in the feature extraction network, it encodes channel relationships and long-range dependency using precise position data, thereby extracting original data details more efficiently. During fusion, this extracted information undergoes multiple injections to enhance details, significantly augmenting the spatial resolution and spectral fidelity of the combined image. Furthermore, the architecture and loss function of the TAMINet improves the fusion result reconstruction quality. Through ablation studies and comparisons with other leading methods, the superiority of the TAMINet framework for practical uses becomes evident. While TAMINet considerably improves accuracy, its depth makes it less lightweight. To address this, future work will delve deeper into lightweight strategies, aiming to further refine the architecture and boost the network’s pan-sharpening performance.
Author Contributions
Conceptualization, J.W. and J.M.; methodology, J.W. and G.L. (Gaoping Li); software, J.W. and S.Y.; investigation, G.L. (Guibing Li) and G.L. (Gaoping Li); data curation, J.W. and X.L.; writing—original draft preparation, J.W. and J.M.; writing—review and editing, J.M. and Y.T.; visualization, J.W. and Y.T.; project administration, J.M. and X.L.; funding acquisition, S.Y. and G.L. (Guibing Li). Resources, L.Z. All authors have read and agreed to the published version of the manuscript.
Funding
This research was funded in part by NSFC (Grant No. 12271083), in part by the Sichuan Science and Technology Project (Grant No. 2021ZYD0021, 2022NSFSC0530, 2022NSFSC0507), in part by the Sichuan Provincial Program of Traditional Chinese Medicine (Grant No. 2021ZD017), in part by Sichuan Science and Technology Program (Grant No. 2023NSFSC0471), and in part by the Fundamental Research Funds for the Central Universities, Southwest Minzu University (Grant No. ZYN2023018).
Data Availability Statement
The datasets generated during the study are available from the corresponding author on reasonable request.
Conflicts of Interest
The authors declare no conflict of interest.
References
- Zhang, B.; Wu, D.; Zhang, L.; Li, J.Q. Application of Hyperspectral Remote Sensing for Environment Monitoring in Mining Areas. Environ. Earth Sci. 2012, 65, 3. [Google Scholar] [CrossRef]
- Zhang, H.; Xu, H.; Tian, X.; Jiang, J.; Ma, J. Image Fusion Meets Deep Learning: A Survey and Perspective. Inf. Fusion 2021, 76, 323–336. [Google Scholar] [CrossRef]
- Jones, E.G.; Wong, S.; Milton, A.; Sclauzero, J.; Whittenbury, H.; McDonnell, M.D. The Impact of Pan-Sharpening and Spectral Resolution on Vineyard Segmentation through Machine Learning. Remote Sens. 2020, 12, 934. [Google Scholar] [CrossRef]
- Gao, J.; Li, J.; Su, X.; Jiang, M.; Yuan, Q. Deep Image Interpolation: A Unified Unsupervised Framework for Pansharpening. In Proceedings of the 2022 IEEE/CVF Conference on Computer Vision and Pattern Recognition Workshops (CVPRW), New Orleans, LA, USA, 19–20 June 2022; pp. 609–618. [Google Scholar]
- Chavez, J.P.; Kwarteng, A. Extracting Spectral Contrast in Landsat Thematic Mapper Image Data Using Selective Principal Component Analysis. Photogramm. Eng. Remote Sens. 1989, 55, 339–348. [Google Scholar]
- Carper, W.J.; Lillesand, T.M.; Kiefer, R.W. The Use of Intensity-Hue-Saturation Transformations for Merging SPOT Panchromatic and ~ultispectraIlmage Data. Photogramm. Eng. 1990, 56, 459–467. [Google Scholar]
- Laben, C.A.; Brower, B.V. Process for Enhancing the Spatial Resolution of Multispectral Imagery Using Pan-Sharpening. U.S. Patet No.6011875, 4 January 2000. [Google Scholar]
- Aiazzi, B.; Baronti, S.; Selva, M. Improving Component Substitution Pansharpening Through Multivariate Regression of MS +Pan Data. IEEE Trans. Geosci. Remote Sens. 2007, 45, 3230–3239. [Google Scholar] [CrossRef]
- Garzelli, A.; Nencini, F.; Capobianco, L. Optimal MMSE Pan Sharpening of Very High Resolution Multispectral Images. IEEE Trans. Geosci. Remote Sens. 2008, 46, 228–236. [Google Scholar] [CrossRef]
- Haydn, R.; Dalke, G.W.; Henkel, J.; Bare, J.E. Application of the IHS Color Transform to the Processing of Multisensor Data and Image Enhancement. In Proceedings of the International Symposium on Remote Sensing of Environment, First Thematic Conference: Remote sensing of arid and semi-arid lands, Cairo, Egypt, 19–25 January 1982. [Google Scholar]
- Aiazzi, B.; Alparone, L.; Baronti, S.; Garzelli, A. Context-Driven Fusion of High Spatial and Spectral Resolution Images Based on Oversampled Multiresolution Analysis. IEEE Trans. Geosci. Remote Sens. 2002, 40, 2300–2312. [Google Scholar] [CrossRef]
- Restaino, R.; Vivone, G.; Addesso, P.; Chanussot, J. A Pansharpening Approach Based on Multiple Linear Regression Estimation of Injection Coefficients. IEEE Geosci. Remote Sens. Lett. 2020, 17, 102–106. [Google Scholar] [CrossRef]
- Liu, J.G. Smoothing Filter-Based Intensity Modulation: A Spectral Preserve Image Fusion Technique for Improving Spatial Details. Int. J. Remote Sens. 2000, 21, 3461–3472. [Google Scholar] [CrossRef]
- Otazu, X.; Gonzalez-Audicana, M.; Fors, O.; Nunez, J. Introduction of Sensor Spectral Response into Image Fusion Methods. Application to Wavelet-Based Methods. IEEE Trans. Geosci. Remote Sens. 2005, 43, 2376–2385. [Google Scholar] [CrossRef]
- Shensa, M.J. The Discrete Wavelet Transform: Wedding the a Trous and Mallat Algorithms. IEEE Trans. Signal Process. 1992, 40, 2464–2482. [Google Scholar] [CrossRef]
- Vivone, G.; Marano, S.; Chanussot, J. Pansharpening: Context-Based Generalized Laplacian Pyramids by Robust Regression. IEEE Trans. Geosci. Remote Sens. 2020, 58, 6152–6167. [Google Scholar] [CrossRef]
- Vivone, G.; Restaino, R.; Chanussot, J. Full Scale Regression-Based Injection Coefficients for Panchromatic Sharpening. IEEE Trans. Image Process. 2018, 27, 3418–3431. [Google Scholar] [CrossRef] [PubMed]
- Li, S.; Yin, H.; Fang, L. Remote Sensing Image Fusion via Sparse Representations Over Learned Dictionaries. IEEE Trans. Geosci. Remote Sens. 2013, 51, 4779–4789. [Google Scholar] [CrossRef]
- Zhang, Y.; Duijster, A.; Scheunders, P. A Bayesian Restoration Approach for Hyperspectral Images. IEEE Trans. Geosci. Remote Sens. 2012, 50, 3453–3462. [Google Scholar] [CrossRef]
- Dong, C.; Loy, C.C.; He, K.; Tang, X. Image Super-Resolution Using Deep Convolutional Networks. IEEE Trans. Pattern Anal. Mach. Intell. 2016, 38, 295–307. [Google Scholar] [CrossRef]
- Masi, G.; Cozzolino, D.; Verdoliva, L.; Scarpa, G. Pansharpening by Convolutional Neural Networks. Remote Sens. 2016, 8, 594. [Google Scholar] [CrossRef]
- Yang, J.; Fu, X.; Hu, Y.; Huang, Y.; Ding, X.; Paisley, J. PanNet: A Deep Network Architecture for Pan-Sharpening. In Proceedings of the IEEE International Conference on Computer Vision (ICCV), Venice, Italy, 22–29 October 2017; pp. 5449–5457. [Google Scholar]
- He, K.; Zhang, X.; Ren, S.; Sun, J. Deep Residual Learning for Image Recognition. In Proceedings of the IEEE Conference on Computer Vision and Pattern Recognition (CVPR), Las Vegas, NV, USA, 27–30 June 2016; pp. 770–778. [Google Scholar]
- Wei, Y.; Yuan, Q.; Shen, H.; Zhang, L. Boosting the Accuracy of Multispectral Image Pansharpening by Learning a Deep Residual Network. IEEE Geosci. Remote Sens. Lett. 2017, 14, 1795–1799. [Google Scholar] [CrossRef]
- Yuan, Q.; Wei, Y.; Meng, X.; Shen, H.; Zhang, L. A Multiscale and Multidepth Convolutional Neural Network for Remote Sensing Imagery Pan-Sharpening. IEEE J. Sel. Top. Appl. Earth Obs. Remote Sens. 2018, 11, 978–989. [Google Scholar] [CrossRef]
- Jin, C.; Deng, L.-J.; Huang, T.-Z.; Vivone, G. Laplacian Pyramid Networks: A New Approach for Multispectral Pansharpening. Inf. Fusion 2022, 78, 158–170. [Google Scholar] [CrossRef]
- Cai, J.; Huang, B. Super-Resolution-Guided Progressive Pansharpening Based on a Deep Convolutional Neural Network. IEEE Trans. Geosci. Remote Sens. 2021, 59, 5206–5220. [Google Scholar] [CrossRef]
- Shao, Z.; Lu, Z.; Ran, M.; Fang, L.; Zhou, J.; Zhang, Y. Residual Encoder–Decoder Conditional Generative Adversarial Network for Pansharpening. IEEE Geosci. Remote Sens. Lett. 2020, 17, 1573–1577. [Google Scholar] [CrossRef]
- Liu, X.; Wang, Y.; Liu, Q. PSGAN: A Generative Adversarial Network for Remote Sensing Image Pan-Sharpening. IEEE Trans. Geosci. Remote Sens. 2020, 59, 10227–10242. [Google Scholar] [CrossRef]
- Ma, J.; Yu, W.; Chen, C.; Liang, P.; Guo, X.; Jiang, J. Pan-GAN: An Unsupervised Pan-Sharpening Method for Remote Sensing Image Fusion. Inf. Fusion 2020, 62, 110–120. [Google Scholar] [CrossRef]
- Liu, X.; Liu, Q.; Wang, Y. Remote Sensing Image Fusion Based on Two-Stream Fusion Network. Inf. Fusion 2020, 55, 1–15. [Google Scholar] [CrossRef]
- Wu, Z.C.; Huang, T.Z.; Deng, L.J.; Hu, J.F.; Vivone, G. VO+Net: An Adaptive Approach Using Variational Optimization and Deep Learning for Panchromatic Sharpening. IEEE Geosci. Remote Sens. 2022, 60, 1–16. [Google Scholar] [CrossRef]
- Liu, L.; Wang, J.; Zhang, E.; Li, B.; Zhu, X.; Zhang, Y.; Peng, J. Shallow–Deep Convolutional Network and Spectral-Discrimination-Based Detail Injection for Multispectral Imagery Pan-Sharpening. IEEE J. Sel. Top. Appl. Earth Obs. Remote Sens. 2020, 13, 1772–1783. [Google Scholar] [CrossRef]
- He, L.; Rao, Y.; Li, J.; Chanussot, J.; Plaza, A.; Zhu, J.; Li, B. Pansharpening via Detail Injection Based Convolutional Neural Networks. IEEE J. Sel. Top. Appl. Earth Obs. Remote Sens. 2019, 12, 1188–1204. [Google Scholar] [CrossRef]
- Benzenati, T.; Kessentini, Y.; Kallel, A.; Hallabia, H. Generalized Laplacian Pyramid Pan-Sharpening Gain Injection Prediction Based on CNN. IEEE Geosci. Remote Sens. Lett. 2020, 17, 651–655. [Google Scholar] [CrossRef]
- Hu, J.; Shen, L.; Sun, G. Squeeze-and-Excitation Networks. In Proceedings of the 2018 IEEE/CVF Conference on Computer Vision and Pattern Recognition, Salt Lake City, UT, USA, 18–23 June 2018; pp. 7132–7141. [Google Scholar]
- Woo, S.; Park, J.; Lee, J.-Y.; Kweon, I.S. CBAM: Convolutional Block Attention Module. arXiv 2018, arXiv:1807.06521. [Google Scholar]
- Hou, Q.; Zhou, D.; Feng, J. Coordinate Attention for Efficient Mobile Network Design. In Proceedings of the 2021 IEEE/CVF Conference on Computer Vision and Pattern Recognition (CVPR), Nashville, TN, USA, 20–25 June 2021; pp. 13713–13722. [Google Scholar]
- Su, X.; Li, J.; Hua, Z. Transformer-Based Regression Network for Pansharpening Remote Sensing Images. IEEE Trans. Geosci. Remote Sens. 2022, 60, 5407423. [Google Scholar] [CrossRef]
- Nie, Z.; Chen, L.; Jeon, S.; Yang, X. Spectral-Spatial Interaction Network for Multispectral Image and Panchromatic Image Fusion. Remote Sens. 2022, 14, 4100. [Google Scholar] [CrossRef]
- Ni, J.; Shao, Z.; Zhang, Z.; Hou, M.; Zhou, J.; Fang, L.; Zhang, Y. LDP-Net: An Unsupervised Pansharpening Network Based on Learnable Degradation Processes. IEEE J. Sel. Top. Appl. Earth Obs. Remote Sens. 2022, 15, 5468–5479. [Google Scholar] [CrossRef]
- Meng, X.; Xiong, Y.; Shao, F.; Shen, H.; Sun, W.; Yang, G.; Yuan, Q.; Fu, R.; Zhang, H. A Large-Scale Benchmark Data Set for Evaluating Pansharpening Performance: Overview and Implementation. IEEE Geosci. Remote Sens. 2021, 9, 18–52. [Google Scholar] [CrossRef]
- He, X.; Condat, L.; Bioucas-Dias, J.M.; Chanussot, J.; Xia, J. A New Pansharpening Method Based on Spatial and Spectral Sparsity Priors. IEEE Trans. Image Process. 2014, 23, 4160–4174. [Google Scholar] [CrossRef] [PubMed]
- Jiang, Y.; Ding, X.; Zeng, D.; Huang, Y.; Paisley, J. Pan-Sharpening With a Hyper-Laplacian Penalty. In Proceedings of the 2015 IEEE International Conference on Computer Vision (ICCV), Santiago, Chile, 7–13 December 2015; pp. 540–548. [Google Scholar]
- Choi, J.; Yu, K.; Kim, Y. A New Adaptive Component-Substitution-Based Satellite Image Fusion by Using Partial Replacement. IEEE Trans. Geosci. Remote Sens. 2011, 49, 295–309. [Google Scholar] [CrossRef]
- Ciotola, M.; Poggi, G.; Scarpa, G. Unsupervised Deep Learning-Based Pansharpening With Jointly Enhanced Spectral and Spatial Fidelity. IEEE Trans. Geosci. Remote Sens. 2023, 61, 5405417. [Google Scholar] [CrossRef]
- Yuhas, R.H.; Goetz, A.F.; Boardman, J.W. Discrimination among semi-arid landscape endmembers using the Spectral Angle Mapper (SAM) algorithm. In Proceedings of the 1992 JPL, Summaries of the Third Annual JPL Airborne Geoscience Workshop, Pasadena, CA, USA, 1–5 June 1992; Volume 1. [Google Scholar]
- Wald, L. Data Fusion: Definitions and Architectures: Fusion of Images of Different Spatial Resolutions; Presses Des MINES: Paris, France, 2002. [Google Scholar]
- Alparone, L.; Aiazzi, B.; Baronti, S.; Garzelli, A.; Nencini, F.; Selva, M. Multispectral and Panchromatic Data Fusion Assessment Without Reference. ASPRS J. Photogramm. Eng. Remote Sens. 2008, 74, 193–200. [Google Scholar] [CrossRef]
- Wang, Z.; Bovik, A.C. A Universal Image Quality Index. IEEE Signal Process. Lett. 2002, 9, 81–84. [Google Scholar] [CrossRef]
- Zhou, J.; Civco, D.L.; Silander, J.A. A Wavelet Transform Method to Merge Landsat TM and SPOT Panchromatic Data. Int. J. Remote Sens. 1998, 19, 743–757. [Google Scholar] [CrossRef]
Disclaimer/Publisher’s Note: The statements, opinions and data contained in all publications are solely those of the individual author(s) and contributor(s) and not of MDPI and/or the editor(s). MDPI and/or the editor(s) disclaim responsibility for any injury to people or property resulting from any ideas, methods, instructions or products referred to in the content. |
© 2023 by the authors. Licensee MDPI, Basel, Switzerland. This article is an open access article distributed under the terms and conditions of the Creative Commons Attribution (CC BY) license (https://creativecommons.org/licenses/by/4.0/).