Article

Evaluation of GSMaP Version 8 Precipitation Products on an Hourly Timescale over Mainland China

1
School of Geography and Tourism, Qufu Normal University, Rizhao 276800, China
2
Sino-Belgian Joint Laboratory of Geo-Information, Urumqi 830011, China
3
Sino-Belgian Joint Laboratory of Geo-Information, 9000 Ghent, Belgium
4
State Key Laboratory of Desert and Oasis Ecology, Xinjiang Institute of Ecology and Geography, Chinese Academy of Sciences, Urumqi 830011, China
5
Department of Geography, Ghent University, 9000 Ghent, Belgium
*
Author to whom correspondence should be addressed.
Remote Sens. 2024, 16(1), 210; https://doi.org/10.3390/rs16010210
Submission received: 13 November 2023 / Revised: 26 December 2023 / Accepted: 2 January 2024 / Published: 4 January 2024

Abstract

:
A thorough evaluation of the recently released Global Satellite Mapping of Precipitation (GSMaP) is critical for both end-users and algorithm developers. In this study, six products from three versions of GSMaP version 8, including real time (NOW-R and NOW-C), near real time (NRT-R and NRT-C), and post-real time (MVK-R and MVK-C), are systematically and quantitatively evaluated based on time-by-time observations from 2167 stations in mainland China. Among each version, both products with and without gauge correction are adopted to detect the gauge correction effect. Error quantification is carried out on an hourly timescale. Three common statistical indices (i.e., correlation coefficient (CC), relative bias (RB), and root mean square error (RMSE)) and three event detection capability indices (i.e., probability of detection (POD), false alarm ratio (FAR), and critical success index (CSI)) were adopted to analyze the inversion errors in precipitation amount and precipitation event frequency across the various products. Additionally, in this study, we examine the dependence of GSMaP errors on rainfall intensity and elevation. The following main results can be concluded: (1) MVK-C exhibits the best ability to retrieve rainfall on the hourly timescale, with higher CC values (0.31 in XJ to 0.47 in SC), smaller RMSE values (0.14 mm/h in XJ to 0.99 mm/h in SC), and lower RB values (−4.78% in XJ to 16.03% in NC). (2) Among these three versions, the gauge correction procedure plays a crucial role in reducing errors, especially in the post-real-time version. After being corrected, MVK-C demonstrates an obvious CC value improvement (>0.3 on the hourly timescale) in various sub-regions, increasing the percentage of sites with CC values above 0.5 from 0.03% (MVK-R) to 28.47% (MVK-C). (3) GSMaP products generally exhibit error dependencies on precipitation intensity and elevation, particularly in areas with drastic elevation changes (such as 1200–1500 m and 3000–3300 m), where the accuracy of satellite precipitation estimates is significantly affected. (4) CC values decreased with an increasing rainfall intensity; RB and RMSE values increased with an increasing rainfall intensity. The results of this study may be helpful for algorithm developers and end-users and provide a scientific reference for different hydrological applications and disaster risk reduction.

1. Introduction

Precipitation is a critical component of the hydrological cycle, with direct impacts on natural ecosystems, water resource allocation and utilization, disaster monitoring, and other aspects [1,2]. Accurate monitoring of precipitation is essential for socioeconomic development and human survival [3,4]. Traditional ground-based rain gauges work by directly measuring the total amount of rainfall that falls on the ground with a high accuracy and applicability, allowing for easy data transmission and providing a high temporal resolution. However, limitations include insufficient spatial representativeness, difficult and costly data collection, inconsistent monitoring instruments and data quality, and other existing issues [5].
To address the aforementioned issues, researchers have used various methods to obtain more widely distributed precipitation data, such as radar detection [6,7], numerical simulation, and satellite remote sensing [8]. Compared to meteorological station observations, weather radars can detect precipitation within their radiation range with a wider coverage and a high resolution [9]. However, observations based on radar are highly affected by terrain and their coverage is still very limited. In addition, the construction of a weather radar station is costly [10]. Numerical simulations establish a predictive model based on physical mechanisms and the interaction of various meteorological elements in the atmosphere. However, these models are often influenced by many factors, such as physical mechanisms, initial conditions, and model parameters, making it difficult to accurately predict ground precipitation [11,12].
Satellite precipitation estimates (SPEs) have the advantages of a wide coverage, a high temporal resolution, and multi-source fusion, and are less affected by weather conditions [13]. Additionally, satellite precipitation sensors are the only means to achieve comprehensive near-real-time coverage of the Earth [13]. However, different satellite precipitation estimations have different characteristics regarding their retrieval algorithms, sensors, spatiotemporal resolution, and coverage area [13]. Although in recent years the continuous updates and improvements of global satellite precipitation data products have led to an increased accuracy and reliability for practical applications [14,15,16], the estimated precipitation values obtained through SPEs are still subject to errors and uncertainties [16,17]. Therefore, accuracy verification is necessary before using SPEs to ensure data reliability.
In 2014, the Global Precipitation Mission (GPM) was implemented, which carried a more advanced dual-frequency precipitation radar (DPR) and a GPM microwave imager (GMI) to more accurately detect solid and trace precipitation (<0.5 mm/h) [18,19]. GSMaP is a high-resolution global precipitation product developed by the Japan Aerospace Exploration Agency (JAXA) under the GPM program. It integrates GPM satellite sensor observation data and continually improves the fusion inversion algorithm based on TRMM to enhance the accuracy and spatiotemporal resolution of the data [20,21]. In December 2021, JAXA released Global Satellite Mapping of Precipitation Version 8 (GSMaP V8), with many new features. These features include the expansion of the data retrieval scope to the global level in the new version’s passive microwave (PMW) algorithm, better inversion of strong terrain rainfall, adoption of a new normalization module to homogenize rainfall estimates, and implementation of histogram matching to reduce errors based on PMW and infrared echo detection [22]. Kubota, Aonashi, Ushio, Shige, Yamaji, Yamamoto, Hirose, and Takayabu [22] reported improved results after preliminary verification using ground radar data adjusted for rain gauges in Japan’s land areas. GSMaP satellite precipitation data products are divided into three versions (i.e., real-time, near-real-time, and post-real-time versions) based on the length of the data inversion lag time and the different input data resources used by the algorithms. Different versions of products are designed to meet the needs of different applications. For example, the spatiotemporal changes in instant extreme weather events such as typhoons and floods need real-time or near-real-time data with a shorter inversion latency [23,24]. However, due to the time costs of the inversion algorithm and the collection and processing of different input data, the near-real-time version often only contains limited input data. This limitation results in more universal errors and uncertainties compared to post-real-time satellite precipitation product data [18,19].
These GSMaP products with different input data sources, retrieval algorithms, and correction technologies may have different performances [25]. Therefore, accuracy validation is necessary before applying different versions of GSMaP products in hydro-meteorological research. Liu et al. [26] compared the performance of NRT-R and NOW-R in capturing the Henan rainstorm event and found that NRT-R performed better than NOW-R. Mega et al. [21] compared NRT-R, MVK-R, and MVK-C in Japan and found that the RMSE of these three products gradually decreased. Hsu et al. [27] compared NRT-R and NRT-C in Taiwan, and Chen et al. [28] validated MVK-R and MVK-C in China and confirmed that the gauge correction algorithm used in the MVK-C system effectively reduced the systematic bias of MVK-R under various terrain conditions. However, on the hourly scale, few studies have focused on the intercomparison between the in three GSMaP versions with different latency times.
Currently, numerous scholars at home and abroad have conducted extensive error evaluations of different versions of GSMaP products in various regions and at different timescales. Based on existing research (Table A1), on the one hand, most studies tend to focus on exploring the NRT-R, MVK-R, and MVK-C products. MVK-C has a relatively low relative average error [29,30] and performs well at various altitudes [18], while NRT-R tends to exaggerate the intensity of floods [31], often missing mild or moderate rainfall events, leading to errors in the assessment of total rainfall scores [32]. It also has significant elevation-angle-related errors [18], but has a high accuracy in detecting typhoon precipitation [33]. NRT-C performs better than NRT-R and is a more reliable near-real-time satellite precipitation product [34], and both NOW-R and NRT-C have some predictability for flood events [35]. On the other hand, the time resolution of GSMaP products is 0.5 h or 1 h. Most studies tend to focus on daily or monthly scales, and few studies have focused on the error characteristics on sub-daily timescales (e.g., hourly). Further, with the continuous updates of GSMaP, the error characteristics of the six precipitation products from the three versions still remain unclear.
Based on hourly precipitation data from 2167 ground stations in mainland China, this study aims to systematically and quantitatively evaluate the precipitation inversion and event-capturing ability of six products from the three versions of GSMaP V8. To compare the results with existing research, we conducted error evaluations of GSMaP V8 on both hourly and daily timescales. The results can help us better understand the applicability and limitations of SPEs in mainland China and provide scientific support for end-user data selection, algorithm upgrades, and improvements of the products.
The rest of this paper is organized as follows: Section 2 describes the data and methods used in the study, including the study area, datasets, and methods. Section 3 evaluates the spatiotemporal accuracy of different GSMaP products at different timescales. Section 4 is the discussion section. Section 5 summarizes the main research results of this paper.

2. Data and Methodology
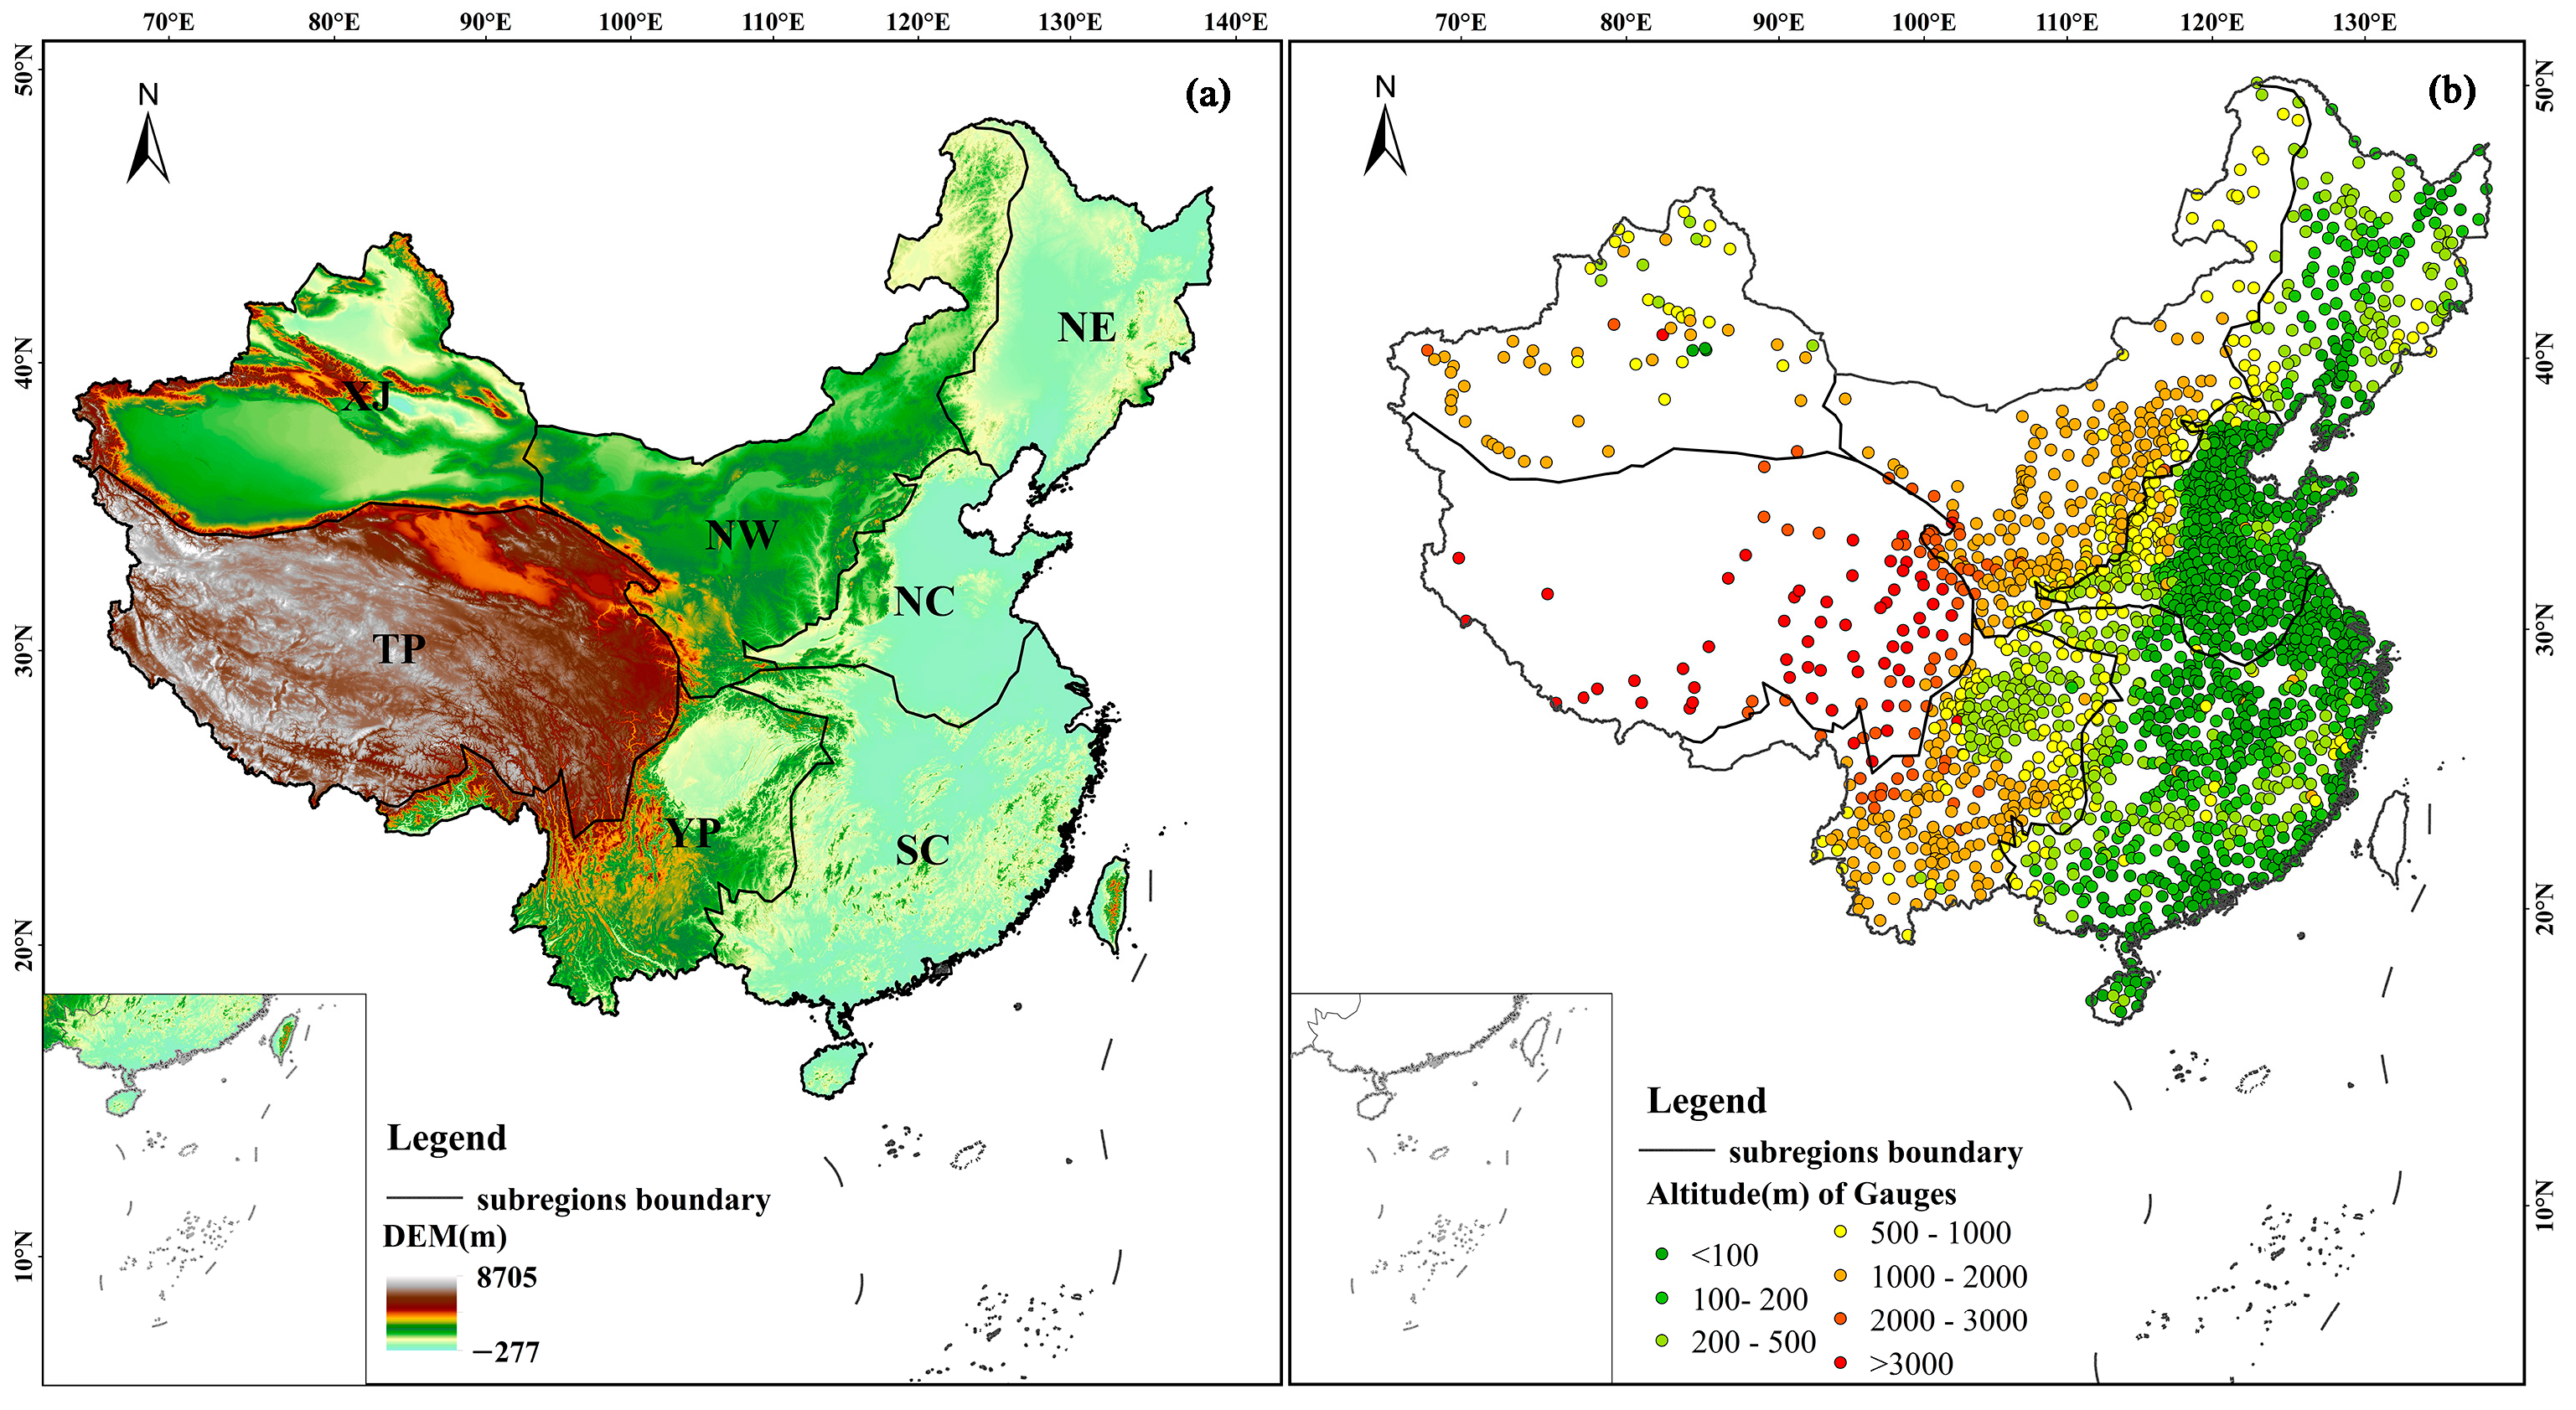
2.1. Study Area

Mainland China is located in eastern Asia (between 73°33′ and 135°05′E and 3°51′ and 53°33′N). Mainland China’s topography is both intricate and diverse, characterized by a stepped distribution from west to east. The eastern regions feature a relatively flat terrain, whereas the western areas present more complex landscapes [36,37]. Rainfall is abundant along the southeast coast of China and gradually decreases as it moves inland to the northwest. Based on the previous literature [38,39], considering factors such as elevation, mountain ranges, and annual cumulative precipitation, this research divides mainland China into seven distinct sub-regions (Figure 1), including in-land Xinjiang (XJ), the Qinghai–Tibetan Plateau (TP), northwestern China (NW), northeastern China (NE), northern China (NC), southeastern China (SC), and the Yungui Plateau (YP). Meteorological observation stations are densely concentrated in the southeastern region, while they are sparser in the northwest [40]. These stations supply a substantial volume of measured precipitation data, which establishes favorable objective conditions for further validating the precision and dependability of the SPEs [18].

2.2. Datasets

2.2.1. Ground Reference Dataset

Hourly observation data from surface meteorological stations were obtained from the China Meteorological Data Service Centre (CMDC, http://data.cma.cn, accessed on 1 January 2023). This product provides various meteorological elements, including temperature, pressure, humidity, wind, and precipitation. All precipitation data from the stations underwent rigorous quality control, including screening for extreme values, internal consistency checks, spatial consistency filtering, and missing value detection [40]. Hourly precipitation data from December 2021 to November 2022 were selected from the observation data. A total of 2167 stations without missing data were used to validate the accuracy of the GSMaP precipitation product. It should be noted that the evaluation is not completely independent. This is due to the utilization of daily observations from about 700 gauges within the NOAA CPC Unified Gauge-Based Analysis of Global Daily Precipitation’s dataset in producing NOW-C, NRT-C, and MVK-C. However, these correction algorithms operate on a daily scale; their potential impact on the evaluation results may be somewhat constrained.

2.2.2. Satellite-Based GSMaP Products

GSMaP is a project proposed by JAXA [41] (https://www.gportal.jaxa.jp, accessed on 1 January 2023). This project provides high-quality near-real-time global precipitation data products with a spatial resolution of 0.1 degrees (~10 km) and coverage of nearly the entire globe (60°S–60°N). In order to obtain a higher spatial and temporal resolution of precipitation, the GSMaP product incorporates data from several satellite sensors including passive microwave sensors and infrared radiometers. To meet the needs of different users, GSMaP has three versions: real time, near real time, and post-real time. Each version contains two products which are uncorrected and corrected by ground-based observations, including GSMaP real-time products (referred to as NOW-R and NOW-C for brevity), near-real-time products (referred to as NRT-R and NRT-C for brevity), and post-real-time products (referred to as MVK-R and MVK-C for brevity). General characteristics, like name, delay time, spatiotemporal resolution, and other information, of the used GSMaP data are listed in Table 1. The specific introduction of GSMaP products for each version is as follows:
GSMaP incorporates passive microwave (PMW) [42] retrievals provided by the Climate Prediction Center (CPC) and infrared retrievals based on a microwave-infrared joint algorithm [43], which includes back and forward deformation techniques and Kalman filtering. PMW retrievals include the GPM microwave imager, advanced microwave scanning radiometer (AMSR), advanced microwave scanning radiometer for EOS (AMSR-E), and special sensor microwave/imager (SSM/I).
NOW-R (Global Rainfall Map, Real-time version) uses passive microwave observations (GMI, AMSR2, and AMSU direct reception data near Japan) from the past half hour and extrapolates the rainfall data in the future using cloud motion vectors from geostationary satellites, allowing users to estimate real-time hourly precipitation maps every half hour. To further improve the accuracy of NOW-R, the GSMaP team performs error correction based on statistical parameters of ground rain gauges from the past 30 days [21,27,44], resulting in the NOW-C product which is a gauge-corrected version.
NRT-R (Global Rainfall Map in Near Real Time) [32,43] calculates cloud motion vectors based on consecutive geostationary infrared images, propagates the precipitation rate forward in time, and then corrects the precipitation rate using Kalman filtering immediately after receiving raw data. It is a near-real-time precipitation product with a time lag of about 2 h. Based on NRT-R, the NRT-C product is further corrected using statistical parameters of ground rain gauges from the past 30 days. The gauge correction procedure is the same as that of NOW-R.
MVK-R [43] (Global Satellite Mapping of Precipitation Microwave–IR Combined Product) integrates passive microwave radiometer data and infrared radiometer data and uses Kalman filtering techniques to merge more satellite data to improve the precipitation estimation accuracy. Compared to NRT-R, MVK-R has a higher precipitation estimation accuracy but a lower real-time performance, with a time lag of about 3 days [21]. To further improve the precipitation accuracy, the MVK-C product is obtained by correcting precipitation errors using the global-scale CPC daily precipitation product provided by the NOAA [21]. By incorporating ground observation data into the precipitation estimation process, the MVK-C product can better capture spatial and temporal changes in ground precipitation [28].
More detailed information about GSMaP can be found in the “JAXA GLOBAL RAINFALL WATCH User’s Guide” at https://sharaku.eorc.jaxa.jp/GSMaP/guide.html (accessed on 1 January 2023).

2.3. Validation Methods

Multiple statistical evaluation indicators were selected to assess the precipitation estimation capabilities of the three versions and six precipitation products of GSMaP at different timescales. These indicators can be divided into two categories: precipitation amount indicators and categorical indicators. Precipitation amount indicators reflect the degree of agreement and error characteristics of precipitation amounts between SPEs and ground observation data at different timescales, and include the Pearson correlation coefficient (CC), relative bias (RB), and root mean square error (RMSE). The CC represents the consistency between SPEs and ground observation data, with values ranging from −1 to 1. The RB describes the systematic deviation between SPEs and ground observation data. The RMSE is used to evaluate the overall error and accuracy of SPEs, with values ranging from 0 to +∞. Categorical indicators reflect the ability of SPEs to capture precipitation events, including the probability of detection (POD), false alarm ratio (FAR), and critical success index (CSI) [45]. The values of all categorical indicators range from 0 to 1. The POD represents the ability of satellite precipitation data to accurately capture actual precipitation events. The FAR reflects the false precipitation event detection of satellite precipitation data. The CSI is a function of the POD and FAR and represents the overall proportion of precipitation events correctly detected by SPEs [46]. The calculation method of each indicator and their optimal values are shown below (Table 2) [46,47].

3. Results

3.1. Accuracy Evaluation of GSMaP at Hourly Timescales

To investigate the fitting degree of satellite precipitation data to precipitation variation measured by surface meteorological stations at the hourly timescale, the precipitation amount statistics (i.e., CC, RB, and RMSE) were calculated at each gauge point and then shown as boxplots for the seven sub-regions in mainland China (Figure 2).
Overall, the error performance of MVK-C is superior to other products, boasting higher CC values (from 0.31 in XJ to 0.47 in SC), smaller RMSE values (from 0.14 mm/h in XJ to 0.99 mm/h in SC), and smaller RB values (from −4.78% in XJ to 16.03% in NC). In contrast, NOW-R demonstrates the poorest performance, with lower CC values (from 0.08 in XJ to 0.24 in SC), higher RMSE values (from 0.50 mm/h in XJ to 2.55 mm/h in SC), and higher RB values (from 68.70% in NE to 288.74% in XJ).
As expected, the three algorithm versions performed significantly differently, with the post-real-time version of the product performing the best, followed by the near-real-time version and the real-time version performing the worst. Regarding the CC, the six SPEs generated by the three algorithms exhibit consistent trends in CCs across the seven sub-regions, generally displaying low CC values. MVK-C has the highest CC values (0.31–0.47), followed by MVK-R (0.18–0.33), NRT-C (0.15–0.34), and NRT-R (0.18–0.33). However, NOW-C (0.08–0.27) and NOW-R (0.16–0.24) possess the lowest CC values. Among these, MVK-R, NRT-R, and NRT-C perform similarly, with the difference in CC values between regions being less than ± 0.01. In terms of the RB, significant precipitation overestimation is observed for all products, especially for the real-time version. Compared to the real-time version, the near-real-time version and the post-real-time version exhibit relatively fewer overestimations. In detail, NOW-C and NOW-R have high RB values, with mean values ranging from 60 to 300% across regions. This phenomenon indicates that these two products have the most significant amount of overestimations of precipitation. The overall trend in the RMSE values in different regions is opposite to the CC values, which vary from 0.17 to 2.69 mm/h in different regions.
The differences were compared between regions. Based on the RB values, SPEs perform relatively better in the NE region (Figure 2e), SC region (Figure 2k), and YP region (Figure 2q). For example, the mean RB values of MVK-C, MVK-R, NRT-C, and NRT-R are all within ±10% (Table A2). Of course, the performance of SPEs varies across different regions; for example, in region XJ, all SPEs perform poorly (e.g., RB values up to 96.38% for MVK-R and 88.09% for NRT-R). Based on the CC values, the SPEs perform best in the SC region (Figure 2a) (the mean value of SPEs can reach more than 0.32) and the worst in the XJ region (Figure 2s) (the mean value of SPEs is around 0.16), and the most significant corrective effect is found in the NC region (Figure 2j) in comparison with the other six regions. Based on the RMSE values, the corrections are better in the NW region (Figure 2i), TP region (Figure 2o), and the worst in NE region (Figure 2f), and the real-time and near-real-time versions even exhibit an increase in errors after correction.
To analyze the performance of gauge correction procedures in different algorithms, we compared the performance of two versions (uncorrected and corrected by ground-based observations) of the product using the same algorithm. Through this analysis, it was found that the SPE with ground gauge correction had an improved accuracy, higher CC values, and significantly lower RB and RMSE values.
There were significant differences in the ability of the gauge correction program to correct errors in the different algorithms. The most significant improvement in accuracy was seen in the post-real-time algorithm products (MVK-R and MVK-C), where measured daily rainfall data from CPC sites were used for error correction in the MVK-C product. Except for the YP region (Figure 2p), the average CC value of MVK-C in the remaining sub-regions is higher than the CC value of corresponding MVK-R by more than 0.1. Meanwhile, the average RB values in the corrected NC region (Figure 2b), NW region (Figure 2h), TP region (Figure 2n), and XJ region (Figure 2t) are also significantly decreased, and this decrease is more than 25% in each region. For example, the RB value of MVK-R in the NW region (Figure 2h) decreases from 56.42% to 11.35% in MVK-C. However, the gauge correction procedure did not produce positive results in all regions. For example, in the NE region (Figure 2e), SC region (Figure 2k), and YP region (Figure 2q), the mean RB values of the post-real-time version not only did not decrease but also increased after calibration. The increase in the RB value of the corrected SPE (MVK-C) reached about 4% compared to the uncorrected SPE (MVK-R).
In the case of near-real-time versions, the gauge correction algorithm is effective in reducing the overestimation error present in NRT-R. As some examples, the average RB value decreased by 6.10% in the YP region (Figure 2q) and 107.24% in the XJ region (Figure 2t), and the average decrease in the RMSE value of NRT-C compared to NRT-R is about 0.053 mm/h for all regions. However, in the NE region (Figure 2h) and the SC region (Figure 2k), the RB value increases slightly for NRT-C (corrected product).
For real-time versions, the correction effect of CC values is similar to that of the near-real-time versions. The RB values show a decreasing trend in the NW region (Figure 2h), TP region (Figure 2n), and XJ region (Figure 2t), with decreases in the corrected values of 0.19%, 11.91%, and 212.57%, respectively. The RMSE values were reduced by an average of 0.0025 mm/h. The real-time version has the best timeliness, but this also implies at the same time a streamlining of the algorithm, which directly leads to a loss of about 0.07 in the CC value of the data.
Figure 3 shows the spatial distribution of the three metrics (CC, RB, and RMSE) on an hourly scale between 2167 stations and satellite precipitation products in mainland China. Overall, the metrics show obvious regional characteristics, with large differences in the southeast and northwest. Figure A1 shows the Probability Density Function (PDF) of CC, RB, and RMSE for each product and clearly presents the distribution of each product in terms of CC, RB, and RMSE to help us quantitatively understand Figure 3.
Spatially, it is affected by factors such as topography, climate change, and precipitation. The significance of the CC values decreased gradually from east to west and from south to north. The correction procedure is well represented in the post-real-time version. MVK-C (Figure 3d) has the highest CC values and the most significant correction effect in mainland China. However, in the real-time and near-real-time versions, the correction procedure had a limited effect. In Figure A1, the peak of the CC in post-real time versions (Figure A1a,d) is shifted to the right, which is consistent with what the spatial distribution map exhibits, whereas the shift in the peak CC in real-time versions (Figure A1g,j) and near-real-time versions (Figure A1m,p) is not obvious.
The spatial distribution patterns of the RMSE and CC values are similar, being higher in the southeast and lower in the northwest. The performance between the different products shows significant differences; taking 1.5 mm/h as the threshold, only 30% (Figure A1) of the sites have RMSE values below 1.5 mm/h for NOW-C (Figure 3r) and NOW-R (Figure 3o), whereas more than 80% (Figure A1) of the sites for the other four products have values within this threshold range. Here, NOW-C and NOW-R present significant errors, consistent with the results presented in Figure 2 and Figure A1.
Based on the RB values, NOW-C (Figure 3q) and NOW-R (Figure 3n) showed a general overestimation, while the other four products produced more underestimations in the southern region and overestimations in the northern region. Among the SPEs, MVK-C (Figure 3e) has the smallest RB value, with 45.22% (Figure A1e) of the sites within ±10%, followed by NRT-C (Figure 3k), with 32.53% (Figure A1k) of the sites within this range. NOW-R and NOW-C show a significant decline, with only 0.026% and 0.007% of values within this range. The RB values show overestimation in most regions, especially in regions with sharp elevation increases or decreases, where the number of overestimated sites increases significantly. MVK-C (Figure 3b) effectively corrects the overestimation of MVK-R (Figure 3b) in the northern part of SC, the western part of the NC zone, and most of XJ, but there are still localized areas of low correlation (e.g., the southern part of the YP, the southern part of SC). However, NOW-R is corrected for an elevated overestimation in the SC region, which is consistent with the results in Figure 2. Interestingly, all SPEs in YP area were underestimated.
To more directly and objectively compare and analyze the differences in the accuracy characteristics of the six precipitation products of the three GSMaP algorithms, the CC, RMSE, and STD (standard deviation) were calculated based on the hourly precipitation data measured at the meteorological stations, which are expressed in Figure 4. The root coordinate of the plot represents the magnitude of the STD value (black dashed line), the corner coordinate represents the CC value (yellow dashed line), and the blue dashed line represents the RMSE value. The closer the point representing the SPE is to the standard point labeled in the red circle, the higher the accuracy of its reflection.
According to the results shown in the Taylor diagrams, there are obvious differences among the three types of algorithms, with the post-real-time version performing the best, followed by the near-real-time version, and the real-time version performing the worst. Among products utilizing the same algorithm, the post-real-time version has the most effective gauge correction, whereas the gauge correction effect of the near-real-time and real-time versions is relatively similar before and after correction, consistent with the results presented in Figure 2. Overall, MVK-C performs the best among the six products, and the distance between MVK-C and the station data in the Taylor diagram is much closer than that of other products. MVK-R, NRT-R, and NRT-C are located relatively close to each other except for the XJ region, indicating that their associated metrics (i.e., CC, RMSE, and STD) perform similarly. NOW-C and NOW-R perform worse than the other products in all regions.
The CC values between SPEs and station data are not significant in different regions, which may be due to the limited resolution and accuracy of SPEs to accurately capture heavy precipitation variations on hourly scales. The RMSE values all range from 0.12 mm/h to 10.18 mm/h, and this value is affected by precipitation and observation conditions. However, surprisingly, in the NE, SC, and TP regions, the performance of NOW-R is better than that of NOW-C, which may be due to the excessive correction of ground rain gauges [48]. It is worth noting that in the XJ (Figure 4g) region, the accuracy of all corrected data is better than that of uncorrected data, which shows the necessity of SPEs for correcting algorithms at the XJ region’s sites.
Figure 5 displays the scatter density plots of the six different products’ rainfall data in mainland China. The x-axis in each subplot represents ground station data, while the y-axis represents the values of the six SPEs. Bright yellow indicates a high density, and deep blue indicates a low density. We observe that scatter points generally cluster around 0.01 mm/h to 0.1 mm/h, particularly in NRT-R (Figure 5c). Around 0.2 mm/h to 0.3 mm/h, there are some outliers, distributed on both sides of the standard baseline in near real-time versions (Figure 5c,d) and post-real-time versions (Figure 5a,b), with most above the standard baseline in real-time versions (Figure 5e,f). Overall, in mainland China, near real-time versions (Figure 5c,d) and post-real-time versions (Figure 5a,b) show good consistency with station data, with CC values exceeding 0.85 and an RB between 5% and 13%. Real-time data (Figure 5e,f) also exhibit CC values above 0.8, with RB values of 108.91% and 128.00%, indicating a notable overestimation. Station corrections within the same product version are well represented. Comparing MVK-R with MVK-C, post-correction CC values increased from 0.86 to 0.96, RB values decreased from 12.99% to 5.59%, and RMSE values decreased from 0.03 mm/h to 0.01 mm/h, with MVK-C scatter points closer to the standard baseline (Figure 5b). Comparing NRT-R with NRT-C, CC values increased from 0.85 to 0.88, RB values decreased from 12.56% to 9.77%, and RMSE values remained unchanged. ComparingIW(R) with NOW-C, although the RB and RMSE values did not significantly improve after correction, CC values increased from 0.80 to 0.85. Additionally, we observe that MVK-R, NRT-R, and NRT-C exhibit similar indicators and scatter distributions, consistent with the results in Figure 4.

3.2. The Ability to Capture Hourly Scale Precipitation Events

The ability of SPEs to capture hourly scale precipitation events in different regions was evaluated based on categorical indicators (i.e., POD, FAR, and CSI) (Figure 6). Overall, SPEs have a limited ability to accurately capture actual precipitation events from satellite precipitation data on an hourly scale, generally ranging from 0.22 to 0.77, a finding that is consistent with the results of previous studies [5,28,49,50]. Meanwhile, there are more precipitation misreporting phenomena, and the FAR values are all greater than 0.43. The event detection ability is limited, and the CSI values are generally around 0.2, with the highest value not exceeding 0.35.
A comparison of the different regions showed that the POD and CSI values decreased gradually from east to west, while the opposite was true for the FAR. Specifically, in the eastern regions (NC, NE, NW, and SC), the POD generally remained around 0.4, FAR values ranged from 0.35 to 0.75, and CSI values ranged from 0.2 to 0.35. In the western regions (TB, TP, and XJ), the overall values of POD and CSI decreased by about 0.1 and the FAR increased by about 0.2. This phenomenon may be related to the topographic complexity and the density of stations. The SPEs are most capable of recognizing precipitation events in the SC region, where the six satellite precipitation products have high CSI (>0.25) and POD (average POD > 0.4) values and low FAR values. The obvious advantage of SPEs in SC may be related to the fact that, on the one hand, remote sensing satellites are more likely to capture high-intensity precipitation events and can easily ignore low-intensity precipitation [51,52], and on the other hand, the ground stations in SC are more densely distributed and the sample size is higher than that in other regions (Figure 1).
A comparison of the performance of two products of the same algorithm in SPEs (uncorrected SPE and corrected SPE) reveals that the POD values (Figure 6a) of the ground-station-corrected products have improved. This suggests that the ground-gauge-corrected algorithm helps improve the product’s ability to capture precipitation events, which is largely attributed to the improvement in missed precipitation events. This performance is most prominent in the TP and YP regions (Figure 6a) with more complex terrains, where the POD value of MVK-C is more than twice the POD value of MVK-R. Except for MVK-C, the other satellite precipitation products (near-real-time and real-time versions) show less fluctuation in the POD values in different regions. It is noteworthy that there are signs of elevated FAR values in the precipitation products corrected by ground stations (Figure 6b), and this phenomenon may be related to the following two aspects: the gauge correction algorithm focuses on rainfall correction, which is performed using the statistical parameters of the ground-observed rainfall over the past period, which ignores the issue of the frequency of rainfall events.

3.3. Error Dependence on Elevation and Precipitation Intensity

Based on the results of previous sections, we found that error characteristics of GSMaP SPEs seem to be related to the changes in elevation and precipitation intensity. Therefore, this section analyzes the dependence of precipitation product errors on altitude (Figure 7) and precipitation intensity (Figure 8), respectively.
Overall, the CC values (Figure 7a) between SPEs and gauge observations decrease as the altitude increases. When there was a significant increase/decrease in altitude, the CC values simultaneously showed a significant increase/decrease. Specifically, the CC values of all SPEs showed a decreasing trend from 0 m to 2400 m. The slope of the decrease in CC values of MVK-C, NOW-R, and NOW-C is larger than that of MVK-R, NRT-R, and NRT-C between 0 m and 2400 m. When the altitude was greater than 3300 m, the CC values decreased with increasing altitude, which may be due to the limited sample size at high altitudes.
Similar to the CC, the RMSE values for SPE (Figure 7c) exhibit a general decreasing trend at 1200–1500 m and 3000–3300 m where the elevation increases sharply. This temporal variation is more easily observed in the post-real-time versions (NOW-R and NOW-C) from 2700 m to 3300 m.
Between 600 m and 1500 m, it can be observed that the uncorrected SPEs (MVK-R, NRT-R, and NOW-R) show an increasing overestimation magnitude, evidenced by the increasing positive RB values in Figure 7b. After correction, the elevation-dependent overestimation phenomenon is mitigated in the corrected SPEs (MVK-G, NRT-C, NOW-C).
From 1500 m to 2400 m, the RB values of SPEs gradually decrease and fluctuate slightly. The RB values of SPEs (except MVK-C) suddenly increase in the range of 2400–3000 m and then decrease sharply in the range of 3000–3300 m, with the decrease ranging from 50% for NRT-C to 90% for NOW-R. The reason for this phenomenon may be that most of the stations between 2400 and 3300 m are located in the eastern part of the Tibetan Plateau, where there is a sharp increase in altitude. The good performance of MVK-C in the range of 2400–3300 m suggests that the gauge correction program plays a role in correcting altitude-dependent precipitation errors. At high altitudes (3300–4800 m), the RB values generally show an increasing trend, especially for NOW-C, where the RB values increase by more than 50%.
As shown in Figure 8, when the rainfall intensity is less than 1 mm/h, the CC value of the SPE decreases as the rainfall intensity increases, while the RB and RMSE values show an increasing trend. When the rainfall intensity is between 3 mm/h and 6 mm/h, although the CC values decrease with increasing rainfall intensity, the magnitude of the decrease is small. Meanwhile, RB and RMSE values continue to increase, and this phenomenon may be attributed to the limited number of samples with rainfall greater than 3 mm/h. All corrected products outperform the uncorrected products across various rainfall intensities. Among them, MVK-C product exhibits the most significant improvement, while NRT-C and NOW-C show limited improvement compared to their respective uncorrected SPEs (NRT-R and NOW-R).
Specifically, the performance of SPEs varies at different rainfall intensities, with MVK-C showing superiority at most rainfall intensities, having the highest CC and the lowest RMSE and RB. This is particularly evident when the rainfall intensity exceeds 2 mm/h, as MVK-C effectively corrects the overestimation of the RB. In terms of the CC, RMSE, and RB, MVK-R, NRT-R, and NRT-C perform similarly at different rainfall intensities. However, across different metrics, NRT-C consistently demonstrates a superior calibrated product, especially in terms of reducing the overestimation of the RB compared to MVK-R and NRT-R. NOW-R and NOW-C exhibit poor performances across all rainfall intensities.

4. Discussion

4.1. Performance Comparison between Hourly and Daily Scales

Based on meteorological station data, in this study, we conducted a systematic quantitative evaluation of the datasets of the three versions of the GSMaP product’s algorithms on the hourly scale in mainland China. The main reason for choosing an hourly scale is that hourly scale data are important for monitoring precipitation sub-daily scale precipitation changes; they are also important data for rapid flooding and wet/dry change studies [30,53,54].
We discuss the performance of the GSMaP product on the daily scale to check the consistency of GSMaP’s performance on different timescales on the one hand and to facilitate a comparison with the results of existing daily scale evaluation studies on the other hand.
Here, we compare the SPEs by their ability to capture both rainfall amount and rainfall frequency. In terms of rainfall amount, compared with the hourly scale, we find that all versions of GSMaP have an overall higher reliability and stability on the daily scale, a phenomenon that is consistent with the findings of many previous studies [18,55,56]. Specifically, firstly, compared with the hourly scale, the CC values of the GSMaP products in the daily scale are all improved with an increase of more than 0.2, and the differences in CC values between different products become larger (Figure 9). The trend in the STD and RMSE values among products is the same as that at the hourly scale. Secondly, on the daily scale, MVK-C is still the best performer among all the products, with high CC values (0.54 in XJ to 0.73 in TP), low RMSE values (3.74 in XJ to 13.08 in NC), and STD values closer to the actual observations. Third, the corrected product outperforms the uncorrected product in the different versions of the algorithm, and we find that the error correction is better on the daily scale than on the hourly scale, with a larger CC value improving more. In the post-real-time version (MVK-R and MVK-C), MVK-C is significantly better than MVK-R, which suggests that the post-real-time version has a better error correction effect. However, this correction effect is not found in the near-real-time version and the real-time version, suggesting a limited correction effect in these versions. On the regional scale and on the daily scale, MVK-R, NRT-R, and NRT-C performances are still very similar, except for in the XJ region. However, compared to the hourly scale, the variability between the MVK-R product and the other two products has increased. On the daily scale, the overcorrection in the real-time version is more significant, and the NOW-R product outperforms NOW-C in all regions except TB (Figure 9e) and XJ (Figure 9g). In addition, although the SPEs show a more pronounced differentiation in all regions (Figure 9), the differentiation in the XJ region (Figure 9g) was the strongest.
In terms of the ability to capture precipitation frequency, the ability to identify precipitation events for each version of the algorithm’s SPEs on the daily scale is significantly improved compared to the hourly scale. We calculated the mean values of all products for different metrics across the study area and found that the mean value of the POD improved from 0.42 (Figure 5a) to 0.72 (Figure 10a), the mean value of the FAR decreased from 0.64 (Figure 5b) to 0.32 (Figure 10b), and the mean value of the CSI improved from 0.23 (Figure 5c) to 0.50 (Figure 10c). On the daily scale, all products reached POD values of above 0.6, while on the hourly scale, only GSMaP-Guage reached this threshold. This suggests that the ability of GSMaP to identify precipitation events improves as the timescale accumulates.
This is mainly due to the fact that the accumulation of precipitation makes the identification of precipitation frequency easier. Specifically, on the daily scale, a precipitation event is considered to be effectively captured by GSMaP if precipitation is actually present at any hour of a given day for one hour or more. However, on the hourly scale, a precipitation event can only be judged as effectively captured if precipitation actually occurs in the corresponding hour and GSMaP captures precipitation for that corresponding hour.
On the hourly scale, we find that the FAR values of the products before and after calibration are relatively close to each other for different versions (Figure 5b); however, the FAR values under different versions on the daily scale not only decrease on the regional scale, but also the advantage of the calibrated products gradually appears. The phenomenon that the FAR of the corrected product appears to decrease under the same algorithm further indicates that the correction of GSMaP is carried out on a daily scale. Compared with the hourly scale, the POD values of all the products, except GSMaP-Guage, are substantially improved (0.23 for NOW-C in NE to 0.43 for MVK-R in TP) (Figure 10), which indicates that the POD values of GSMaP-Guage have reached a more desirable state on the hourly scale. In terms of CSI values, GSMaP-Guage shows the most significant improvement (0.23 in XJ to 0.39 in TP), while all other products show an improvement of around 0.2. Consistent with the hourly scale, the differences in the capturing of precipitation events between the different classes of products on the daily scale are not significant. The POD and CSI decrease gradually from east to west, while the opposite is true for the FAR. In particular, from the hourly scale to the daily scale, the most significant enhancement is observed in the TP region, where the POD values are all above 0.35 (except for MVK-C), the FAR values are all above 0.32, and the CSI values are all above 0.31.

4.2. Uncertainty

We evaluate precipitation products and rainfall observations in mainland China. The following uncertainties may exist during the evaluation of error characteristics: spatial representation differences caused by uneven spatial distribution of observation sites; the density of observation stations is higher in the southeastern (SC), eastern (NC), and northeastern (NE) regions of mainland China, while the stations in the northwestern (XJ) and Tibetan (TP) regions are sparser (Figure 1); and the spatial heterogeneity of rainfall observation stations may affect the validation results to some extent. To avoid this effect, we only analyzed the grid of the station’s location in our study, which is the main method used in most current studies. However, this can also lead to differences in the number of grids involved in the evaluation and their locations within different sub-areas. In addition, the station-measured precipitation data reflect the precipitation at the location of the monitoring station, while the GSMaP product data reflect the average precipitation within a spatial area of 0.1° × 0.1° [22,41,57]. This is a common problem in the current quantitative evaluation of remote sensing precipitation errors [58,59,60]. We did not consider this spatial difference, which also has an impact on the evaluation results.

5. Conclusions

Three algorithms of GSMaP products, which contain six uncorrected/corrected products, were systematically and quantitatively evaluated based on hourly observations at 2167 stations in mainland China. In this evaluation, we systematically analyzed the capability of SPEs in terms of inversion of precipitation and frequency of precipitation events on an hourly scale for the period from 1 December 2021 to 30 November 2022 and further analyzed the dependence of SPE errors on rainfall intensity and elevation. The main results are summarized below:
(1)
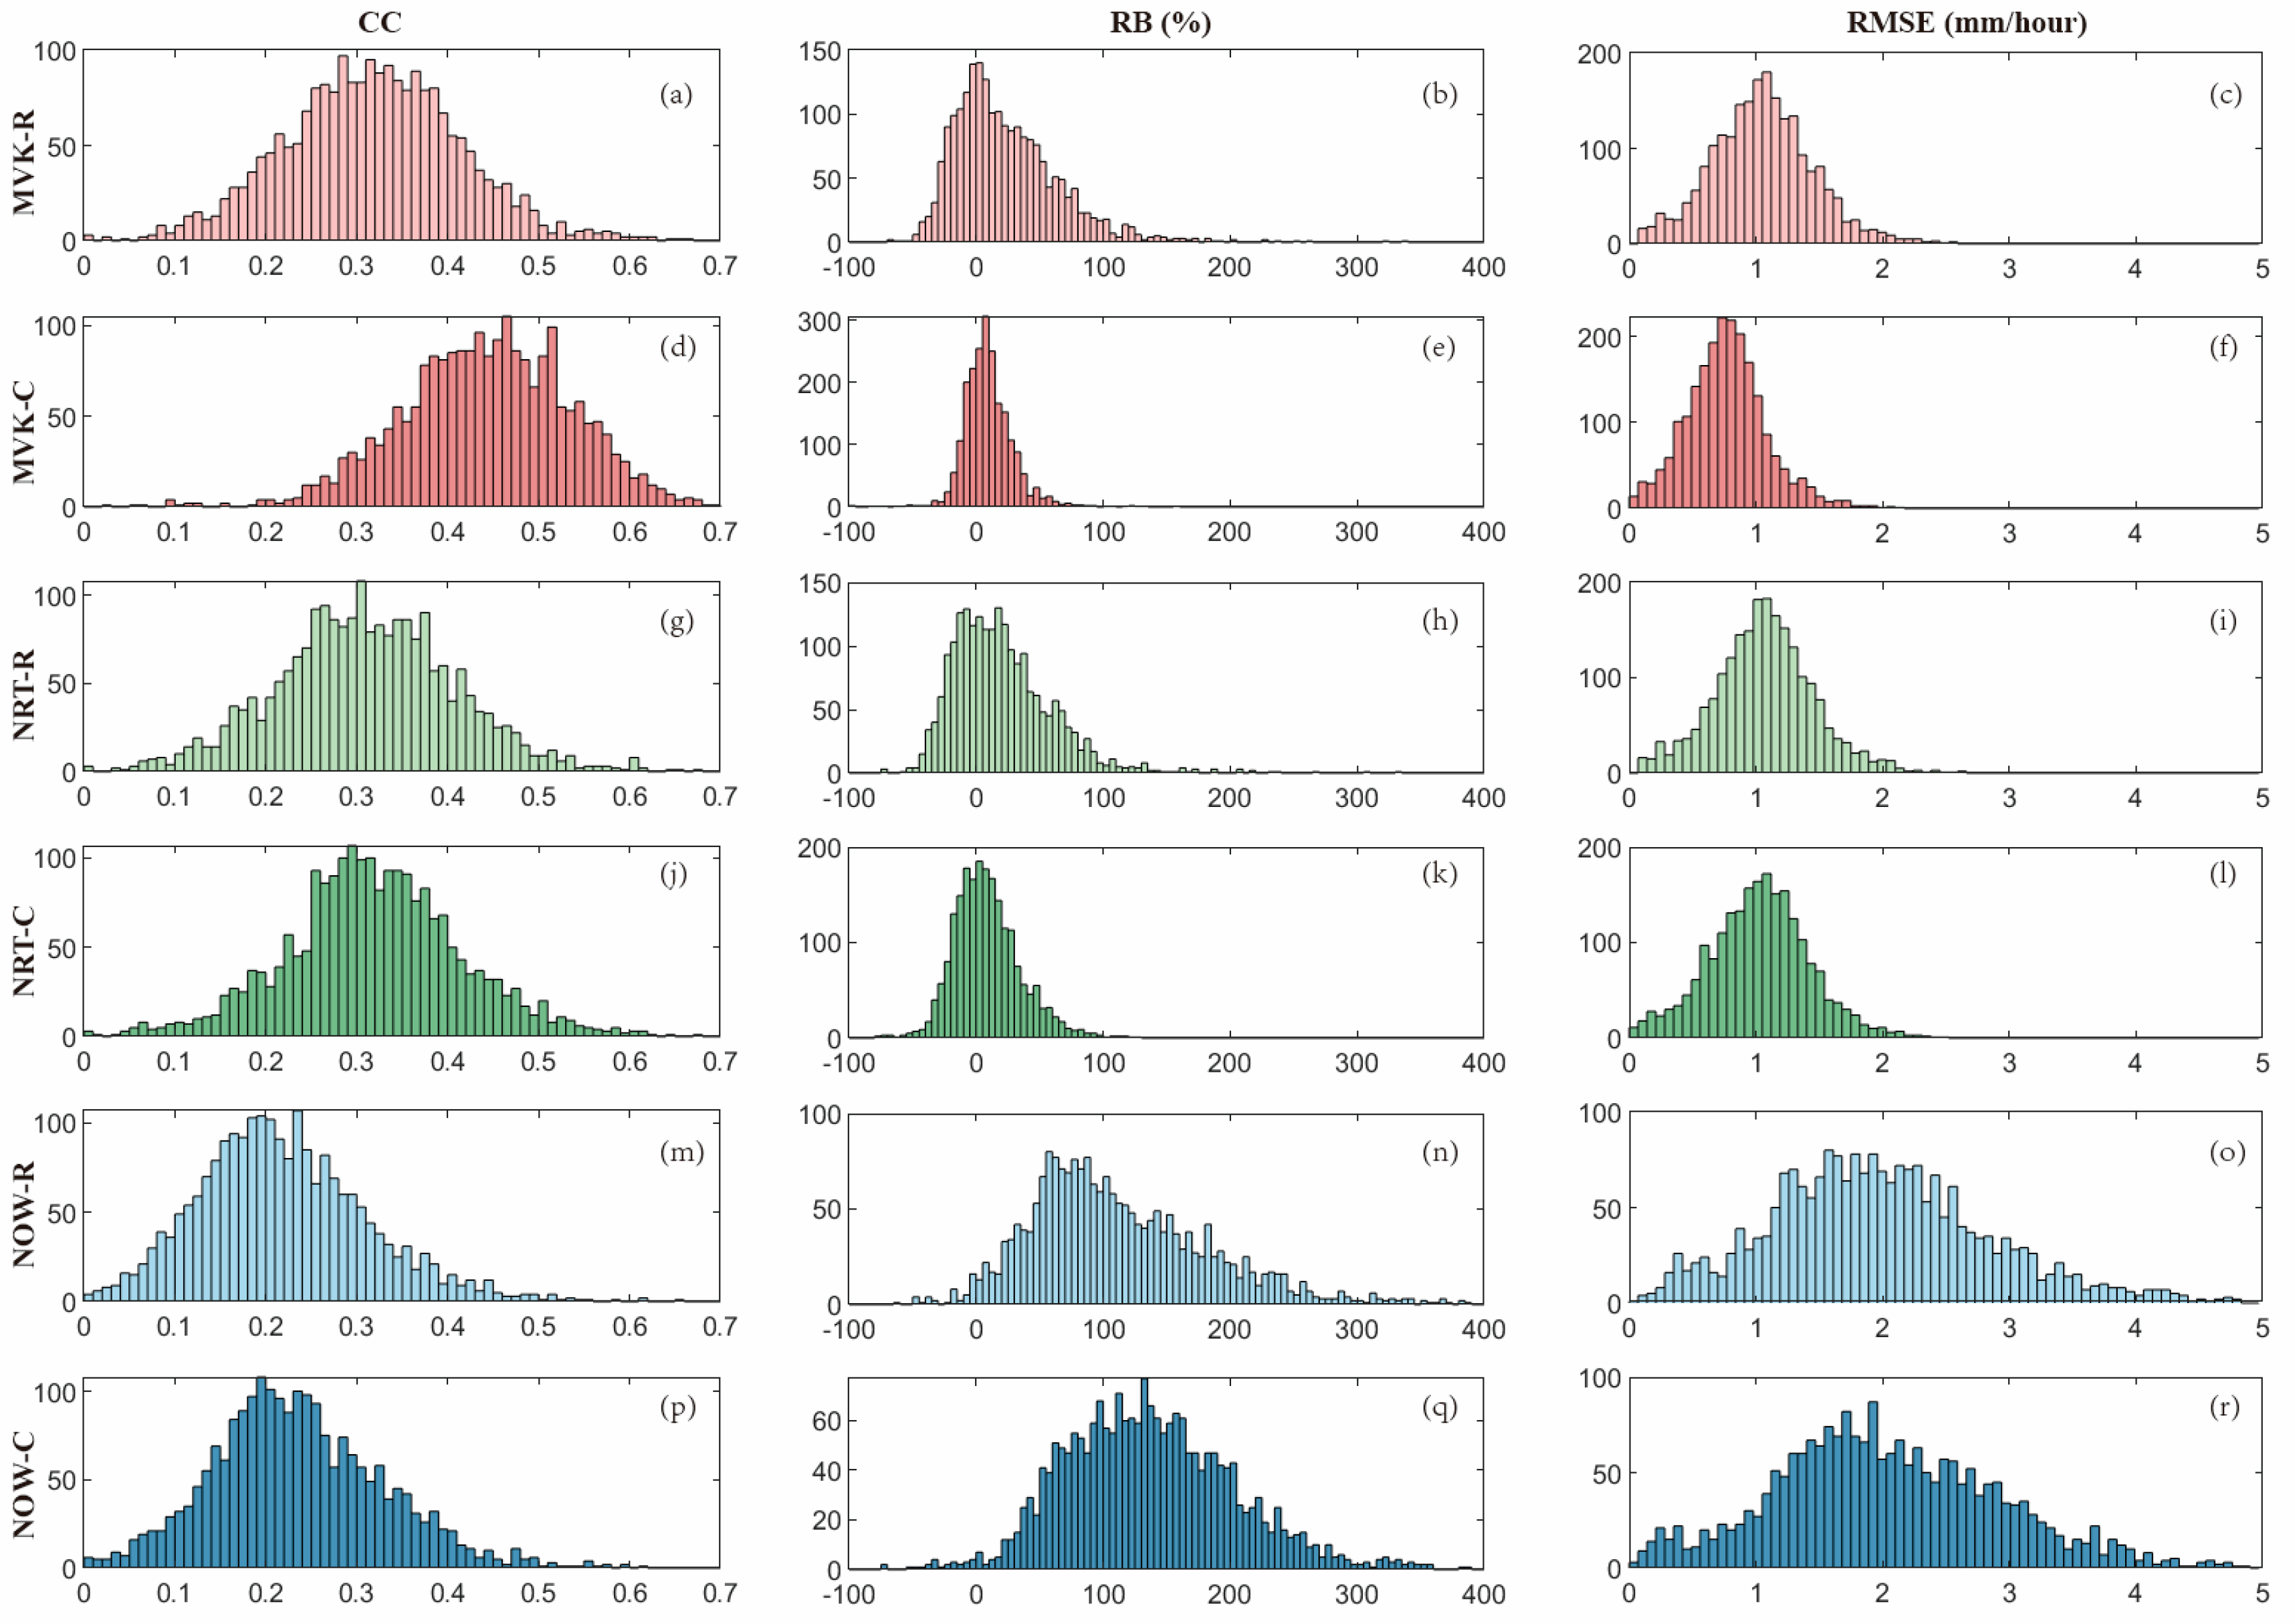
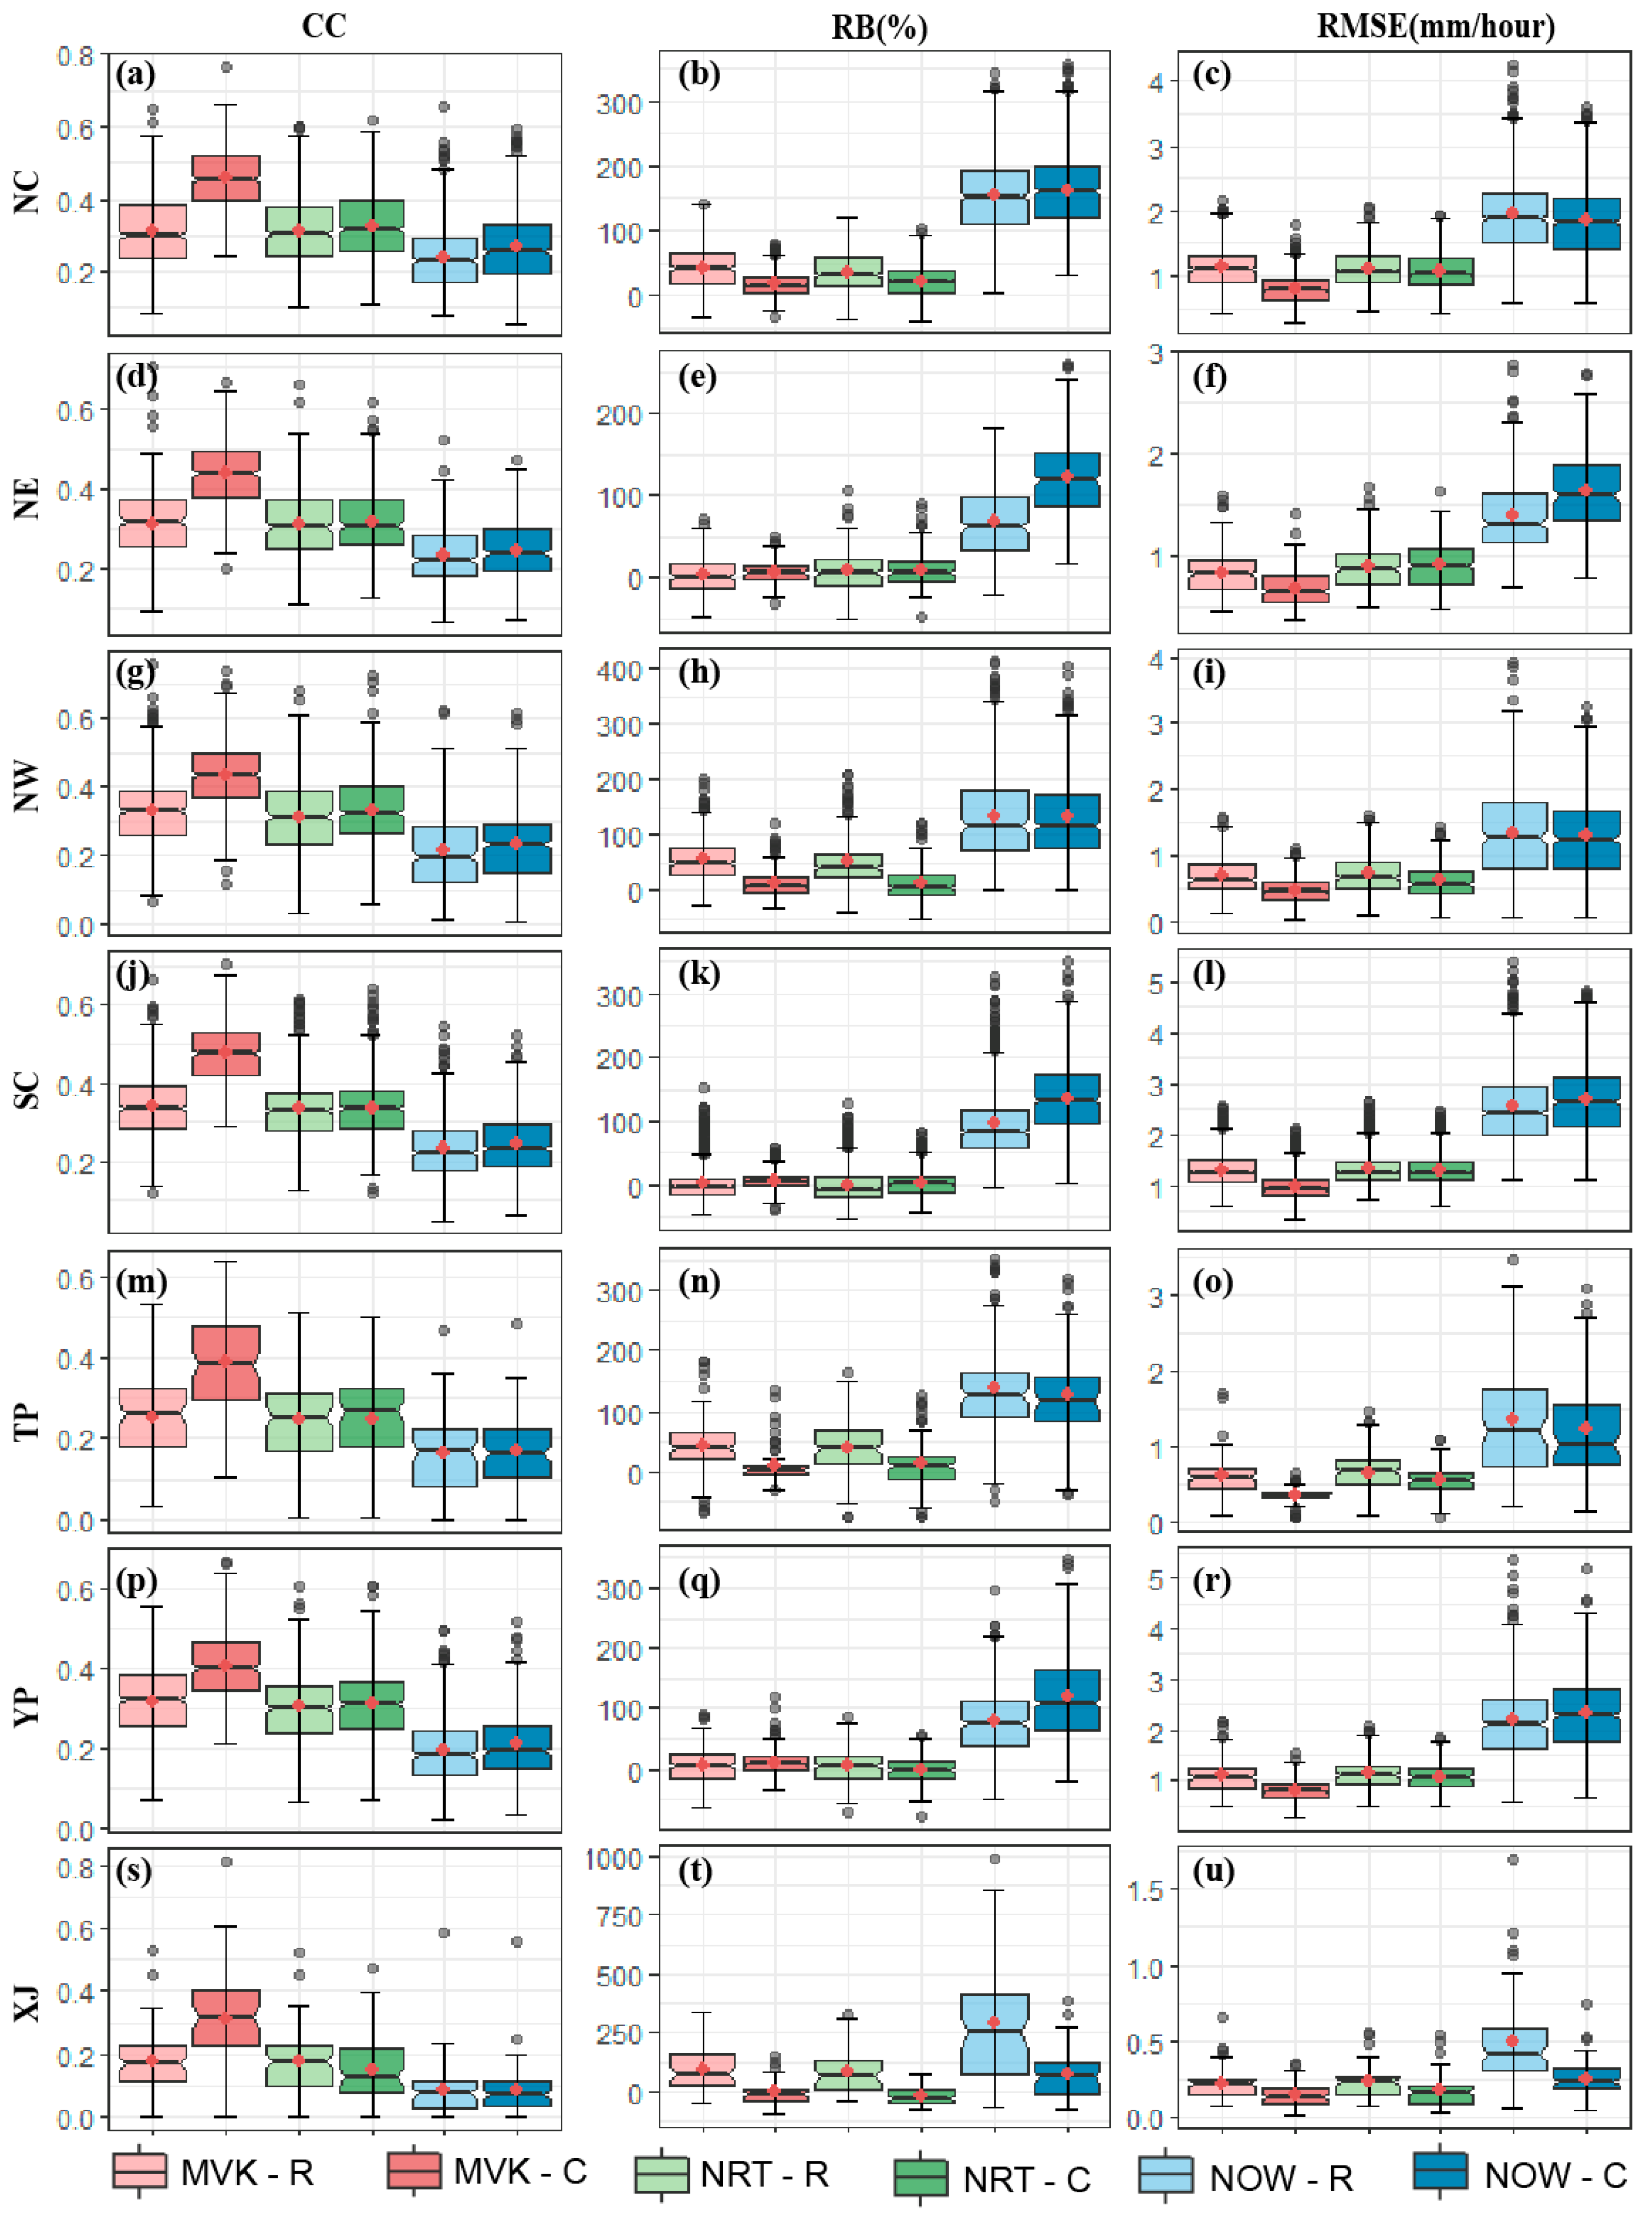
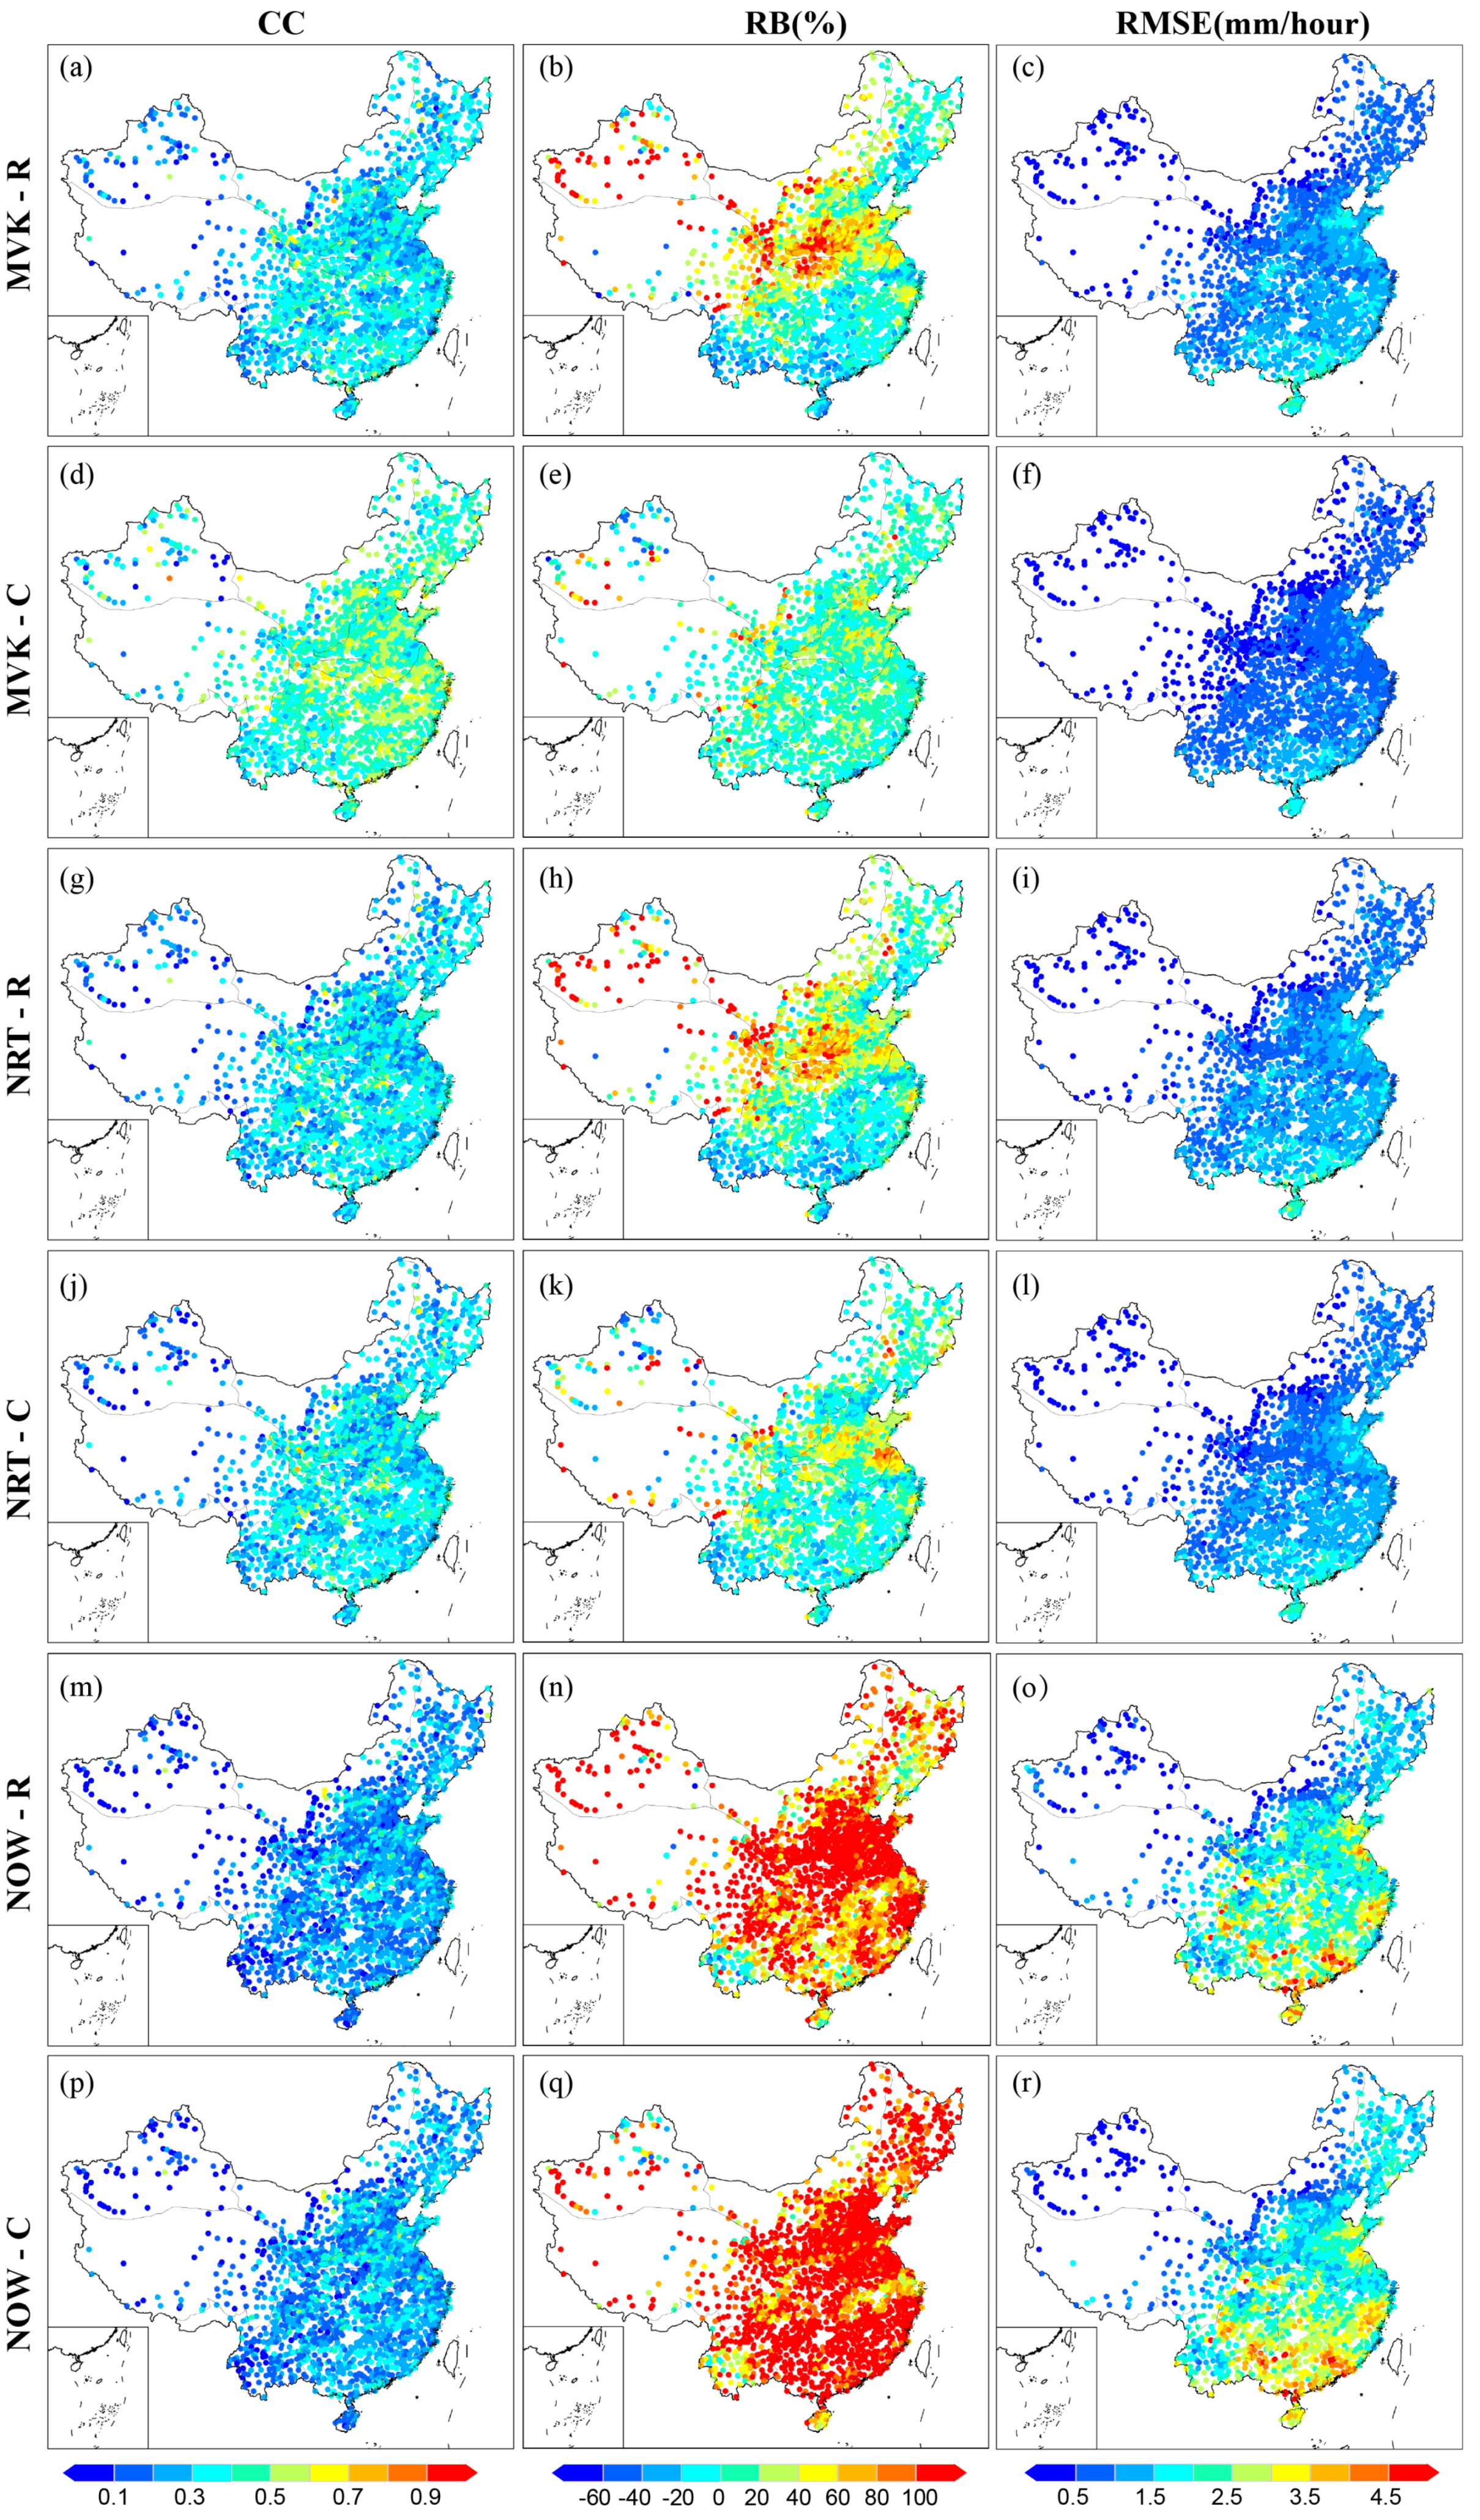
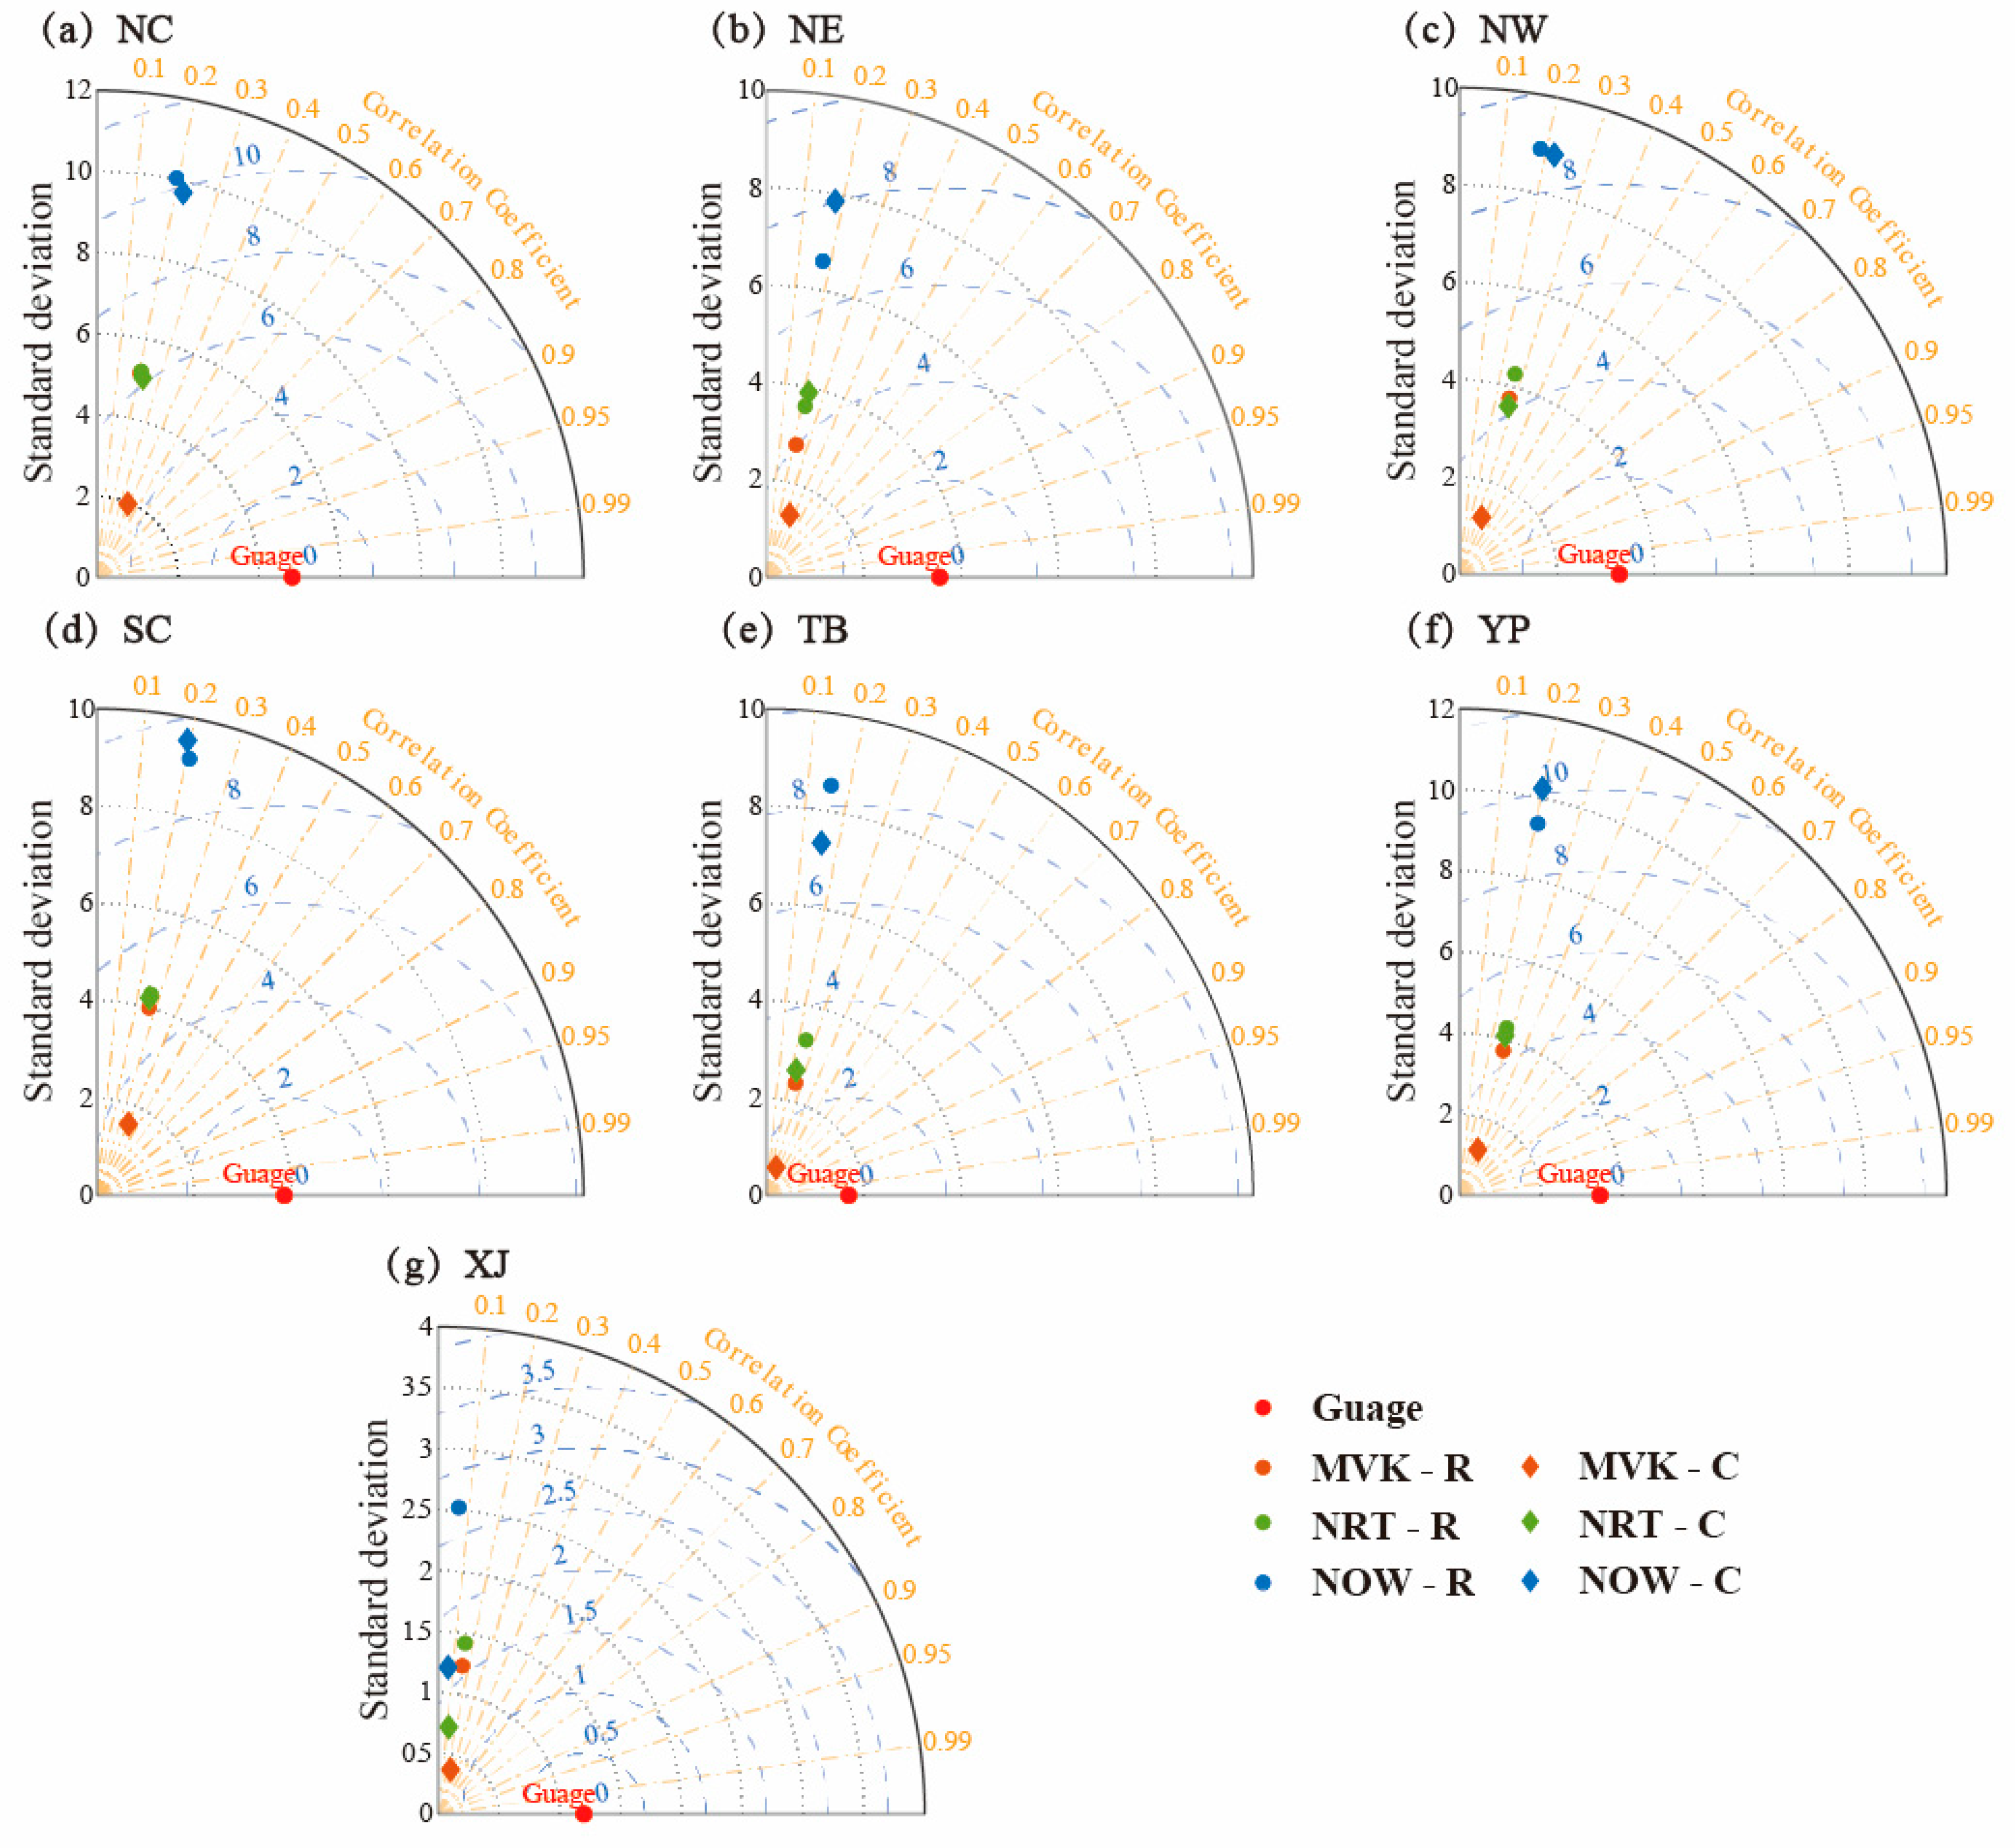
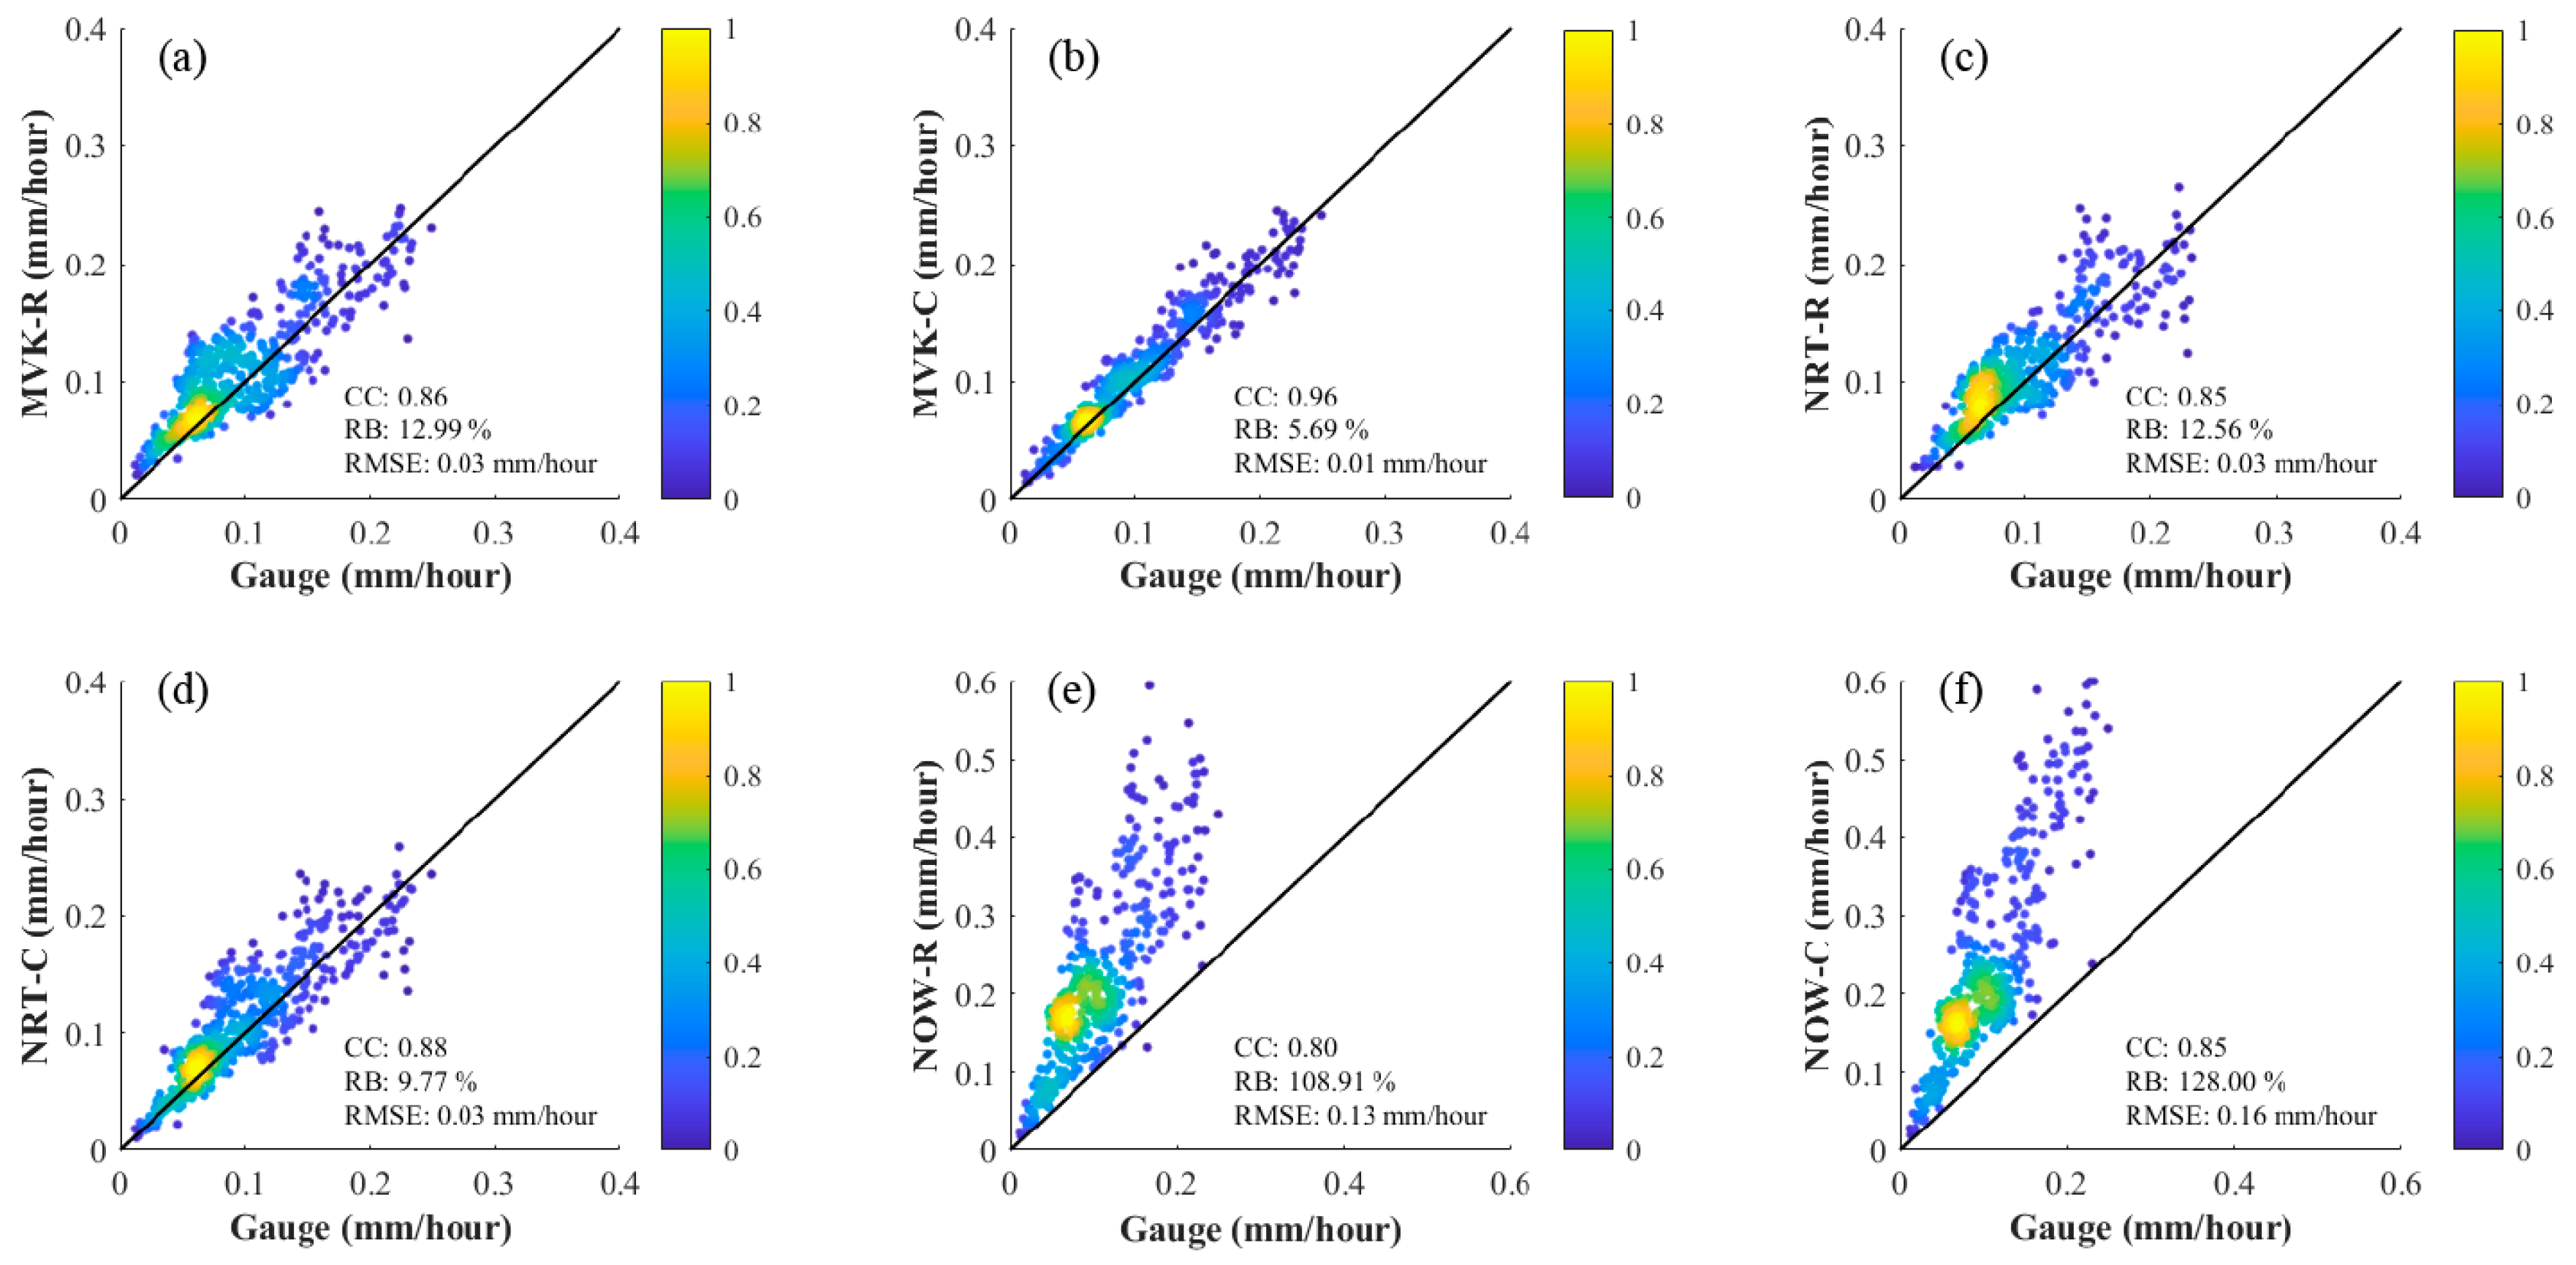
The three versions of the GSMaP algorithm products show significant performance differences in terms of precipitation and precipitation event detection capabilities. The post-real-time versions (MVK-C and MVK-R) have the best performance, with high CC values and relatively low RB (−4.78–96.378%) and RMSE values (0.14 mm/h–1.32 mm/h). The near-real-time versions (NRT-R and NRT-C) have a slightly worse performance (CC: 0.15–0.34; RB: −19.15–88.09%; RMSE: 0.17 mm/h–1.33 mm/h), while the real-time versions (NOW-R and NOW-C) have the worst performance (CC: 0.09–0.25; RB: 68.70–288.74%; RMSE: 0.26 mm/h–2.70 mm/h). This phenomenon of better performances for longer delays and more complex algorithms is in line with our expectations. In terms of spatial distribution, SPEs perform worst in the XJ region and best in the SC region. The phenomenon of better performances in the eastern regions (i.e., SC, NC, and NE) than in the western regions (i.e., XJ and TP) is present for all products.
(2)
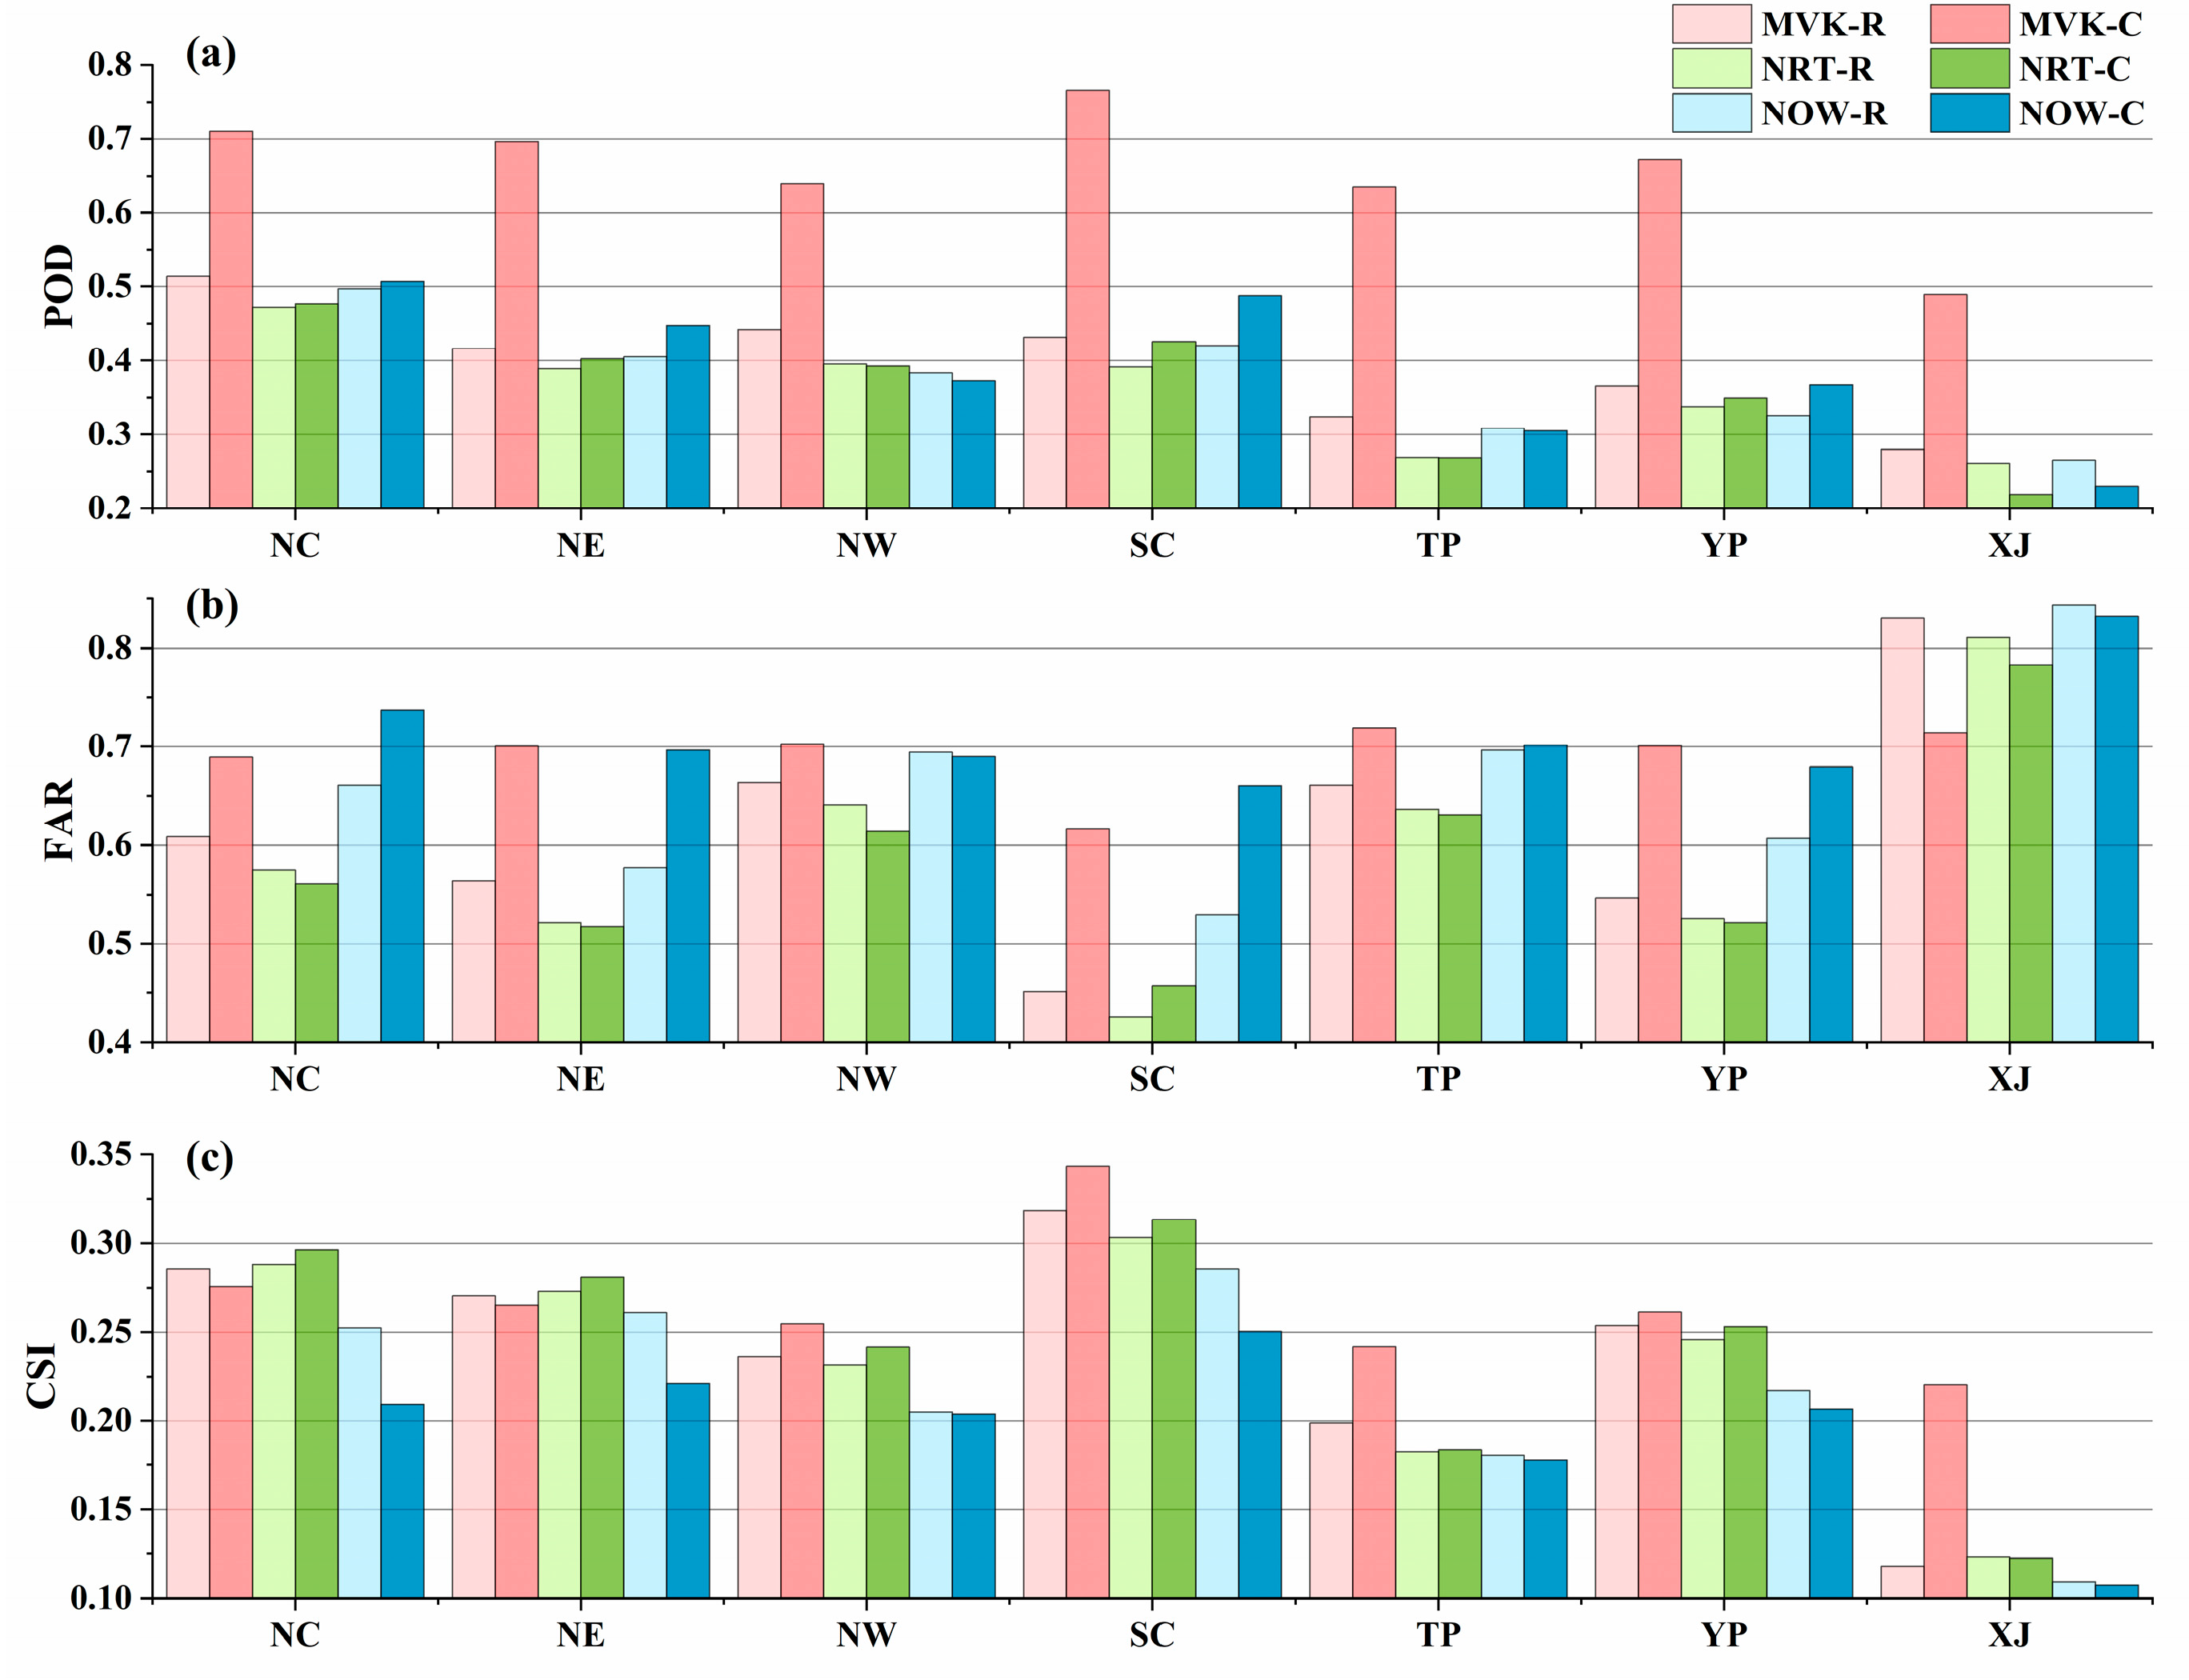
In terms of the ability to invert hourly rainfall, MVK-C performs the best, with a higher CC value (0.31 for XJ to 0.47 for SC), a smaller RMSE value (0.14 mm/h for XJ to 0.99 mm/h for SC), and a lower RB value (−4.78% for XJ to 16.03% for NC). MVK-R, NRT-C, and NRT-R have slightly lower performances, while NOW-C and NOW-R have the worst performances and lowest correlations. In the NC, NE, NW, and SC regions, the POD usually was around 0.4, the FAR was between 0.35 and 0.75, and the CSI was between 0.2 and 0.35. Compared with the above regions, the POD and CSI in TB, TP, and XJ regions decreased by about 0.1, and the FAR increased by about 0.2. The ability of different SPEs to retrieve the frequency of precipitation events on a daily timescale increased with the increase in timescales, and the POD values were greater than 0.6, FAR values were less than 0.5, and CSI values were greater than 0.3.
(3)
The correction algorithm plays an important role in reducing errors and improving the ability to capture precipitation events. The corrected product performs significantly better than the uncorrected version, exhibiting higher CC values and lower RB and RMSE values in most sub-regions. Comparisons between the different versions show that the post-real-time version has the best correction. For example, MVK-C is corrected by CPC site data, showing a significant improvement in CC values in all sub-regions (hourly timescales greater than 0.3), and the proportion of sites with CC values greater than 0.5 increased from 0.03% (MVK-R) to 28.47% (MVK-C). However, the correction algorithms had a limited effect (about 0.01) on the near-real-time and real-time versions, probably due to the limited number of trajectory observations included in the corresponding correction procedures.
(4)
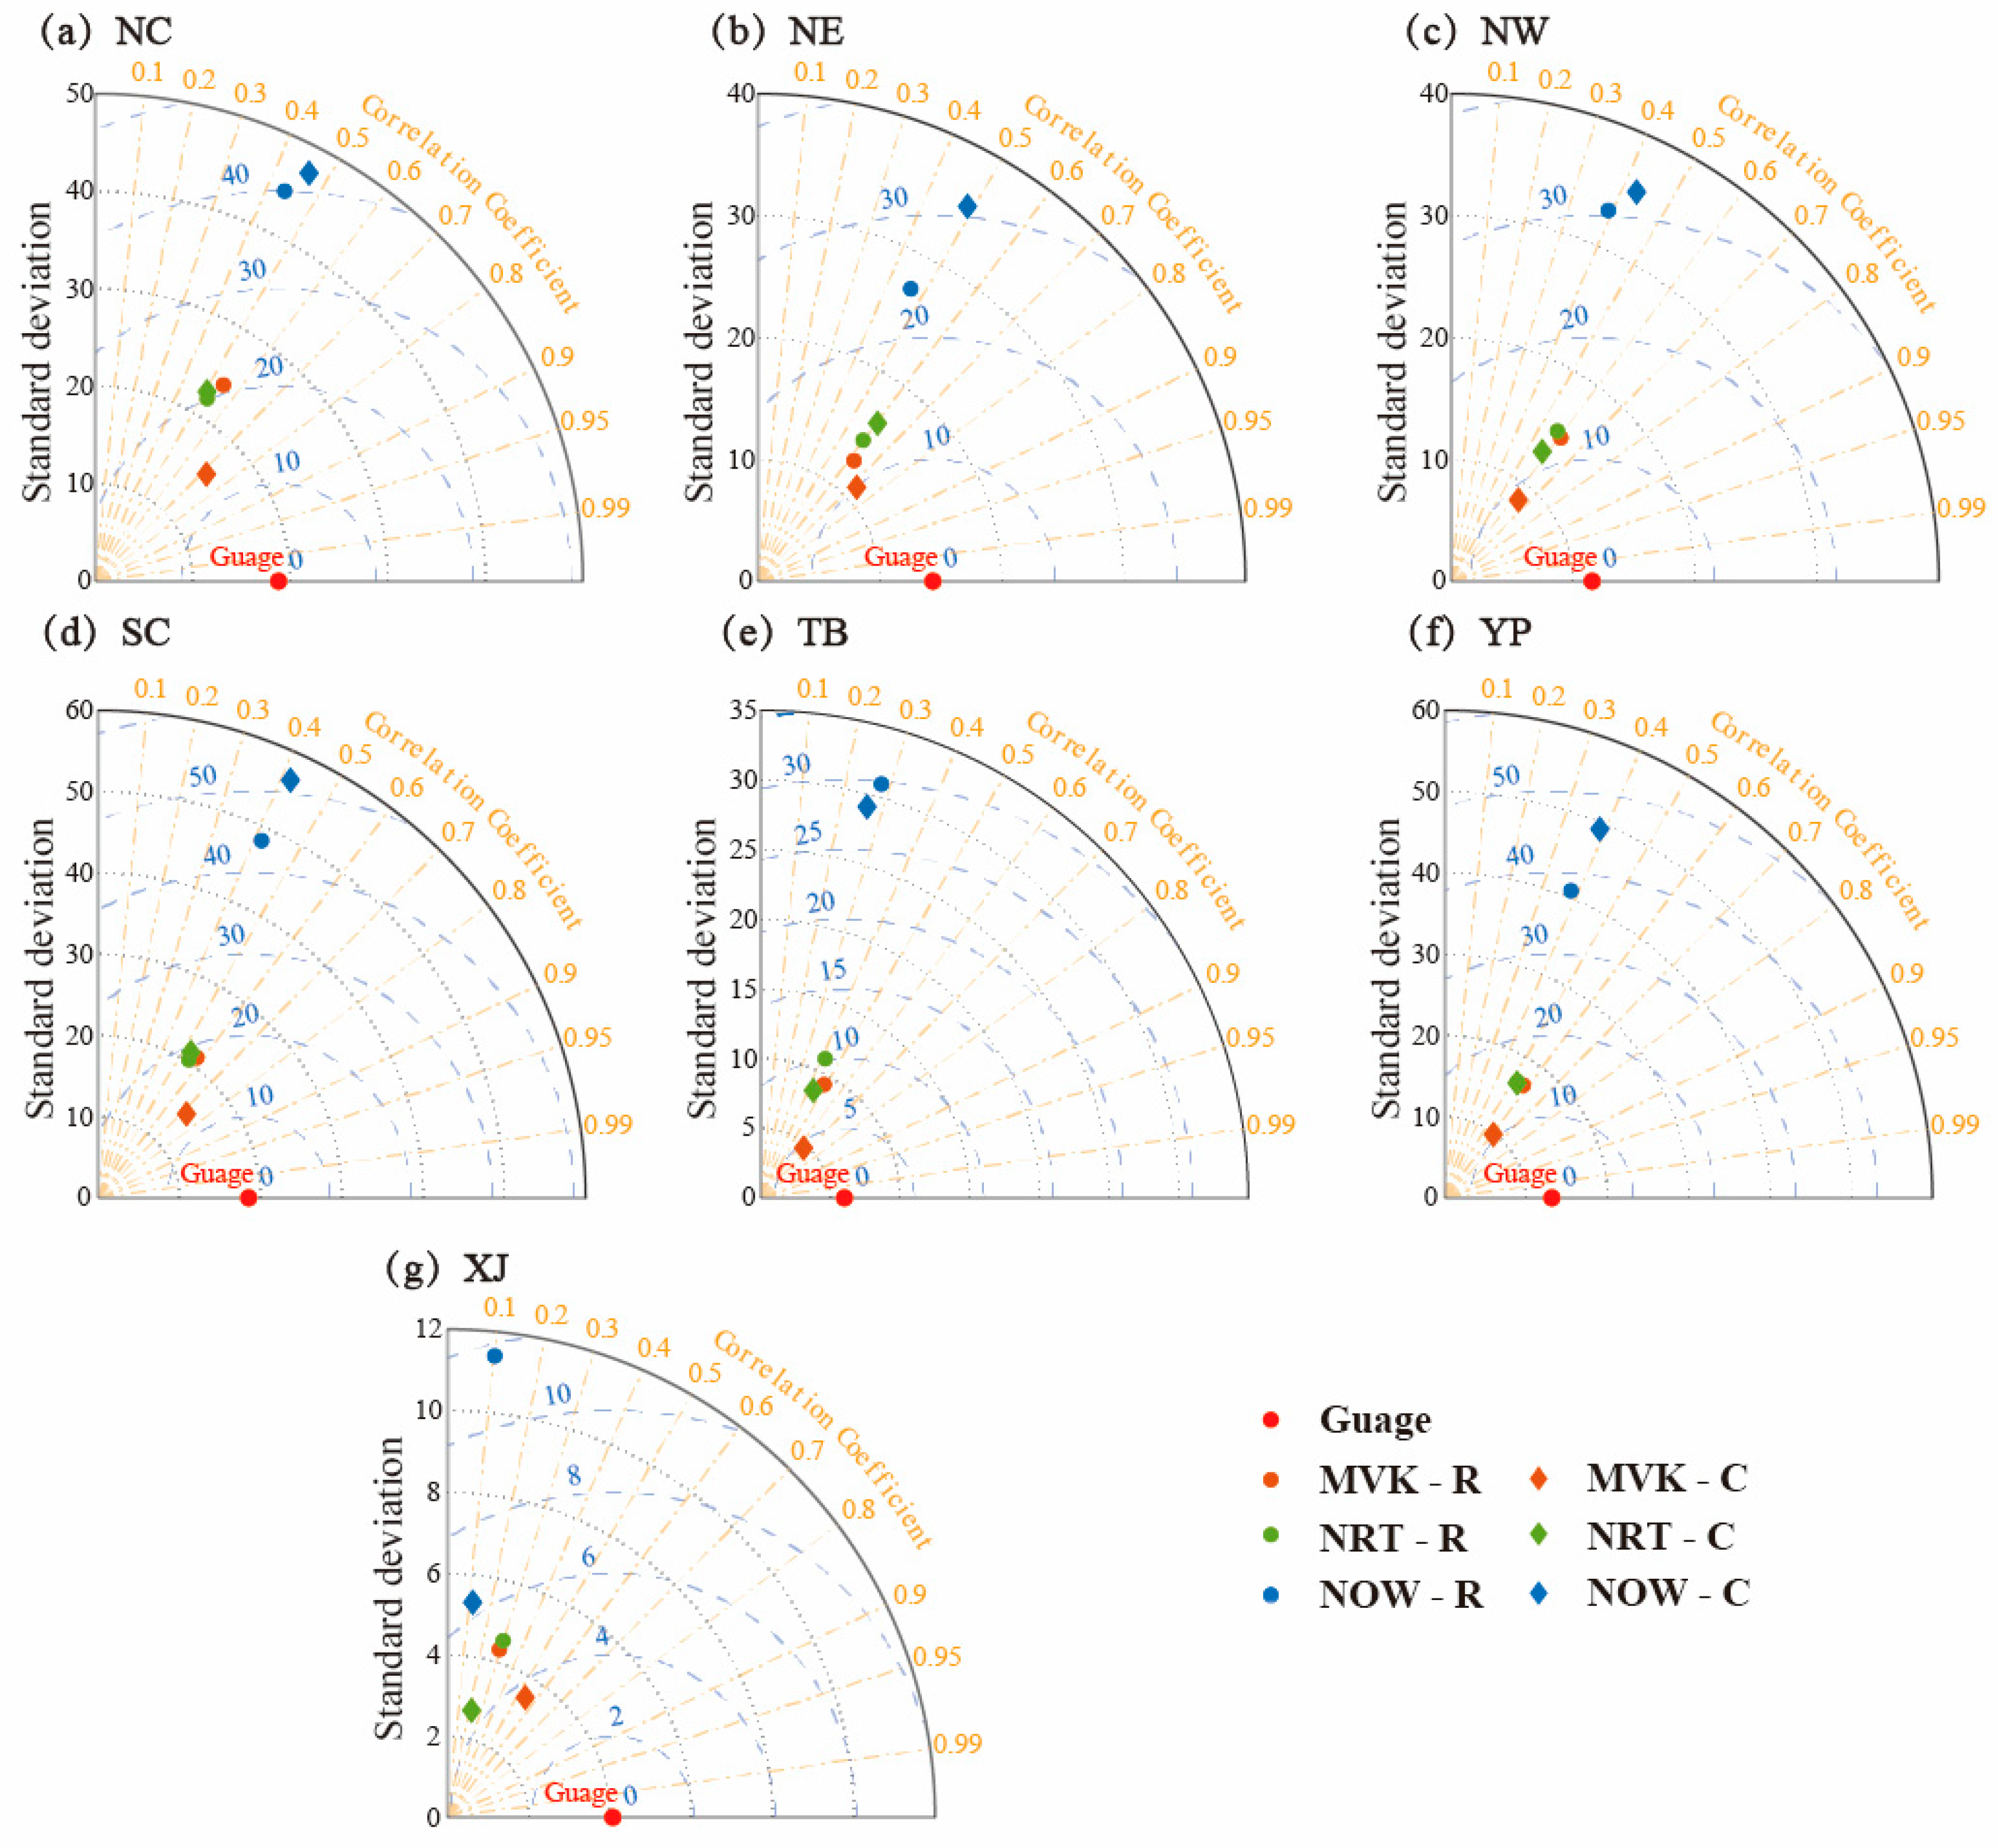
All of the SPEs produced significant errors depending on the precipitation intensity and elevation. In terms of elevation errors, the CC values of the SPEs decreased with increasing elevation. In areas with drastic altitude changes (1200–1500 m and 3000–3300 m), the accuracy of SPEs was significantly affected. In terms of rainfall intensity, CC values decreased with an increasing rainfall intensity, RB and RMSE values increased with an increasing rainfall intensity, and all calibrated products outperformed the uncalibrated SPEs at all rainfall intensities.

Author Contributions

Conceptualization, H.G.; methodology, X.L.; software, X.L.; validation, X.L. and Y.T.; formal analysis, X.L.; resources, A.B. and P.D.M.; data curation, Y.T.; writing—original draft preparation, X.L.; writing—review and editing, H.G., P.D.M. and X.M.; visualization, X.L.; supervision, H.G. and X.M.; project administration, H.G. and P.D.M.; funding acquisition, H.G. All authors have read and agreed to the published version of the manuscript.

Funding

This research was jointly funded by the Open Foundation of State Key Laboratory of Desert and Oasis Ecology, the Xinjiang Institute of Ecology and Geography, the Chinese Academy of Sciences (G2023-02-03), the National Natural Science Foundation of China (Grant No. 42001363), and the Youth Innovation Teams in Colleges and Universities of Shandong Province (2022KJ178).

Data Availability Statement

Global Satellite Mapping of Precipitation (GSMAP) data were provided by the Japan Aerospace Exploration Agency (JAXA, https://gportal.jaxa.jp/gpr/?lang=en, accessed on 1 January 2023). Hourly observation data from surface meteorological stations were obtained from the China Meteorological Data Service Centre (CMDC, http://data.cma.cn, accessed on 1 January 2023).

Acknowledgments

The authors thank the anonymous reviewers for their constructive comments and suggestions that greatly improved this paper.

Conflicts of Interest

The authors declare no conflicts of interest.

Appendix A

Table A1. List of previous studies on GSMaP evaluation from 2019 to 2023.
GSMaP ProductsVersionFinest Evaluation TimescaleReference
MVK-R, MVK-C-DailyChina [28]
MVK-C-DailyChina [29,61,62]
NRT-R, MVK-R, MVK-CVersion 7DailyChina [18]
NRT-R, NRT-C Version 7DailyChina [34]
MVK-CVersion 7DailyPingtang River Basin [16]
NOW-R,MVK-R, MVK-C, NRT-R, NRT-CVersion 7HourlyYellow River source region [35]
NRT-R, NRT-C, MVK-C-DailyXijiang River Basin [31]
MVK-CVersion 6DailyYingjing catchment [63]
NOW-R, NOW-C, MVK-R, MVK-C, NRT-R, NRT-CNRT-CVersion 8HourlyIndonesian Maritime Continent [55]
NRT-R, MVK-R,MVK-CVersion 6DailyHanjiang River Basin [15]
MVK-RVersion 7DailyArdabil Province, Iran [14]
Table A2. CC, RB, and RMSE of different SPEs and gauges based on the mean values of hourly precipitation over seven sub-regions.
RegionMVK-R MVK-CNRT-RNRT-CNOW-RNRT-C
CCNC0.310.460.310.330.240.27
NE0.310.440.310.320.230.25
NW0.330.440.310.330.200.23
SC0.340.470.330.340.230.24
TP0.250.390.240.250.160.17
YP0.320.410.300.310.200.21
XJ0.180.310.180.150.090.09
RB (%)NC43.2616.0335.8722.26154.84162.16
NE3.197.177.939.8468.69122.28
NW58.2411.7052.2112.51135.96133.77
SC2.626.370.143.1195.14136.19
TP42.259.2039.7313.38138.23126.32
YP8.4911.237.380.4889.36129.02
XJ96.3820.7888.0939.04288.7476.17
RMSE (mm/h)NC1.130.791.121.061.961.87
NE0.830.670.880.901.391.62
NW0.700.480.730.621.361.29
SC1.320.991.331.322.552.69
TP0.620.360.660.561.371.24
YP1.090.811.131.072.202.34
XJ0.230.140.230.170.500.26
Figure A1. Probability Density Function (PDF) of CC (left column (a,d,g,j,m,p)), RB (middle column (b,e,h,k,n,q)), and RMSE (right column (c,f,i,l,o,r)).
Remotesensing 16 00210 g0a1

References

  1. Gleick, P.H. Climate change, hydrology, and water resources. Rev. Geophys. 1989, 27, 329–344. [Google Scholar] [CrossRef]
  2. Sivakumar, B. Global climate change and its impacts on water resources planning and management: Assessment and challenges. Stoch. Environ. Res. Risk Assess. 2011, 25, 583–600. [Google Scholar] [CrossRef]
  3. Ebert, E. Comparison of Near-Real-Time Precipitation Estimates from Satellite Observations and Numerical Models. Bull. Am. Meteorol. Soc. 2010, 88, 47–64. [Google Scholar] [CrossRef]
  4. Maccini, S.; Yang, D. Under the Weather: Health, Schooling, and Economic Consequences of Early-Life Rainfall. Am. Econ. Rev. 2009, 99, 1006–1026. [Google Scholar] [CrossRef]
  5. Chapman, L.; Bell, C.; Bell, S. Can the crowdsourcing data paradigm take atmospheric science to a new level? A case study of the urban heat island of London quantified using Netatmo weather stations. Int. J. Climatol. 2017, 37, 3597–3605. [Google Scholar] [CrossRef]
  6. Kelley, O.A. Where the Least Rainfall Occurs in the Sahara Desert, the TRMM Radar Reveals a Different Pattern of Rainfall Each Season. J. Clim. 2014, 27, 6919–6939. [Google Scholar] [CrossRef]
  7. Crow, W.T.; van den Berg, M.J.; Huffman, G.J.; Pellarin, T. Correcting rainfall using satellite-based surface soil moisture retrievals: The Soil Moisture Analysis Rainfall Tool (SMART). Water Resour. Res. 2011, 47. [Google Scholar] [CrossRef]
  8. Wu, J.; Zhou, L.; Liu, M.; Zhang, J.; Leng, S.; Diao, C. Establishing and assessing the Integrated Surface Drought Index (ISDI) for agricultural drought monitoring in mid-eastern China. Int. J. Appl. Earth Obs. Geoinf. 2013, 23, 397–410. [Google Scholar] [CrossRef]
  9. Sebastianelli, S.; Russo, F.; Napolitano, F.; Baldini, L. On precipitation measurements collected by a weather radar and a rain gauge network. Nat. Hazards Earth Syst. Sci. 2013, 13, 605–623. [Google Scholar] [CrossRef]
  10. Saltikoff, E.; Friedrich, K.; Soderholm, J.; Lengfeld, K.; Nelson, B.; Becker, A.; Hollmann, R.; Urban, B.; Heistermann, M.; Tassone, C. An Overview of Using Weather Radar for Climatological Studies: Successes, Challenges, and Potential. Bull. Am. Meteorol. Soc. 2019, 100, 1739–1752. [Google Scholar] [CrossRef]
  11. Driouech, F.; Déqué, M.; Mokssit, A. Numerical simulation of the probability distribution function of precipitation over Morocco. Clim. Dyn. 2008, 32, 1055–1063. [Google Scholar] [CrossRef]
  12. Chevuturi, A.; Dimri, A.P.; Das, S.; Kumar, A.; Niyogi, D. Numerical simulation of an intense precipitation event over Rudraprayag in the central Himalayas during 13–14 September 2012. J. Earth Syst. Sci. 2015, 124, 1545–1561. [Google Scholar] [CrossRef]
  13. Cohen Liechti, T.; Matos, J.P.; Boillat, J.L.; Schleiss, A.J. Comparison and evaluation of satellite derived precipitation products for hydrological modeling of the Zambezi River Basin. Hydrol. Earth Syst. Sci. 2012, 16, 489–500. [Google Scholar] [CrossRef]
  14. Aslami, F.; Ghorbani, A.; Sobhani, B.; Esmali, A. Comprehensive comparison of daily IMERG and GSMaP satellite precipitation products in Ardabil Province, Iran. Int. J. Remote Sens. 2018, 40, 3139–3153. [Google Scholar] [CrossRef]
  15. Deng, P.; Zhang, M.; Guo, H.; Xu, C.; Bing, J.; Jia, J. Error analysis and correction of the daily GSMaP products over Hanjiang River Basin of China. Atmos. Res. 2018, 214, 121–134. [Google Scholar] [CrossRef]
  16. Sun, G.; Wei, Y.; Wang, G.; Shi, R.; Chen, H.; Mo, C.; Rigo, T. Downscaling Correction and Hydrological Applicability of the Three Latest High-Resolution Satellite Precipitation Products (GPM, GSMAP, and MSWEP) in the Pingtang Catchment, China. Adv. Meteorol. 2022, 2022, 6507109. [Google Scholar] [CrossRef]
  17. Sharifi, E.; Brocca, L. Chapter 8—Monitoring precipitation from space: Progress, challenges, and opportunities. In Precipitation Science; Michaelides, S., Ed.; Elsevier: Amsterdam, The Netherlands, 2022; pp. 239–255. [Google Scholar]
  18. Zhou, Z.; Guo, B.; Xing, W.; Zhou, J.; Xu, F.; Xu, Y. Comprehensive evaluation of latest GPM era IMERG and GSMaP precipitation products over mainland China. Atmos. Res. 2020, 246, 105132. [Google Scholar] [CrossRef]
  19. Hamada, A.; Takayabu, Y.N. Improvements in Detection of Light Precipitation with the Global Precipitation Measurement Dual-Frequency Precipitation Radar (GPM DPR). J. Atmos. Ocean. Technol. 2016, 33, 653–667. [Google Scholar] [CrossRef]
  20. Prakash, S.; Mitra, A.K.; Rajagopal, E.N.; Pai, D.S. Assessment of TRMM-based TMPA-3B42 and GSMaP precipitation products over India for the peak southwest monsoon season. Int. J. Climatol. 2016, 36, 1614–1631. [Google Scholar] [CrossRef]
  21. Mega, T.; Ushio, T.; Takahiro, M.; Kubota, T.; Kachi, M.; Oki, R. Gauge-Adjusted Global Satellite Mapping of Precipitation. IEEE Trans. Geosci. Remote Sens. 2019, 57, 1928–1935. [Google Scholar] [CrossRef]
  22. Kubota, T.; Aonashi, K.; Ushio, T.; Shige, S.; Yamaji, M.; Yamamoto, M.; Hirose, H.; Takayabu, Y. A new version of Global Satellite Mapping of Precipitation (GSMaP) product released in December 2021. In Proceedings of the EGU General Assembly 2022, Vienna, Austria, 23–27 May 2022. [Google Scholar] [CrossRef]
  23. Qi, W.; Yong, B.; Gourley, J.J. Monitoring the super typhoon lekima by GPM-based near-real-time satellite precipitation estimates. J. Hydrol. 2021, 603, 126968. [Google Scholar] [CrossRef]
  24. Tang, G.; Zeng, Z.; Ma, M.; Liu, R.; Wen, Y.; Hong, Y. Can Near-Real-Time Satellite Precipitation Products Capture Rainstorms and Guide Flood Warning for the 2016 Summer in South China? IEEE Geosci. Remote Sens. Lett. 2017, 14, 1208–1212. [Google Scholar] [CrossRef]
  25. Sorooshian, S.; Hsu, K.L.; Gao, X.; Gupta, H.V.; Imam, B.; Braithwaite, D. Evaluation of PERSIANN System Satellite-Based Estimates of Tropical Rainfall. Bull. Am. Meteorol. Soc. 2000, 81, 2035–2046. [Google Scholar] [CrossRef]
  26. Liu, S.; Wang, J.; Wang, H. Assessing 10 Satellite Precipitation Products in Capturing the July 2021 Extreme Heavy Rain in Henan, China. J. Meteorol. Res. 2022, 36, 798–808. [Google Scholar] [CrossRef]
  27. Hsu, J.; Huang, W.-R.; Liu, P.-Y. Performance assessment of GPM-based near-real-time satellite products in depicting diurnal precipitation variation over Taiwan. J. Hydrol. Reg. Stud. 2021, 38, 100957. [Google Scholar] [CrossRef]
  28. Chen, H.; Wen, D.; Du, Y.; Xiong, L.; Wang, L. Errors of five satellite precipitation products for different rainfall intensities. Atmos. Res. 2023, 285, 106622. [Google Scholar] [CrossRef]
  29. Lei, H.; Zhao, H.; Ao, T. Ground validation and error decomposition for six state-of-the-art satellite precipitation products over mainland China. Atmos. Res. 2022, 269, 106017. [Google Scholar] [CrossRef]
  30. Shi, J.; Yuan, F.; Shi, C.; Zhao, C.; Zhang, L.; Ren, L.; Zhu, Y.; Jiang, S.; Liu, Y. Statistical Evaluation of the Latest GPM-Era IMERG and GSMaP Satellite Precipitation Products in the Yellow River Source Region. Water 2020, 12, 1006. [Google Scholar] [CrossRef]
  31. Weng, P.; Tian, Y.; Jiang, Y.; Chen, D.; Kang, J. Assessment of GPM IMERG and GSMaP daily precipitation products and their utility in droughts and floods monitoring across Xijiang River Basin. Atmos. Res. 2023, 286, 106673. [Google Scholar] [CrossRef]
  32. Yamaji, M.; Kubota, T.; Yamamoto, M.K. An Approach to Reliability Characterization of GSMaP Near-Real-Time Precipitation Product. J. Meteorol. Soc. Jpn. 2021, 99, 673–684. [Google Scholar] [CrossRef]
  33. Li, D.; Min, X.; Xu, J.; Xue, J.; Shi, Z. Assessment of three gridded satellite-based precipitation products and their performance variabilities during typhoons over Zhejiang, southeastern China. J. Hydrol. 2022, 610, 127985. [Google Scholar] [CrossRef]
  34. Lu, D.; Yong, B. A Preliminary Assessment of the Gauge-Adjusted Near-Real-Time GSMaP Precipitation Estimate over Mainland China. Remote Sens. 2020, 12, 141. [Google Scholar] [CrossRef]
  35. Shi, J.; Wang, B.; Wang, G.; Yuan, F.; Shi, C.; Zhou, X.; Zhang, L.; Zhao, C. Are the Latest GSMaP Satellite Precipitation Products Feasible for Daily and Hourly Discharge Simulations in the Yellow River Source Region? Remote Sens. 2021, 13, 4199. [Google Scholar] [CrossRef]
  36. Hou, H.-Y. Vegetation of China With Reference to Its Geographical Distribution. Ann. Mo. Bot. Gard. 1983, 70, 509–549. [Google Scholar] [CrossRef]
  37. Zhao, J.; Ji, G.; Tian, Y.; Chen, Y.; Wang, Z. Environmental vulnerability assessment for mainland China based on entropy method. Ecol. Indic. 2018, 91, 410–422. [Google Scholar] [CrossRef]
  38. Guo, H.; Chen, S.; Bao, A.; Behrangi, A.; Hong, Y.; Ndayisaba, F.; Hu, J.; Stepanian, P.M. Early assessment of Integrated Multi-satellite Retrievals for Global Precipitation Measurement over China. Atmos. Res. 2016, 176–177, 121–133. [Google Scholar] [CrossRef]
  39. Yang, B.; Zhao, Y.; Zhao, H.; Li, B.; Huang, Y. Assessment of the Two Successive GPM-Based V3 and V4 GSMaP Precipitation Products at Multiple Temporal and Spatial Scales Over China. IEEE J. Sel. Top. Appl. Earth Obs. Remote Sens. 2019, 12, 577–588. [Google Scholar] [CrossRef]
  40. Yang, H.; Yang, D.; Hu, Q.; Lv, H. Spatial variability of the trends in climatic variables across China during 1961–2010. Theor. Appl. Climatol. 2015, 120, 773–783. [Google Scholar] [CrossRef]
  41. Kubota, T.; Aonashi, K.; Ushio, T.; Shige, S.; Takayabu, Y.N.; Kachi, M.; Arai, Y.; Tashima, T.; Masaki, T.; Kawamoto, N.; et al. Global Satellite Mapping of Precipitation (GSMaP) Products in the GPM Era. In Advances in Global Change Research; Springer: Berlin/Heidelberg, Germany, 2020; Volume 67. [Google Scholar]
  42. Aonashi, K.; Awaka, J.; Hirose, M.; Kozu, T.; Kubota, T.; Liu, G.; Shige, S.; Kida, S.; Seto, S.; Takahashi, N.; et al. GSMaP Passive Microwave Precipitation Retrieval Algorithm: Algorithm Description and Validation. J. Meteorol. Soc. Jpn. 2009, 87A, 119–136. [Google Scholar] [CrossRef]
  43. Ushio, T.; Sasashige, K.; Kubota, T.; Shige, S.; Okamoto, K.i.; Aonashi, K.; Inoue, T.; Takahashi, N.; Iguchi, T.; Kachi, M.; et al. A Kalman Filter Approach to the Global Satellite Mapping of Precipitation (GSMaP) from Combined Passive Microwave and Infrared Radiometric Data. J. Meteorol. Soc. Jpn. 2009, 87A, 137–151. [Google Scholar] [CrossRef]
  44. Khatakho, R.; Talchabhadel, R.; Thapa, B.R. Evaluation of different precipitation inputs on streamflow simulation in Himalayan River basin. J. Hydrol. 2021, 599, 126390. [Google Scholar] [CrossRef]
  45. AghaKouchak, A.; Mehran, A. Extended contingency table: Performance metrics for satellite observations and climate model simulations. Water Resour. Res. 2013, 49, 7144–7149. [Google Scholar] [CrossRef]
  46. Yuan, F.; Wang, B.; Shi, C.; Cui, W.; Zhao, C.; Liu, Y.; Ren, L.; Zhang, L.; Zhu, Y.; Chen, T.; et al. Evaluation of hydrological utility of IMERG Final run V05 and TMPA 3B42V7 satellite precipitation products in the Yellow River source region, China. J. Hydrol. 2018, 567, 696–711. [Google Scholar] [CrossRef]
  47. Fu, H.; Zhu, L.; Nzabarinda, V.; Lv, X.; Guo, H. Error Characteristic Analysis of Satellite-Based Precipitation Products over Mainland China. Atmosphere 2022, 13, 1211. [Google Scholar] [CrossRef]
  48. Bi, Z.; Sun, S.; Shen, H.; Liu, Y.; Ren, Y.; Li, J.; Lin, B. Systematic assessment of GPM IMERG V06 precipitation products with dense rain gauge observations over Zhejiang Province, China. Int. J. Climatol. 2022, 42, 9471–9493. [Google Scholar] [CrossRef]
  49. Sunilkumar, K.; Narayana Rao, T.; Satheeshkumar, S. Assessment of small-scale variability of rainfall and multi-satellite precipitation estimates using measurements from a dense rain gauge network in Southeast India. Hydrol. Earth Syst. Sci. 2016, 20, 1719–1735. [Google Scholar] [CrossRef]
  50. Shrestha, D.; Sharma, S.; Hamal, K.; Khan Jadoon, U.; Dawadi, B. Spatial Distribution of Extreme Precipitation Events and Its Trend in Nepal. Appl. Ecol. Environ. Sci. 2020, 9, 58–66. [Google Scholar] [CrossRef]
  51. Rodrigues, D.T.; Gonçalves, W.A.; Spyrides, M.H.C.; Santos e Silva, C.M. Spatial and temporal assessment of the extreme and daily precipitation of the Tropical Rainfall Measuring Mission satellite in Northeast Brazil. Int. J. Remote Sens. 2020, 41, 549–572. [Google Scholar] [CrossRef]
  52. Bharti, V.; Singh, C. Evaluation of error in TRMM 3B42V7 precipitation estimates over the Himalayan region. J. Geophys. Res. Atmos. 2015, 120, 12458–12473. [Google Scholar] [CrossRef]
  53. Mahendra, M.S.; Tanaka, T.; Ogawara, K.; Sugiartha, N. Application of GSMaP Product and Rain Gauge Data for Monitoring Rainfall Condition of Flood Events in Indonesia. Int. J. Environ. Geosci. 2017, 1, 36–47. [Google Scholar] [CrossRef]
  54. Nepal, B.; Shrestha, D.; Sharma, S.; Shrestha, M.S.; Aryal, D.; Shrestha, N. Assessment of GPM-Era Satellite Products’ (IMERG and GSMaP) Ability to Detect Precipitation Extremes over Mountainous Country Nepal. Atmosphere 2021, 12, 254. [Google Scholar] [CrossRef]
  55. Ramadhan, R.; Marzuki, M.; Yusnaini, H.; Muharsyah, R.; Tangang, F.; Vonnisa, M.; Harmadi, H. A Preliminary Assessment of the GSMaP Version 08 Products over Indonesian Maritime Continent against Gauge Data. Remote Sens. 2023, 15, 1115. [Google Scholar] [CrossRef]
  56. Takido, K.; Saavedra Valeriano, O.C.; Ryo, M.; Tanuma, K.; Ushio, T.; Kubota, T. Spatiotemporal Evaluation of the Gauge-Adjusted Global Satellite Mapping of Precipitation at the Basin Scale. J. Meteorol. 2016, 94, 185–195. [Google Scholar] [CrossRef]
  57. Kubota, T.; Shige, S.; Hashizume, H.; Aonashi, K.; Takahashi, N.; Seto, S.; Hirose, M.; Takayabu, Y.N.; Ushio, T.; Nakagawa, K.; et al. Global Precipitation Map Using Satellite-Borne Microwave Radiometers by the GSMaP Project: Production and Validation. IEEE Trans. Geosci. Remote Sens. 2007, 45, 2259–2275. [Google Scholar] [CrossRef]
  58. Tang, G.; Behrangi, A.; Long, D.; Li, C.; Hong, Y. Accounting for spatiotemporal errors of gauges: A critical step to evaluate gridded precipitation products. J. Hydrol. 2018, 559, 294–306. [Google Scholar] [CrossRef]
  59. Adam, J.C.; Lettenmaier, D.P. Adjustment of global gridded precipitation for systematic bias. J. Geophys. Res. Atmos. 2003, 108. [Google Scholar] [CrossRef]
  60. Tustison, B.; Harris, D.; Foufoula-Georgiou, E. Scale issues in verification of precipitation forecasts. J. Geophys. Res. Atmos. 2001, 106, 11775–11784. [Google Scholar] [CrossRef]
  61. Wu, X.; Zhao, N. Evaluation and Comparison of Six High-Resolution Daily Precipitation Products in Mainland China. Remote Sens. 2022, 15, 223. [Google Scholar] [CrossRef]
  62. Tang, G.; Clark, M.P.; Papalexiou, S.M.; Ma, Z.; Hong, Y. Have satellite precipitation products improved over last two decades? A comprehensive comparison of GPM IMERG with nine satellite and reanalysis datasets. Remote Sens. Environ. 2020, 240, 111697. [Google Scholar] [CrossRef]
  63. Tang, X.; Li, H.; Qin, G.; Huang, Y.; Qi, Y. Evaluation of Satellite-Based Precipitation Products over Complex Topography in Mountainous Southwestern China. Remote Sens. 2023, 15, 473. [Google Scholar] [CrossRef]
Figure 1. (a) Digital elevation model (DEM) and (b) locations of meteorological stations in mainland China.
Remotesensing 16 00210 g001
Figure 2. The boxplot for precipitation amount statistics for the CC (left column), RB (middle column), and RMSE (right column) in seven sub-regions on an hourly timescale: (ac) NC (northern China); (df) NE (northeastern China); (gi) NW (northwestern China); (jl) SC (southeastern China); (mo) TP (Qinghai–Tibetan Plateau); (pr) YP (Yungui Plateau); (su) XJ (Xinjiang). The upper and lower edges of the box plot represent the first and third quartiles, the line inside the box represents the median, the dot represents the mean, and the black circles show mean anomalies.
Remotesensing 16 00210 g002
Figure 3. Spatial distribution of the CC (left column (a,d,g,j,m,p)), RB (middle column (b,e,h,k,n,q)), and RMSE (right column (c,f,i,l,o,r)) between hourly precipitation data from 2167 stations and SPEs in mainland China.
Remotesensing 16 00210 g003
Figure 4. Taylor diagram with the CC, STD, and RMSE of hourly mean precipitation between the SPEs and gauge observations for each sub-region: (a) NC; (b) NE; (c) NW; (d) SC; (e) TB; (f) YP; (g) XJ.
Remotesensing 16 00210 g004
Figure 5. Scatter density plots of the rainfall rate in mainland China for six types of SPE: (a) MVK-R; (b) MVK-C; (c) NRT-R; (d) NRT-C; (e) NOW-R; (f) NOW-C.
Remotesensing 16 00210 g005
Figure 6. The barplot for categorical indicators, (a) POD, (b) FAR, and (c) CSI, for seven sub-regions on an hourly timescale.
Remotesensing 16 00210 g006
Figure 7. Error dependence in the (a) CC, (b) RB, and (c) RMSE on elevation.
Remotesensing 16 00210 g007
Figure 8. Error dependence in (a) CC, (b) RB, and (c) RMSE on precipitation intensity.
Remotesensing 16 00210 g008
Figure 9. Taylor diagram showing the CC, STD, and RMSE of daily mean precipitation between the satellite-based precipitation products and the reference data for each sub-region (a) NC; (b) NE; (c) NW; (d) SC; (e) TB; (f) YP; and (g) XJ.
Remotesensing 16 00210 g009
Figure 10. The barplot for categorical indicators, (a) POD, (b) FAR, and (c) CSI, for seven sub-regions on the daily timescale.
Remotesensing 16 00210 g010
Table 1. Summary of the GSMaP products used in this study [41].
Data NameAbbreviationLatencyResolutionGauge Correction
GSMaP_NOWNOW-R0 h0.1° half hourNone
GSMaP_NOW_GNOW-C0 h0.1° half hour Correction by empirical coefficients
GSMaP_NRTNRT-R4 h0.1° hourlyNone
GSMaP_NRT_GNRT-C4 h0.1° hourlyCorrection by empirical coefficients
GSMaP_MVKMVK-R3 days0.1° hourlyNone
GSMaP_GaugeMVK-C3 days0.1° hourlyCorrected by daily rain gauges
Table 2. Statistical metrics for evaluating SPPs.
Metric CategoriesStatistical MetricsFormulaOptimal Value
Continuous MetricsCorrelation Coefficient (CC) C C = i = 1 N ( R S - R S ¯ ) ( R C - R C ¯ ) i = 1 N ( R S - R S ¯ ) 2 + i = 1 N ( R C - R C ¯ ) 2 1
Relative Bias (RB) R B = i = 1 N ( R S - R C ¯ ) i = 1 N R C ¯ × 100 % 0
Root Mean Square Error (RMSE) R M S E = 1 N i = 1 N ( R S - R C ¯ ) 2 0
Categorical MetricsProbability of Detection (POD) P O D = H H + M 1
False Alarm Ratio (FAR) F A R = F H + F 0
Critical Success Index (CSI) C S I = H H + F + M 1
Note: N denotes the number of simples; i denotes the i th data; R s denotes satellite precipitation; R c denotes station precipitation; R s ¯ and R c ¯ denote mean values of R s and R c , respectively. H (hit) is the number of times precipitation was observed and both the observed and satellite-observed precipitation exceeded the 0.1 mm/h threshold. M (miss) is the number of times precipitation was observed but the observed precipitation exceeded the threshold while satellite-observed precipitation did not. F (false alarm) is the number of times the observed precipitation was below the threshold while the satellite-observed precipitation reached or exceeded the threshold.
Disclaimer/Publisher’s Note: The statements, opinions and data contained in all publications are solely those of the individual author(s) and contributor(s) and not of MDPI and/or the editor(s). MDPI and/or the editor(s) disclaim responsibility for any injury to people or property resulting from any ideas, methods, instructions or products referred to in the content.

