Abstract
The performance of a high-frequency (HF) radar network situated within the Pearl River Estuary from 17 July to 13 August 2022 is described via a comparison with seven acoustic Doppler current profilers (ADCPs). The radar network consists of six OSMAR-S100 compact HF radars, with a transmitting frequency of 13–16 MHz and a direction-finding technique. Both the radial currents and vector velocities showed good agreement with the ADCP results (coefficient of determination r2: 0.42–0.78; RMS difference of radials: 11–21.6 ; bearing offset : –; complex correlation coefficient : 0.62–0.96; and phase angle : −24.317.8). For these radars, the values are not constant but vary with azimuthal angles. The relative positions between the HF radar and ADCPs, as well as factors such as the presence of island terrain obstructing the signal, significantly influence the errors. The results of spectral analysis also demonstrate a high level of consistency and the capability of HF radar to capture diurnal and semidiurnal tidal frequencies. The tidal characteristics and the Empirical Orthogonal Function (EOF) results measured by the HF radars also resemble the ADCPs and align with the characteristics of the estuarine current field.
1. Introduction
Since the discovery of Bragg scattering between electromagnetic waves and the sea surface [1], the number of high-frequency (HF) radars operating at frequencies between 3 and 30 MHz has rapidly increased worldwide. Presently, there are estimated to be over 500 HF radars operating globally, which facilitate nearshore observations and monitoring tasks in numerous coastal regions. HF radars are capable of receiving electromagnetic signals within an offshore range of approximately 200 km. By utilizing first-order and second-order echo inversion, they extract information about sea surface currents, waves, and winds from the raw signals [2,3,4,5,6]. The high-spatiotemporal-resolution data products obtained by HF radars find broad applications in operational observations and forecasting, disaster prevention, and early warning, as well as studies regarding sea surface physical processes [4].
Beam forming and direction finding are two methods used for calculating the bearing directions to a cell of the sea surface. Based on the above methods, HF radars can be roughly divided into two types. The Wellen radar (WERA [7]) produced in the USA, the ocean surface current radar (OSCR [8]) from the UK, and the Surface Wave Radar 503 (SWR503) from Canada can be classified as beam-forming radars. Phased arrays of antennas are utilized to receive the echo signals. The direction-finding radar types, such as the Coastal Ocean Dynamics Application Radar (CODAR [9]), SeaSonde from the USA, and Ocean State Monitoring and Analyzing Radar (OSMAR [10]) from China, depend on antennas of compact size and complex configurations to obtain bearing directions.
Through comparisons with observations, the fundamental current measurements of HF radar have been tested in many studies. Barrick et al. [2] and Frisch and Weber [11] compared the currents measured by CODARs with drifters separately in Florida and Alaska. Holbrook et al. [12] used Vector-Averaging Current Meters (VACMs) to verify the CODAR measurements. Paduan et al. [13] and Yoshikawa et al. [14] conducted a comparison experiment between CODAR and shipborne acoustic Doppler current profilers (ADCPs). Emery et al. [15] evaluated CODAR current measurements with moored current meters. The currents detected by OSCR were validated by diverse observational instruments. Matthews et al. [13,16,17,18,19,20,21] conducted a phased synthesis of existing HF radar studies for ocean current validation, concluding that the root mean square difference (RMSD) values of current measurements via HF radar ranged between 5 and 27 cm/s during that period. Beginning in the 2000s, comparative assessments of HF radar predominantly employed ADCPs or current meters, with errors also generally falling within this range [15,22,23,24,25,26,27]. Historical comparative studies have uniformly concurred that, notwithstanding certain discrepancies compared to in situ observations, HF radar systems are capable of meeting the fundamental requirements for nearshore ocean current observations. In addition, the errors in comparative experiments are influenced not only by the performance of the radar itself but also by the environmental conditions within the detection area and the methods employed for validation [15,18,28].
In comparative experiments, radial velocity validations are the most prominent method used to evaluate the performance of a single-site radar. Laws et al. [29] conducted computer simulations to analyze errors in radial current velocity measurements obtained from individual radars and compared data differences between Multiple Signal Characterization (MUSIC) and beam forming. Zhu et al. [28] determined the observation errors that originated from a specific single radar by projecting the vector velocities onto radar radials and comparing them with the model-simulated currents. Chapman et al. [17] conducted measurements at Hatteras Inlet, revealing that the upper limit of the errors in radar radial current velocities was approximately 7–8 cm·s−¹. The primary sources of validation errors were the systematic errors inherent to the instrument itself and the discrepancies between the instrumental observations and the actual movement of targets. Off the western coast of the United States, a comparison between OSCR and seafloor-based ADCP indicated that the RMSDs of radial currents ranged between 12.6 and 16.2 cm·s−¹ [19]. Kohut et al. [30] demonstrated much lower RMSDs for radial current velocities, measuring only 6.7 cm·s−¹, through a comparison of CODAR and ADCP data at a depth of 4.5 m. From the analysis of Graber et al. [18], it is apparent that the inherent errors in radar current validation are relevant to the circulation characteristics of the ocean within the radar coverage area. Factors, such as velocity shear, Stokes drift, and the baroclinicity of ocean currents, all contribute to discrepancies in the current measurement instruments. Emery et al. [15] conducted a comprehensive analysis of radar ocean current comparison validations once again and employed moored current meters to validate an HF radar monitoring network in Southern California that was composed of CODAR systems. The results indicated RMSDs of radial current velocities that ranged from 7 to 19 cm·s−¹. The error deviations in radial azimuth angles, within a range of 5 to 10 degrees, would result in approximately a 15% velocity deviation and an approximate 9-degree directional deviation in the synthesized vector velocity.
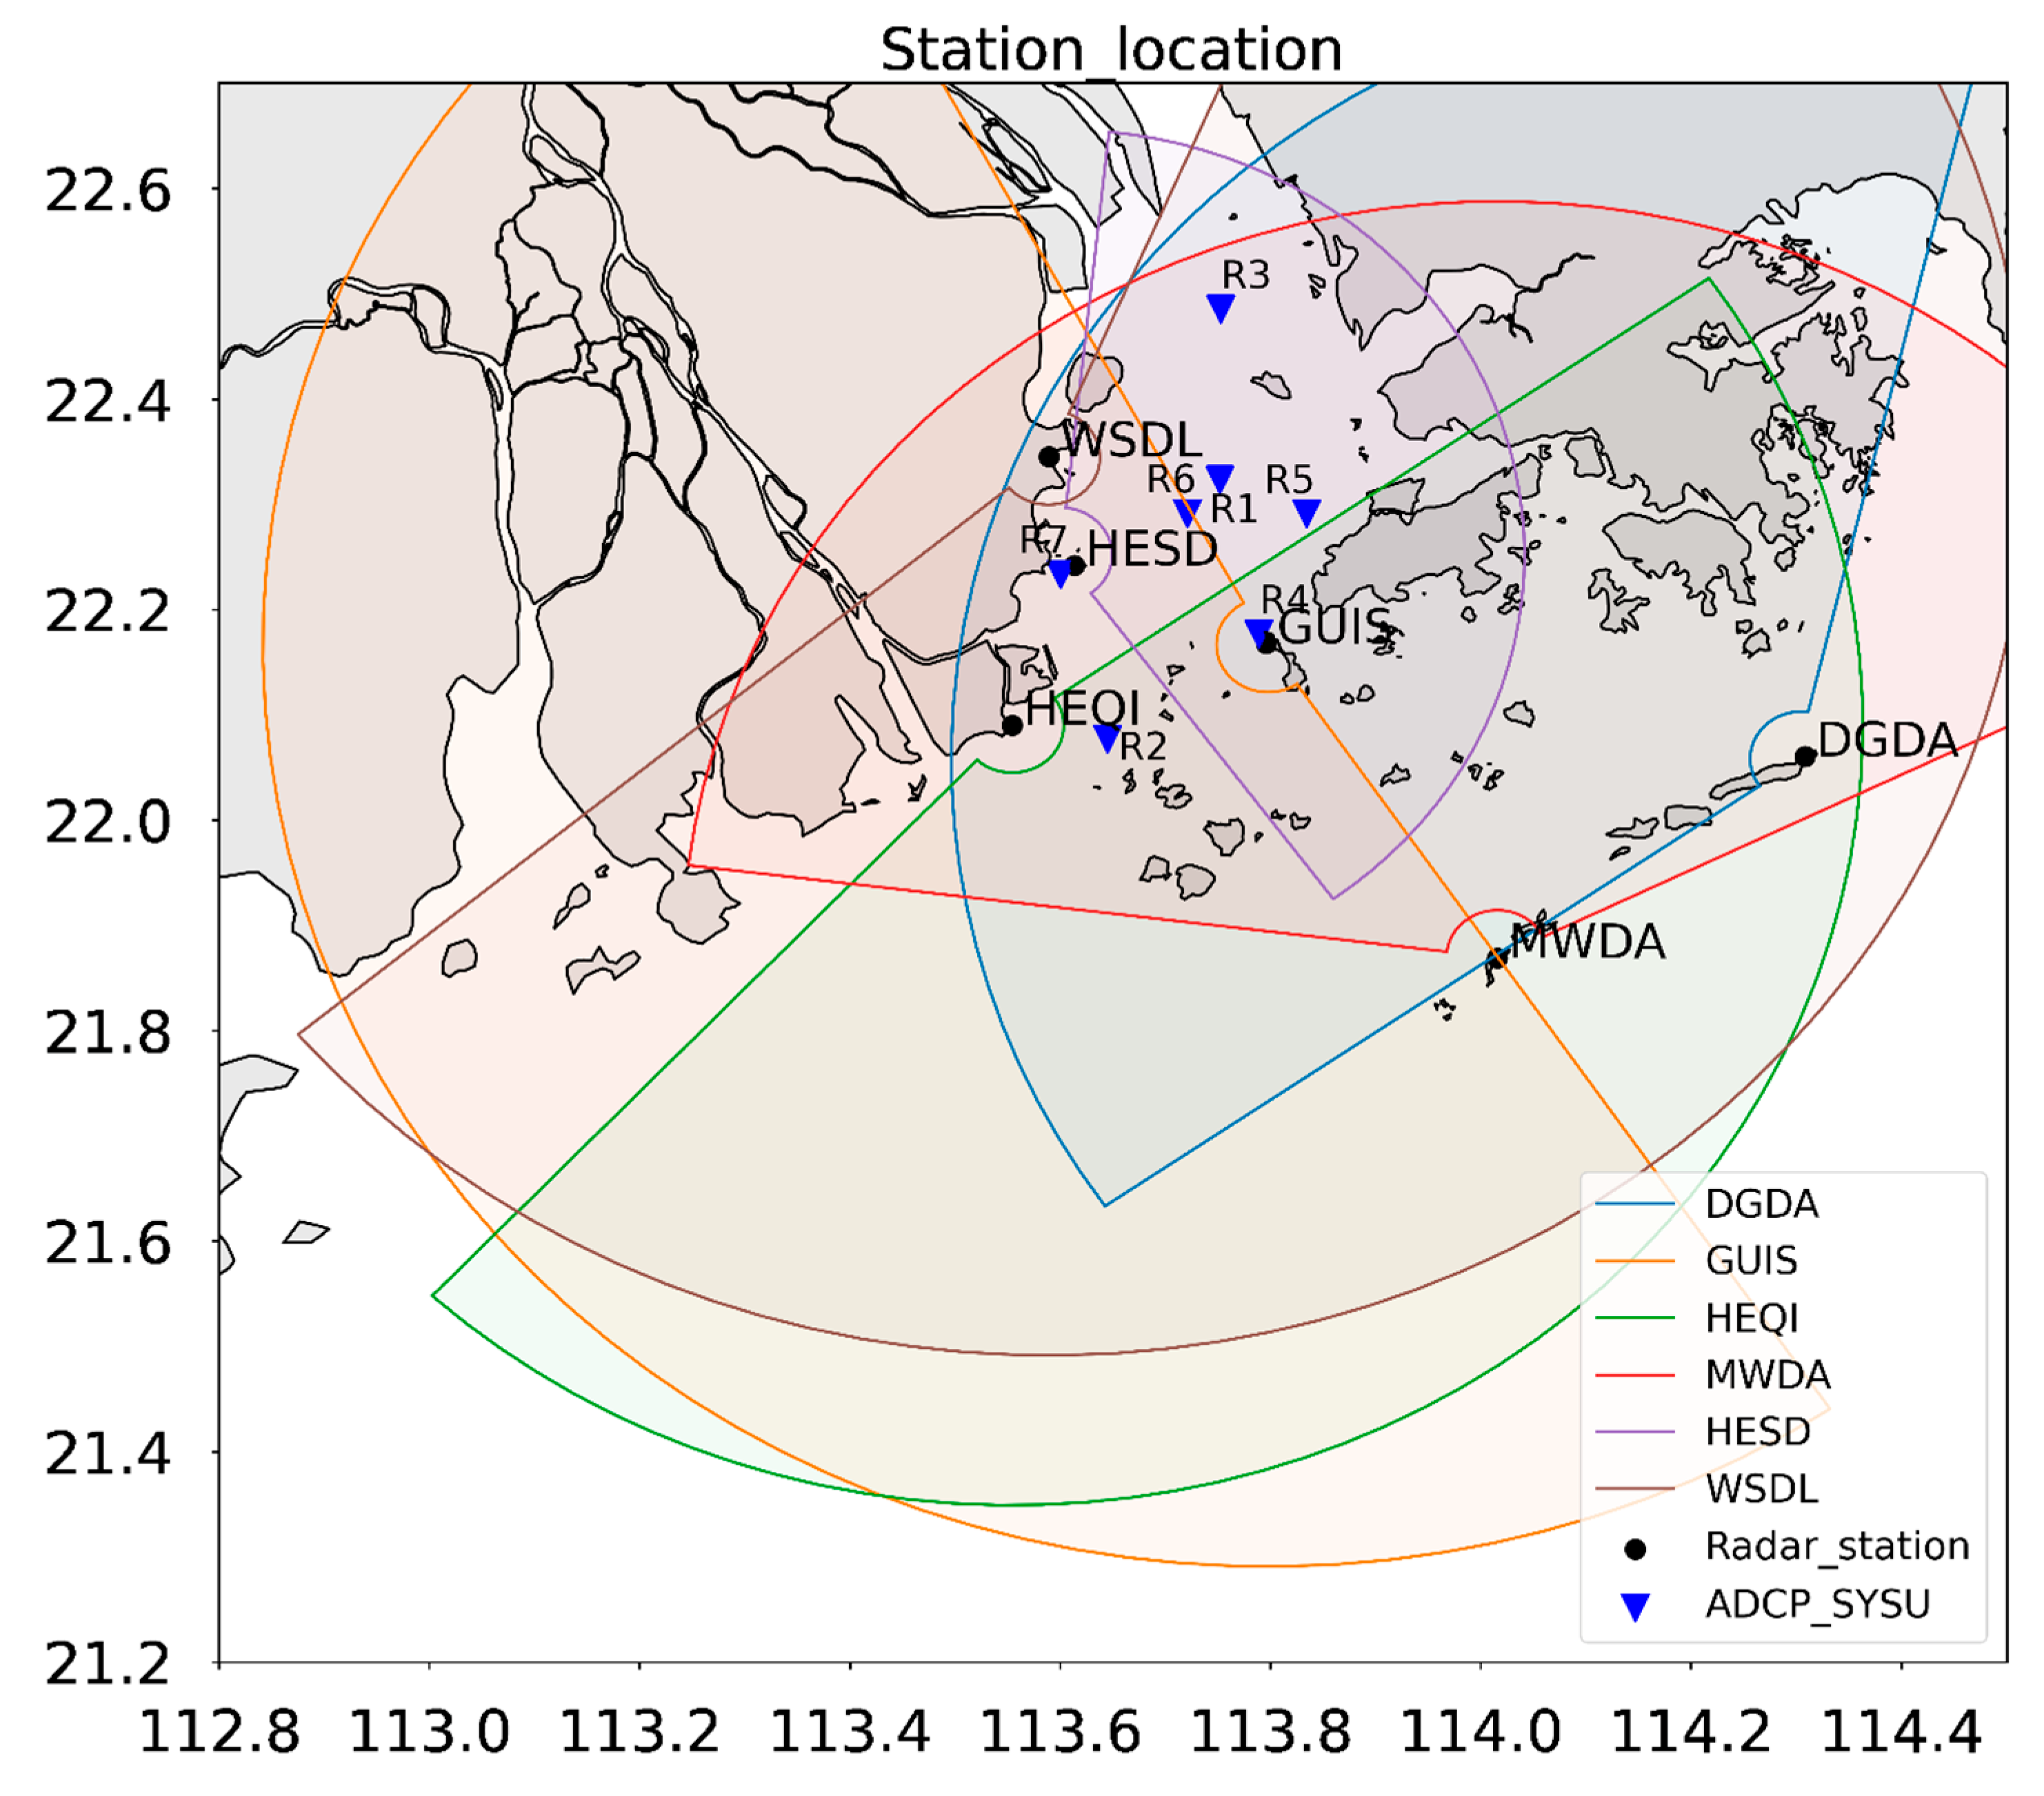
An HF radar network consisting of six OSMAR HF radars has been deployed within the Pearl River Estuary (PRE) since 2020 (Figure 1). In contrast to conventional HF radar networks with continuously deployed radar sites, the detection ranges in certain areas of two or more radar systems in estuarine environments can overlap. Consequently, synthesizing the vector velocities is more flexible. Based on multisite observational data, this study will conduct a comprehensive quality assessment of this radar network, encompassing capabilities related to radial flow detection, direction finding, and the precision of vector current data.
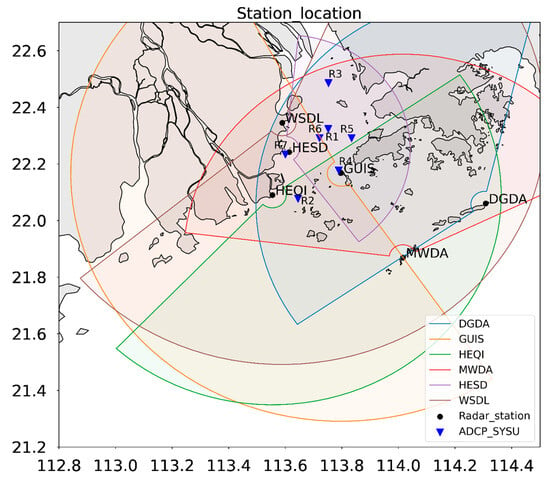
Figure 1.
Study area showing the PRE and adjacent sea. Circular sectors show the maximum radar ranges of single stations. Radar sites are marked by black dots. ADCPs are marked by blue triangles.
2. Materials and Methods
2.1. High-Frequency Radar: OSMAR-S100
The HF radar network within the PRE consists of six OSMAR-S100 compact high-frequency radar units developed by Wuhan University. The development of HF radar in China began in the 1980s. In the early 1990s, the first OSMAR radar system was developed by Wuhan University and underwent site validation [10]. Subsequently, OSMAR2000 and OSMAR071 were successively invented, which featured frequency-modulated intermittent continuous-wave (FMICW) and phased-array antennas [31]. The capabilities of OSMAR for ocean current observations have been extensively validated and are consistent with the CODAR SeaSonde results [3,32,33,34,35,36]. To address the high cost and space requirements of this radar system, a compact high-frequency radar system carrying two loops and a monopole, known as the OSMAR-S series, was developed [37].
The technical parameters for OSMAR-S100 are presented in Table 1. The OSMAR-S100 is a direction-finding-type HF radar operating at 13–16 MHz transmitting frequency. Compact crossed-loop receiving antennas are deployed to process the signals, with a temporal resolution of 20 min and a nominal range resolution of 2.5 km.

Table 1.
Technical parameters for the OSMAR-S100 current measurements.
Given that all six radars are deployed within the Pearl River Estuary, there are varying degrees of overlap between their detection areas. Typically, vector velocities are derived based on radial velocities from two radars using vector-synthesizing algorithms. However, in scenarios with multiple radars overlapping, there is greater flexibility in choosing how to perform vector synthesizing. At positions where the detection areas of three or more radars overlap, the vector velocity data we currently gain are synthesized by the radar system using the radial velocity data from the two best radars selected based on the signal-to-noise ratio. Additionally, there are ongoing tests with other innovative multisite synthesis algorithms, such as neural network-based multisite synthesis algorithms.
2.2. Mooring Instruments and Data Coverage Variations
For the in situ experiment, seven ADCP devices (R1-R7) were placed within the radar detection range in the Pearl River Estuary (Figure 1), and data were collected continuously for nearly one month (17 July to 13 August 2022). The ADCPs were separately deployed at R1 (113.752°E, 22.322°N); R2 (113.645°E, 22.077°N); R3 (113.753°E, 22.485°N); R4 (113.789°E, 22.176°N); R5 (113.834°E, 22.291°N); R6 (113.721°E, 22.291°N); and R7 (113.600°E, 22.233°N). The ADCPs located at R1-R4 are Workhorse II Sentinel ADCPs (600 K or 1200 K, https://www.teledynemarine.com/brands/rdi/workhorse-sentinel-adcp, accessed on 13 September 2023) manufactured by Teledyne RD Instruments. The others are Nortek ADCPs (600 K, https://www.nortekgroup.com/products/aquadopp-profiler-600-khz, accessed on 13 September 2023). As in Zhu et al. [28,38], the velocities of the closest cell to the surface (as determined by the water depth) were chosen for the comparisons, with the same temporal resolution as HF radar. The depth of the shallowest cells is around 1.6 m and the bin size is 0.5 m. Both radar data and observational data were processed to remove outliers based on the threefold standard deviation principle.
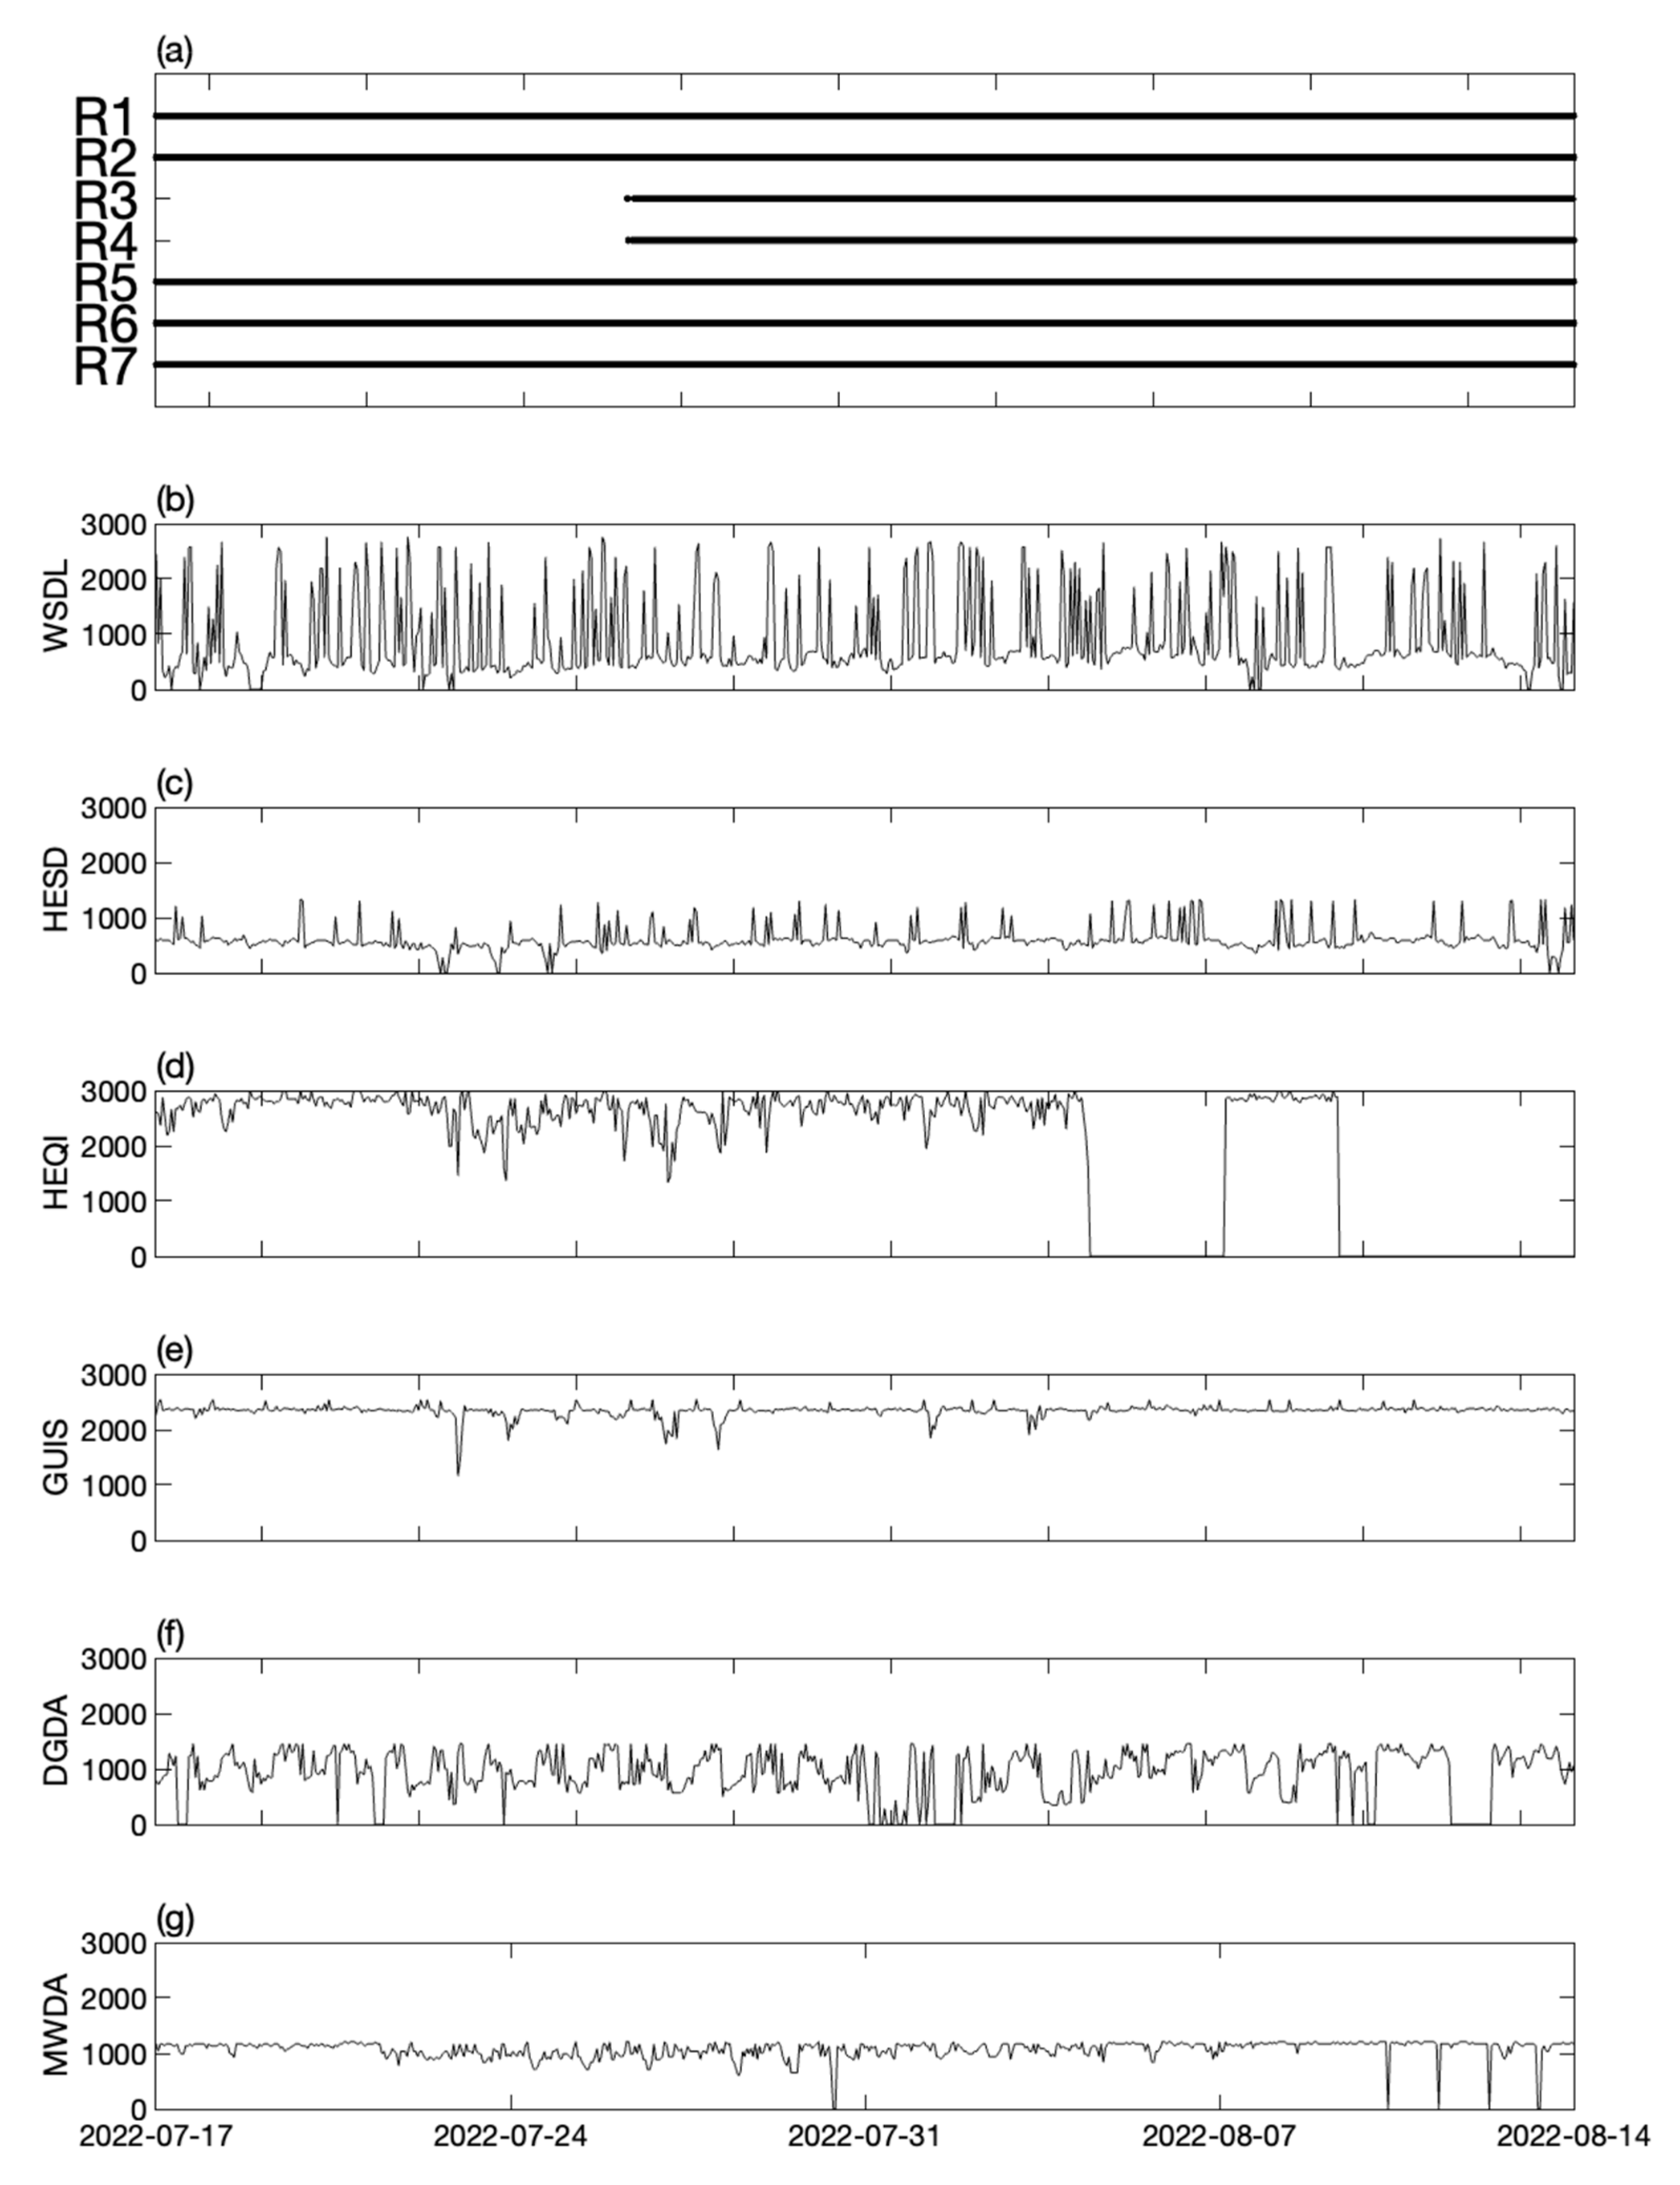
The timelines of the ADCP and HF radar data used for comparison are shown in Figure 2. The time period for comparison follows the mooring data. During the comparative time period, the majority of the ADCP and radar systems exhibited high-temporal coverages. However, the volume of radar data acquisition varies due to environmental factors such as geographical location or noise interference.
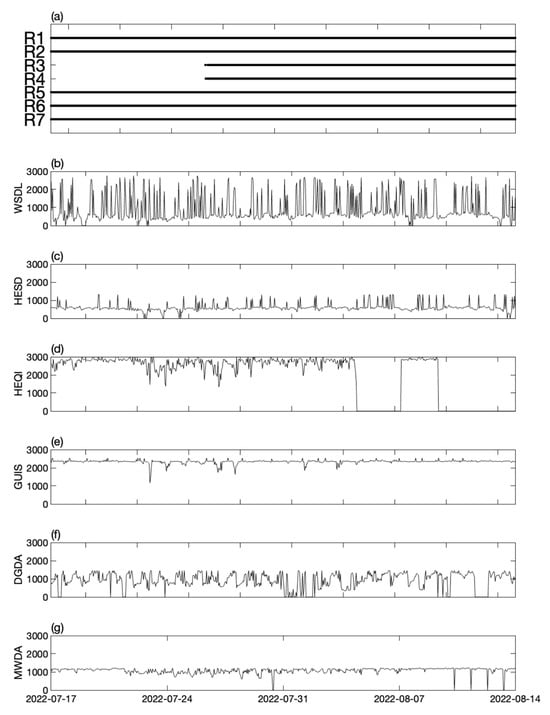
Figure 2.
(a) Timelines of ADCP data availability. (b–g) Time series of single radar coverage, defined as the number of cells returning data each hour, for the six HF radars.
2.3. Statistical Metrics
As a commonly employed statistical method, the coefficient of determination () quantitatively assesses the concordance level between two scalar time series:
In addition, the mean bias (MB), root mean square difference (RMSD or ), and least squares fit are frequently utilized to depict the extent of disparities between two distinct datasets ( and ):
The least squares fit is calculated as:
where k and b represent the slope and y-intercept, respectively.
Proposed by Kundu [39] and applied by many data model analysis studies [24,40,41,42,43,44,45], a quantitative method was used to compare the HF radar-measured velocities and the ADCP-detected velocities. Treating u and v, from the two velocity vectors, as real and imaginary parts, respectively, this vector correlation includes a correlation coefficient and a phase angle :
where ⟨…⟩ represents the mean value of this particular section and , and , are the Cartesian components for the HF radar or ADCP velocity, respectively.
The Empirical Orthogonal Function (EOF) analysis of ocean currents is a statistical method used to reveal spatial variations in oceanic research. This analysis aids in understanding the primary modes of variation within the currents and their spatial distribution. The EOF analysis transforms complex ocean current data into a set of orthogonal modes, each representing a distinct spatial variation. Typically, the first EOF mode explains the largest variation in the current movement, while subsequent modes successively capture smaller but gradually increasing variations. Through these modes, we can identify significant spatial patterns of currents, such as eddies, boundary flows, and seasonal changes. Unlike the traditional EOF analysis applied to all currents within an observational area, EOF ellipses are computed based on individual point-wise ocean current data. The first and second modes resulting from the decomposition of point-wise velocities correspond to the major and minor axes of the ellipse, with the direction calculated through , where and refer to the first and second eigenvector modes, respectively.
3. Results
The HF radar network system is assessed in terms of both radials (radial speed and bearing offset) and totals. Since the comparison combinations are too great in number, comparisons at R1 are clearly presented with figures. The metric tables reveal other comparison results.
3.1. Radial Velocity
In the radial velocity comparison, the radial velocity data for radar were obtained directly from the radar stations and not as a result of vector velocity data projections onto radial coordinates. Hence, the comparison of radial velocities provides more accurate information to assess the detection capabilities of individual radar stations. We selected the radar data points located closest to the observation locations for comparison, and it was found through testing that the results were relatively consistent with those obtained through spatial linear interpolation. The ADCP velocities were projected onto the same reference directions. The coefficient of determination (r2), mean bias (MB), root mean square difference (RMSD), and least squares fit are used to assess the accuracy of the radial speed detections. Outliers in either Vadcp or Vradar are removed prior to the interpolation into hourly data based on the three-times standard deviation criterion.
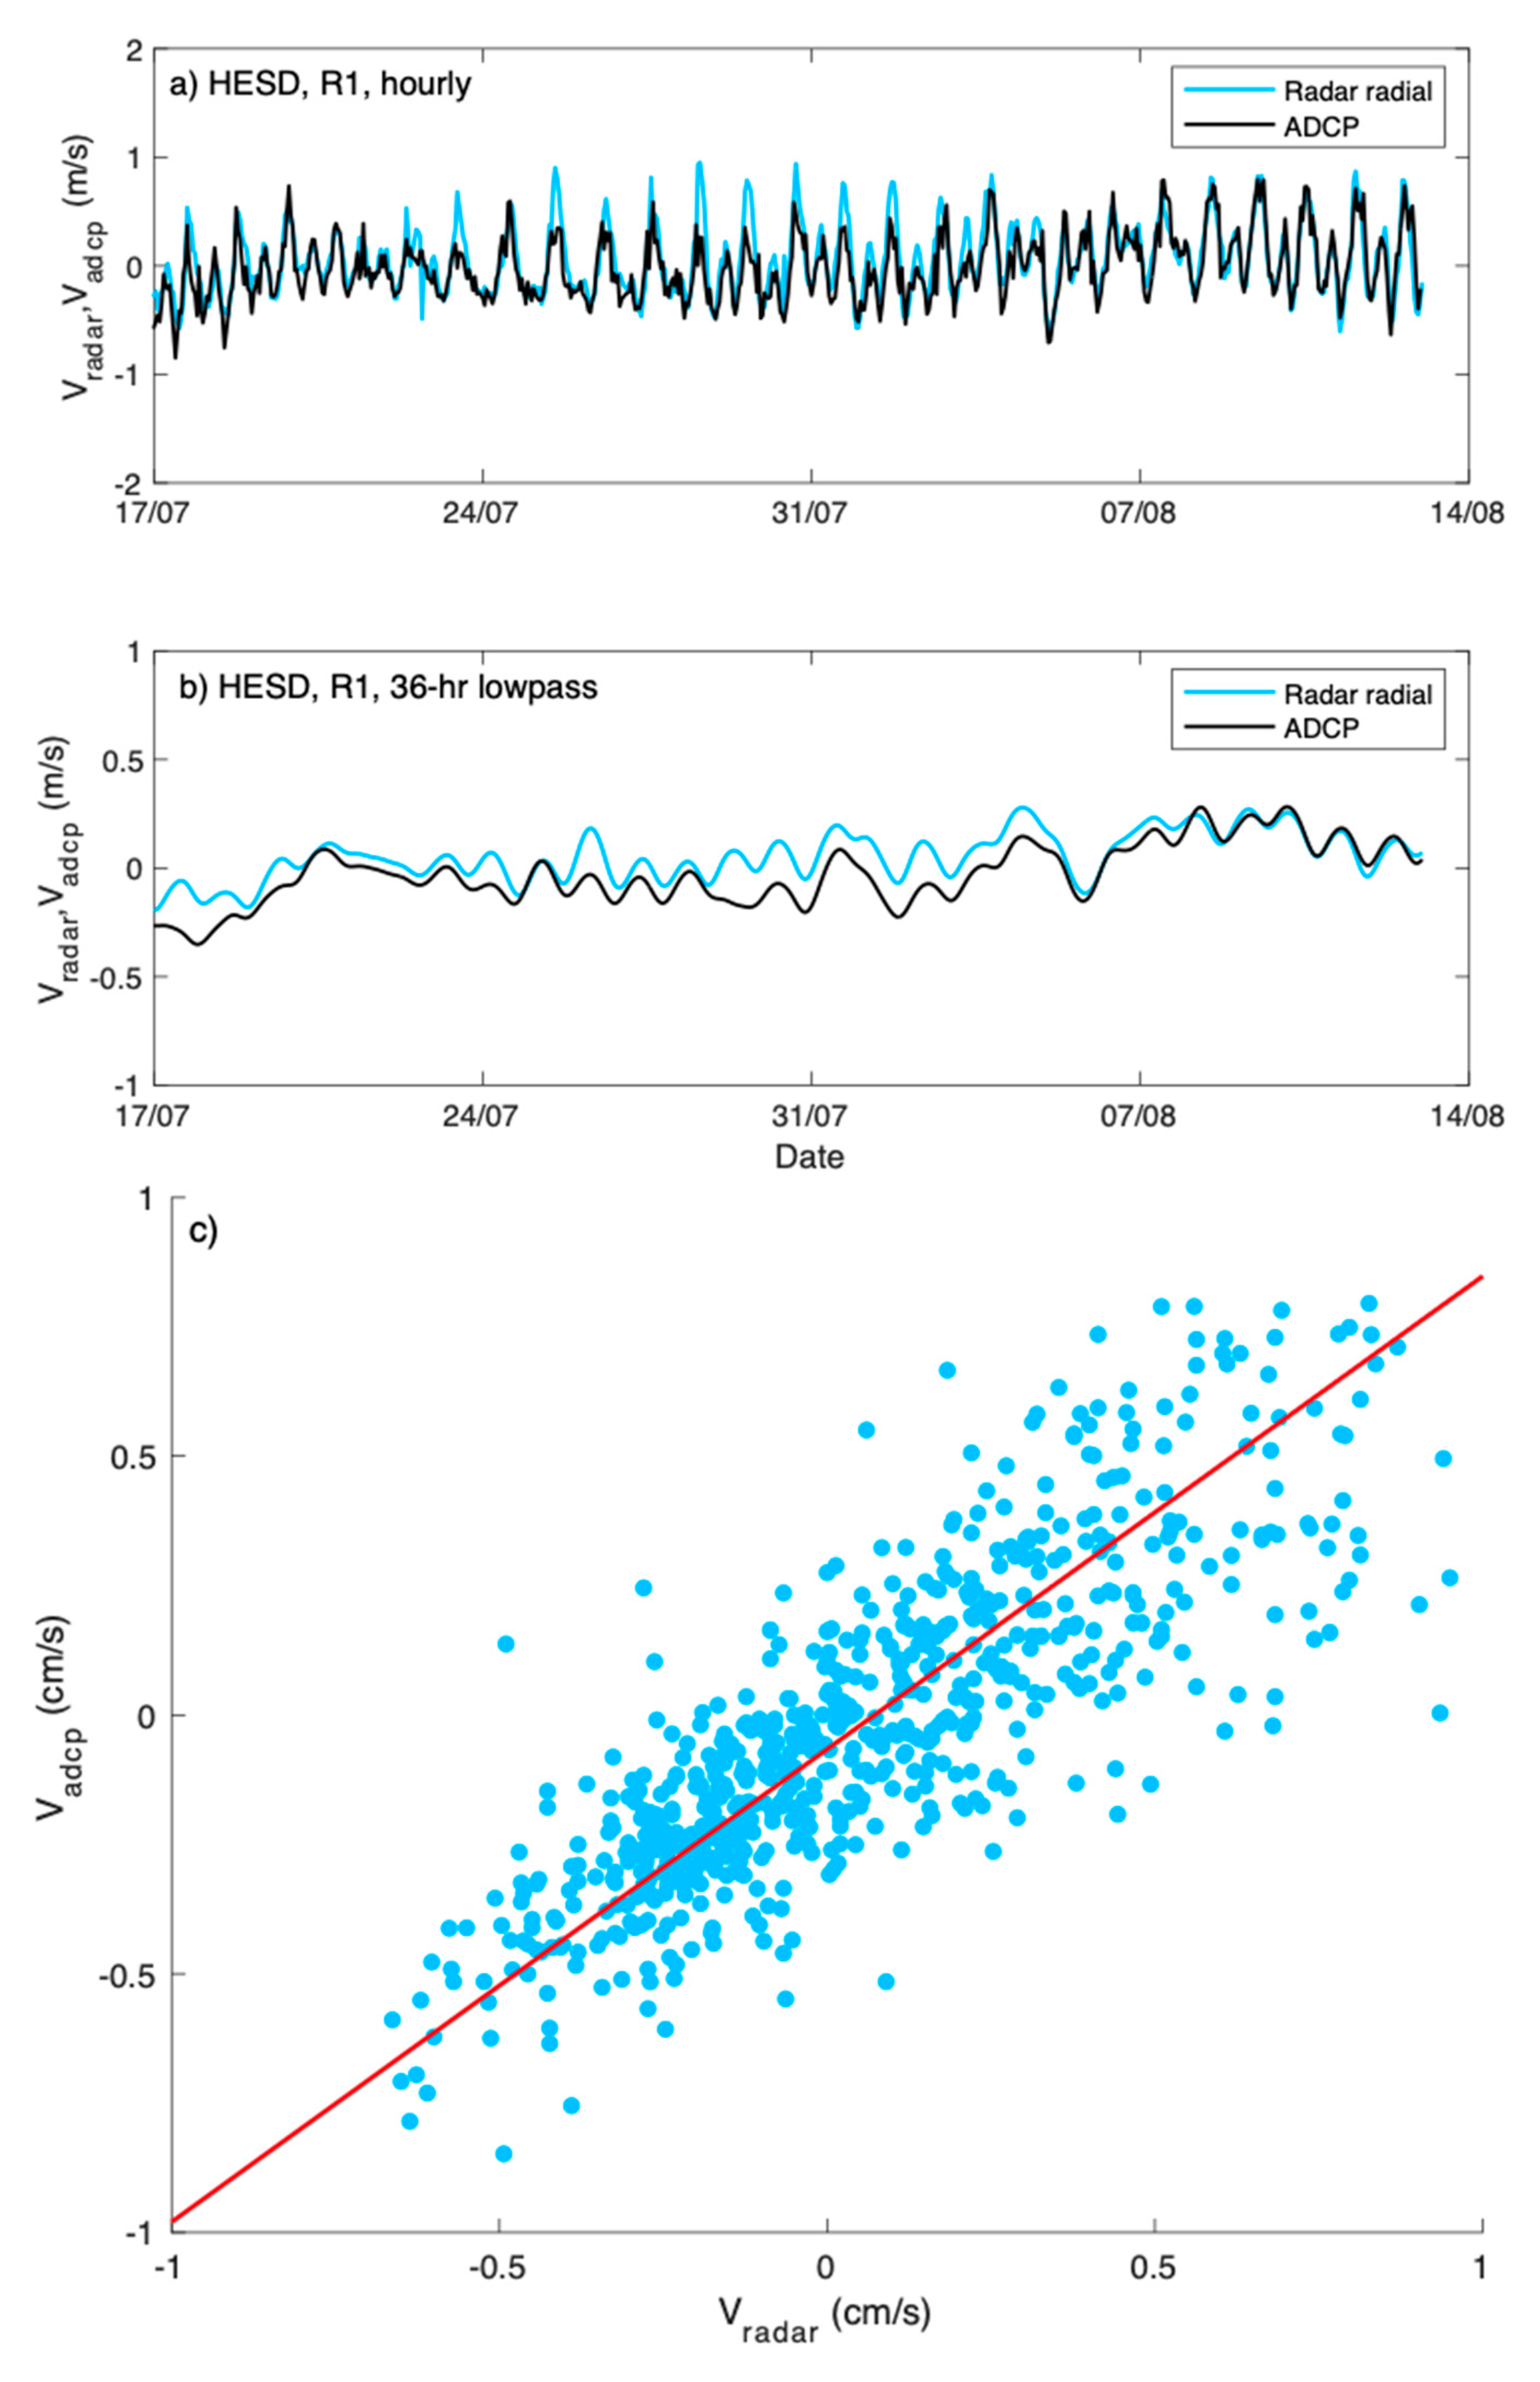
Figure 3 presents the hourly and 36 h lowpass-filtered time series of Vadcp and Vradar from R1-HESD. The hourly time series show strong tidal variations, and the radar data compare well with the ADCP series. The RMSD values are 16.6 cm s−1 for the hourly data and decrease to 7.0 cm s−1 for the 36 h lowpass-filtered data. The coefficients of determination (r2) are 0.78 vs. 0.81, and k = 0.80 vs. 0.86. The relatively higher RMSD values for the hourly data compared to previous studies [15,24] are mainly attributed to the greater variance in current velocities in the observed region. The relative error rates remain close to the levels observed in previous studies.
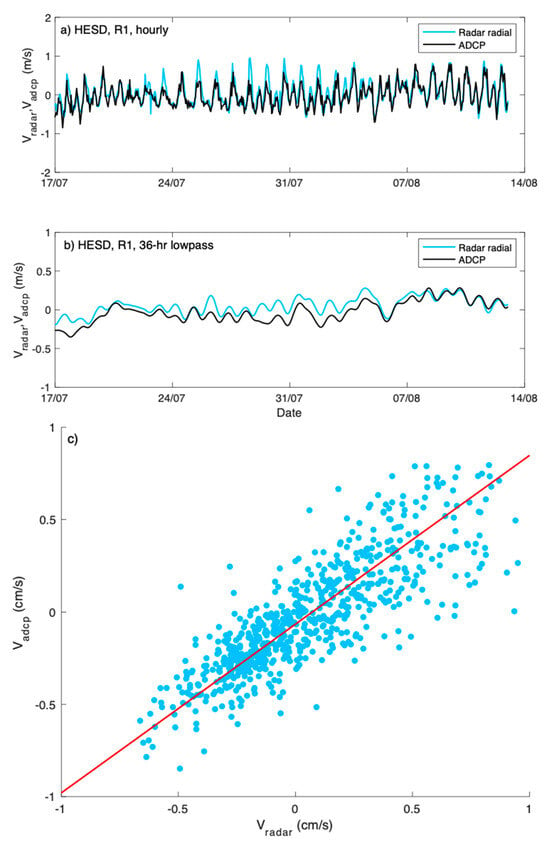
Figure 3.
Comparison of (a) hourly and (b) 36 h lowpass-filtered radar and ADCP radial current time series at mooring R1 for the HESD site. (c) Scatterplot of Vadcp vs. Vradar from (a).
Emulating previous research, this study calculates the coefficient of determination (r2) between the radar-detected data and ADCP-measured velocities within a certain range based on the ADCP deployment locations. Assuming no errors in radar detection, the maximum r2 position should coincide with the ADCP location. Due to the presence of various error sources, this scenario is barely realized. Therefore, the deviation angle between the two positions can serve as a representative measurement of the radar’s detection capability. The bearing offset, a parameter that reflects the direction-finding ability of a single radar station, was defined as
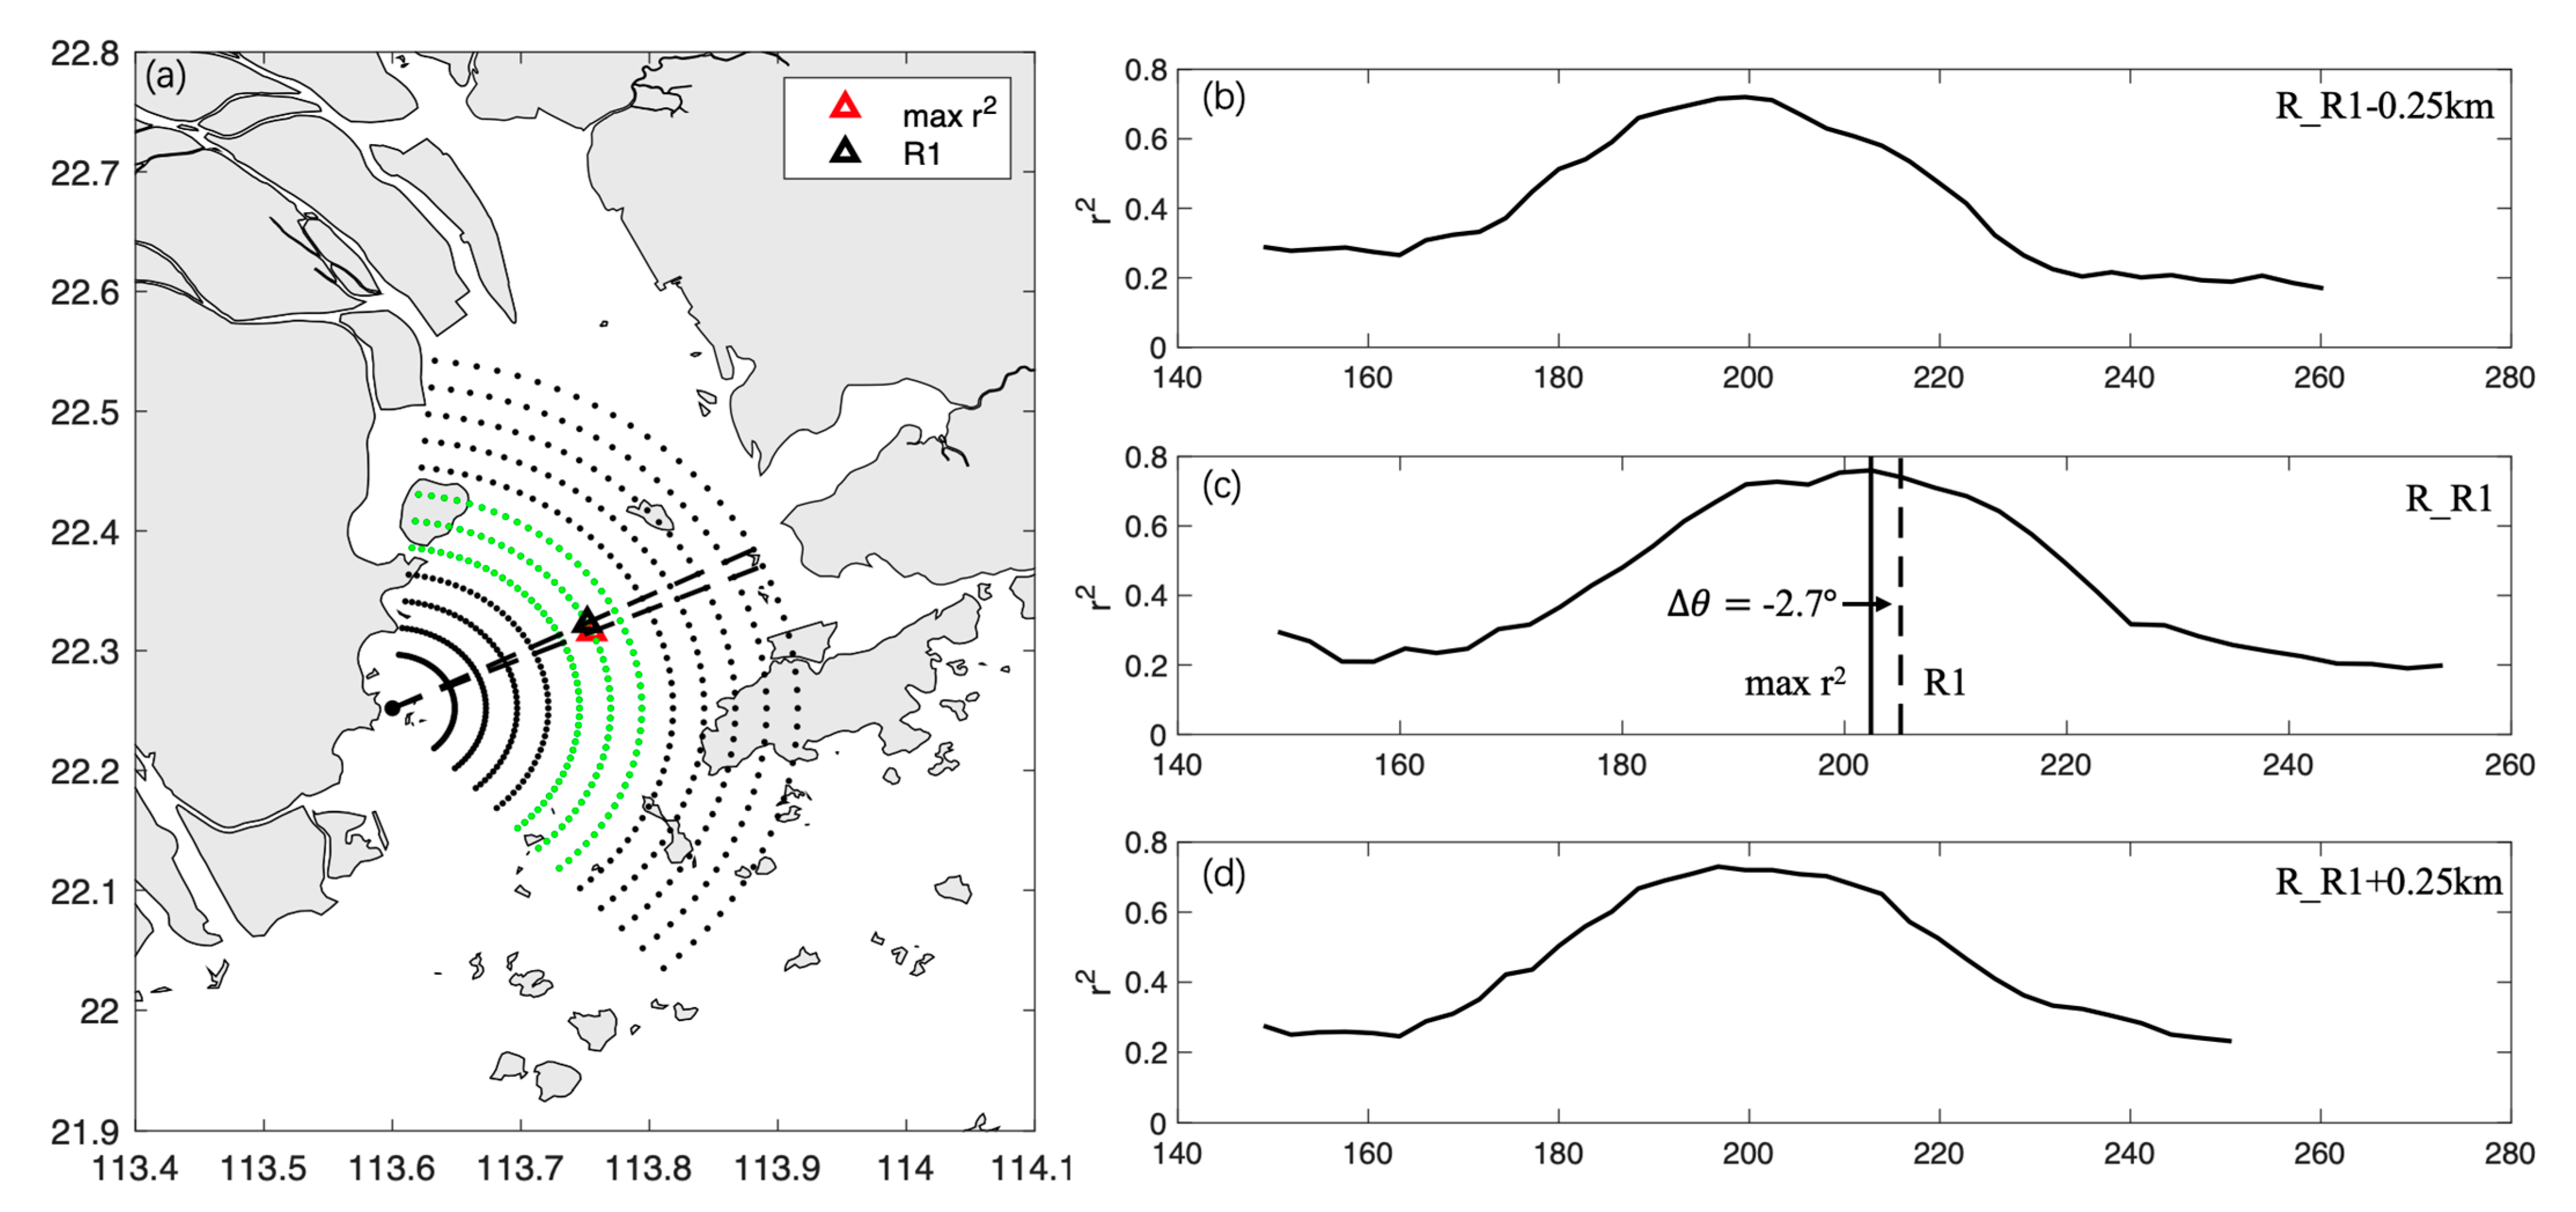
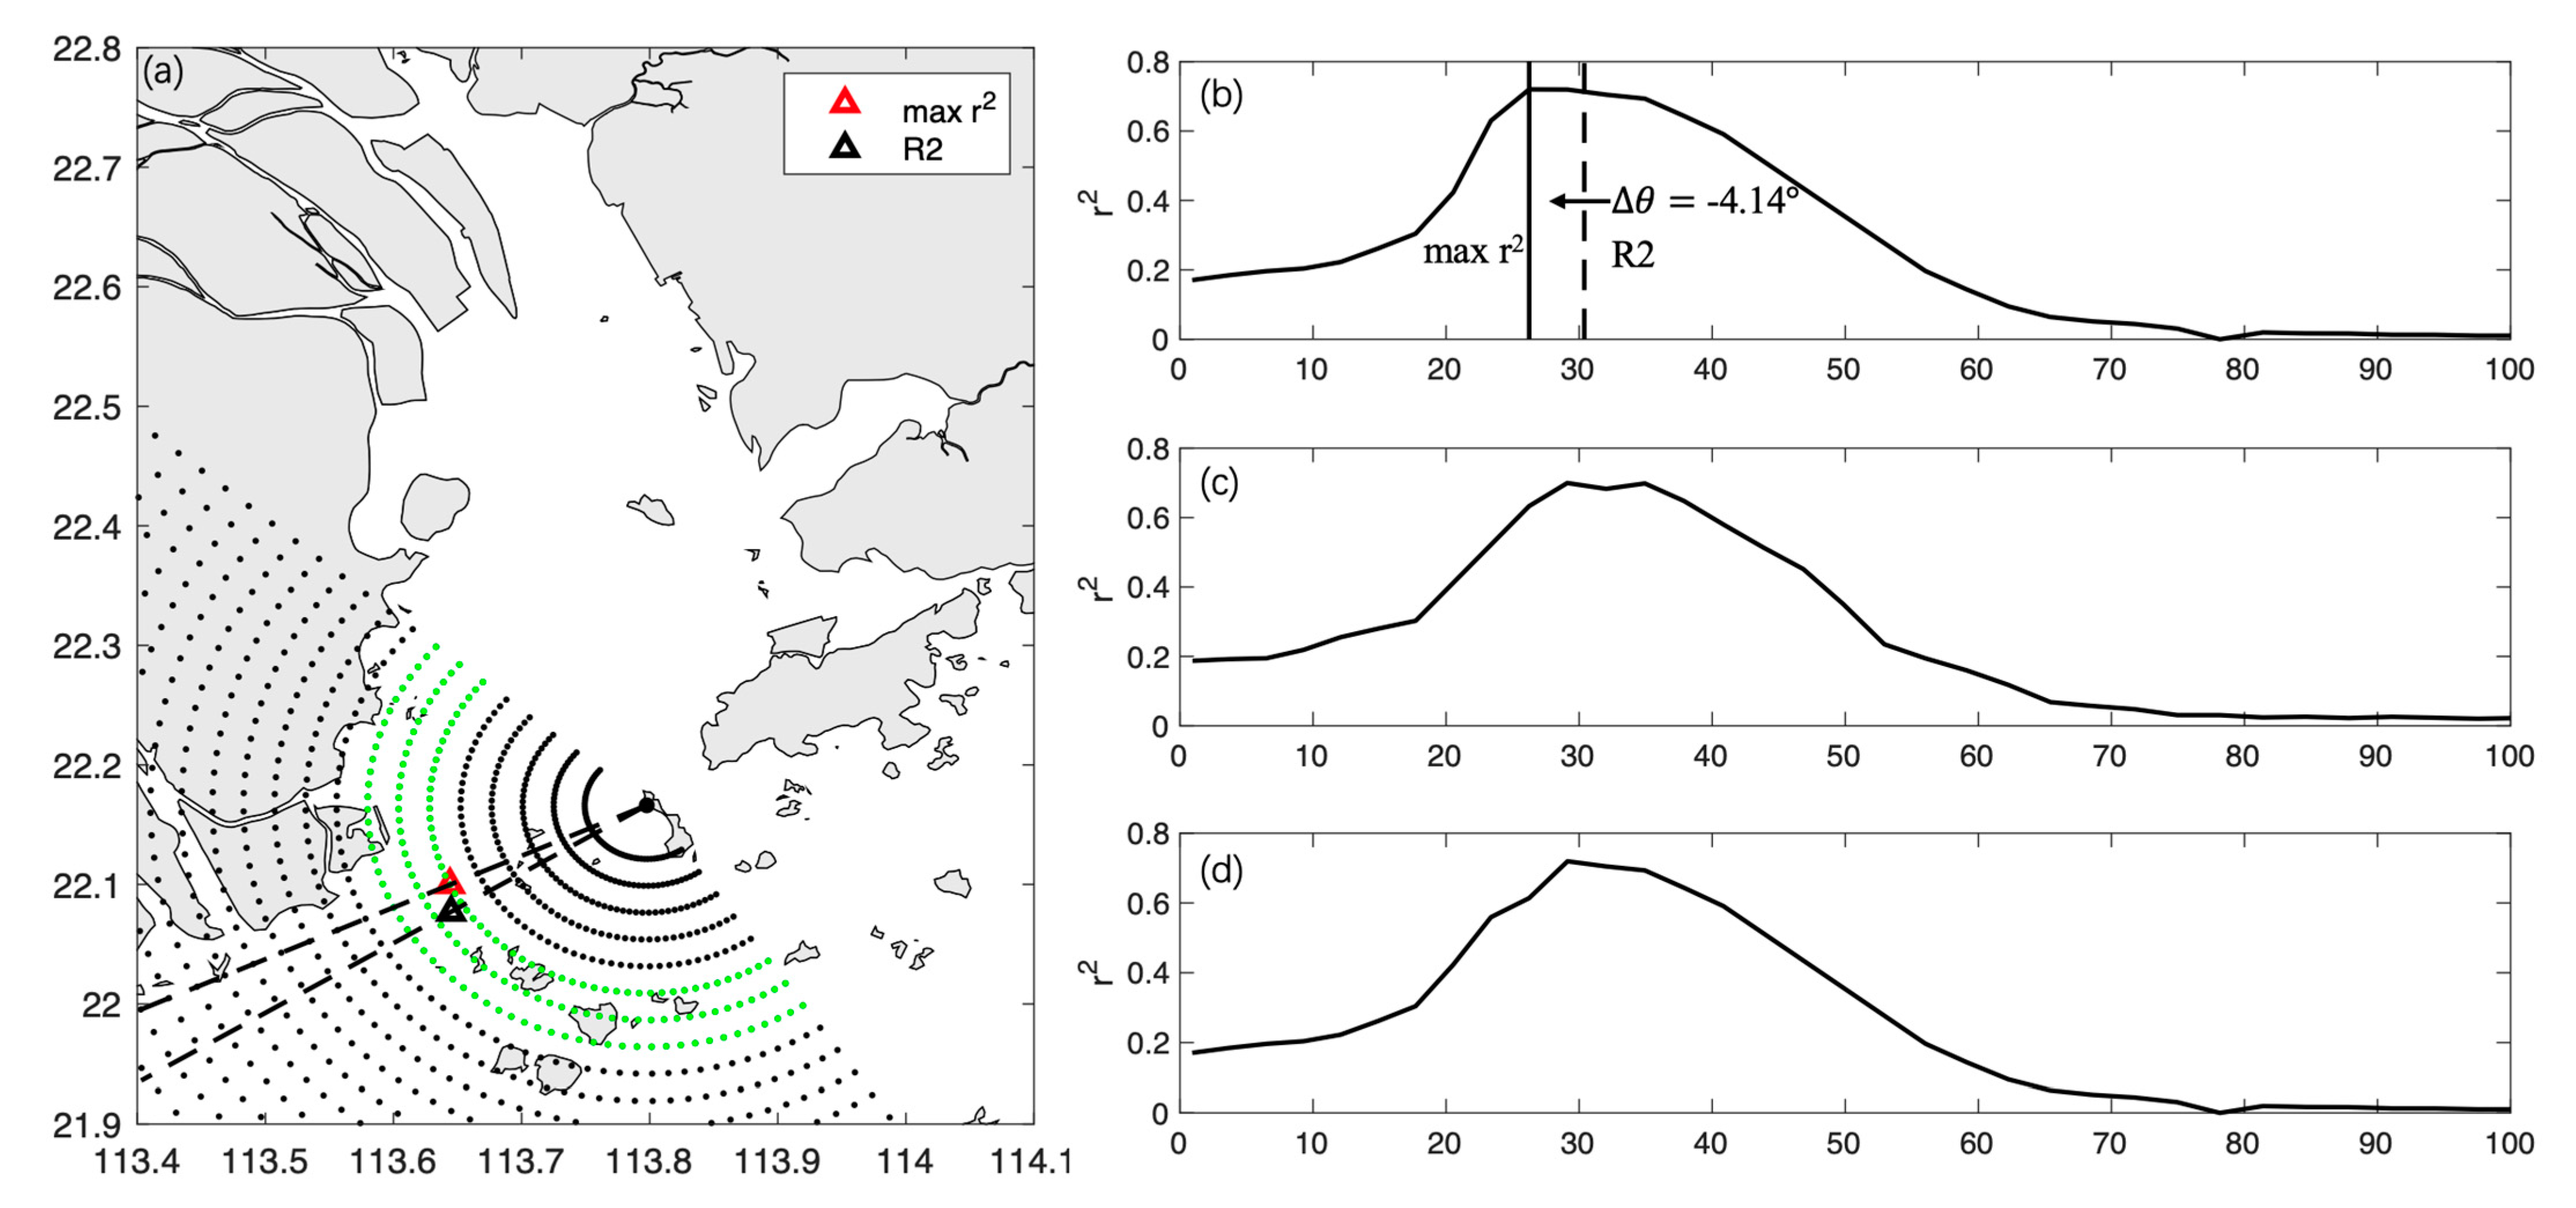
where denotes the azimuthal angle relative to the radar station of the maximum r2 data point, and represents the bearing angle to the ADCP. A positive indicates a clockwise rotation of the position of the maximum r2 data point with respect to the ADCP. Figure 4a presents an example bearing offset based on a comparison between the HESD radar site and R1. The angle between the two black dashed lines denotes . The point with a maximum r2 is calculated from the three nearest radar-detecting circles (marked by the green points) around the position of the ADCP. As shown in Figure 4b–d, the profile of r2 significantly increases near the location of the ADCP. Additionally, for HESD, the maximum r2 occurs at the same range circle as the ADCP, with = −2.7°, suggesting that the offset is in the bearing only. Another example is shown in Figure 5 for the GUIS radar and R2 ADCP. Different from Figure 4, R2 is positioned between two range circles of radar data points, and the location with the maximum r2 occurs within the circle that is closer to the radar station, with = −4.14°. Other comparison results are presented in Table 2. Column 6 of Table 2 shows the values for the 12 HF radar-ADCP comparison pairs. The values range from −4.8° to 16.1° with a mean absolute value of 6.1°. Three radars, including WSDL, HESD, and DGDA, have multiple mooring observation devices in their detection ranges. For these radars, is not constant but varies with azimuthal angle [15]. For instance, at positions R1, R4, and R7, WSDL exhibits notable differences in values.
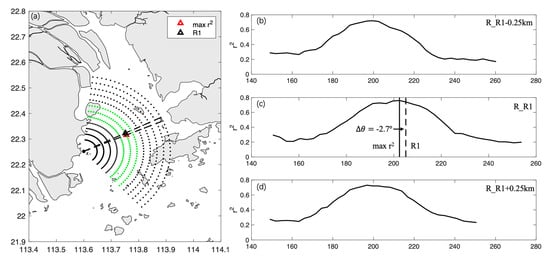
Figure 4.
(a) Map shows radar (HESD, bold black dot) and R1 ADCP (black triangle), with HF radar measurement data points (black dots). The red triangle shows the location with the highest r2 between Vadcp and Vradar. The green points show the locations of the r2 profiles in (b–d). Profiles of r2 between Vadcp and Vradar are shown along ranges of (b) R_R1-0.25 km, (c) R_R1, and (d) R_R1 + 0.25 km.
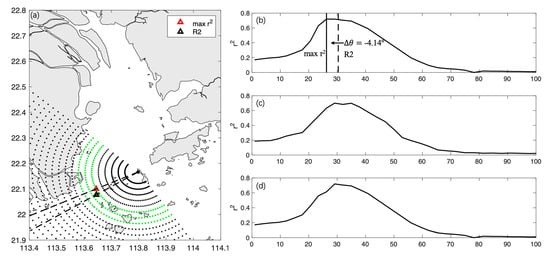
Figure 5.
Same as Figure 4. However, for the GUIS radar and R2 ADCP comparison.

Table 2.
Summary of comparison statistics for 12 HF radar–ADCP pairs. The HF site names and ADCPs are described in the text.
Table 2 summarizes the statistical results of the comparisons between Vadcp and Vradar for all available HF radar–mooring observation pairs over certain periods. Part of the comparative data may lead to minor adjustments in the duration due to instrument hardware issues. The r2 values range from 0.42 to 0.78 (Column 3), and varies in a range from 11 to 21.6 . The absolute magnitudes of the bias range from 1 to 10 . The slopes of the regression lines (k) were in a range from 0.5 to 0.93 with intercepts, b, from −0.08 to 0.05 (Columns 7 and 8). Compared to past studies on HF radar assessments, we posit that HF radar deployments within estuarine settings are more susceptible to high-current velocities and complex terrain, potentially leading to larger errors. However, the relative error rates closely align with HF radars that are deployed in areas without complicated island terrain within the observation range.
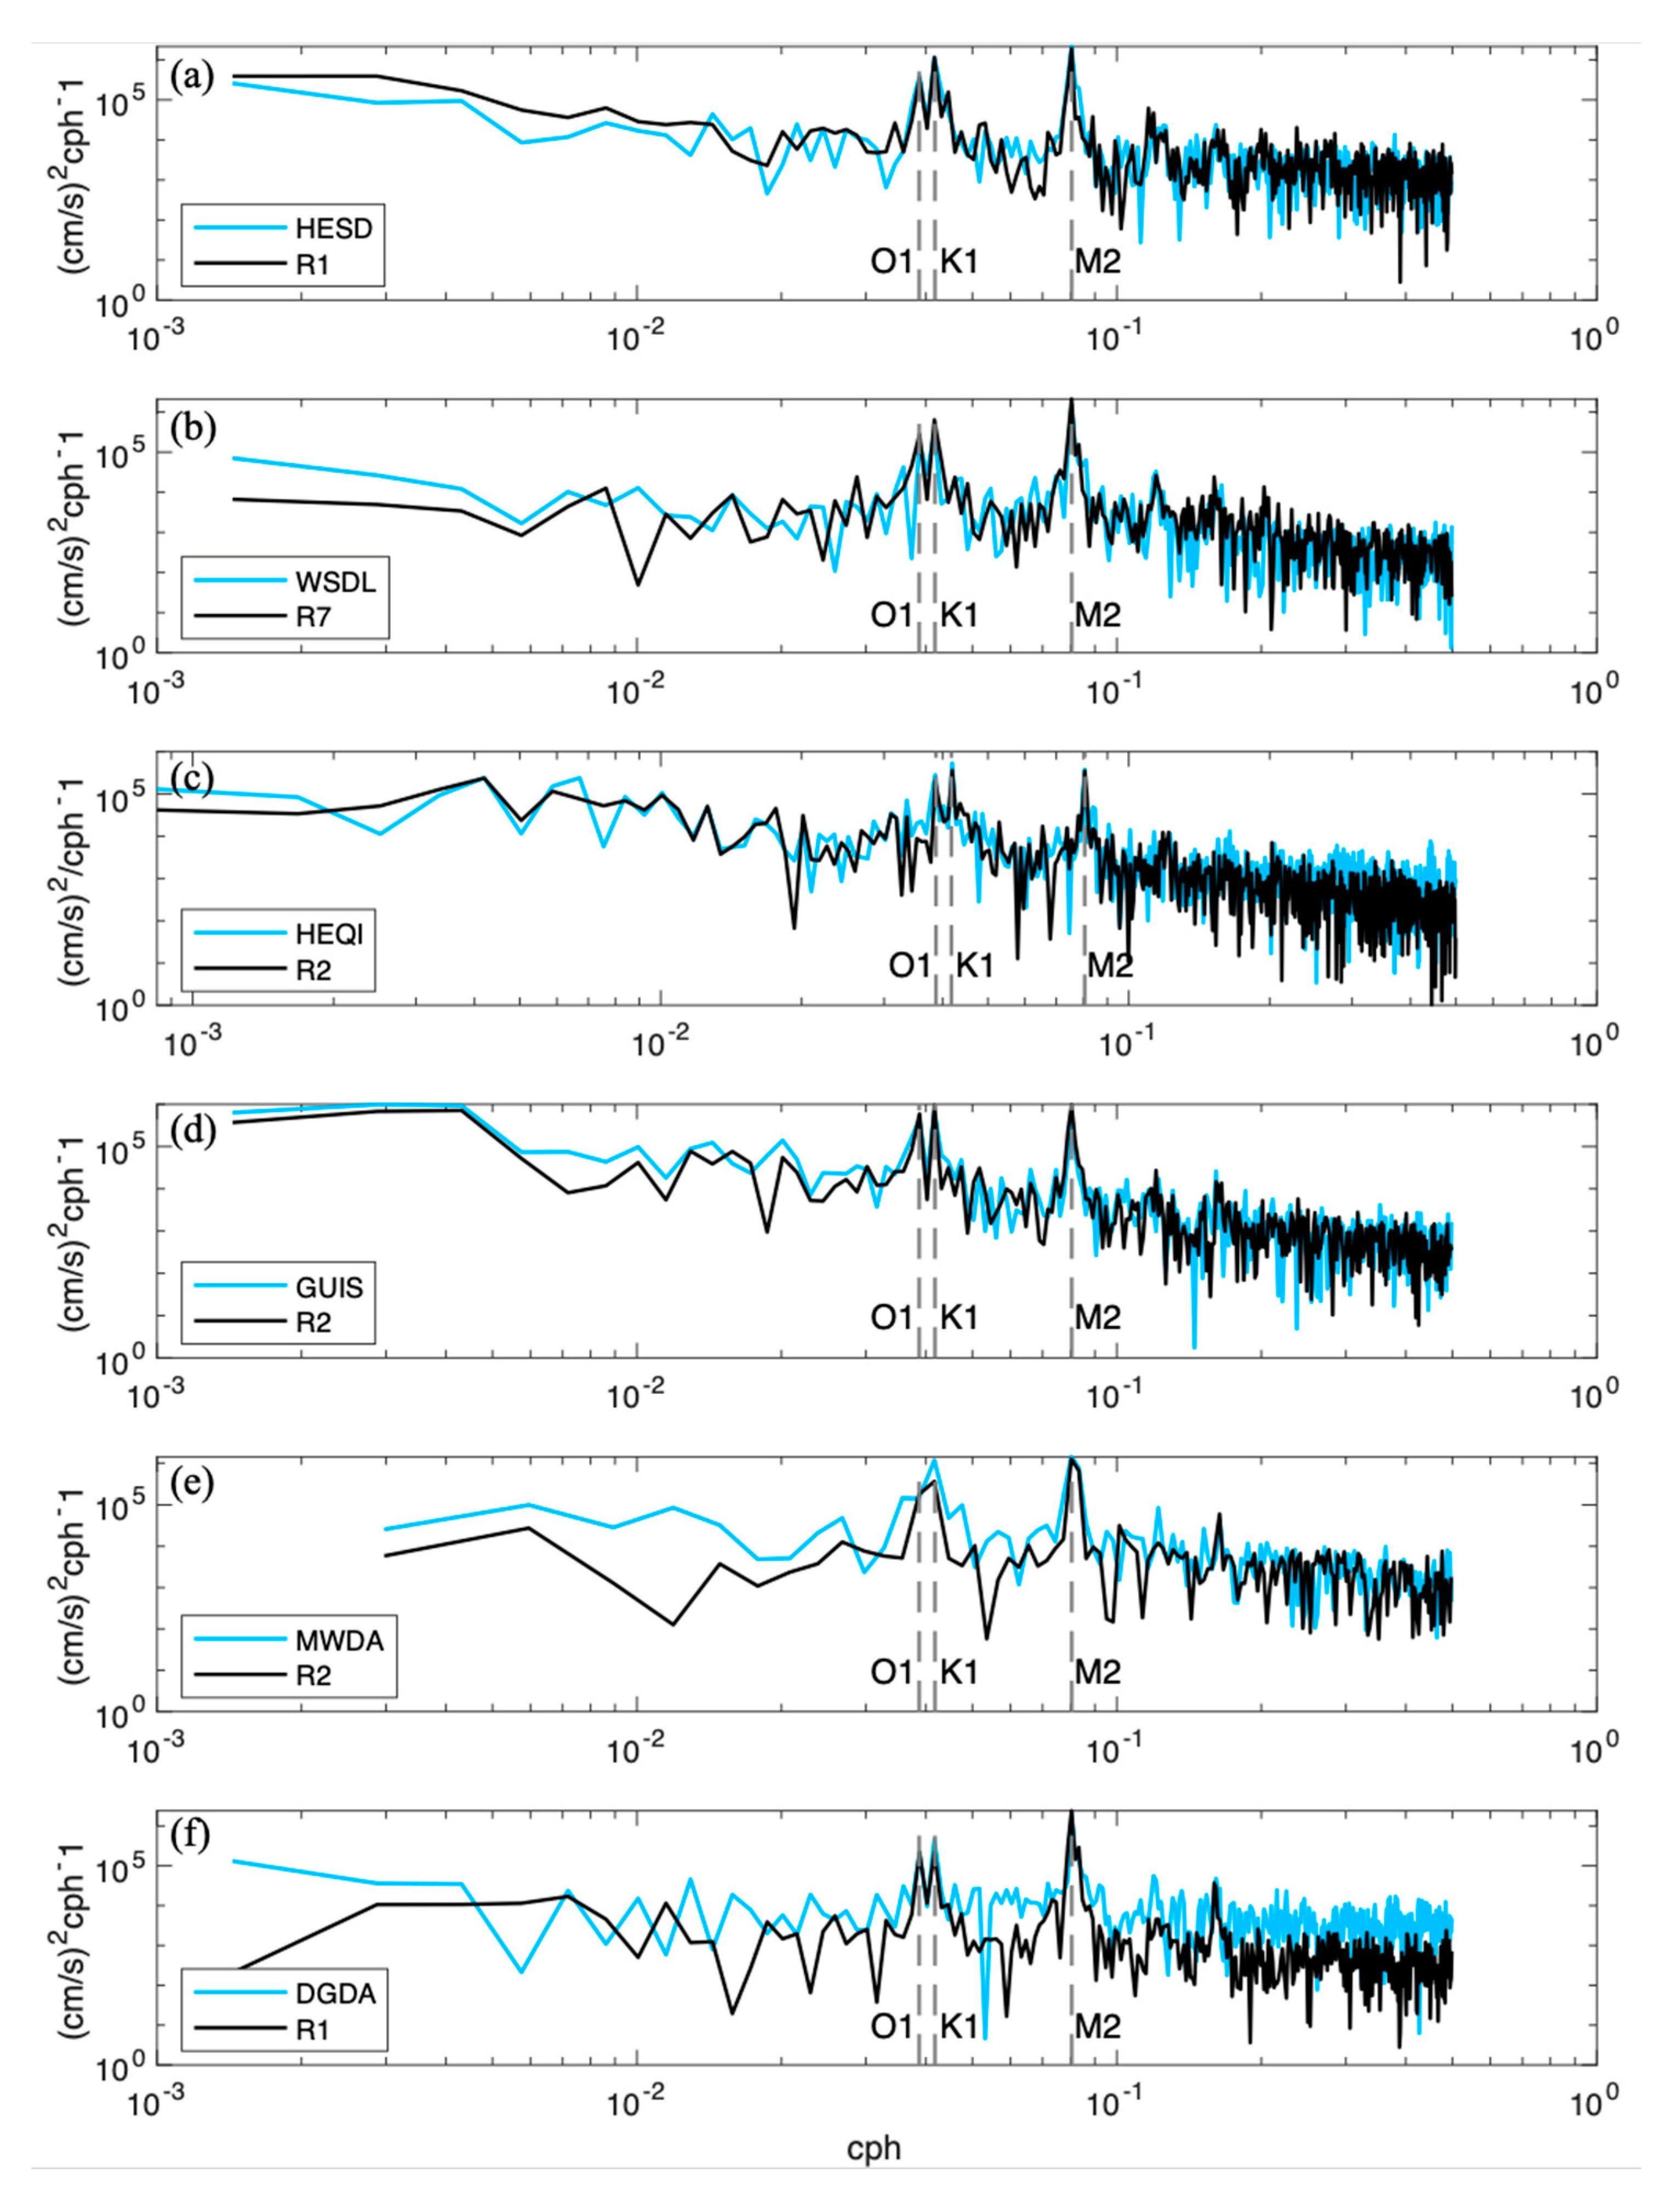
To assess the detection capabilities in the frequency domain of a single-site HF radar, we employed spectral analysis to compare the frequency domain of the radial velocities that were detected by the radar with that obtained by ADCP. Within the coverage areas of certain radars, there exist multiple ADCP installations. Consequently, we opted to compare the radar data with the radial velocity data from the ADCP instrument exhibiting the optimal operational status and closest proximity to the core detection region of certain radars. Figure 6a–f present the power spectra of six single-site radar radial data and the ADCP velocities. On the whole, all radars within the network demonstrate effective detection of tidal characteristics in ocean currents, particularly the prominent tidal components within the Pearl River Estuary, such as the M2, K1, and O1 components. However, variations in performance are observed among different radars for the same mooring observation position. Taking ADCP R1 as a reference, the HESD radar exhibits superior frequency domain performance at both high and low frequencies, as well as that between diurnal and semidiurnal tidal frequencies, when compared to DGDA. This difference may be attributed to the greater distance and presence of islands between R1 and DGDA. Similar circumstances are evident in the comparisons based on the observational data from ADCP R2, where HEQI and GUIS exhibit significantly better frequency domain detection capabilities than MWDA.
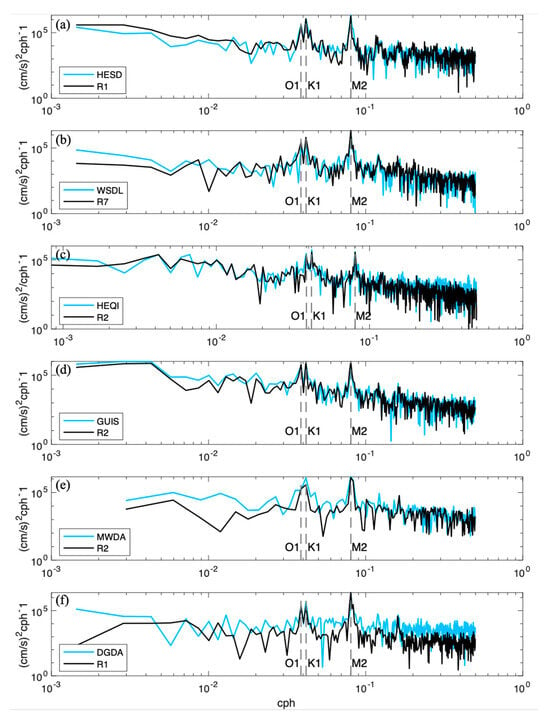
Figure 6.
(a) Power spectra of Vadcp from R1 and Vradar from HESD. (b) As in (a), but for R7 and WSDL. Same for (c) R2 and HEQI, (d) R2 and GUIS, (e) R2 and MWDA and (f) R1 and DGDA. The K1 tidal, O1 tidal, M2 tidal, and inertial frequencies are shown in all panels.
3.2. Total Velocity
Vector velocities can be obtained through the least squares method [3] by synthesizing the radial velocities from single-site radars with overlapping detection ranges, involving two or more observation sites. A prescribed geometrical dilution of precision can then be employed to derive the velocity vectors at a specified grid resolution [17]. During the synthesis process, radial errors are, to a certain extent, transformed into vector velocity errors based on the intersection angles. Our radar network utilizes a network synthesis technique based on the signal-to-noise ratio. For a designated area, data from radars with high signal-to-noise ratios are prioritized for synthesis.
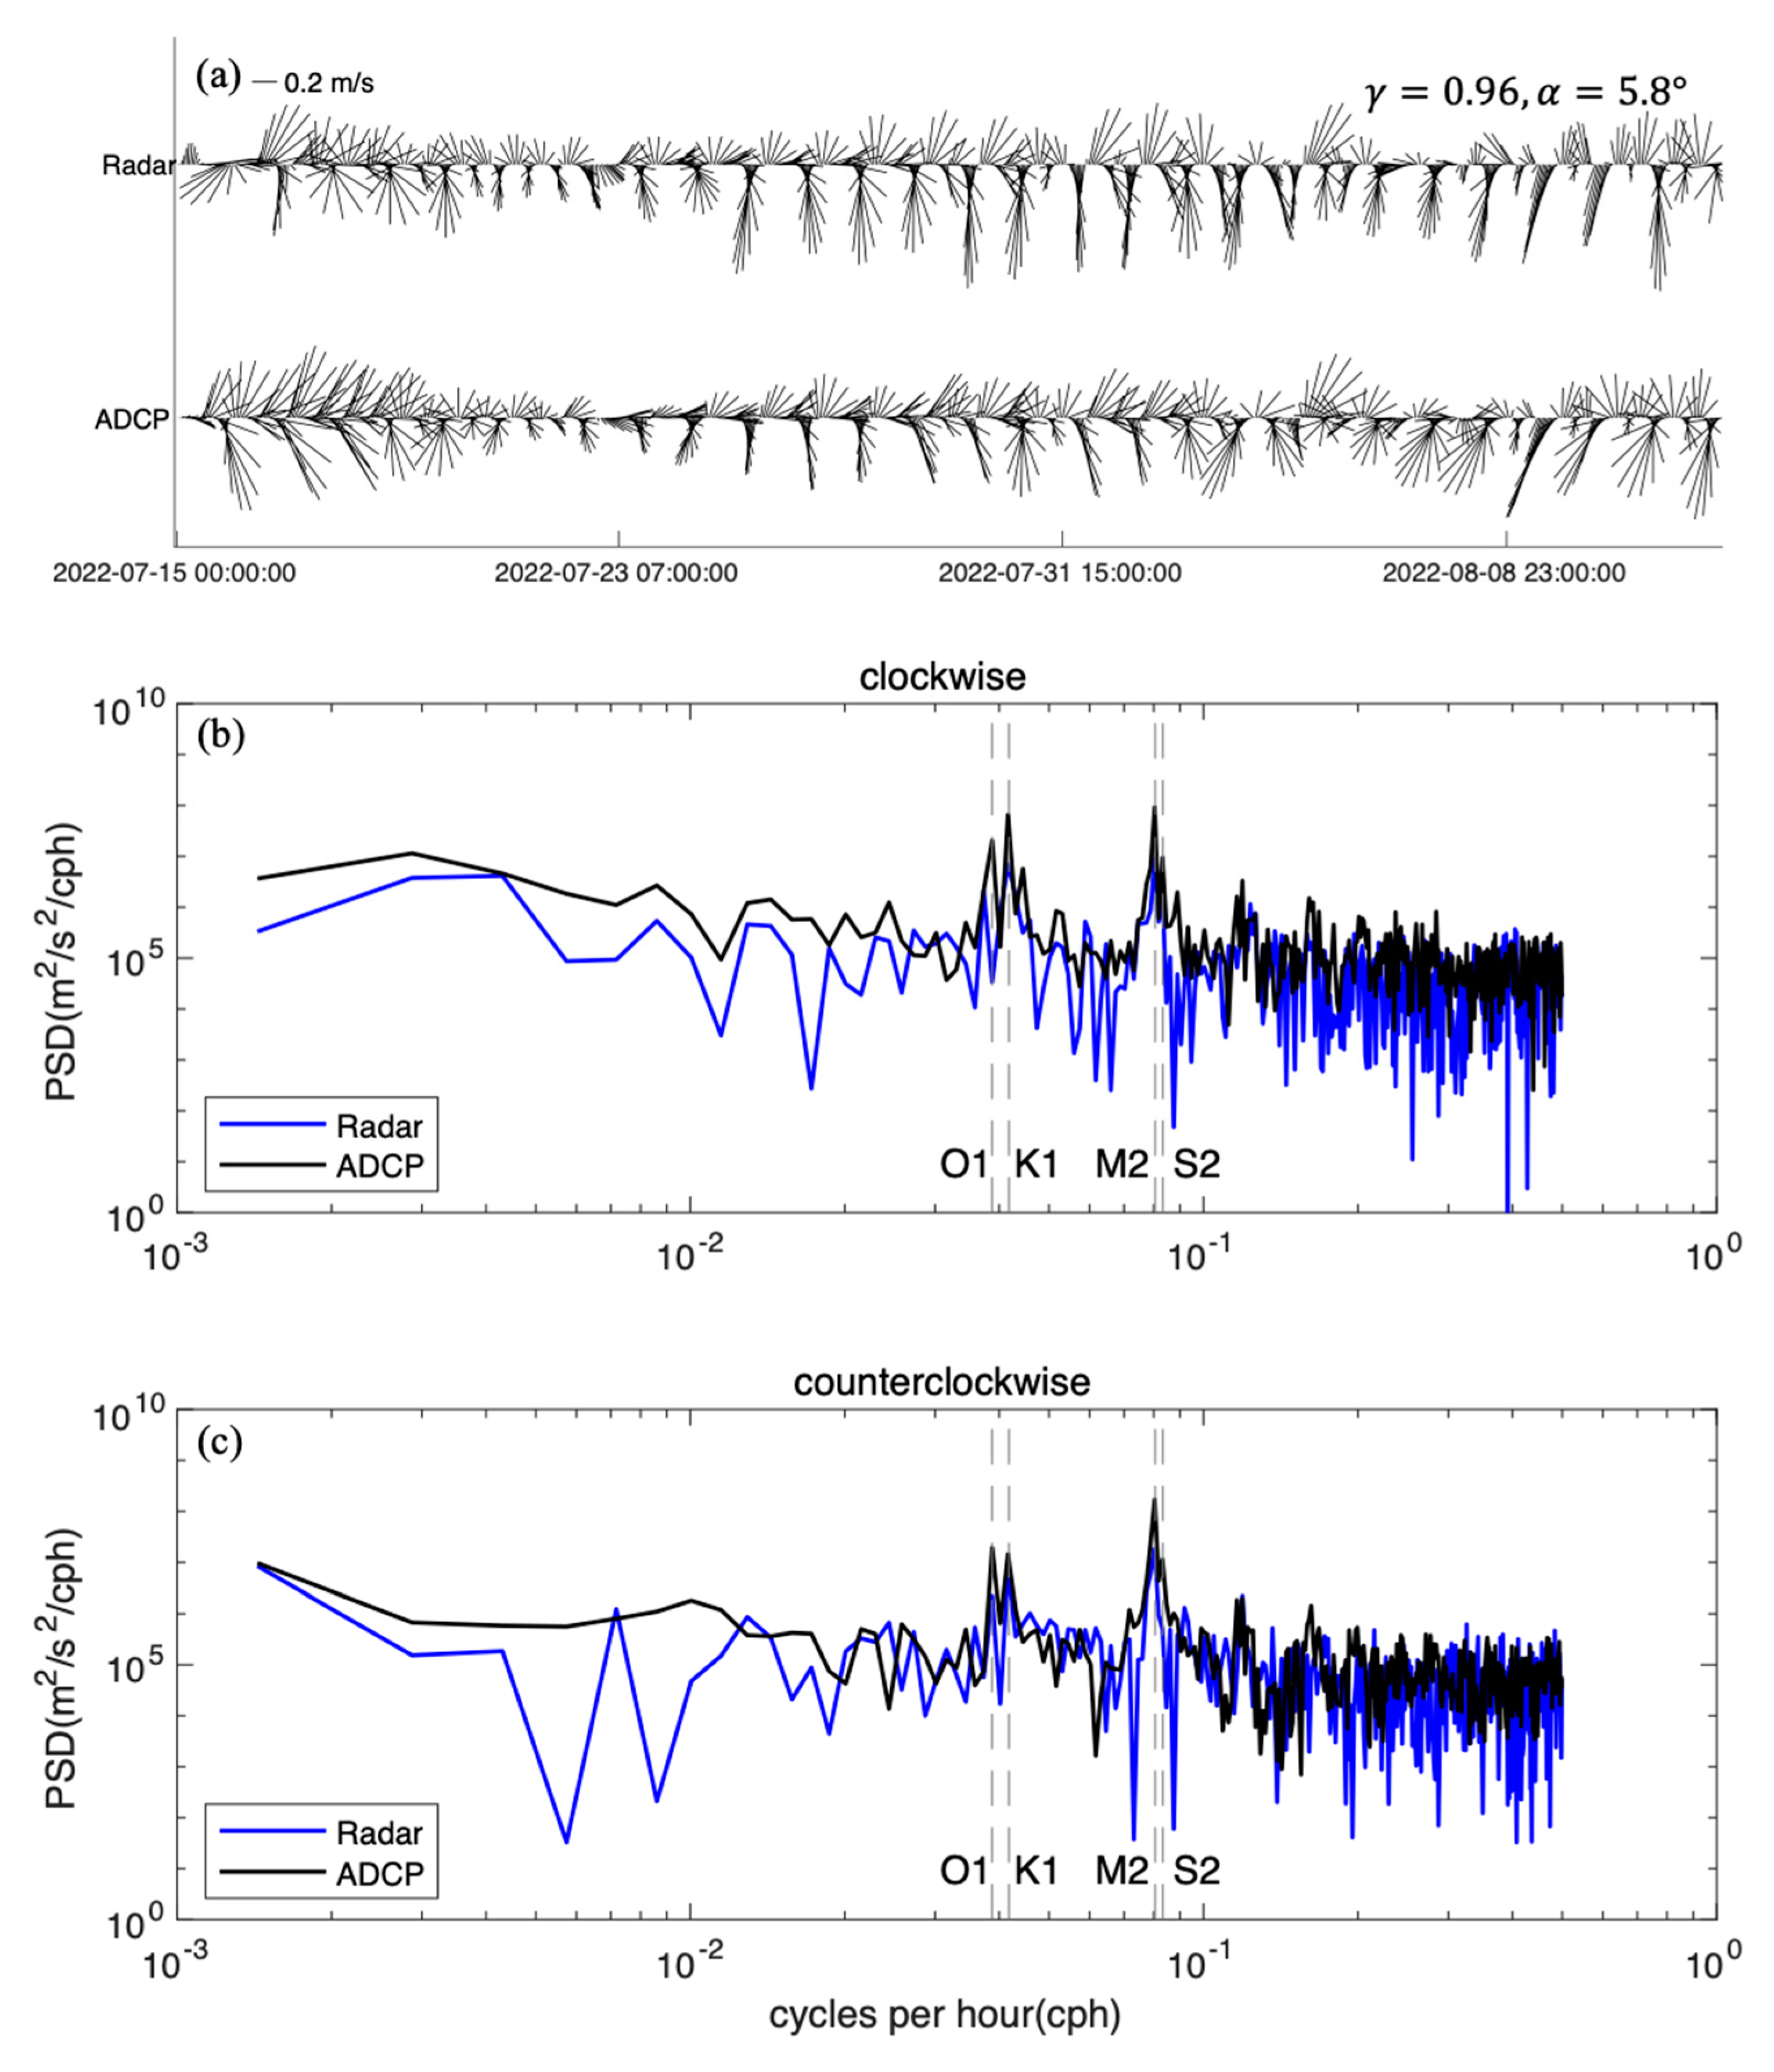
As mentioned in the statistical metrics section, the complex correlation coefficient and complex phase angle are used to conduct a quantitative comparison between the HF radar-detected and the ADCP-measured velocity vectors. reflects the correlation between two vector sequences, while denotes the average turning angle. Figure 7 presents a comparative result using ADCP R1 as an example. Figure 7a shows stick plot diagrams of radar and ADCP time series. Consistent tidal frequencies and similar velocity magnitudes can be clearly observed in both sequences. also demonstrate the consistency between the two vector sequences. In addition, the rotary power spectral analysis method [46] is used to compare the vector velocities of HF radar and ADCP. Similar to the radial velocity spectrum, the observed radar and ADCP data exhibit strong consistency. The vector velocity spectrum more clearly reveals the frequencies of the diurnal and semidiurnal tides (which are not distinctly prominent in the radial velocity spectrum, especially the S2 peak). When comparing the two spectra shown in Figure 7b,c, the clockwise and counterclockwise rotations show comparable energy levels. This suggests that at the present observation point, the predominant ocean current movement is characterized by oscillations, with rotational motions being less pronounced. The comparative results of the vector velocities at the remaining points are provided in Table 3. ranges from 0.62 to 0.96, while varies between −24.3 and 17.8. The comparison of the vector velocities indicates a notable decrease in radar detection accuracy at the periphery of the detection range of the HF radar network. Both R3 and R7 are situated in the marginal zones of the vector ocean current velocity data. The vector data range is smaller than the single-site data range depicted in Figure 1; for further details about the vector data range, refer to the work of Zhu et al. [38]. The rotational spectral characteristics of the remaining points are similar to those of point R1 and predominantly exhibit tidal oscillations.
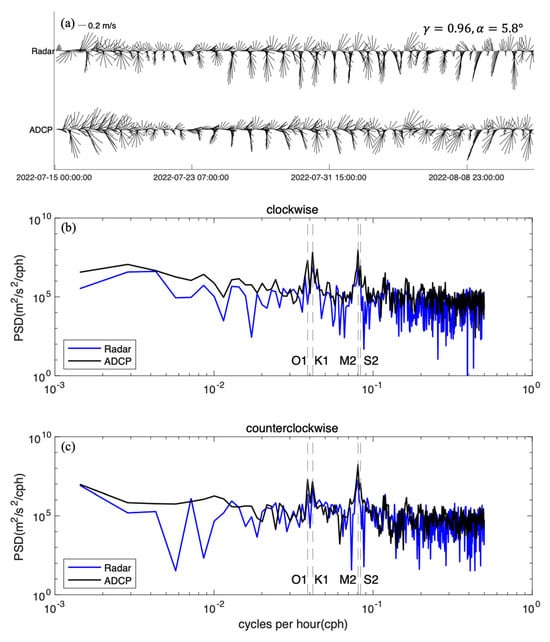
Figure 7.
(a) Stick plots for ADCP and radar and comparison of the rotary power spectra calculated with radar and ADCP velocity data at site R1. The two y-axis in (b,c) are the average spectral energy densities associated with the (b) clockwise and (c) counterclockwise components of the velocity hodograph ellipse.

Table 3.
Statistical metrics for the total velocity measurements.
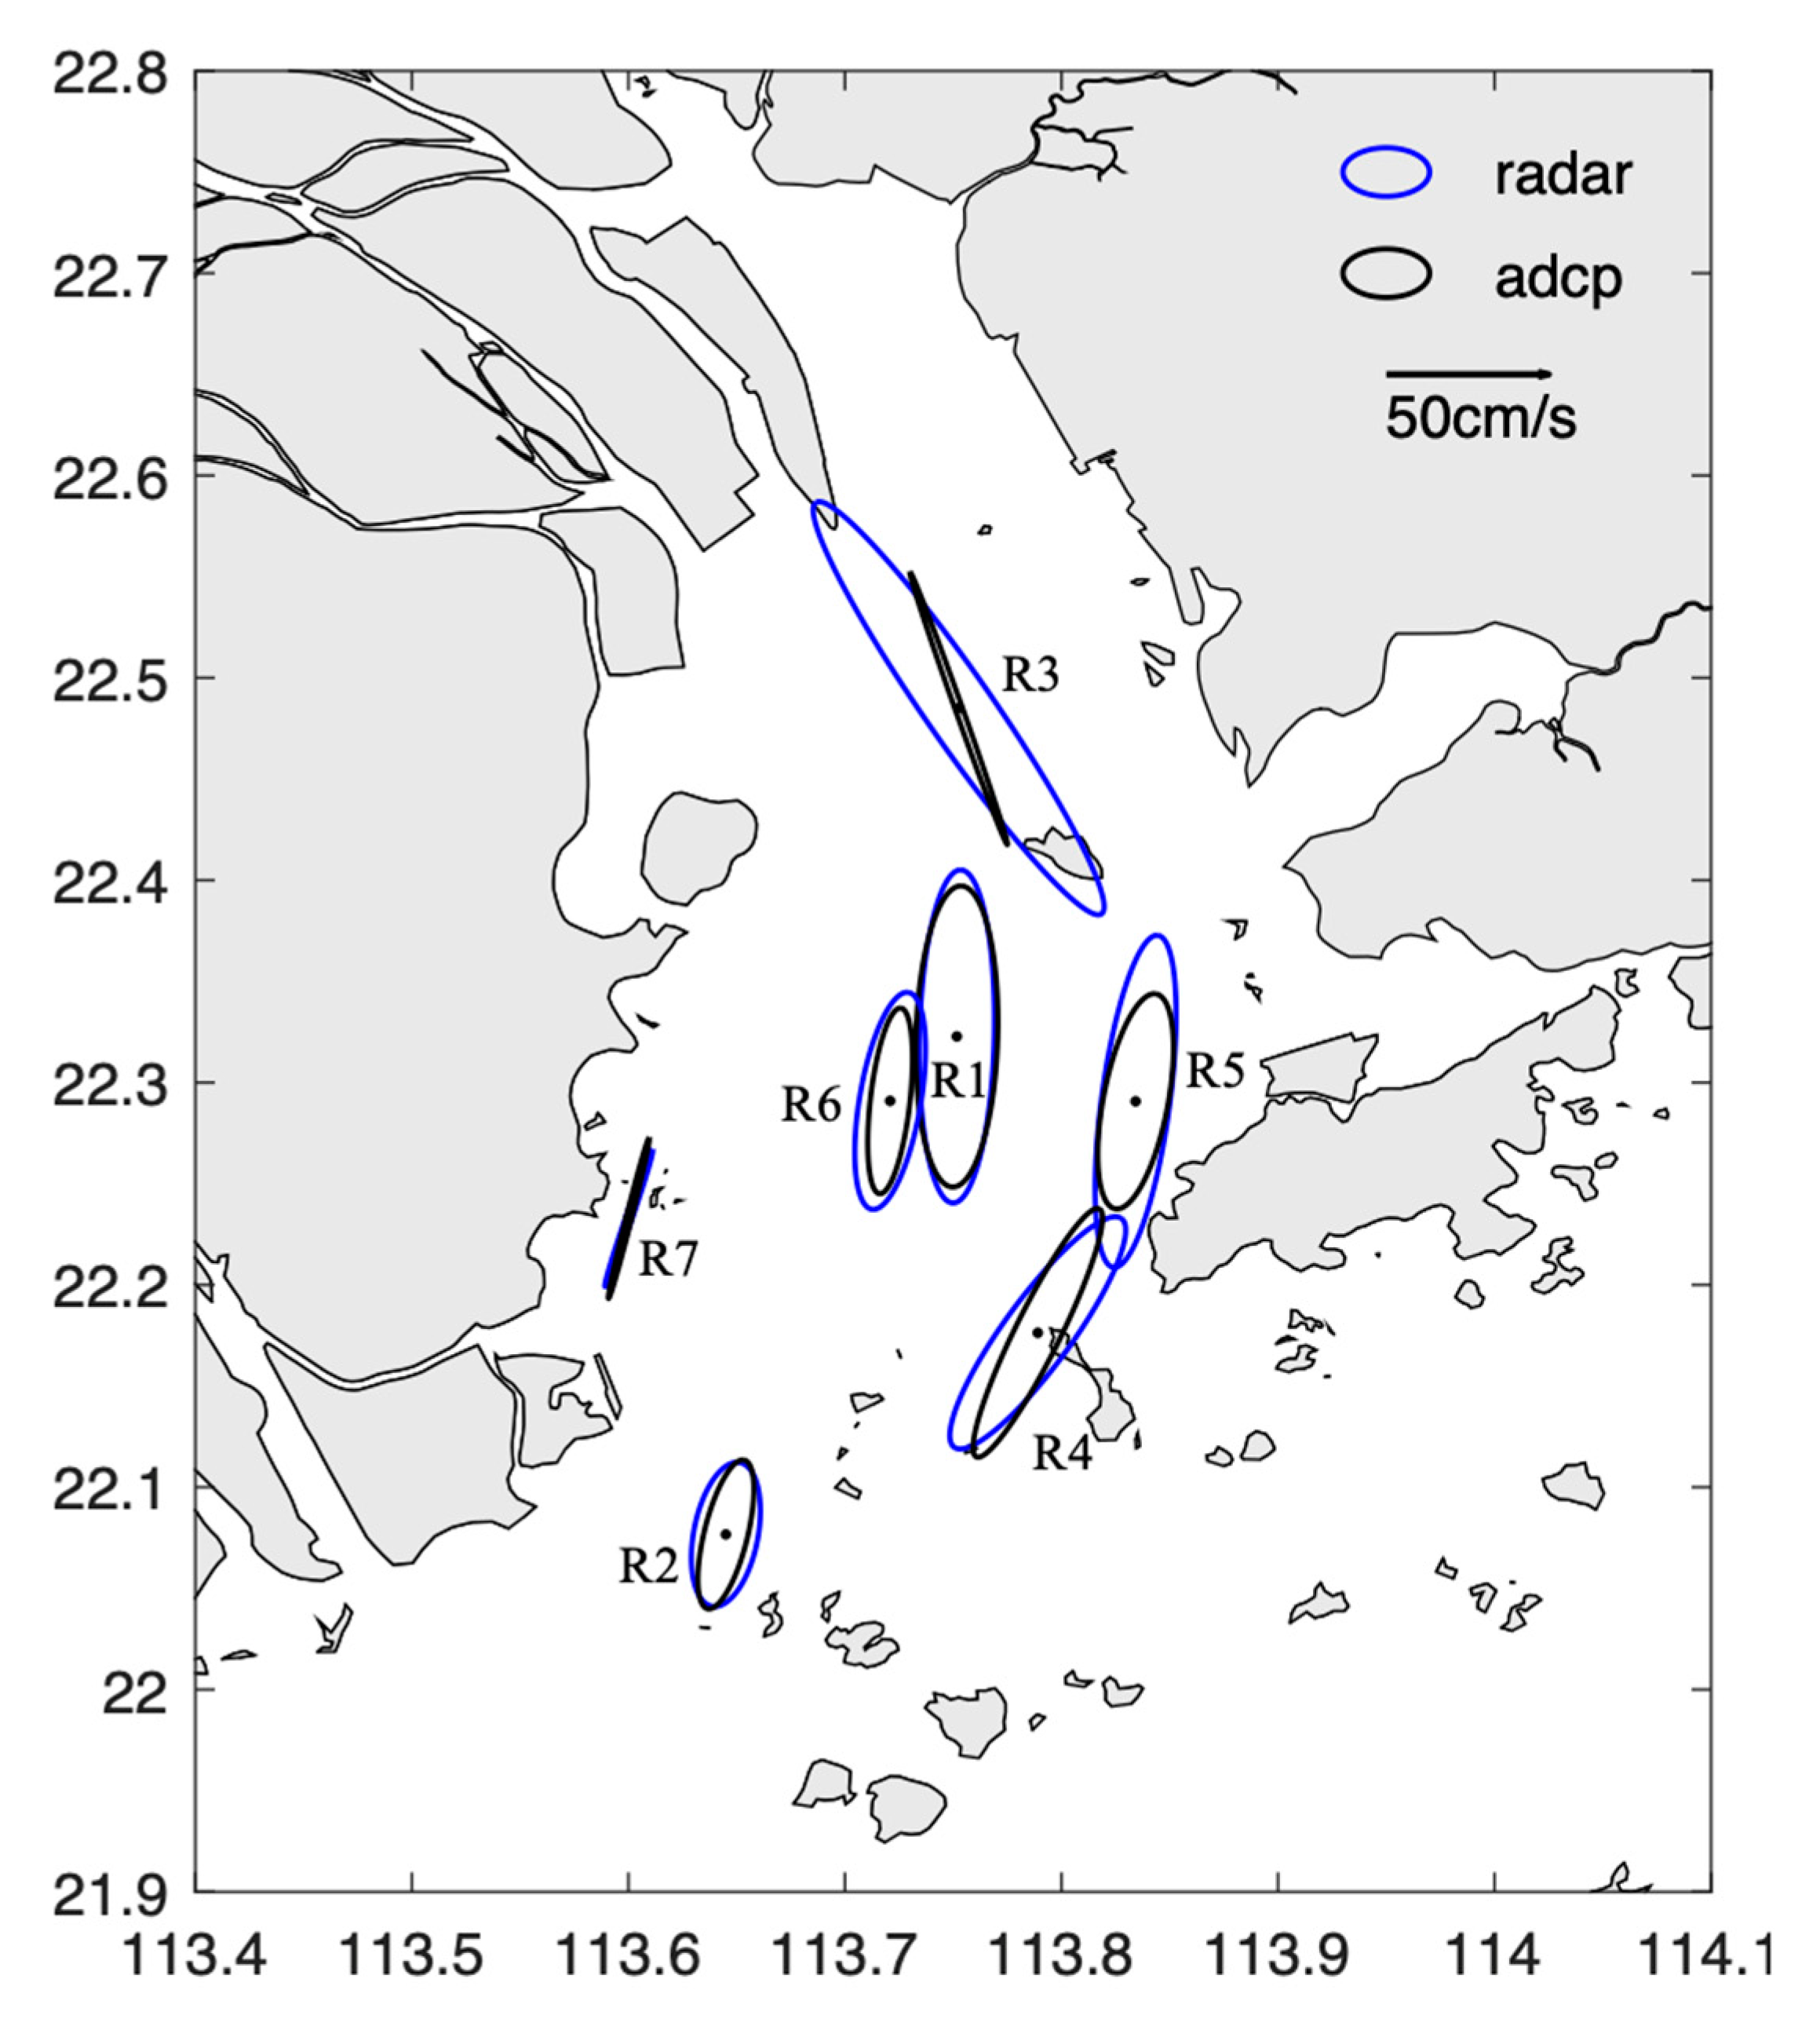
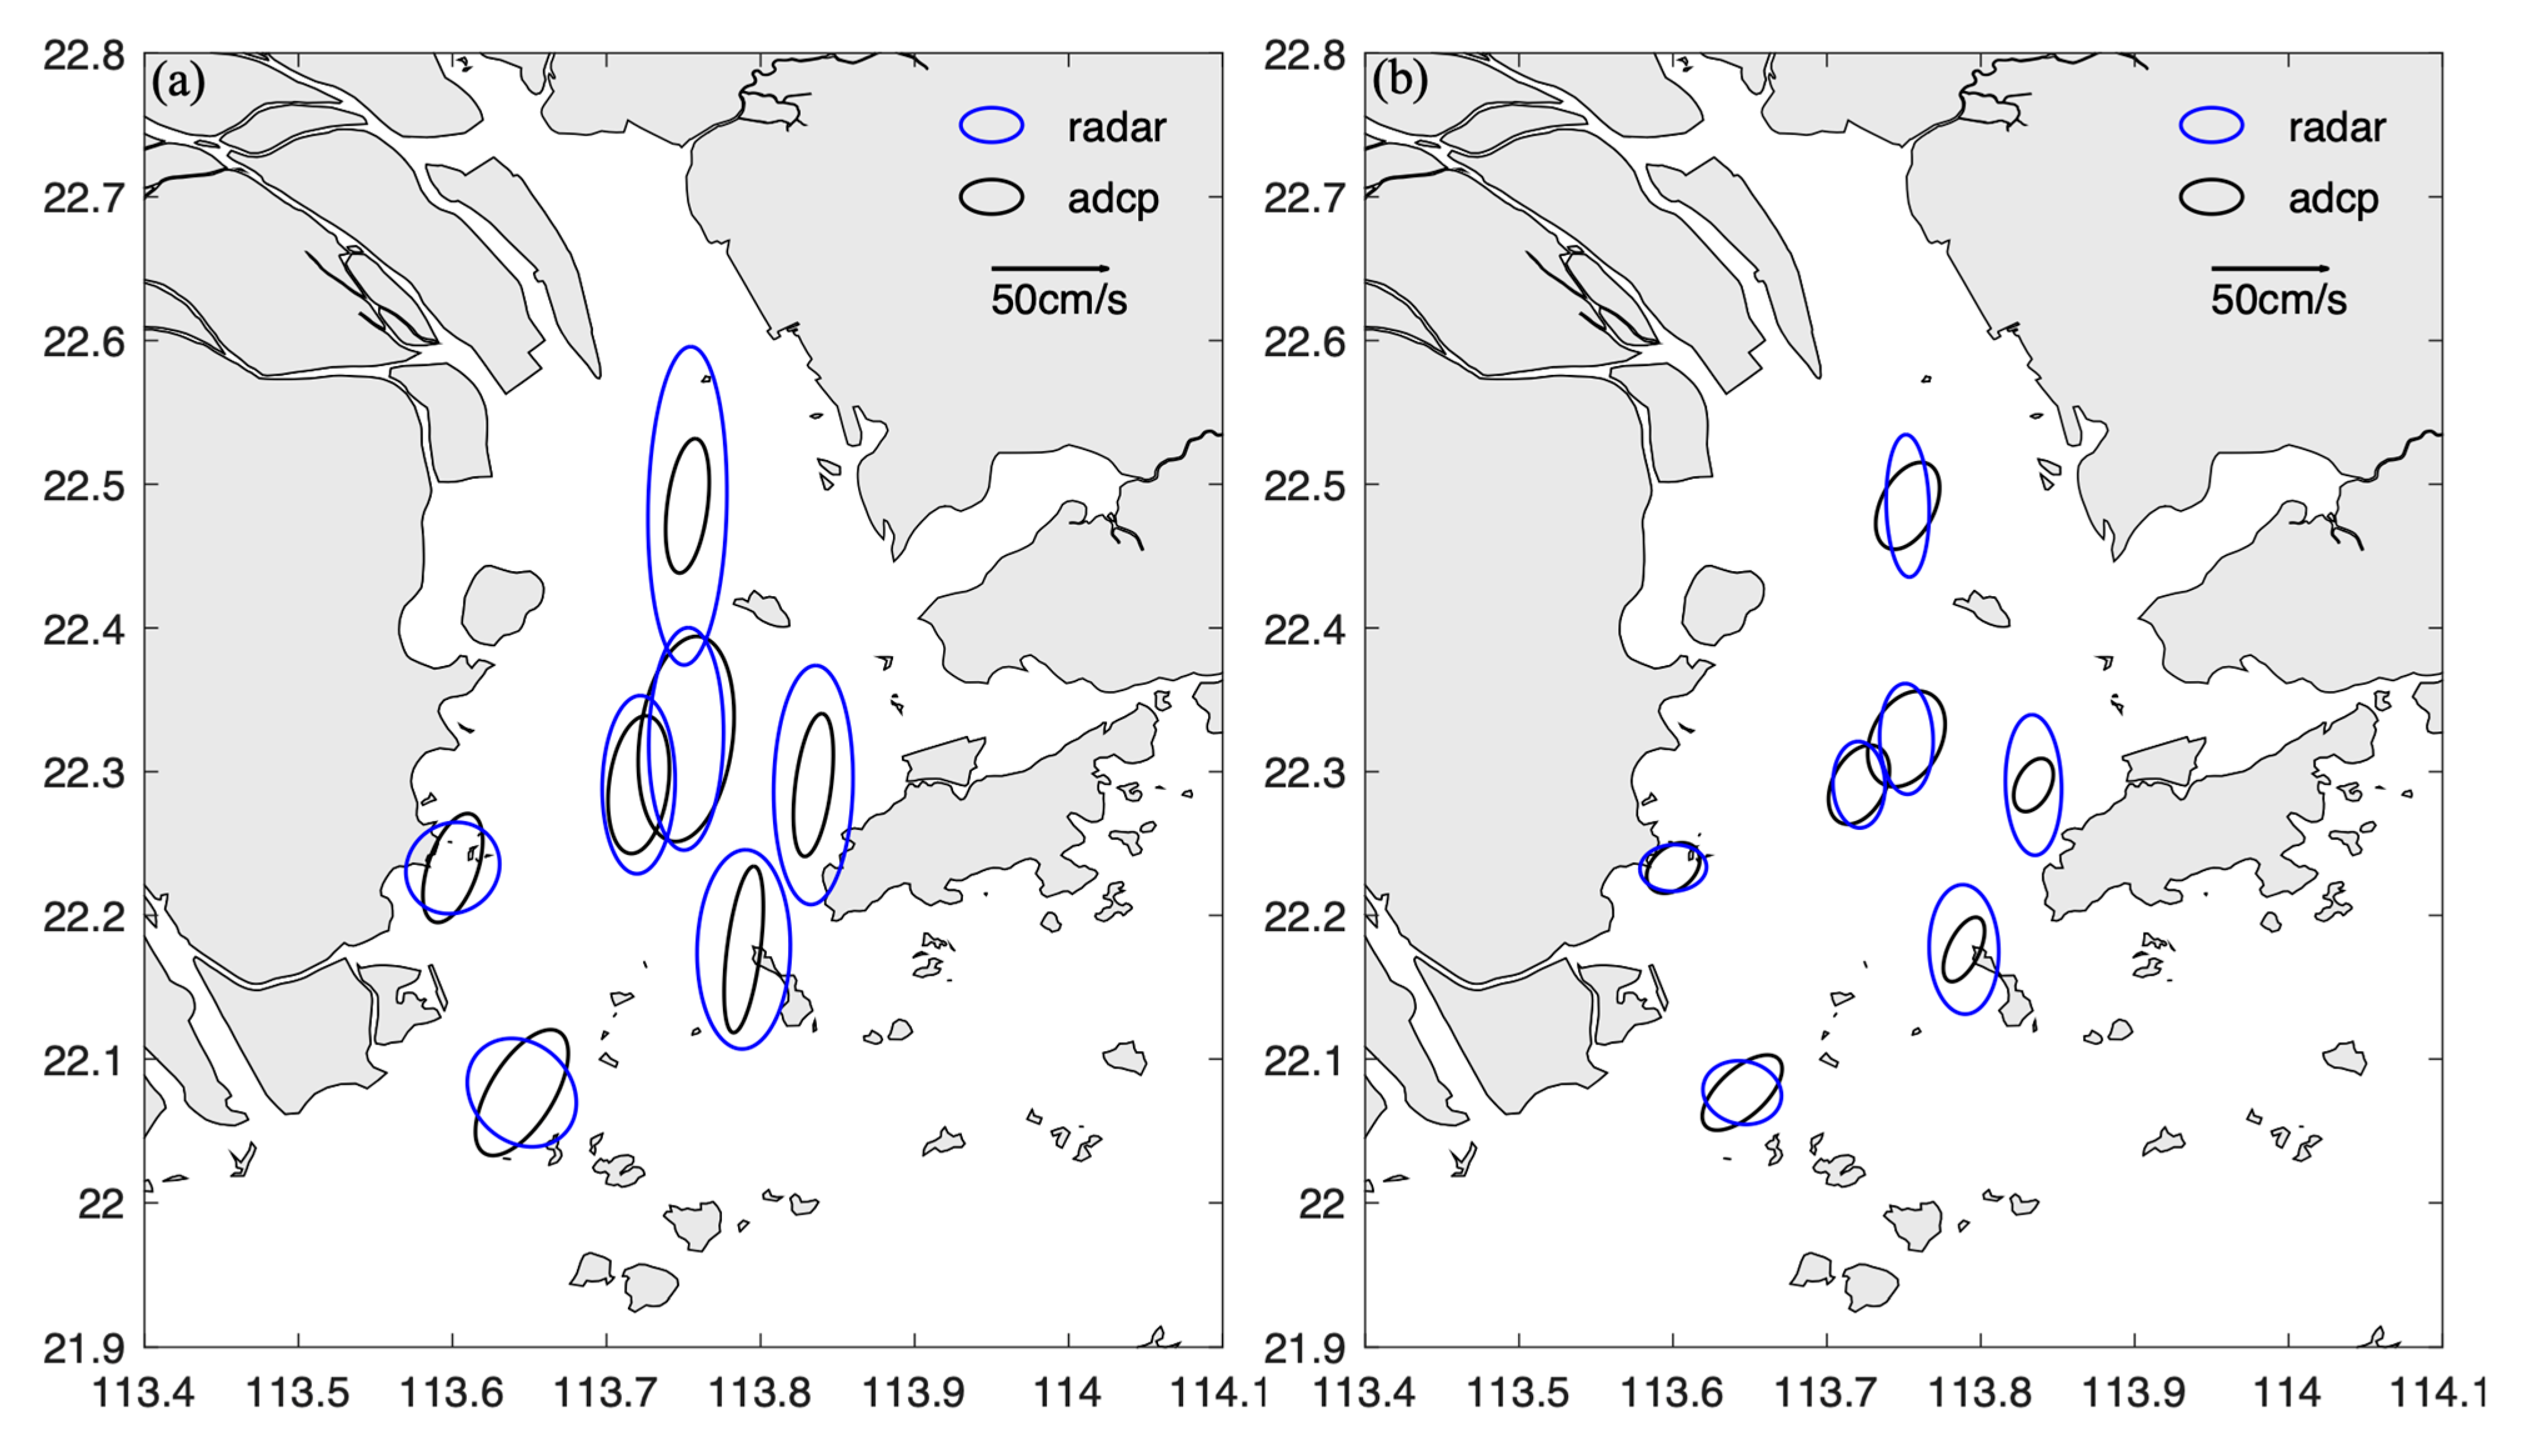
In addition to traditional comparisons involving velocity magnitudes, directions, and frequencies, we aim to assess the data quality of the radar network from a physical process perspective. Tides, being the most prominent signals in ocean current movements, also exhibit regional characteristics. Figure 8 illustrates a comparison between the radar and ADCP observations of the M2 tidal ellipses. Across most points, the ellipses observed by both radar and fixed-point measurements demonstrate strong similarities, especially in regions proximal to the radar network detection center. However, deviations in the major axis and phase are observed near land or islands, specifically at R4 and R5. At the upper edge of the radar network’s detection range, R3 is practically covered solely by HESD’s radial data during the comparison period. Consequently, excessive amounts of missing vector velocity measurements result in significant anomalies that are observed in the tidal ellipses detected by the radar. The spatial distribution of these tidal ellipses is generally aligned with the summer circulation patterns within the Pearl River Estuary. Due to the influence of estuarine river discharges, R3 exhibits elongated ellipses that are skewed along the y-axis. Conversely, at positions R1, R5, and R6 within the estuary’s central region, the tidal ellipses appear conventional, with the major axes aligned in the direction of the outflowing current. Similar conditions are observed at R2 and R4 and display a slight clockwise rotation, probably influenced by topography and the Coriolis force. Since the observation period coincides with the flood season, the current field is predominantly influenced by the discharge from the estuary. The average southward flow veers westward due to the Coriolis force. This effect also impacts the distribution of tidal ellipses, displaying a similar pattern. Additionally, local variations in water depth and the obstruction of tidal currents by islands contribute to some extent to the distribution of tidal ellipses. Ellipses at R7 appear narrow due to geographical constriction effects. The statistics of the tidal ellipses for M2, S2, O1, and K1 constituents are shown in Table 4 and reflect good agreement between the mooring observations and HF radars.
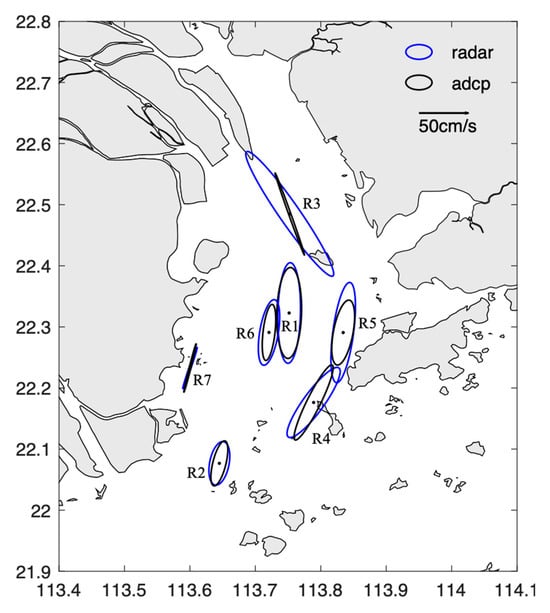
Figure 8.
Comparisons of the ADCP (black) and radar (blue) M2 tidal ellipses.

Table 4.
Statistics of the radar and mooring observation tidal ellipses for the M2, S2, O1, and K1 constituents.
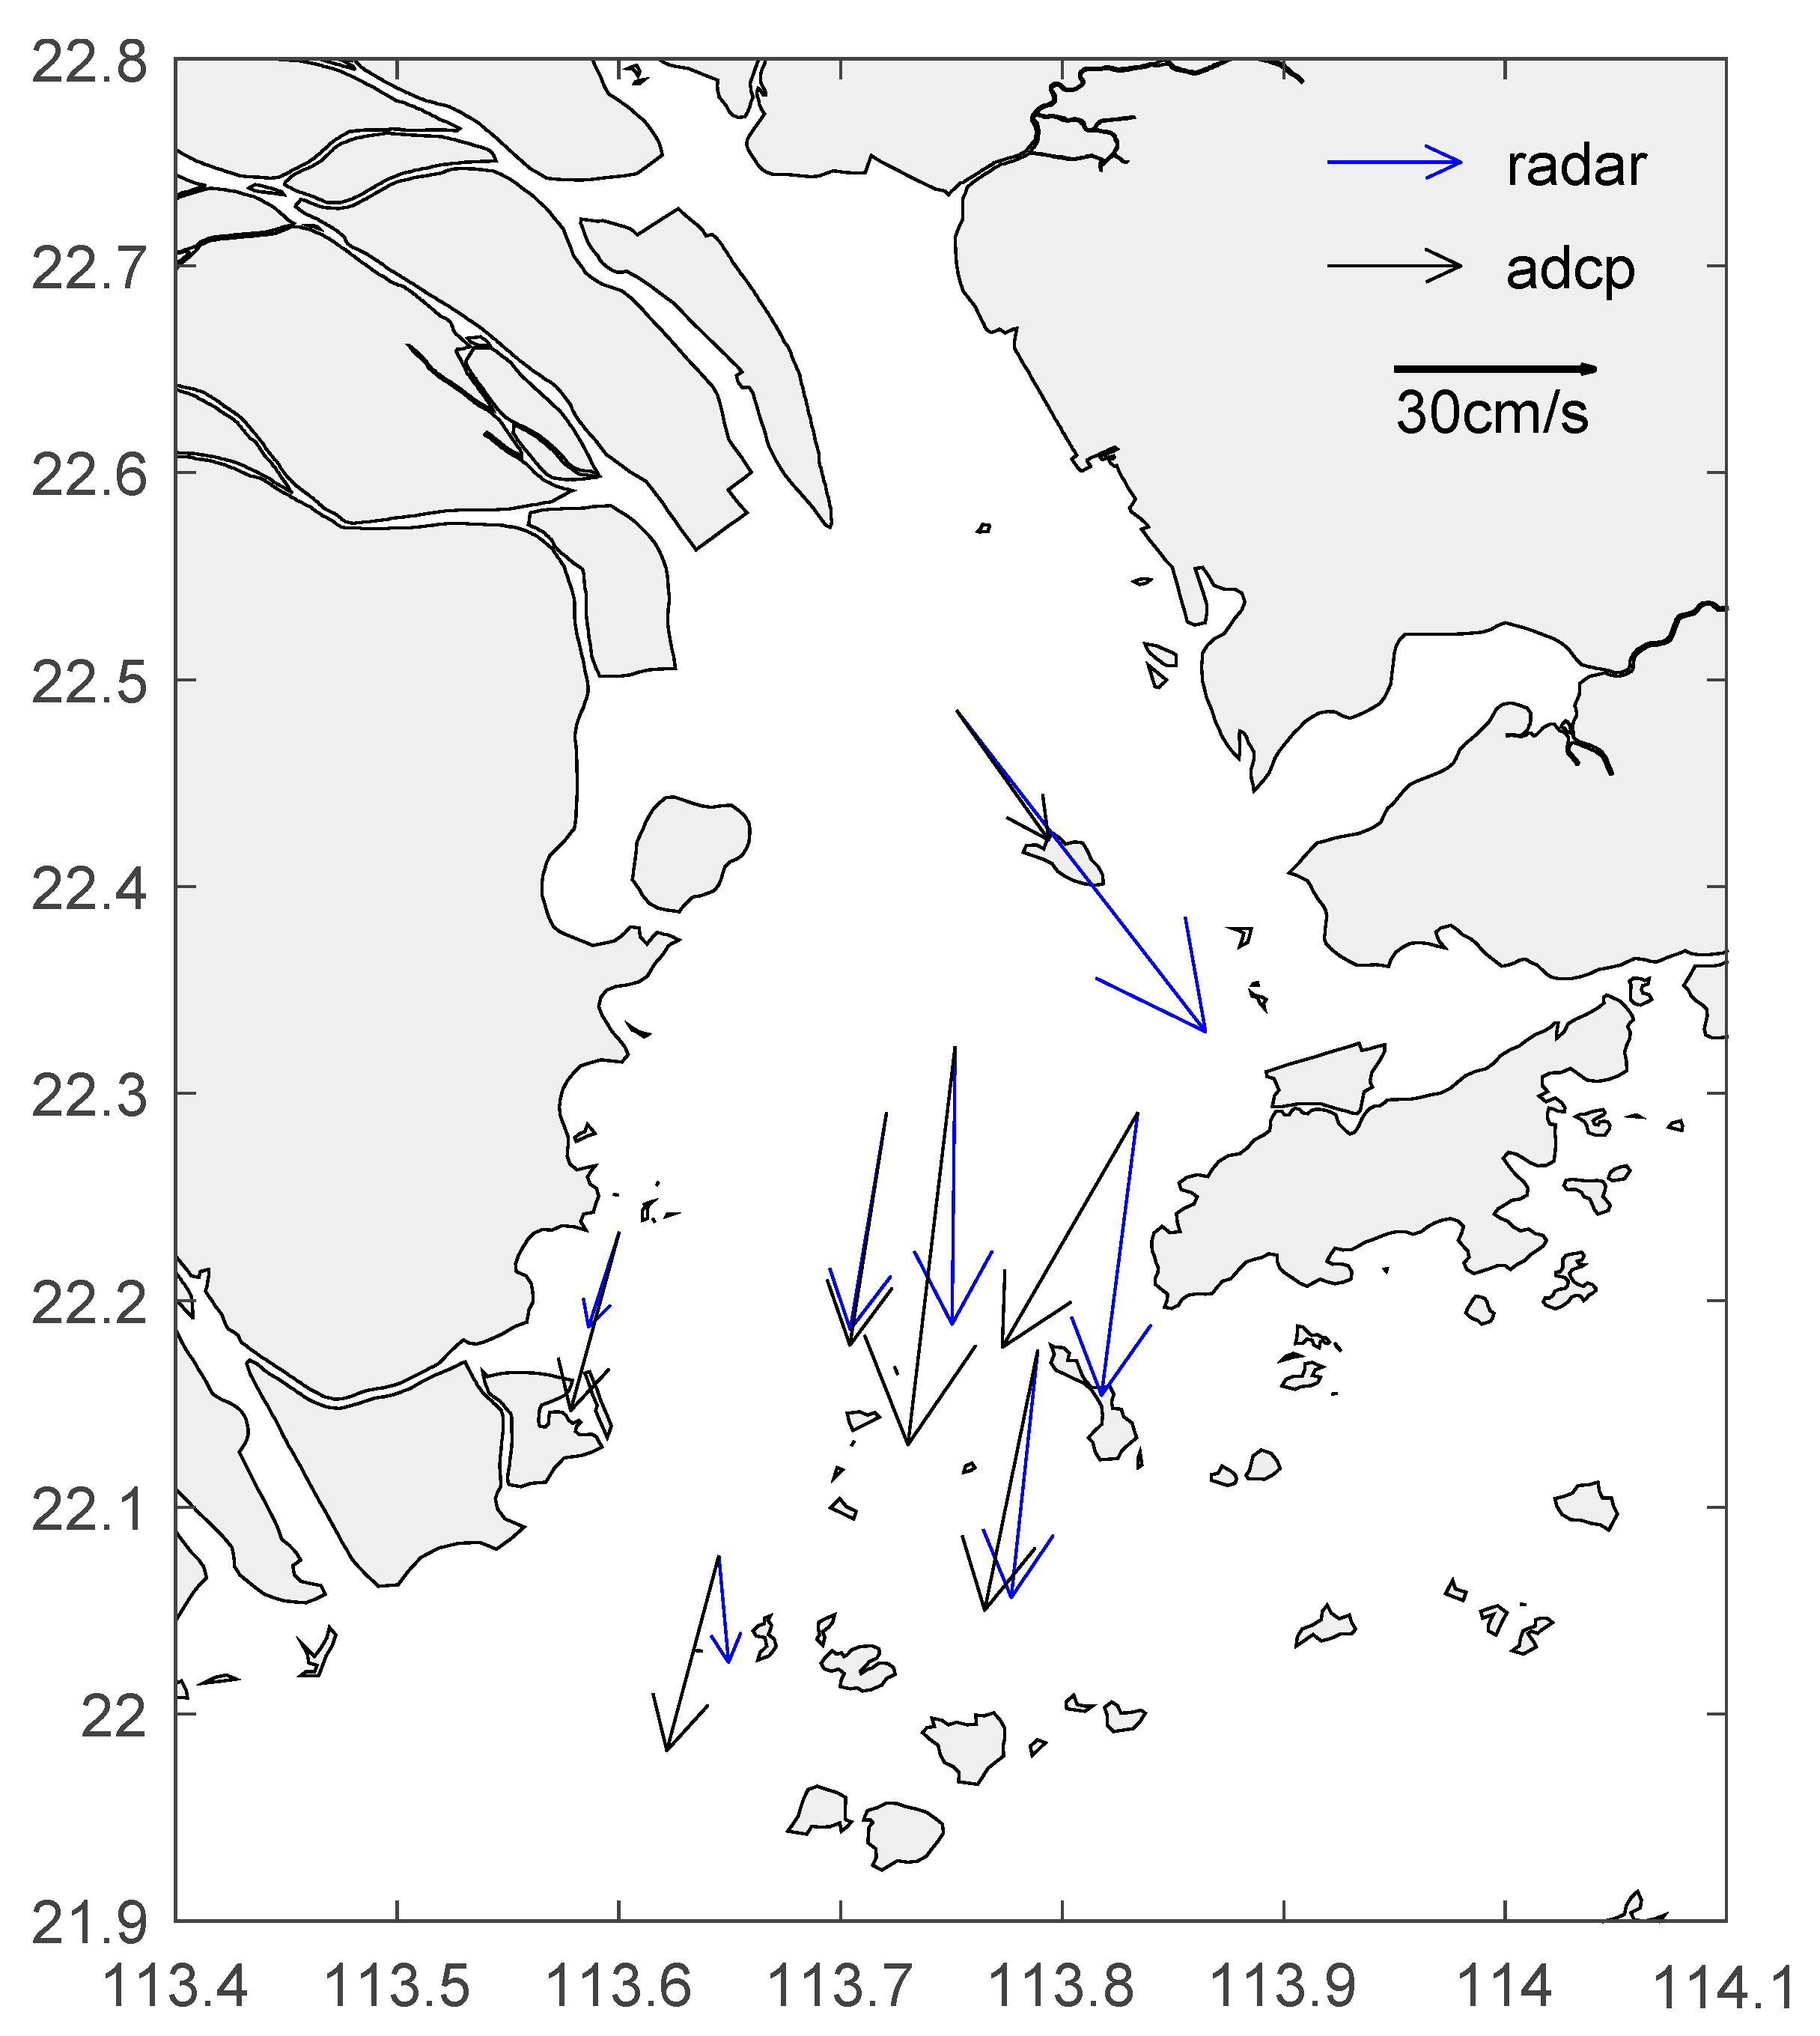
Figure 9 provides comparisons of the ADCP and radar EOF ellipses for the total velocities and residual currents. The EOF ellipse method was described in our previous work [38,46]. In Figure 9a, the ADCP ellipses at points R1 and R6 closely resemble the radar ellipses, both in size and phase. At positions R3, R4, and R5, the major and minor axes of the radar ellipses are notably larger than those of the ADCP. However, in the western section of the detection area, R2 and R7 exhibit considerable phase differences despite the similar lengths of their ellipse axes. Meanwhile, Figure 9b contrasts the EOF ellipses of the residual currents that are calculated after removing tides. Overall, the residual current ellipses are smaller than those depicted in Figure 9a, a comprehensible observation. Notably, in contrast to ADCP, the radar-detected residual current ellipses display consistent counterclockwise phase biases, even at points R1 and R6. Considering the comparison with tidal ellipses, it is reasonable to infer that the majority of the overall flow velocity errors stems from inaccurate residual current measurements. Additionally, we employed the traditional EOF method to analyze the overall observed ocean currents (Figure 10). In this approach, the velocities from all observation points are simultaneously involved in the EOF calculations rather than being computed individually for each point (EOF ellipse). The results reflect the collective behavior of all velocity points. Both radar and ADCP effectively capture the first mode of the current velocities in the Pearl River Estuary, which is characterized by an outflow toward the south–southwest direction that is influenced by river discharges and the Coriolis force.
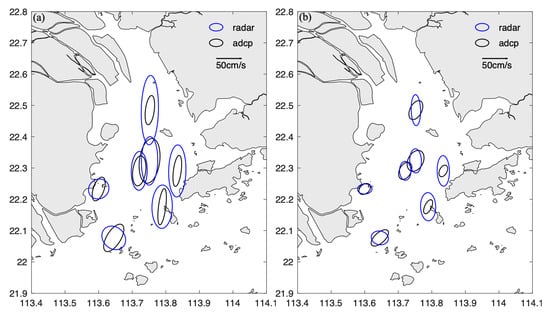
Figure 9.
Comparisons of the ADCP (black) and radar (blue) EOF ellipses for (a) total velocity and (b) residual currents.
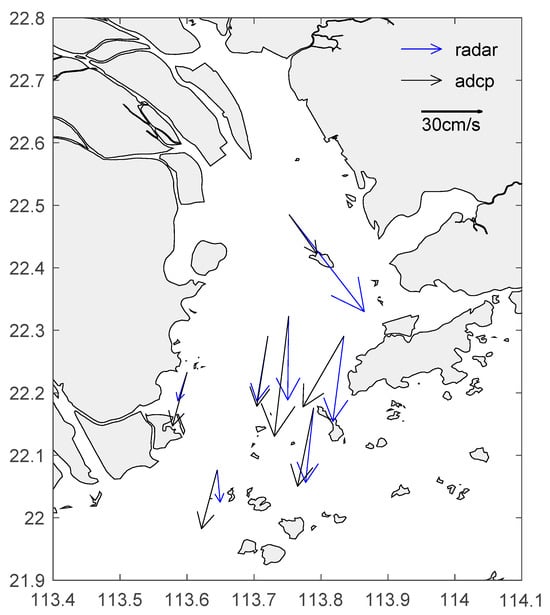
Figure 10.
Comparisons of the first EOF mode for ADCP (black arrow) and radar (blue arrow) total velocities.
Wind-driven currents constitute a primary mechanism that influence residual current movements. However, because the current observational data are situated within the flood season of the Pearl River Estuary, the discharges from the estuary are substantial enough to impact the entire estuarine velocity field. Throughout the comparative measurement period, there was a consistent southward wind in the PRE. In the absence of precise observations regarding estuarine discharges, it is presently challenging to separate the interaction between wind and residual currents solely from observational perspectives to substantiate the detection capabilities of the radar network. As radar data accumulate and future comparative work is conducted during the non-flood season, it is plausible that this physical process will manifest within the HF radar data.
4. Conclusions and Discussion
To detect surface currents within the Pearl River Estuary, six high-frequency surface wave radars (OSMAR-S100) and seven ADCPs were operated concurrently for nearly a month (17 June to 13 August 2022). Based on the observational data from ADCPs, we assessed the detection capabilities of individual radar stations and the overall data quality of the radar network from both the radial and vector velocity perspectives.
The radial velocities obtained from the HF radars exhibit a strong correlation with those observed by ADCPs, with r2 ranging from 0.42 to 0.78. varies in the range 11–21.6 . The absolute magnitudes of the bias range from 1 to 10 . The relative positions between the HF radar and ADCP, as well as factors such as the presence of island terrain obstructing the signal, significantly influence the errors. The bearing offset ranges from to , with a mean absolute value of . Moreover, for a specific radar, changes in azimuth angles can also induce variations in . The complex correlation coefficient and complex phase angle are used to conduct a quantitative comparison between the vector velocities obtained from HF radars and ADCPs. ranges from 0.62 to 0.96, while varies between −24.3 and 17.8. The consistency between radar-observed velocities and ADCP weakens as the ADCP positions move farther away from the central region of the radar network.
Both the radial and vector velocity time series from radar and ADCP observations exhibit significant coherence for frequencies. Additionally, the HF radar demonstrates sensitivity in capturing the diurnal and semidiurnal tidal frequencies. The rotational spectrum of vector velocities indicates that within the estuary, the predominant motion of the ocean currents is dominated by meridional oscillations, with rotational motion being less pronounced. Regarding the tidal movements, the radar network also provides relatively accurate detections, consistent with our past studies based on models or observations, in understanding tidal characteristics. In addition, HF radar can effectively capture the overall movement characteristics of ocean currents within the PRE. However, there are still notable errors in detecting the phase and magnitude of residual currents.
This study represents the first comprehensive comparative analysis conducted after the establishment and operation of the Pearl River Estuary HF radar network. Despite the relatively short duration of the in situ observations, it serves as an objective assessment of the data quality for this newly established radar network under current conditions. This evaluation holds significant importance for future algorithm improvements, calibrations based on local oceanic features, and the development and dissemination of data products. With the ongoing accumulation of radar and observational data, long-term quality assessments and research on oceanic dynamic processes based on HF radar data are anticipated.
Author Contributions
Conceptualization, J.W.; data curation, F.Y.; formal analysis, L.Z. and T.L.; funding acquisition, J.W.; investigation, L.Z. and T.L.; methodology, J.W. and L.Z.; resources, F.Y.; supervision, J.W.; validation, F.Y. and C.W.; visualization, L.Z.; writing—original draft, L.Z.; writing—review and editing, J.W. All authors have read and agreed to the published version of the manuscript.
Funding
This research was funded by the Key Research and Development Program of Guangdong Province (2020B1111020003) and the National Basic Research and Development Project of China (2022YFF0802000). The project was also supported by Southern Marine Science and Engineering Guangdong Laboratory (Zhuhai) No. SML2020SP009 and the National Natural Science Foundation of China (41976007). The authors would like to thank Fan Yang and Lunyu Wu for providing the ADCP data and HF radar data.
Institutional Review Board Statement
Not applicable.
Informed Consent Statement
Informed consent was obtained from all subjects involved in the study.
Data Availability Statement
The data presented in this study are available on request from the corresponding author. The data are not publicly available due to the fact that parts of radar data on oceanic state information are classified.
Acknowledgments
We thank the two anonymous reviewers for their valuable suggestions that substantially improved the paper.
Conflicts of Interest
The authors declare no conflicts of interest.
References
- Crombie, D.D. Doppler Spectrum of Sea Echo at 13.56 Mc./s. Nature 1955, 175, 681–682. [Google Scholar] [CrossRef]
- Barrick, D.E.; Evans, M.W.; Weber, B.L. Ocean Surface Currents Mapped by Radar. Science 1977, 198, 138–144. [Google Scholar] [CrossRef] [PubMed]
- Lipa, B.J.; Barrick, D.E. Least-Squares Methods for the Extraction of Surface Currents from CODAR Crossed-Loop Data: Application at ARSLOE. IEEE J. Ocean. Eng. 1983, 8, 226–253. [Google Scholar] [CrossRef]
- Paduan, J.D.; Washburn, L. High-Frequency Radar Observations of Ocean Surface Currents. Annu. Rev. Mar. Sci. 2013, 5, 115–136. [Google Scholar] [CrossRef] [PubMed]
- Stewart, R.H.; Joy, J.W. HF Radio Measurements of Surface Currents. Deep Sea Res. Oceanogr. Abstr. 1974, 21, 1039–1049. [Google Scholar] [CrossRef]
- Teague, C.C.; Vesecky, J.F.; Fernandez, D.M. HF Radar Instruments, Past to Present. Oceanography 1997, 10, 40–44. [Google Scholar] [CrossRef]
- Gurgel, K.W.; Antonischki, G.; Essen, H.H.; Schlick, T. Wellen Radar (WERA): A New Ground-Wave HF Radar for Ocean Remote Sensing. Coast. Eng. 1999, 37, 219–234. [Google Scholar] [CrossRef]
- Hammond, T.M.; Pattiaratchi, C.B.; Eccles, D.; Osborne, M.J.; Nash, L.A.; Collins, M.B. Ocean Surface Current Radar (OSCR) Vector Measurements on the Inner Continental Shelf. Cont. Shelf Res. 1987, 7, 411–431. [Google Scholar] [CrossRef]
- Barrick, D.E.; Lipa, B.J.; Crissman, R.D. Mapping Surface Currents with Codar. Sea Technol. 1985, 26, 43–48. [Google Scholar]
- Hou, J.; Wu, S.; Yang, Z.; Qiu, C.; Wen, B.; Shi, Z.; Wu, Q.; Guan, R.; Wang, S. Remote Sensing of Ocean Surface Currents by HF Radar. Acta Geophys. Sin. 1997, 40, 18–26. [Google Scholar]
- Frisch, A.S.; Weber, B.L. A New Technique for Measuring Tidal Currents by Using a Two-Site HF Doppler Radar System. J. Geophys. Res. Ocean. 1980, 85, 485–493. [Google Scholar] [CrossRef]
- Holbrook, J.R.; Frisch, A.S. A Comparison of Near-Surface CODAR and VACM Measurements in the Strait of Juan De Fuca, August 1978. J. Geophys. Res. 1981, 86, 10908–10912. [Google Scholar] [CrossRef]
- Paduan, J.D.; Rosenfeld, L.K. Remotely Sensed Surface Currents in Monterey Bay from Shore-Based HF Radar (Coastal Ocean Dynamics Application Radar). J. Geophys. Res. Ocean. 1996, 101, 20669–20686. [Google Scholar] [CrossRef]
- Yoshikawa, Y.; Masuda, A.; Marubayashi, K.; Ishibashi, M.; Okuno, A. On the Accuracy of HF Radar Measurement in the Tsushima Strait. J. Geophys. Res. Ocean. 2006, 111, C04009. [Google Scholar] [CrossRef]
- Emery, B.M.; Washburn, L.; Harlan, J.A. Evaluating Radial Current Measurements from CODAR High-Frequency Radars with Moored Current Meters*. J. Atmos. Ocean. Technol. 2004, 21, 1259–1271. [Google Scholar] [CrossRef]
- Matthews, J.P.; Simpson, J.H.; Brown, J. Remote Sensing of Shelf Sea Currents Using a High-Frequency Ocean Surface Current Radar System. J. Geophys. Res. Ocean. 1988, 93, 2303–2310. [Google Scholar] [CrossRef]
- Chapman, R.D.; Shay, L.K.; Graber, H.C.; Edson, J.B.; Karachintsev, A.; Trump, C.L.; Ross, D.B. On the Accuracy of HF Radar Surface Current Measurements: Intercomparisons with Ship-Based Sensors. J. Geophys. Res. Ocean. 1997, 102, 18737–18748. [Google Scholar] [CrossRef]
- Graber, H.C.; Haus, B.K.; Chapman, R.D.; Shay, L.K. HF Radar Comparisons with Moored Estimates of Current Speed and Direction: Expected Differences and Implications. J. Geophys. Res. Ocean. 1997, 102, 18749–18766. [Google Scholar] [CrossRef]
- Kosro, M.; Barth, J.; Strub, T. The Coastal Jet: Observations of Surface Currents Over the Oregon Continental Shelf From HF Radar. Oceanography 1997, 10, 53–56. [Google Scholar] [CrossRef]
- Shay, L.K.; Graber, H.C.; Ross, D.B.; Chapman, R.D. Mesoscale Ocean Surface Current Structure Detected by High-Frequency Radar. J. Atmos. Ocean. Technol. 1995, 12, 881–900. [Google Scholar] [CrossRef][Green Version]
- Shay, L.K.; Lentz, S.J.; Graber, H.C.; Haus, B.K. Current Structure Variations Detected by High-Frequency Radar and Vector-Measuring Current Meters. J. Atmos. Ocean. Technol. 1998, 15, 237–256. [Google Scholar] [CrossRef]
- Essen, H.-H.; Gurgel, K.-W.; Schlick, T. On the Accuracy of Current Measurements by Means of HF Radar. IEEE J. Ocean. Eng. 2000, 25, 472–480. [Google Scholar] [CrossRef]
- Liu, Y.; Weisberg, R.H.; Merz, C.R.; Lichtenwalner, S.; Kirkpatrick, G.J. HF Radar Performance in a Low-Energy Environment: CODAR Seasonde Experience on the West Florida Shelf. J. Atmos. Ocean. Technol. 2010, 27, 1689–1710. [Google Scholar] [CrossRef]
- Liu, Y.; Weisberg, R.H.; Merz, C.R. Assessment of CODAR Seasonde and WERA HF Radars in Mapping Surface Currents on the West Florida Shelf. J. Atmos. Ocean. Technol. 2014, 31, 1363–1382. [Google Scholar] [CrossRef]
- Mau, J.C.; Wang, D.P.; Ullman, D.S.; Codiga, D.L. Comparison of Observed (HF Radar, ADCP) and Model Barotropic Tidal Currents in the New York Bight and Block Island Sound. Estuar. Coast. Shelf Sci. 2007, 72, 129–137. [Google Scholar] [CrossRef]
- Mau, J.C.; Wang, D.P.; Ullman, D.S.; Codiga, D.L. Model of the Long Island Sound Outflow: Comparison with Year-Long HF Radar and Doppler Current Observations. Cont. Shelf Res. 2008, 28, 1791–1799. [Google Scholar] [CrossRef]
- Paduan, J.D.; Kim, K.C.; Cook, M.S.; Chavez, F.P. Calibration and Validation of Direction-Finding High-Frequency Radar Ocean Surface Current Observations. IEEE J. Ocean. Eng. 2006, 31, 862–875. [Google Scholar] [CrossRef]
- Zhu, L.; Lu, T.; Yang, F.; Liu, B.; Wu, L.; Wei, J. Comparisons of Tidal Currents in the Pearl River Estuary between High-Frequency Radar Data and Model Simulations. Appl. Sci. 2022, 12, 6509. [Google Scholar] [CrossRef]
- Laws, K.E.; Fernandez, D.M.; Paduan, J.D. Simulation-Based Evaluations of HF Radar Ocean Current Algorithms. IEEE J. Ocean. Eng. 2000, 25, 481–491. [Google Scholar] [CrossRef]
- Kohut, J.; Glenn, S.; Barrick, D. SeaSonde Is Integral to Coastal Flow Model Development. Hydro Int. 1999, 3, 32–35. [Google Scholar]
- Shaolin, Y.; Hengyu, K.; Jiechang, H.; Shicai, W.; Zijie, Y.; Biyang, W.; Xiongbin, W. Super-Resolution Ocean Surface Current Algorithm Based on MUSIC for OSMAR2000. In Proceedings of the MTS/IEEE Oceans 2001. An Ocean Odyssey. Conference Proceedings (IEEE Cat. No.01CH37295), Honolulu, HI, USA, 5–8 November 2001; Volume 2, pp. 930–941. [Google Scholar]
- Lai, Y.; Zhou, H.; Wen, B. Surface Current Characteristics in the Taiwan Strait Observed by High-Frequency Radars. IEEE J. Ocean. Eng. 2017, 42, 449–457. [Google Scholar] [CrossRef]
- Lai, Y.; Zhou, H.; Zeng, Y.; Wen, B. Accuracy Assessment of Surface Current Velocities Observed by OSMAR-S High-Frequency Radar System. IEEE J. Ocean. Eng. 2018, 43, 1068–1074. [Google Scholar] [CrossRef]
- Shicai, W.; Zijie, Y.; Biyang, W.; Zhenhua, S.; Jiansheng, T.; Huotao, G.; Xiongbin, W.; Hengyu, K. Test of HF Ground Wave Radar OSMAR2000 at the Eastern China Sea. In Proceedings of the MTS/IEEE Oceans 2001. An Ocean Odyssey. Conference Proceedings (IEEE Cat. No.01CH37295), Honolulu, HI, USA, 5–8 November 2001; Volume 1, pp. 646–648. [Google Scholar]
- Wu, X.; Li, L.; Shao, Y.; Li, Y.; Guo, T. Experimental Determination of Significant Waveheight by OSMAR071: Comparison with Results from Buoy. Wuhan Univ. J. Nat. Sci. 2009, 14, 499–504. [Google Scholar] [CrossRef]
- Shen, W.; Wen, B.; Wu, S.; Bai, L.; Zhou, H.; Yang, J. HF Radar Receiver Designed for Surface Current Radar System. In Proceedings of the 2006 10th IET International Conference on Ionospheric Radio Systems and Techniques (IRST 2006), London, UK, 18–21 July 2006; pp. 240–243. [Google Scholar]
- Zhu, L.; Yang, F.; Yang, Y.; Xiong, Z.; Wei, J. Designing Theoretical Shipborne ADCP Survey Trajectories for High-Frequency Radar Based on a Machine Learning Neural Network. Appl. Sci. 2023, 13, 7208. [Google Scholar] [CrossRef]
- Kundu, P.K. Ekman Veering Observed near the Ocean Bottom. J. Phys. Oceanogr. 1976, 6, 238–242. [Google Scholar] [CrossRef]
- Essen, H.-H.; Breivik, Ø.; Günther, H.; Gurgel, K.-W.; Johannessen, J.; Klein, H.; Schlick, T.; Stawarz, M. Comparison of Remotely Measured and Modelled Currents in Coastal Areas of Norway and Spain. J. Atmos. Ocean Sci. 2003, 9, 39–64. [Google Scholar] [CrossRef]
- Kaplan, D.M.; Largier, J.; Botsford, L.W. HF Radar Observations of Surface Circulation off Bodega Bay (Northern California, USA). J. Geophys. Res. Ocean. 2005, 110, C10020. [Google Scholar] [CrossRef]
- Parks, A.B.; Shay, L.K.; Johns, W.E.; Martinez-Pedraja, J.; Gurgel, K.-W. HF Radar Observations of Small-Scale Surface Current Variability in the Straits of Florida. J. Geophys. Res. Ocean. 2009, 114, C08002. [Google Scholar] [CrossRef]
- Shay, L.K.; Martinez-Pedraja, J.; Cook, T.M.; Haus, B.K.; Weisberg, R.H. High-Frequency Radar Mapping of Surface Currents Using WERA. J. Atmos. Ocean. Technol. 2007, 24, 484–503. [Google Scholar] [CrossRef]
- Weisberg, R.H.; He, R. Local and Deep-Ocean Forcing Contributions to Anomalous Water Properties on the West Florida Shelf. J. Geophys. Res. Ocean. 2003, 108, 3184. [Google Scholar] [CrossRef]
- Zheng, L.; Weisberg, R.H. Modeling the West Florida Coastal Ocean by Downscaling from the Deep Ocean, across the Continental Shelf and into the Estuaries. Ocean Model. 2012, 48, 10–29. [Google Scholar] [CrossRef]
- Mooers, C.N.K. A Technique for the Cross Spectrum Analysis of Pairs of Complex-Valued Time Series, with Emphasis on Properties of Polarized Components and Rotational Invariants. Deep Sea Res. Oceanogr. Abstr. 1973, 20, 1129–1141. [Google Scholar] [CrossRef]
- Yang, Y.; Wei, C.; Yang, F.; Lu, T.; Zhu, L.; Wei, J. A Machine Learning-Based Correction Method for High-Frequency Surface Wave Radar Current Measurements. Appl. Sci. 2022, 12, 12980. [Google Scholar] [CrossRef]
Disclaimer/Publisher’s Note: The statements, opinions and data contained in all publications are solely those of the individual author(s) and contributor(s) and not of MDPI and/or the editor(s). MDPI and/or the editor(s) disclaim responsibility for any injury to people or property resulting from any ideas, methods, instructions or products referred to in the content. |
© 2024 by the authors. Licensee MDPI, Basel, Switzerland. This article is an open access article distributed under the terms and conditions of the Creative Commons Attribution (CC BY) license (https://creativecommons.org/licenses/by/4.0/).

