Article

A Multisensory Analysis of the Moisture Course of the Cave of Altamira (Spain): Implications for Its Conservation

1
GIM Geomatics, S.L. C/Conde Torreanaz 8, 39300 Torrelavega, Spain
2
Polytechnic School, Universidad Europea del Atlántico, Parque Científico y Tecnológico de Cantabria, C/Isabel Torres 21, 39011 Santander, Spain
3
Museo Nacional y Centro de Investigación de Altamira, Marcelino Sanz de Sautuola, S/N, 39330 Santillana del Mar, Spain
4
Department of Cartographic Engineering, Geodesy and Photogrammetry, Universitat Politècnica de València, Camino de Vera, s/n, 46022 Valencia, Spain
*
Author to whom correspondence should be addressed.
Remote Sens. 2024, 16(1), 197; https://doi.org/10.3390/rs16010197
Submission received: 28 November 2023 / Revised: 23 December 2023 / Accepted: 30 December 2023 / Published: 3 January 2024
(This article belongs to the Special Issue Application of Remote Sensing in Cultural Heritage Research II)

Abstract

:
This paper addresses the conservation problems of the cave of Altamira, a UNESCO World Heritage Site in Santillana del Mar, Cantabria, Spain, due to the effects of moisture and water inside the cave. The study focuses on the description of methods for estimating the trajectory and zones of humidity from the external environment to its eventual dripping on valuable cave paintings. To achieve this objective, several multisensor remote sensing techniques, both aerial and terrestrial, such as 3D laser scanning, a 2D ground penetrating radar, photogrammetry with unmanned aerial vehicles, and high-resolution terrestrial techniques are employed. These tools allow a detailed spatial analysis of the moisture and water in the cave. The paper highlights the importance of the dolomitic layer in the cave and how it influences the preservation of the ceiling, which varies according to its position, whether it is sealed with calcium carbonate, actively dripping, or not dripping. In addition, the crucial role of the central fracture and the areas of direct water infiltration in this process is examined. This research aids in understanding and conserving the site. It offers a novel approach to water-induced deterioration in rock art for professionals and researchers.

1. Introduction

The conservation of rock art caves is a critical part of preserving cultural heritage, offering insights into ancient civilizations. In the global realm of cultural studies, this endeavor intersects with geophysics, geomatics, and remote sensing technologies. Geophysics methods such as Electrical Resistivity Tomography (ERT) using a pole-dipole array, coupled with local rainfall analysis, discern underground water storage zones like recharge areas, aiding in cave environment monitoring non-invasively in France’s Lascaux Cave complex [1]. Ground Penetrating Radar (GPR) has been used to preserve painted caves [2] and their conservation condition [3,4]. Geomatics tools like GIS and photogrammetry support the creation of detailed maps and 3D models, as seen in Australia’s Murujuga rock art [5,6], helping in conservation planning. Additionally, remote sensing techniques, including satellite imagery and drones, provide expansive views, helping monitor sites like Bhimbetka Rock Shelters in India [7,8], enabling distant assessment and safeguarding against environmental degradation or human impact.
The cave of Altamira is a masterpiece of universal art, an exceptional testimony of a vanished cultural tradition, landscape, and a technological ensemble that illustrates, like few others, a significant period in the history of mankind. For this reason, it was inscribed on the UNESCO World Heritage List in 1985.
It is in Santillana del Mar (Cantabria), which is in the North of the Iberian Peninsula (Figure 1) and has an irregular shape of about 290 m, where galleries open, including the famous Polychrome Hall, where its well-known bison were drawn [9,10].
Many of its paintings show substantial conservation due both to the low rate of water infiltration generated by the geological tabular structure of the cave and its stable microclimatic conditions due to its natural closure [11], which took place 13,000 years ago.

1.1. The Cave of Altamira Geographic Setting

1.1.1. Climatic Context

The climatic environment at the cave of the Altamira site is defined by a Cfb climate according to the Köppen classification, which is classified as oceanic or Atlantic and is characterized by being temperate and humid with no dry season and mild summers. Extensive measurements of microclimatic parameters, including temperature and precipitation, have been made outside the cave. These studies have provided a better understanding of the environmental conditions affecting the cave, using instruments such as rain gauges and sonic anemometers to measure precipitation and wind speed and tests to evaluate the thermal effect of the exterior door. The external temperature mainly determines the temperature distribution inside the cave through the surrounding rock mass, and its behavior shows marked seasonal variations, with the warmest months being July and August and the coldest months being December, January, and February.
The recent average outdoor temperature stands at 14.6 °C, with an average range of 8 °C. Monthly temperatures follow a pseudo-sinusoidal pattern, with summer (July–August) being the warmest and winter (December–January–February) the coldest. The relative humidity is consistently high, ranging between 80% and 90% throughout the year, with fluctuations between 30% and near 100%. Typically, summer months exhibit higher specific humidity, while winter months hit the lowest annual levels. The annual accumulated precipitation is around 1300 mm, typical for a rainy region, mainly falling in autumn/winter [12].
Regarding CO2 concentration in external air—a significant gas affecting cave preservation—it fluctuates monthly, averaging between 400 and 500 ppm without a distinct pattern, unlike inside the cave [13]. Gaseous exchange within the cave, focusing on CO2 and radon variation, shows seasonal behaviors influenced by thermal gradients between indoor and outdoor environments, alongside moisture saturation in the surrounding rock’s cracks and fissures. This exchange is more active in summer and less so in winter, with transitional periods in spring and fall. External humidity remains high, 80% to 90%, throughout the year, while precipitation, about 1300 mm annually, concentrates mainly in autumn and winter, shaping the meteorological conditions that affect Cave of Altamira’s behavior and conservation.

1.1.2. Geology of the Cave

The cave of Altamira exhibits several lithological units in its interior, identified and mapped according to the terminology of [14]. Comparatively, many levels have been recognized on the exterior, which is evident in the interior, along with external alteration patterns, providing clues to identify these patterns at greater distances from the entrance. Detailed geologic mapping of the surrounding area has allowed us to characterize the hydrologic conditions and geologic geometry, both at the surface and in the subsurface next to the cave. These studies reveal a complex stratigraphy, highlighting formations such as the Ojo Negro, San Esteban, and Altamira, where the latter is important to delimit units of cavity development and the strata that host the prehistoric paintings.
In detail, the Ojo Negro formation comprises Lower Cenomanian dolomitized calcarenites [15], being considered the basal unit. The San Esteban Formation, 26 m thick, consists of three identifiable units, while the Altamira Formation, dated to the middle-upper Cenomanian [16], hosts the Altamira karst complex, being fundamental to define the cavities and strata where the prehistoric paintings have been made [17]. The Cave of Altamira is developed in this formation. Several layers have been identified, such as the Polychromes and the Brown, with particular paintings and geological features, letting us understand their formation and relationship with the cave paintings.
However, the structural geology and geomorphology of the cave of Altamira show a limestone hill with a slight slope close to a horizontal monocline. The area exhibits stratigraphic units affected by subvertical faults with slight movements distributed in different directions. In addition, a connection between the dolines and the fault network is seen, with sinkholes aligned parallel to the fault planes, suggesting the influence of the faults on the current karst activity. Landslides are also common in the area, particularly in areas near the dolines, evidencing erosion phenomena and soil and rock displacements.

1.1.3. Previous Microclimatic Monitoring Investigations Conducted in the Cave

The monitoring studies of microclimatic conditions carried out in the Cave of Altamira have provided detailed knowledge of the environmental conditions inside the cave and how they impact the preservation of the cave paintings [18,19,20,21,22]. Specifically, continuous monitoring of various microenvironmental parameters has been conducted, such as temperature at different heights, the temperature of the rock substrate, air relative humidity, the concentration of CO2 and 222Rn in the indoor air, atmospheric pressure, and wind speed inside the cave.
The results have enabled the identification of preservation variables, both from the natural dynamics of the cave and anthropogenic factors that occasionally contribute material and energy, inducing changes in the cave’s natural physicochemical and biological conditions. Among these variables, the concentrations of CO2, and to a lesser extent 222Rn, inside the cave are relevant. The cavity’s connection with the outside in the gaseous phase shows its highest magnitude during summer, favoring material flow between the exterior and the interior of the cave. But during the winter period (November to May), there is an almost complete cessation of interconnection with the exterior in the gaseous phase, helping to concentrate these gases.
Another significant factor inducing deterioration processes in the cave paintings is undoubtedly the infiltration of water entering the cave through major fractures and fissures. Additionally, water vapor condensation decisively contributes to increasing relative humidity and triggers microcorrosion processes of the rock supporting the paintings.
The microclimatic monitoring studies conducted in the Cave of Altamira have provided detailed insight into the environmental conditions inside the cave and their impact on the conservation of the cave paintings. They have identified the primary sources of moisture in the cave, which is essential for implementing preventive conservation measures to reduce the effects of all these deterioration factors involved in the natural dynamics of the cave and its paintings.

1.1.4. History of Previous Interventions

The history of interventions in the Cave of Altamira during the 20th century reveals significant changes that have affected its conservation. These actions, although they did not include direct restoration of the paintings, harmed the natural environment of the cave and its rock art [23,24,25]. Notable among these alterations were the installation of an entrance door, the construction of artificial walls, the filling with cement of the crack in the ceiling of the Polychrome Hall, and the addition of an artificially illuminated central corridor to facilitate public access.
The scientific community became concerned about the condition of the paintings in the 1970s, especially the discoloration observed in some representations. The increase in the number of visitors drastically affected the environmental conditions, causing a decrease in relative humidity and an increase in temperature and carbon dioxide in the cave. This led to the closure of Altamira in 1977, and it was later reopened with a visitor regime limited to 8500 visitors per year. However, subsequent research showed that even this limited number of visitors generated conservation problems in the limestone rocks and cave paintings.
After the temporary closure in 2002 due to the detection of cyanobacteria linked to artificial lighting, a more in-depth analysis of the state of conservation was undertaken. Studies by the CSIC showed that the changes made over the years had transformed the natural ecosystem of the cave, allowing the proliferation of bacteria and processes of dissolution of the rocks. In addition, the human presence associated with the emission of CO2 and condensation processes accelerated the deterioration of the limestone rock and the paintings. These facts emphasize the need to base conservation actions on scientific knowledge to reduce the negative impact of tourism on cultural heritage.

1.2. Previous Studies

Such is the fragility of this cave that, geologically, it is, so to speak, at the end of its life, as many studies have shown. An important network of fissures, fractures, and displacements from the top of the cave to the cave ceilings themselves affects its stability and determines important changes in the circulation of infiltrating water, which generates processes of concretion, microcorrosion, dissolution, and the dragging of paint. Water infiltration with the condensation water and CO2 concentrations are the main problems for the conservation of the paintings. To address this problem, an intervention was carried out to try to reverse the infiltration of rainwater through the network of fissures and fractures in the cave. This intervention made in the decade of the 1920s consisted of filling the central fracture and other fractures with hydraulic mortar on the ceiling of the Polychrome Hall and with cement on the outer surface of the lapiés [26].
Besides this, anthropic factors continue to be the main threat to its conservation. The many internal and external changes this cave was subjected to after its discovery generated a radical change in its environmental dynamics and made it possible for a lot of nutrients to enter by infiltrating the water, something that led to the proliferation of bacterial and fungal colonies.
The most worrying factors within the conservation of caves have to do with deterioration processes related to water, geology, biodeterioration, and human presence [26,27,28]. To understand their dynamics and reduce the alterations they generate, it is important to develop effective conservation strategies aimed at controlling harmful agents such as temperature, humidity, and CO2.
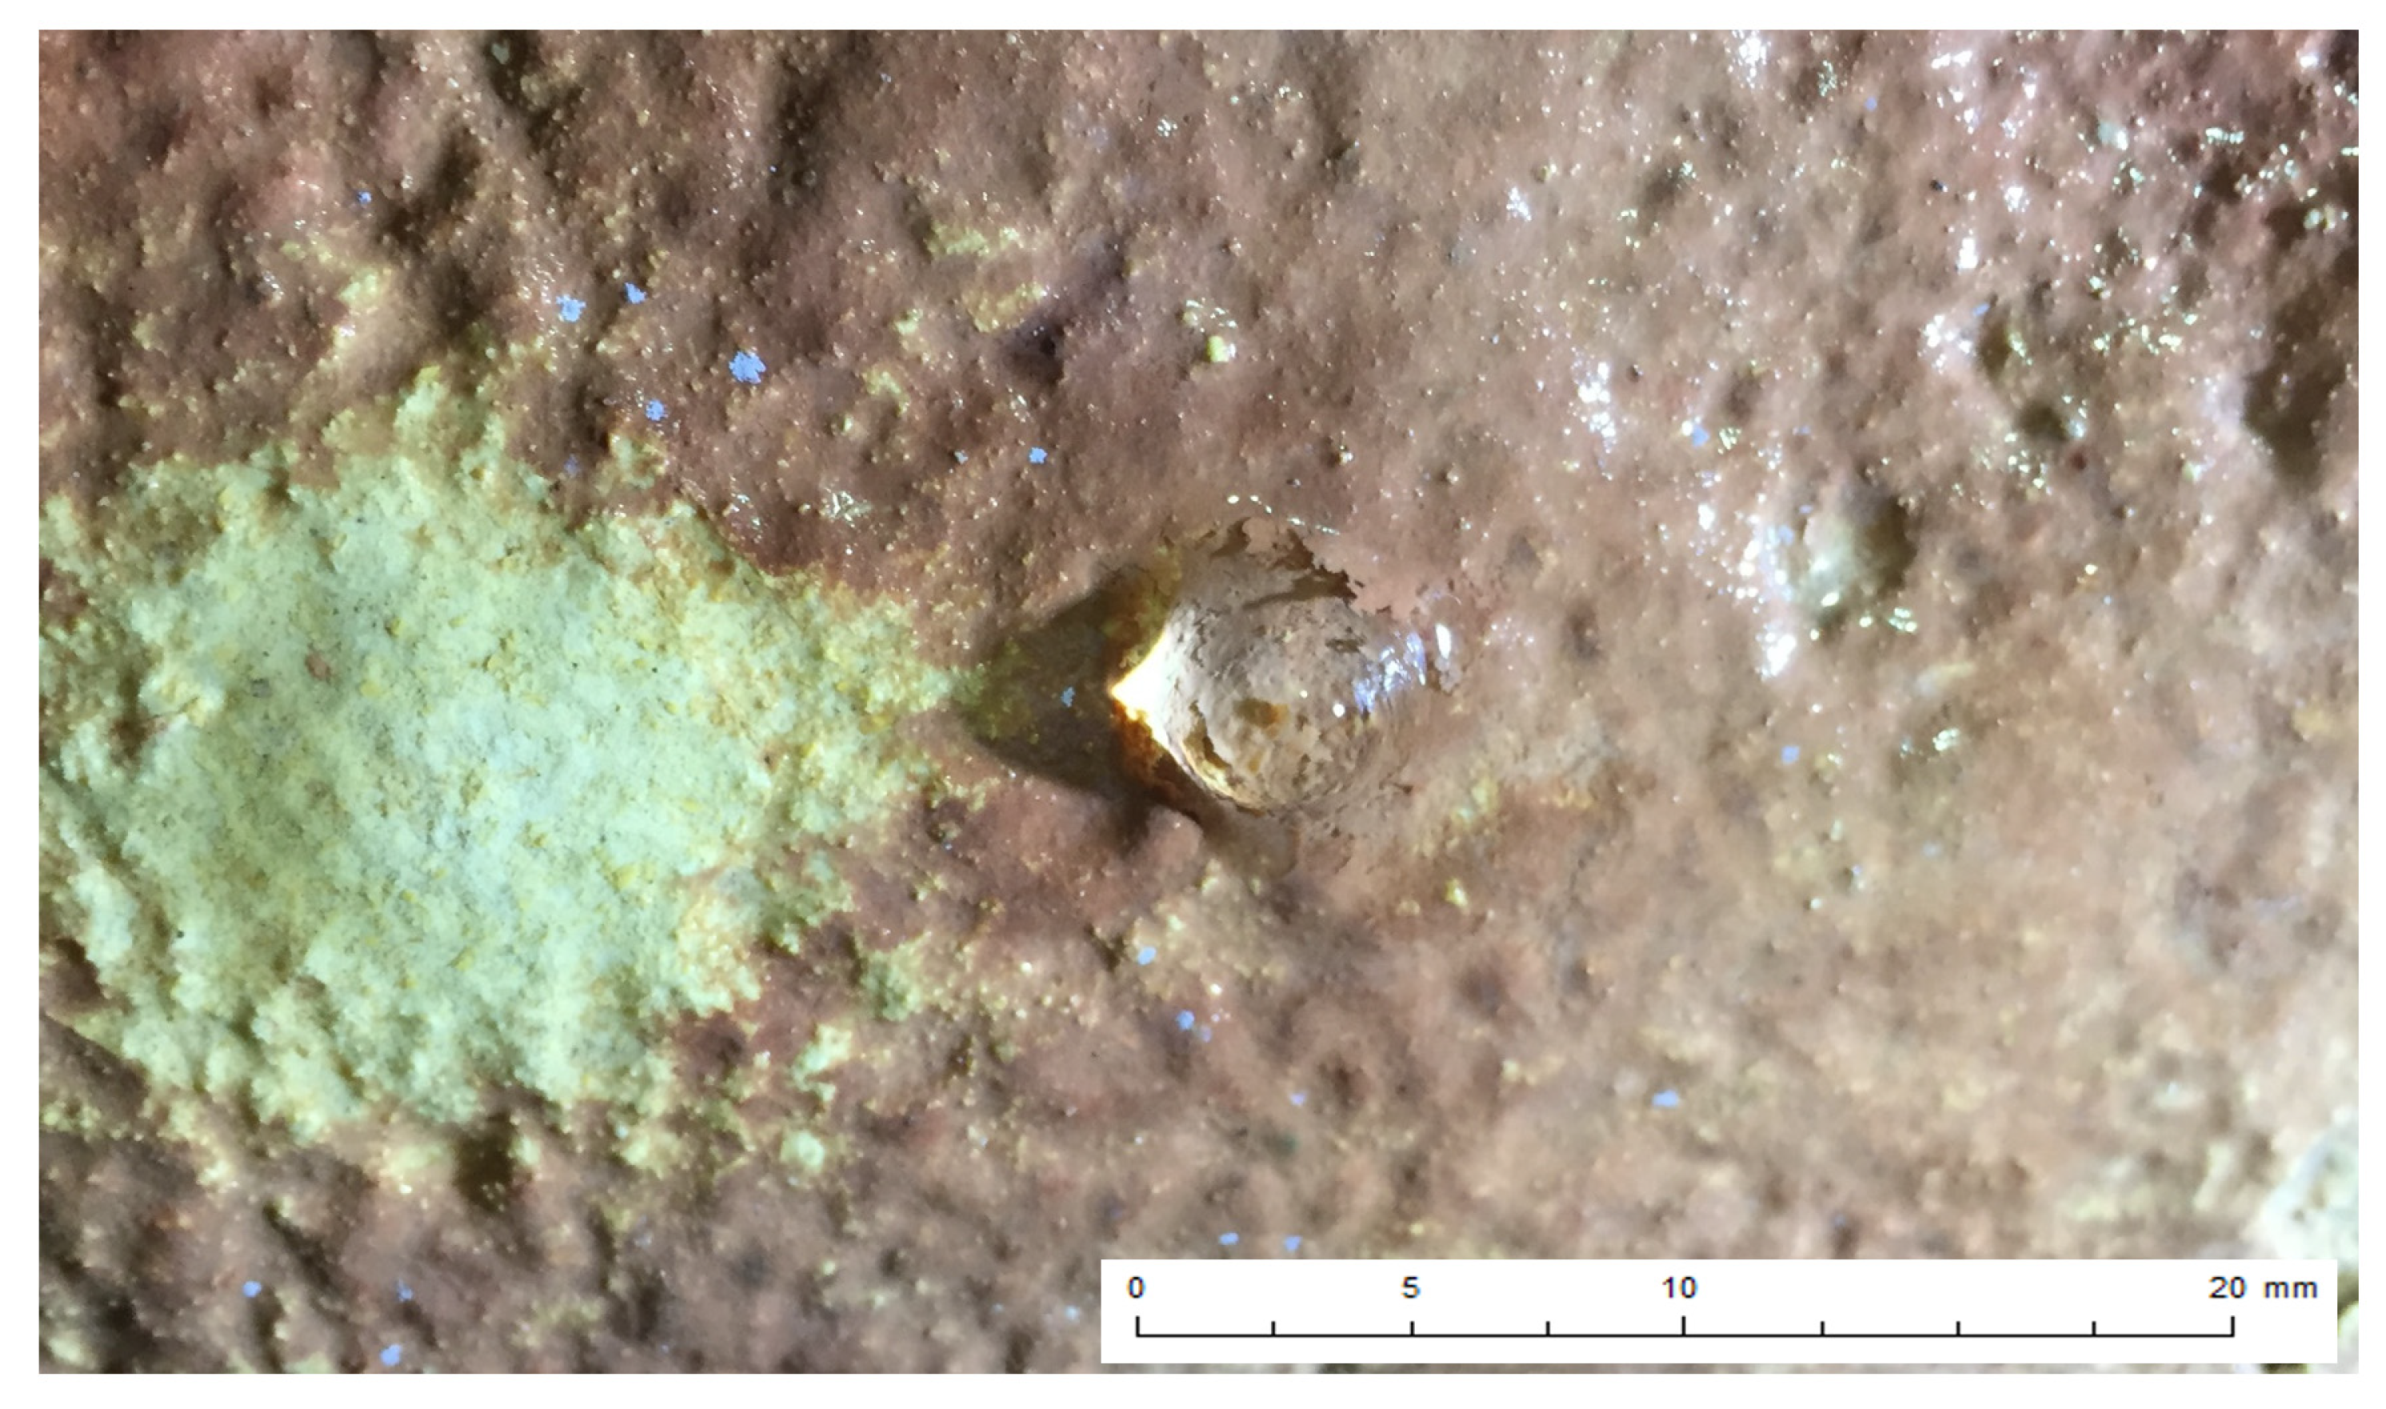
CO2, along with water, plays an important role in the dissolution and entrainment processes of the supporting rock (Figure 2). We are concerned with various deterioration processes, including microcorrosion, adhesion loss, cracking, washing, and loss of support. These processes have been in motion since the cave’s inception and continue to this day. It is important to emphasize that these deterioration processes start from the moment the Altamira art was crafted.
Knowing and studying the underlying dynamics of these processes associated with paint loss from washing in active drip areas is essential to design strategies to control each agent of alteration and the interactions between them.
The only guarantee of long-term preservation must be through the control of these agents of deterioration, humidity, temperature, and CO2. Future conservation measures have to consider all these factors in an unstable preservation environment. In this sense, these studies are focused on integrating data that allow the creation of a first approximation of the hydrogeological model [29,30,31,32] of the Polychrome Hall overlying layer.
These models are a mathematical and conceptual representation of a groundwater system used to understand, simulate, and predict aquifer behavior [33,34,35]. These models are essential for groundwater resource management, as they allow for characterizing the aquifer, simulating groundwater flows, assessing water quality, evaluating environmental impacts, and planning long-term water resource management. A hydrogeological model is an essential tool in the management and conservation of groundwater and groundwater resources, as it allows understanding and predicting the behavior of aquifers and making informed decisions on their use and management [36,37,38,39].
Losing adhesion of the pigment to the support is related to the physical and chemical features of the water, which incorporates CO2 and other nutrients from the soil [24] to the surface of the roof through the outer soil cover, causing the partial dissolution of the limestone rock and giving rise to the formation of small interconnected depressions of millimetric or centimetric size that, like a hydrographic network, act as a vehicle for transporting both the paint itself and carbonates, salts, clays, small fragments of quartz and dolomite, as well as other products, dragging them to the different drip points [40].
In the framework of our ongoing GPR geophysical investigations in the cave of Altamira [41,42], using time-domain radar data processing, moisture zones and discontinuities (fractures, fissures, detachments, stratification planes, joints, voids) were mapped in the overlying layer of the Polychrome Hall. This mapped set of moisture zones and discontinuities configure the connecting pathways of matter and energy exchange between the exterior surface and the interior of the Polychrome Hall. These pathways contribute to the dripping and exterior-interior gaseous exchange processes of the Polychrome Hall. Furthermore, the results revealed that the internal rock structure of the overlying layer of the Polychrome Hall is complex with zoned internal singularities.
To understand the hydrogeologic model of the Polychrome Hall, it is necessary to integrate three key elements to understand the potential flow of moisture.
  • Surface Model: obtained by drone photogrammetry to generate a 2 cm ground sample distance (GSD) model of ground elevation. This model is analyzed to obtain the sinks. A sinkhole in hydrology refers to a geologic or structural feature that acts as a drainage point for water flow in a hydrologic system. Sinks play an essential role in the water cycle by letting surface water flow into the subsurface.
  • Overlying thickness model: The digital processing of GPR data is generally based on the amplitude values of the signal for interpretation. Time domain radar data thus consist of back-scattered signals from the subsurface and the signals can be defined as plots of time versus amplitude of the reflected electromagnetic pulses. In addition, the transformation of GPR data into its instantaneous magnitude, phase, and frequency information is an alternative way of processing GPR data. The Hilbert transform is used to express the relationship between the magnitude and phase of a signal or between its real and imaginary parts. This transform reconstructs the phase of a signal from its amplitude. A comprehensive mathematical description of the attributes of GPR data can be found in [43,44,45,46,47]. The Hilbert transform can be successfully applied to complex subsurface rock structures to enhance the reflection and absorption contrast of the electromagnetic wave in a geological medium. As a result, GPR attributes can often uncover or highlight features or patterns that are not evident in standard amplitude data [48,49,50,51].
  • Polychrome ceiling model: In 2014, a photogrammetric campaign was conducted to document the ceiling of the Polychrome Hall. This effort aimed to achieve a sub-millimeter resolution level, distinct from the laser scanning process [52]. High-resolution digital elevation models (DEMs) with 200 microns GSD were generated for the cave’s ceiling. By integrating hydrological data, this approach allowed us to simulate capillary pathways and identify critical mass points where water eventually drips to the cave floor. Moreover, the modeling process could consider various factors, such as the geological properties of the ceiling material and its permeability.
The model was used to calculate the drip points and possible water courses based on the existing fractures. Knowing the water leak points is important because they are the end of the water flow path and the place where small particles, fungi, bacteria, and paint carried by the water could fall to the ground.
Once the three models have been integrated, it is possible to interpret them together and make sections of them to understand the course of the water flow. The paper deals with how to determine the main moisture/water courses in the Polychrome overlying layer, as well as its particularities due to the karstification of the ceiling (fractures, voids, calcification, condensation, etc.). In this study, the use of Hilbert transform attributes in GPR interpretation aims to increase the knowledge of the internal geometry of the karst rock mass overlying the Polychrome Hall and thus characterize the electromagnetic response of the presence of moisture and water zones in its overlying carbonate rocks.

2. Materials and Methods

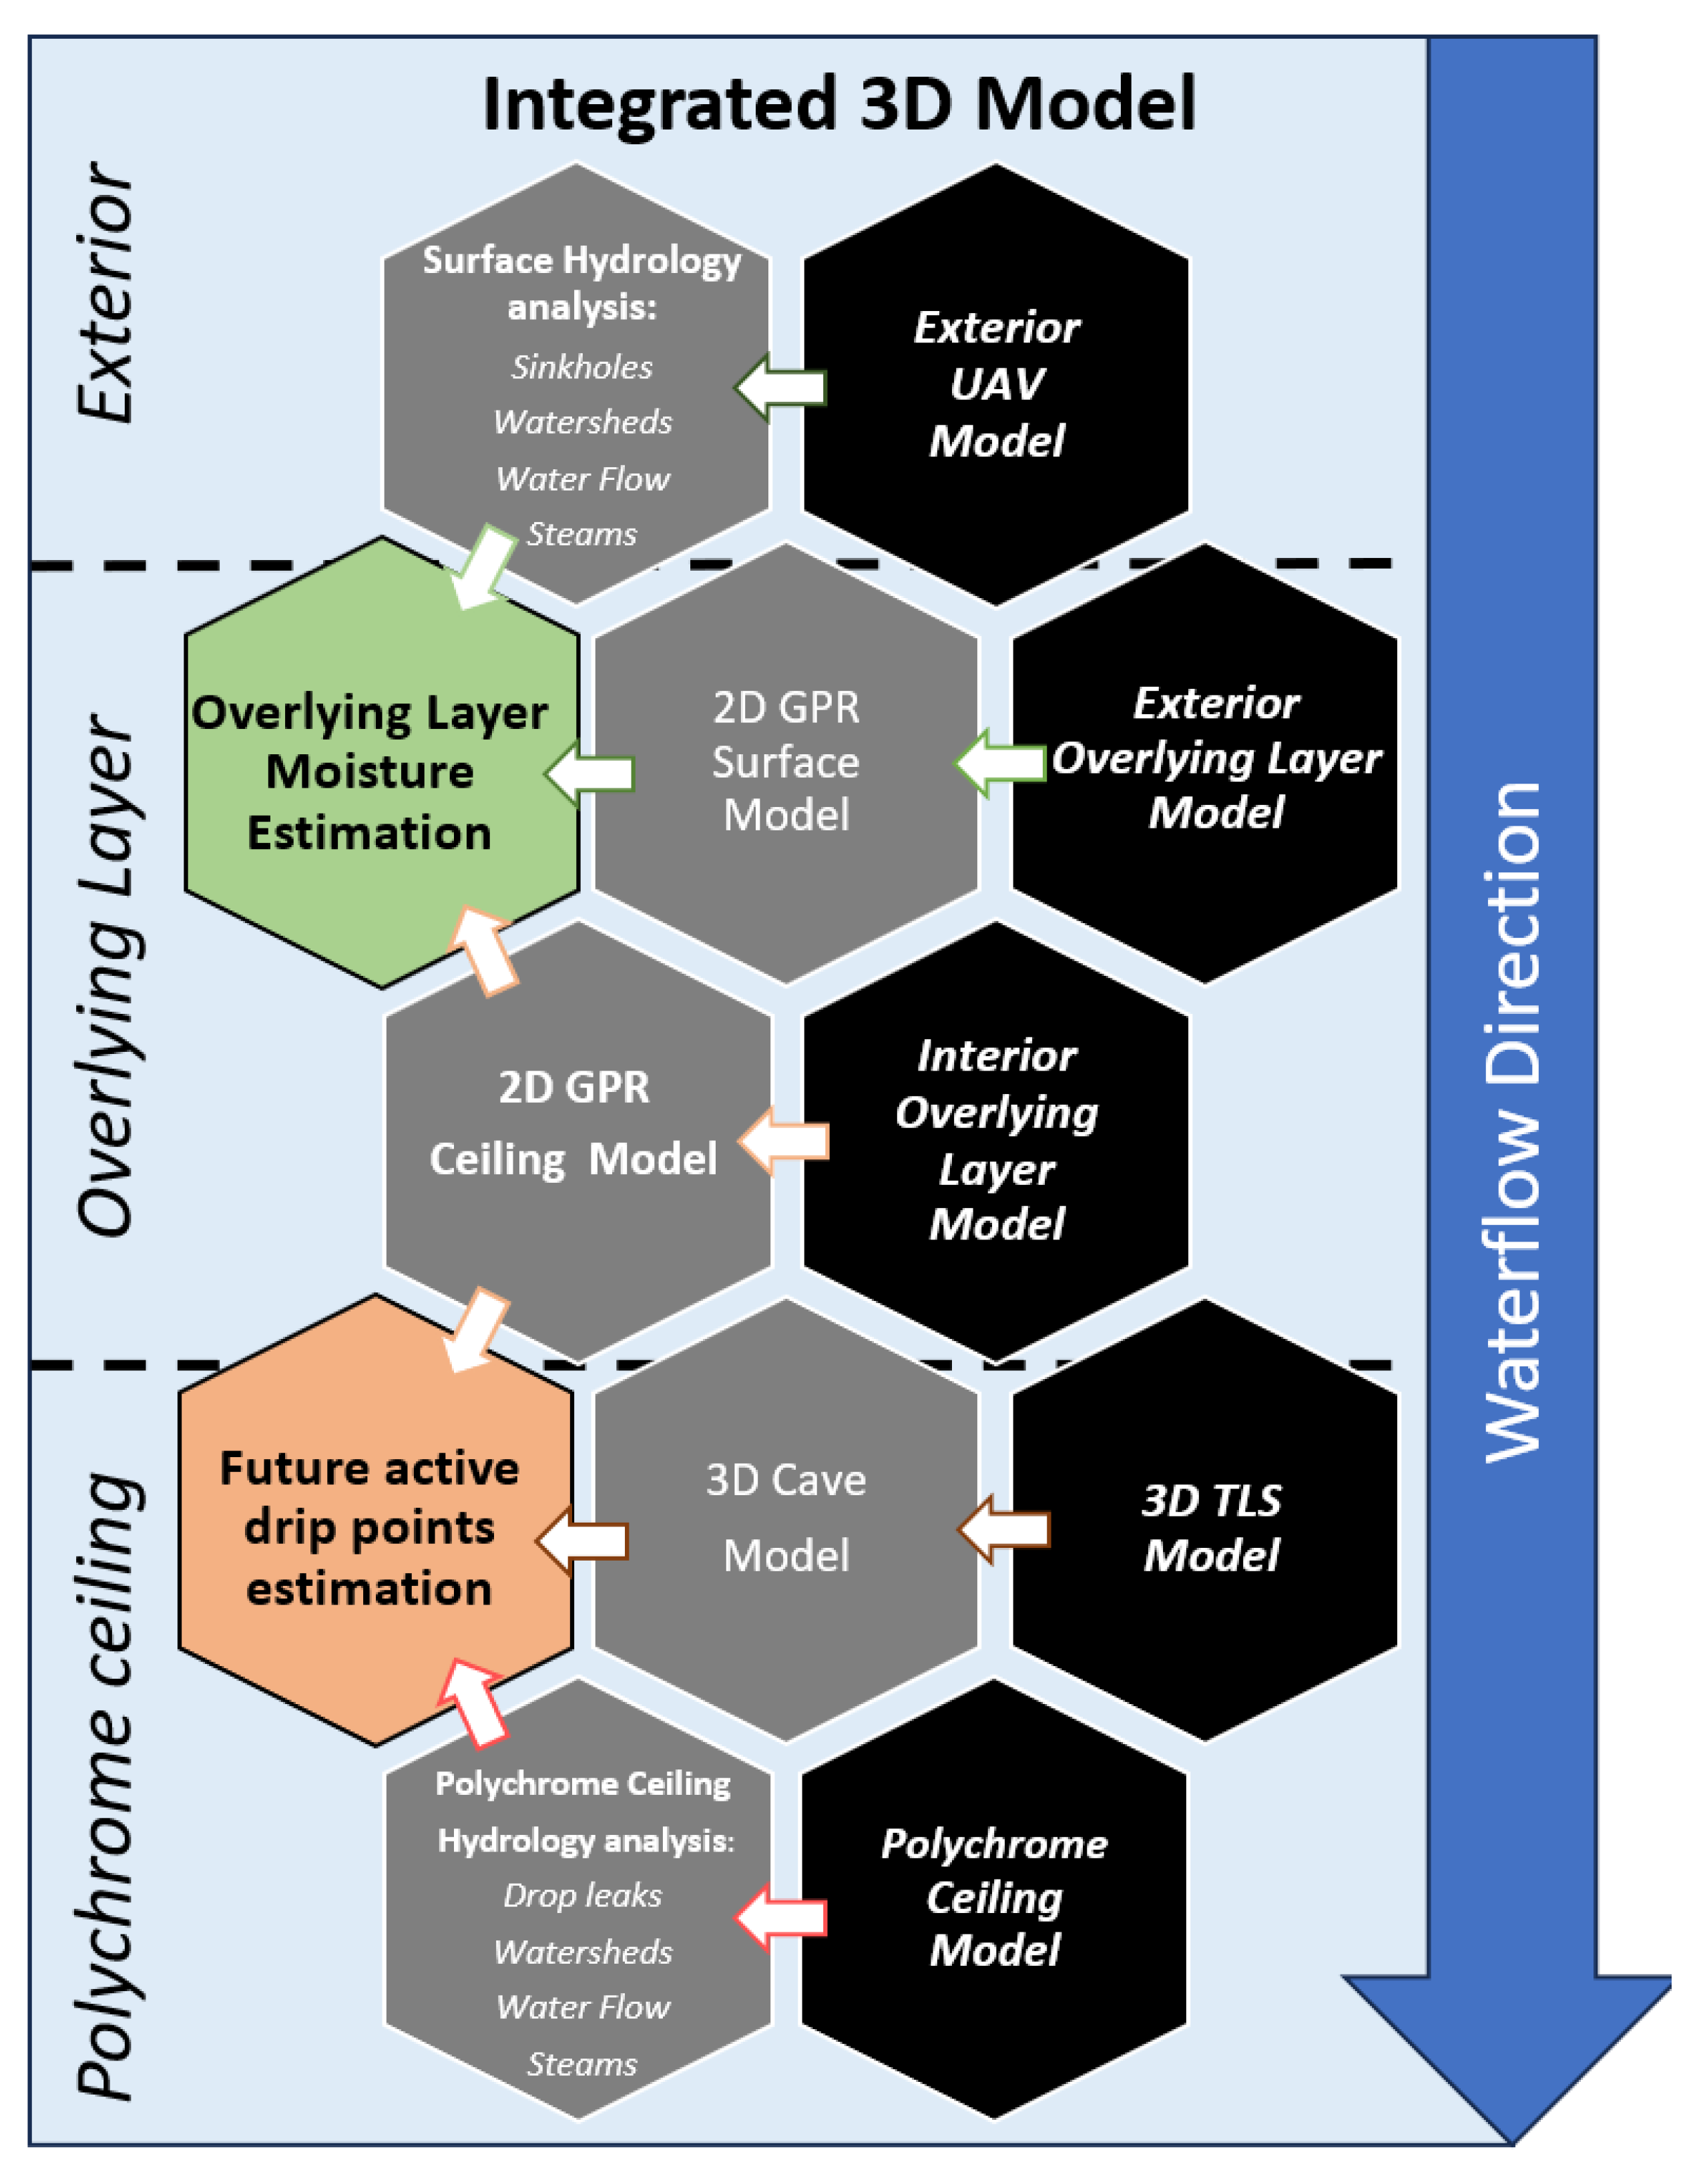
The formation of caves arises from the complex interplay of chemical reactions, geological phenomena, tectonic forces, and atmospheric influences on limestone rock, gradually dissolving it. This paper shows an innovative approach that employs five remote sensing techniques to comprehensively analyze various facets of cave systems. The proposed method incorporates the characterization of the exterior surface of the cave, the cave, Polychrome ceiling, and the overlying layer. By integrating these five remote sensing techniques, a holistic understanding of the cave environment is achieved, enabling researchers to track the details of the karst system. This multifaceted approach goes beyond conventional cave exploration by providing a nuanced perspective on the exterior morphology, interior dynamics, artistic features on the cave ceiling, and the overall health of the overlying layer. This method gives researchers the means to anticipate ceiling drips, an important part of preserving caves and their cultural or geological significance. The union of these remote sensing techniques stands as a promising avenue for advancing our understanding of cave systems and putting proactive measures into practice for their conservation [53], as shown in Figure 3.

2.1. General Workflow Diagram

Integrating data into the model initiates with the establishment of a reference frame, a task accomplished using the accuracy of the Global Navigation Satellite System (GNSS) [54], a globally spanning satellite network technology [55]. Back in 2013, the TOPCON Hyper II receivers [56] were used to create a geodetic reference system, aligning with the European Terrestrial Reference System 1989 (ETRS89). The assessment of observed phase changes, executed with Topcon Tools software [57], resulted in a reference frame boasting an average accuracy of 1.7 cm when determining the coordinates of exterior cave vertices.
The significance of maintaining a highly precise cartographic model of the cave manifests when projecting knowledge-based models that rely on georeferenced parameters, encompassing aspects such as microbiological, climatic, hydrochemical, geomorphological, and geophysical data [58].
Once the reference frame was established, a surface model was obtained by drone photogrammetry to generate a 2 cm (GSD) model of ground elevation. To reach this resolution, a flight plan was made to obtain measurements throughout the entire cave’s overlying layer (40 Ha). Over 4800 pictures were taken, 52 Ground Control Points (GCP) were measured with RTK-GNSS to reference the flight, and another 40 points were measured for quality control. The mean error of the control points was 1.76 cm [41].
Earlier in 2014, a photogrammetry campaign was conducted to document the Polychrome Hall ceiling [52], complementing the laser scanning process and achieving sub-millimeter resolution documentation. The Hasselblad H4 D-200 MS camera, capable of capturing true R-G-B color, was chosen given its suitability for both geometric accuracy and color analysis. Equipped with HC 3.5/35 and HC 4/28 lenses, this camera captured frames at a resolution of 8176 × 6132 pixels. A minimum resolution of 16 pixels/mm2 was set, with an illumination system comprising two 4800 Kelvin-degree LED flat screens, each providing an illuminance of 980 lux and covered with a Rosco Cinegel 3000 Tough Rolux plastic diffuser.
The photogrammetric support involved the detection of homologous points extracted from the 3D laser scanner’s point clouds. Eighty evenly distributed points were strategically placed throughout the hall, with half serving as control points for model validation. These images were collectively adjusted, leading to the generation of a high-density point cloud containing about 11 billion points. This massive dataset was filtered and generalized to produce another point cloud containing around 3.5 billion points. From this refined dataset, a high-resolution 3D digital model of the ceiling was generated, boasting about 200 million polygons. This model was used to create a 6 Gigapixel orthoimage and a simplified version with 4 million polygons, which facilitated seamless integration.
Once the geometric models are available, hydrology calculations are performed since they play a critical role in understanding the dynamics of water movement across the overlying layer and Polychrome ceiling surface. The paper explores the methodologies and results of a hydrological analysis performed to model water flow in two very different scenarios. The top of the Polychrome Hall is located above the maximum level of influence of possible lateral contributions of water infiltrating into the karst from topographically higher areas so that the water supply is produced by direct infiltration of rainwater through the fractures and hair cracks [27,28]. It is at the uppermost region of the overlying layer, within the initial centimeter, where the water moves on the surface, where the drains through which the water can enter are located. The objective is to find the sinks through which water can potentially enter the overlying layer towards the Polychrome Hall.
Secondly, the overlying layer, where the thickness of the bedrock does not exceed nine meters, with the thickness of the superficial soil cover varying between 10 and 30 cm. The most superficial rock layer shows some brecciation and dissolution effects, with accumulations of clays and other minerals (dolomite particles). There is a high degree of decompression, both in the Polychrome Layer itself and in the overlying brown, wedge, and orange layers. Another factor modifying the structural characteristics of the bedrock is the sealing performed in the decade of the 20–30 s of the last century with Portland cement of the surface fractures of the ceiling of Polychrome, which presumably were the direct route of rainwater percolation.
After the overlying layer, already on the Polychrome ceiling, the displacement of water through it is modeled due to surface tension, which is an essentially capillary phenomenon that manifests itself thanks to the physical and chemical properties of water and the inherent porosity of the limestone rock; this process, characteristic in karstic environments, plays an important role in the redistribution of water through the Polychrome ceiling and in the formation of calcifications and geological structures such as stalactites and stalagmites.

2.2. Hydrology of the Polychrome Overlying Layer

From the 3D model obtained by UAV, a hydrological analysis is performed in QGIS [59] with the key objective of elucidating the sources and destinations of water within the area. Multiple analytical functions have been applied to help with an accurate representation of the dynamics of water flow over this terrain [60].
The stream ordering method employed in this study is rooted in the Strahler method [61]. This method assigns numerical values to segments of a raster, effectively representing branches in a linear network. The numerical order assigned to these segments is instrumental in classifying different types of streams based on their tributary counts. The increase in stream order occurs when streams of the same order intersect. Consequently, the intersection of two first-order links creates a second-order link, while the intersection of two second-order links results in a third-order link, and so on. However, it is worth noting that the intersection of links with differing orders does not affect the order; instead, it retains the order of the higher-ranked link.
The “Basin” function delineates drainage basins by identifying ridge lines that separate them. This process is vital in understanding the spatial distribution of watersheds within the study area [62]. Utilizing an input flow direction raster, the analysis effectively identifies connected cells belonging to the same drainage basin. The “Flow Distance” analysis calculates the horizontal or vertical component of downslope distance, following the flow paths to the cells that converge into stream cells. This method allows for the computation of minimum, weighted mean, or maximum flow distances in the case of multiple flow paths.
Sinks are typically low-lying areas or depressions in the landscape where water can collect, forming temporary or even permanent water bodies. They are important in our hydrological analyses because they are the places where the groundwater is recharged.

2.3. GPR of the Overlying Layer

GPR is commonly used in the investigation of the internal structure of rock masses (blocks and discontinuities in the rock matrix) and in the mapping and characterization of fractures and faults, which are generally defined as mechanically discontinuous, anisotropic, and heterogeneous environments [63,64,65,66,67,68,69,70,71]. A particular use of GPR allows the efficient characterization of discontinuities in a karst system. GPR has proven to be the most successful technique for high-resolution imaging of karst features compared to other non-invasive techniques [72,73,74,75,76,77]. Furthermore, GPR attribute analysis can provide more information from radar records, as GPR attributes are indicative of significant changes in the lithologies and physical properties of geological media [78,79,80,81,82]. GPR is a non-destructive electromagnetic method that provides continuous, high-resolution information on the internal structure of rock masses and their physical properties in both vertical and lateral directions. The GPR technique is based on the propagation of short electromagnetic pulses (t ≤ 1 ns) in the study medium. The reflection of these pulses is produced when there are sharp changes in the medium’s electromagnetic properties: magnetic permittivity, electrical conductivity, and dielectric permittivity. In GPR records, an electromagnetic pulse is defined by the velocity, frequency domain, and amplitude of the wave. These GPR signal features are, therefore, strongly influenced by the medium’s electromagnetic properties (magnetic permittivity, electrical conductivity, and dielectric permittivity) of the medium and their contrasts with each other [83,84]. In low-loss media, the dielectric permittivity (εr) can be approximately calculated by the equation:
ε r = c t 2 h 2
where h is the depth of the layer, t is the two-way travel time (elapsed time) in the GPR profile, and c is the velocity of light (0.299 m/ns). Mean velocities (v) are calculated from [83,84]:
v = c ε r
The reflection amplitudes at the two-material interface can be estimated using the reflection coefficient (R). The reflection amplitudes and intensities of GPR signals are proportional to the contrasts in dielectric permittivities at reflector boundaries and are dependent on the reflection coefficients. Since most GPR studies are carried out in non-magnetic media (low-loss media), the approximate expressions for the electromagnetic impedance (Z) and reflection coefficient (R) for two media are given by [58,59]:
Z 1 = 1 ε r 1 ; Z 2 = 1 ε r 2 ; R = ε r 1 ε r 2 ε r 1 + ε r 2   = Z 2 Z 1 Z 2 + Z 1  
where εr1 is the dielectric permittivity of the upper layer and εr2 is the dielectric permittivity of the lower layer; Z1 is the electromagnetic impedance of the upper layer, and Z2 is the electromagnetic impedance of the lower layer.
This reflection coefficient equation implies that the greater the contrast between the two media, the higher the percentage of incident energy that will be reflected at the boundary/discontinuity of the reflector. For the case where the moisture/water content in a medium is significant, this moisture/water content becomes an influential factor for the values of the dielectric permittivities of geological materials since the dielectric permittivity of water (81) is much higher than that of any other geological material (3–40). According to expression (3), high-amplitude radar reflections are also generated at the interfaces of water-affected (wetter) areas in the subsurface with respect to any surrounding geological material of lower velocity. Therefore, radar reflections of higher amplitude will primarily occur within the same geological formation or at the interfaces of two geological materials whose electromagnetic properties differ considerably [83,84].
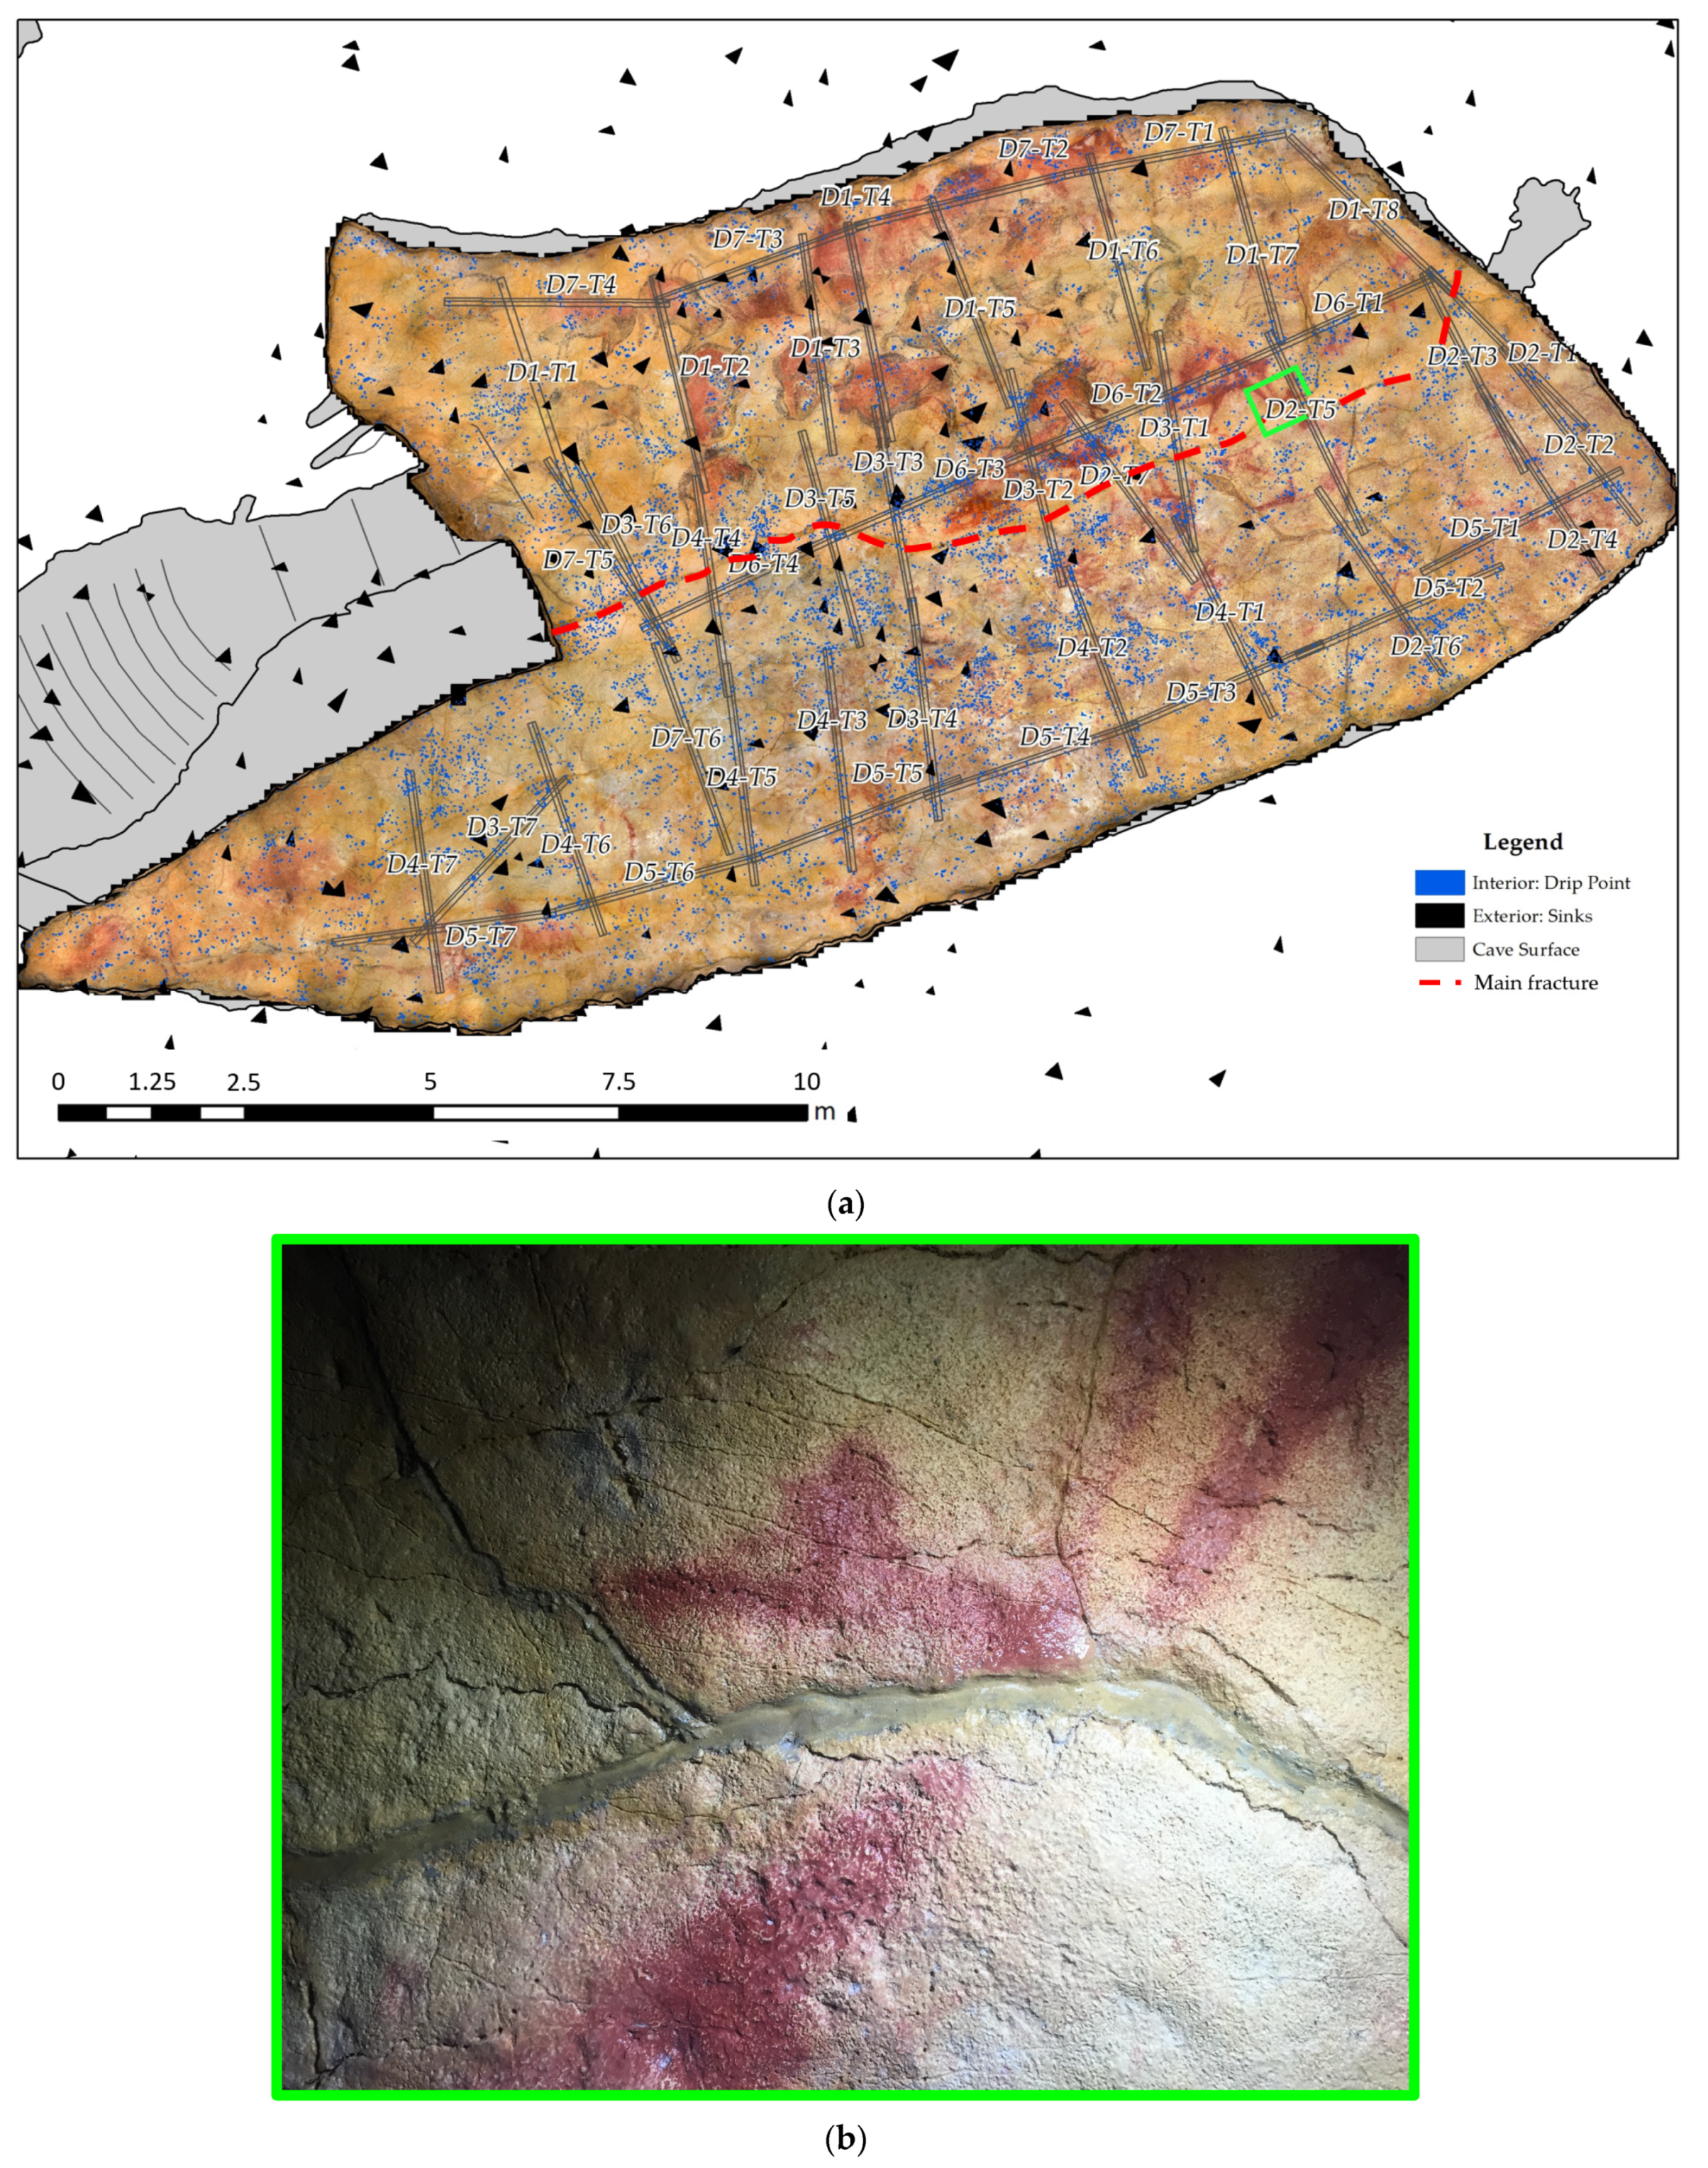
The GPR reflection data were collected using a commercial time domain pulse system, SIR-3000 (Geophysical Survey Systems, Inc., GSSI, Nashua, NH, USA). Due to the importance of the cave paintings in the Polychrome Hall for the cave of Altamira as a complex, it was considered necessary to study in more detail the first meters of its overlying rock from ceiling basal surface. For this purpose, two nominal center frequency antennas of 400 MHz and 900 MHz were used and selected for this study due to their penetration depth capability and wave resolution. The GPR antennas were fitted with odometer wheel (encoder) in order to calculate trace interval distance. For this study, 48 profiles were projected near the ceiling of the Polychrome Hall with each of the 400 MHz and 900 MHz antennas; in total, 96 GPR reflection profiles were recorded. The GPR profile layouts were transverse and parallel to the central fracture, which is sealed with mortar. (Figure 4b), considering the uneven relief of the ceiling and the displacement conditions in the Polychrome Hall. GPR data were collected with the antennas air-coupled to the ceiling of the Polychrome Hall to ensure that no contact occurred between the antennas and the ceiling. This was achieved by placing the antennas on a 3 m long traveling device. The GPR profiles were georeferenced using laser scanning.
Their layouts were transverse and parallel to the central longitudinal fracture (Figure 4a), taking into account the irregular relief of the ceiling and the displacement conditions of its interior. GPR data were collected with the antennas air-coupled to the ceiling of the Polychrome Hall in order to ensure that no contact occurred between the antennas and the ceiling. This was achieved by placing the antennas on a 3 m long traveling device. The GPR profiles were georeferenced using laser scanning.
The average velocity of the GPR wave was determined by the hyperbola fitting method on a set of hyperbolas recorded in different reflection profiles, obtaining an average velocity value of 10.9 cm/ns. The dielectric permittivity (ε) was calculated to be 7.5, according to the following Equation (2) [83,84]. This value was applied for calculation of the processed depths in the investigated site of overlaying layer of Polychrome Hall.
A post-acquisition processing procedure was applied to the raw data sets using RADAN 7.6 software (Geophysical Survey Systems, Inc., GSSI, Nashua, NH, USA). The first step was a 1D processing consisting of DC shift and zero-time correction (time-zero adjustment). After this, the 2D processing was applied to the reflection profiles according to these steps: (i) background removal; (ii) bandpass filters; (iii) linear amplitude gains; (iv) a time-to-depth conversion performed based on calculated velocity average of 11.06 cm/ns for the overlying rock layer.
Next, we use the Hilbert transform technique to decompose electromagnetic pulses into their attributes, such as instantaneous magnitude, phase, and frequency. The instantaneous magnitude display is useful for indicating the raw energy reflected by an interface or layer. Therefore, it highlights the changes in lithology and porosity, the presence of interstitial fluids, and the identification of thin layers. Instantaneous phase information can be more affected by significant changes in dielectric permittivity than by amplitudes (e.g., the presence of moisture/water); therefore, it is easily affected by electromagnetic impedance contrast. Thus, the instantaneous phase information allows the continuity of the reflectors to be followed and does not depend on the amplitude. Therefore, the instantaneous phase information improves the visualization of the discontinuities present in the radar records in areas of greater or lesser attenuation of the electromagnetic signal. The instantaneous frequency shows how the terrain filters the radar signal. The instantaneous frequency identifies areas with high attenuation, allowing areas with significant lithological and interstitial fluid changes to be located. This attribute also allows the identification of very thin horizontal discontinuities, such as bedding planes.

2.4. Polychrome Ceiling Hydrology

In the interior of the cave, the modeling of water movement within the ceiling, where water moves primarily due to the influence of surface tension, presents a challenging scenario. This phenomenon occurs as water infiltrates through the porous and fractured ceiling material, guided by capillary forces and the cohesive properties of water molecules [85,86,87]. To accurately model this process, GIS technologies play an essential role.
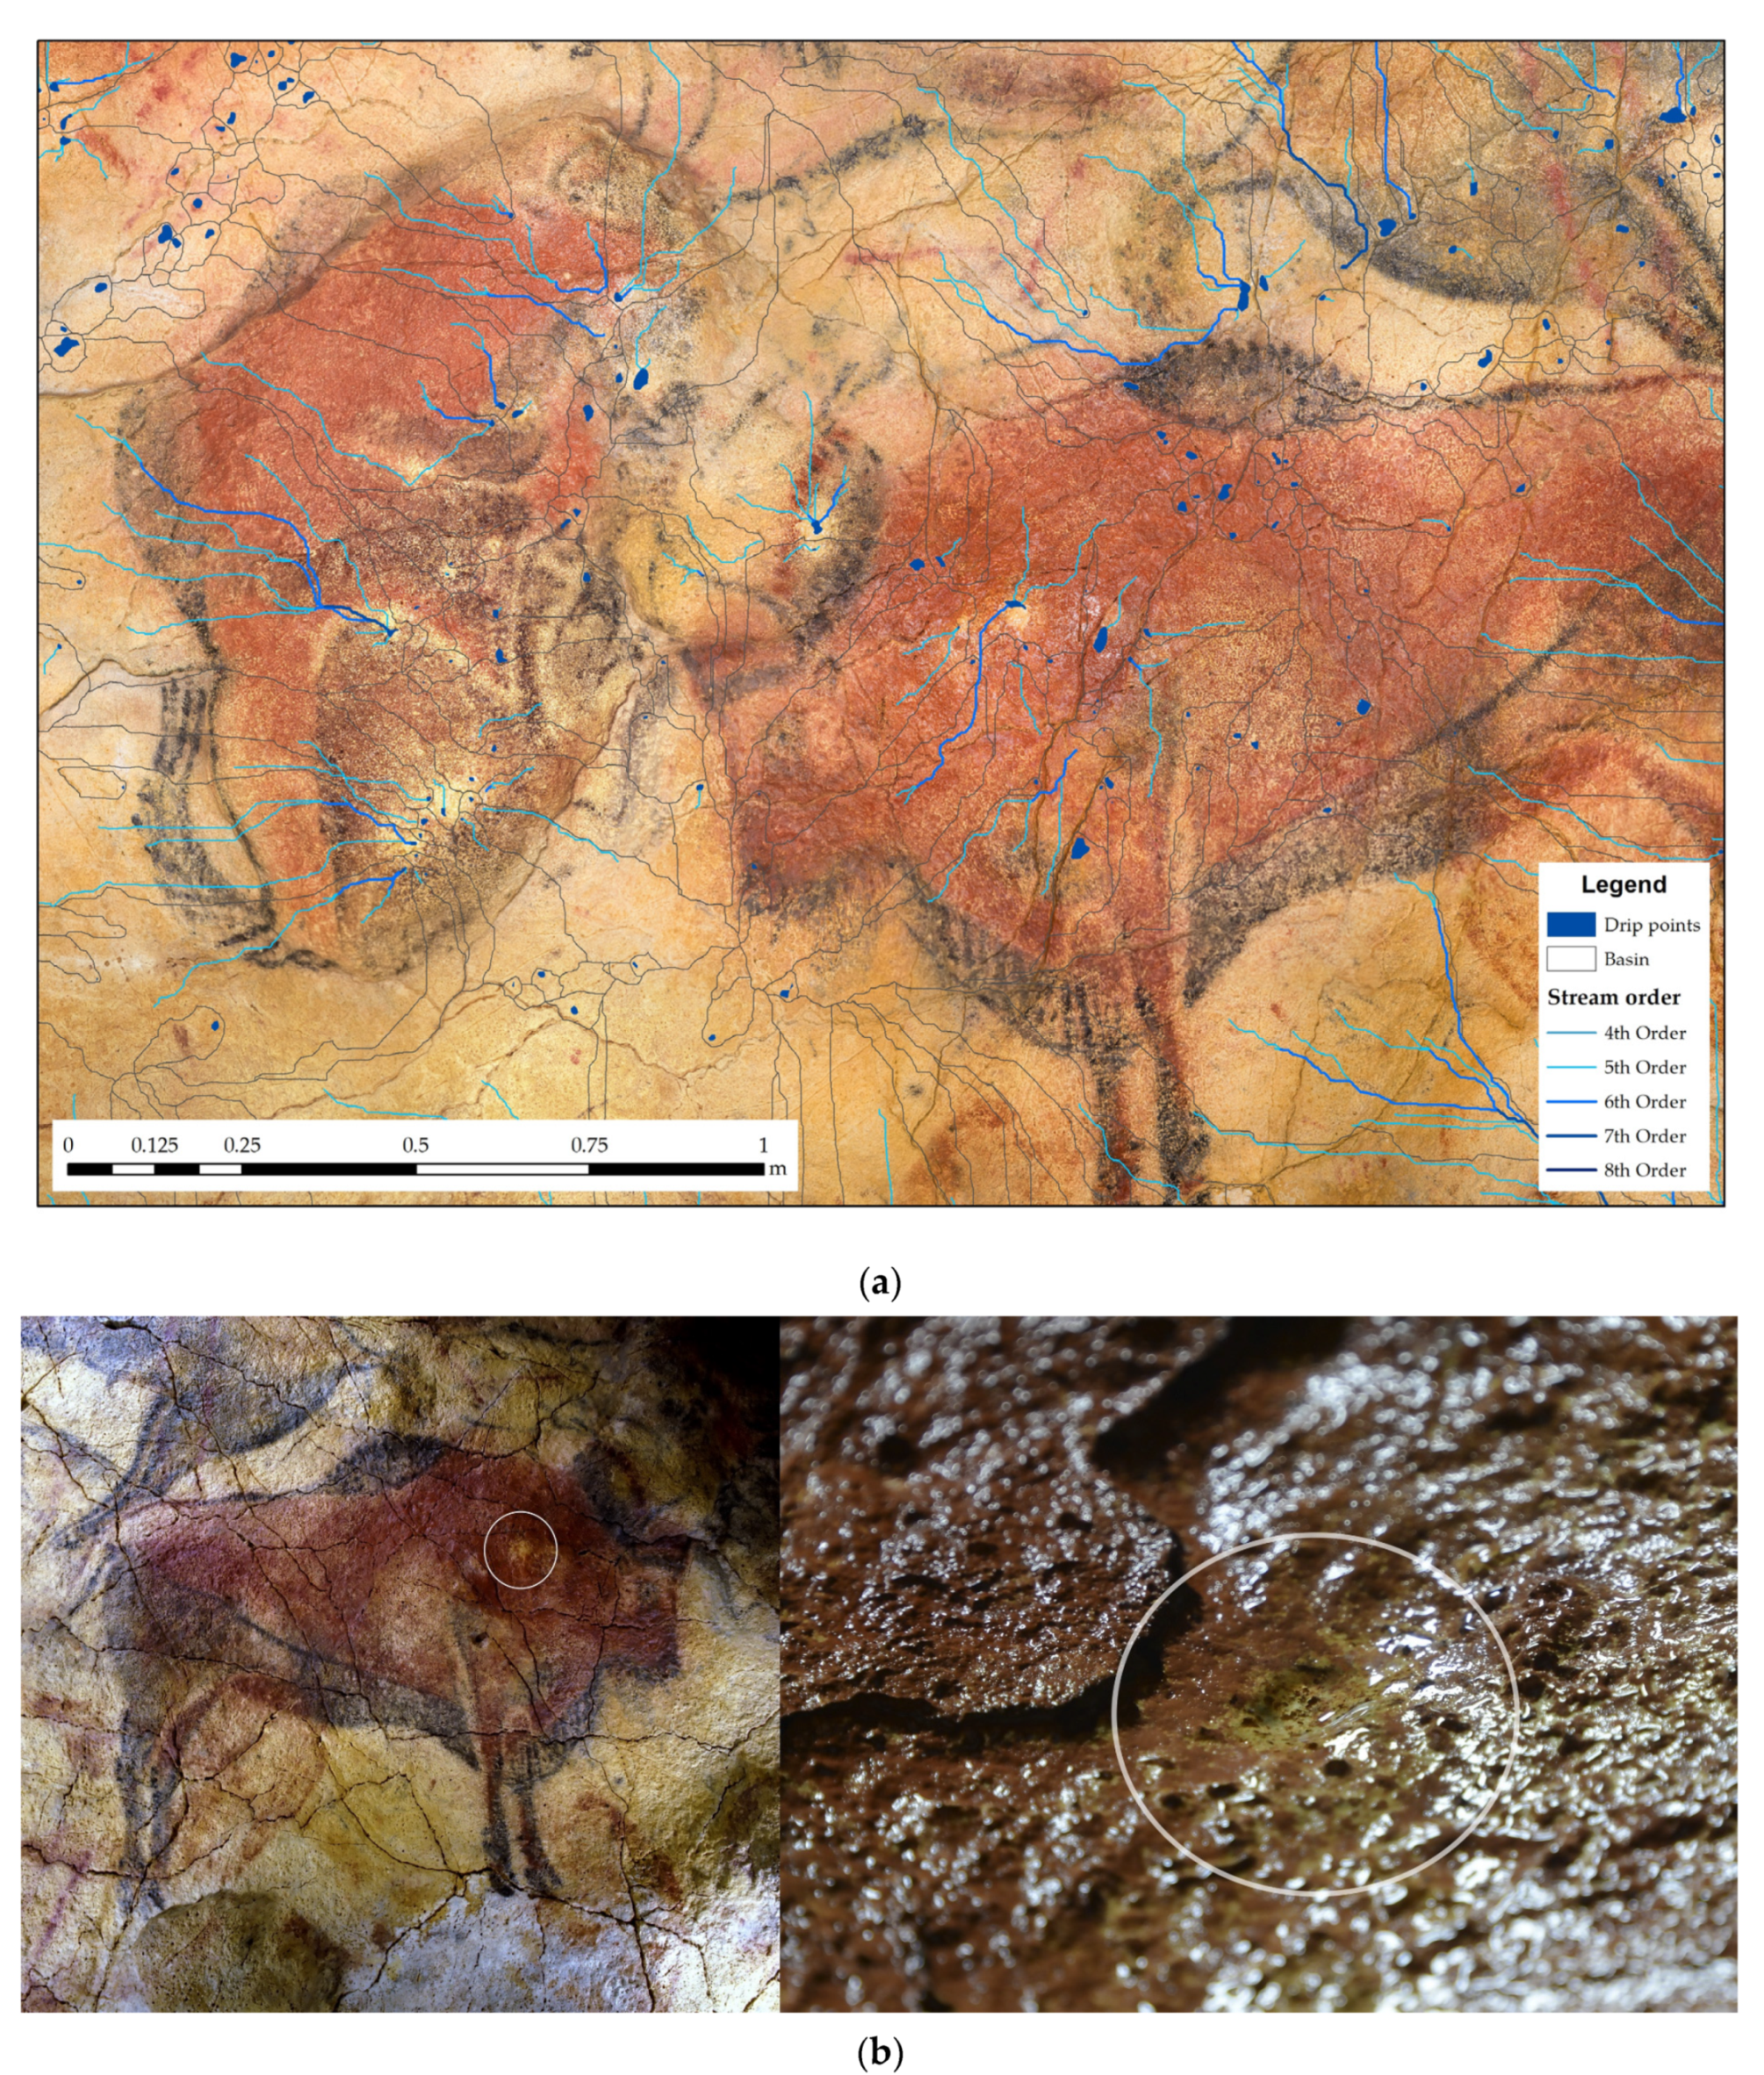
The identification of the precise locations where water droplets will ultimately fall to the cave floor (Figure 5) has significant implications for cave conservation. Understanding the flow paths and points of ingress is important for predicting potential damage and degradation of rock paintings.
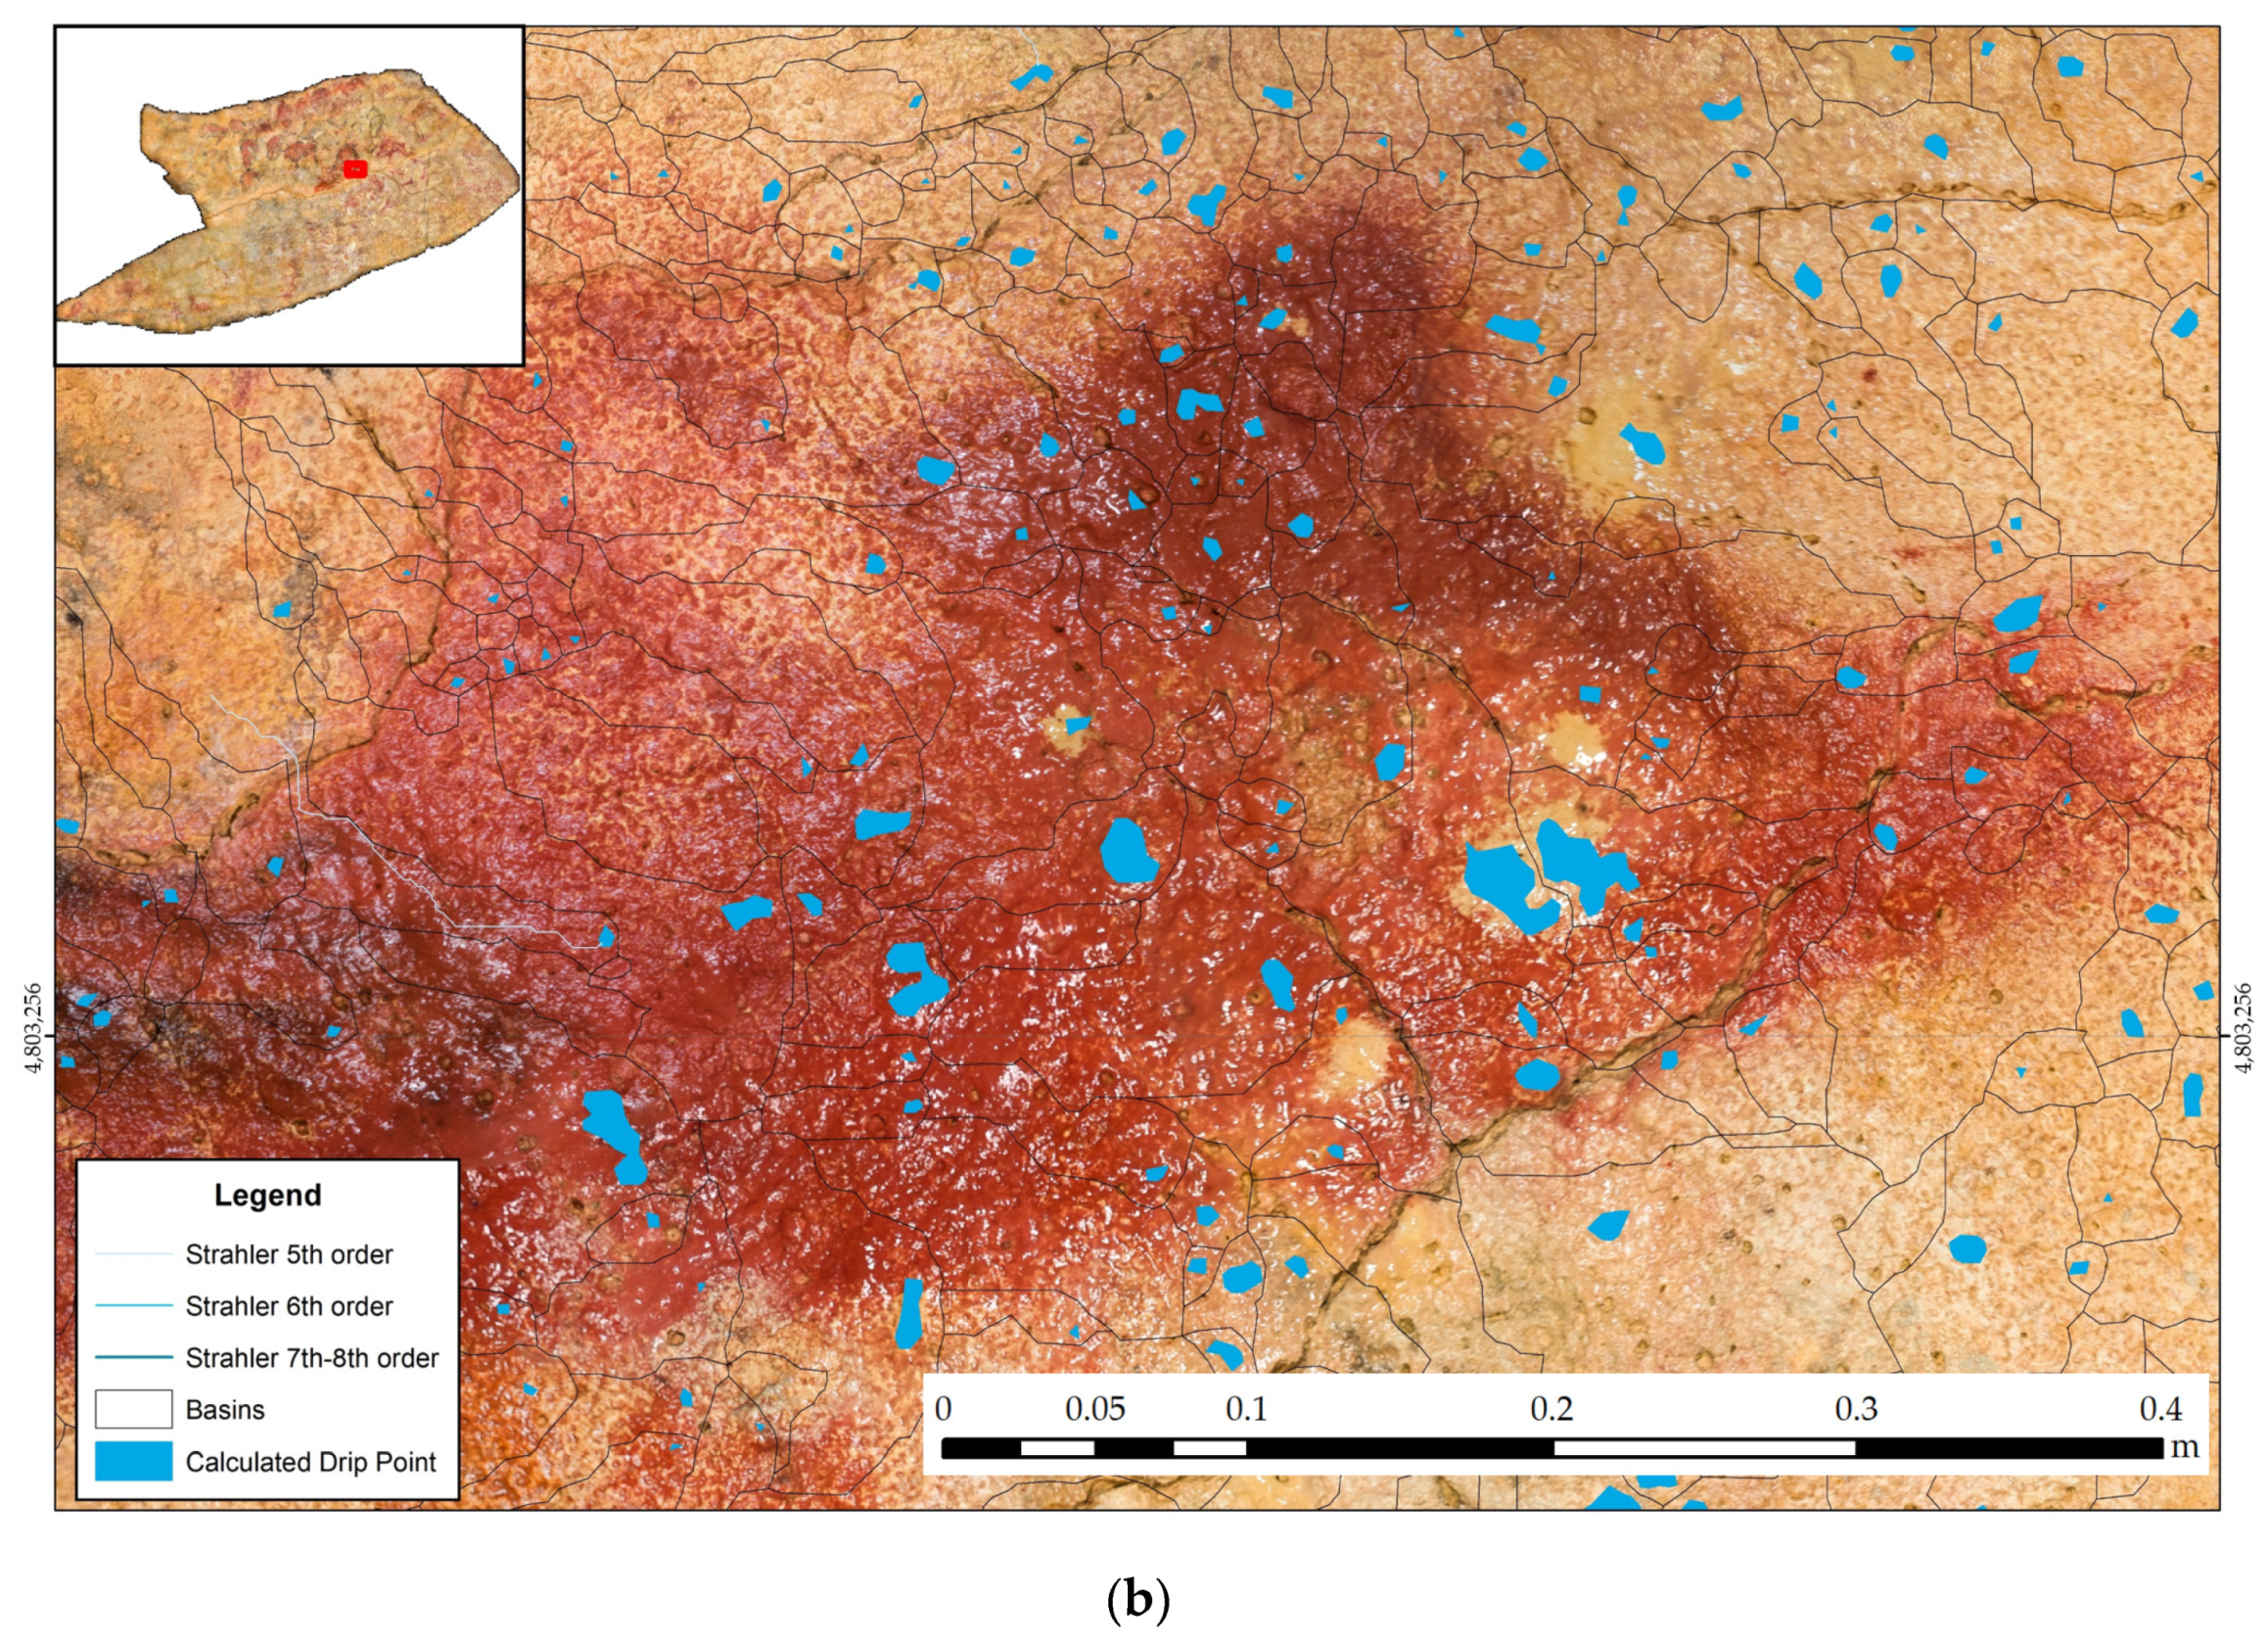
The workflow includes the same calculations as in Section 2.2, stream order analysis, basin delineation, and flow distance accumulation, but it now includes the calculation of the drip points. The identification of drip points is a key aspect of the analysis. Drip points are specific locations within the cave ceiling where accumulated water, driven by surface tension and capillary action, reaches a critical saturation point and eventually drips down to the cave floor. These drip points represent important features to map and understand, as they can have profound implications for rock art deterioration, cave formations, water quality, and ecological dynamics. (Figure 6).
By simulating water movement and saturation levels within the cave’s ceiling, GIS can assist in predicting the precise areas where dripping occurs. Identifying these drip points is vital not only for geological and hydrological research but also for conservation efforts. It allows for the monitoring of potential erosion or the growth of calcifications, stalactites, and stalagmites, as well as the study of how water chemistry and nutrients are transported to the cave floor, influencing the unique ecosystems that often exist within caves.

3. Results

3.1. Results of the Hydrology of the Polychrome Overlying Layer

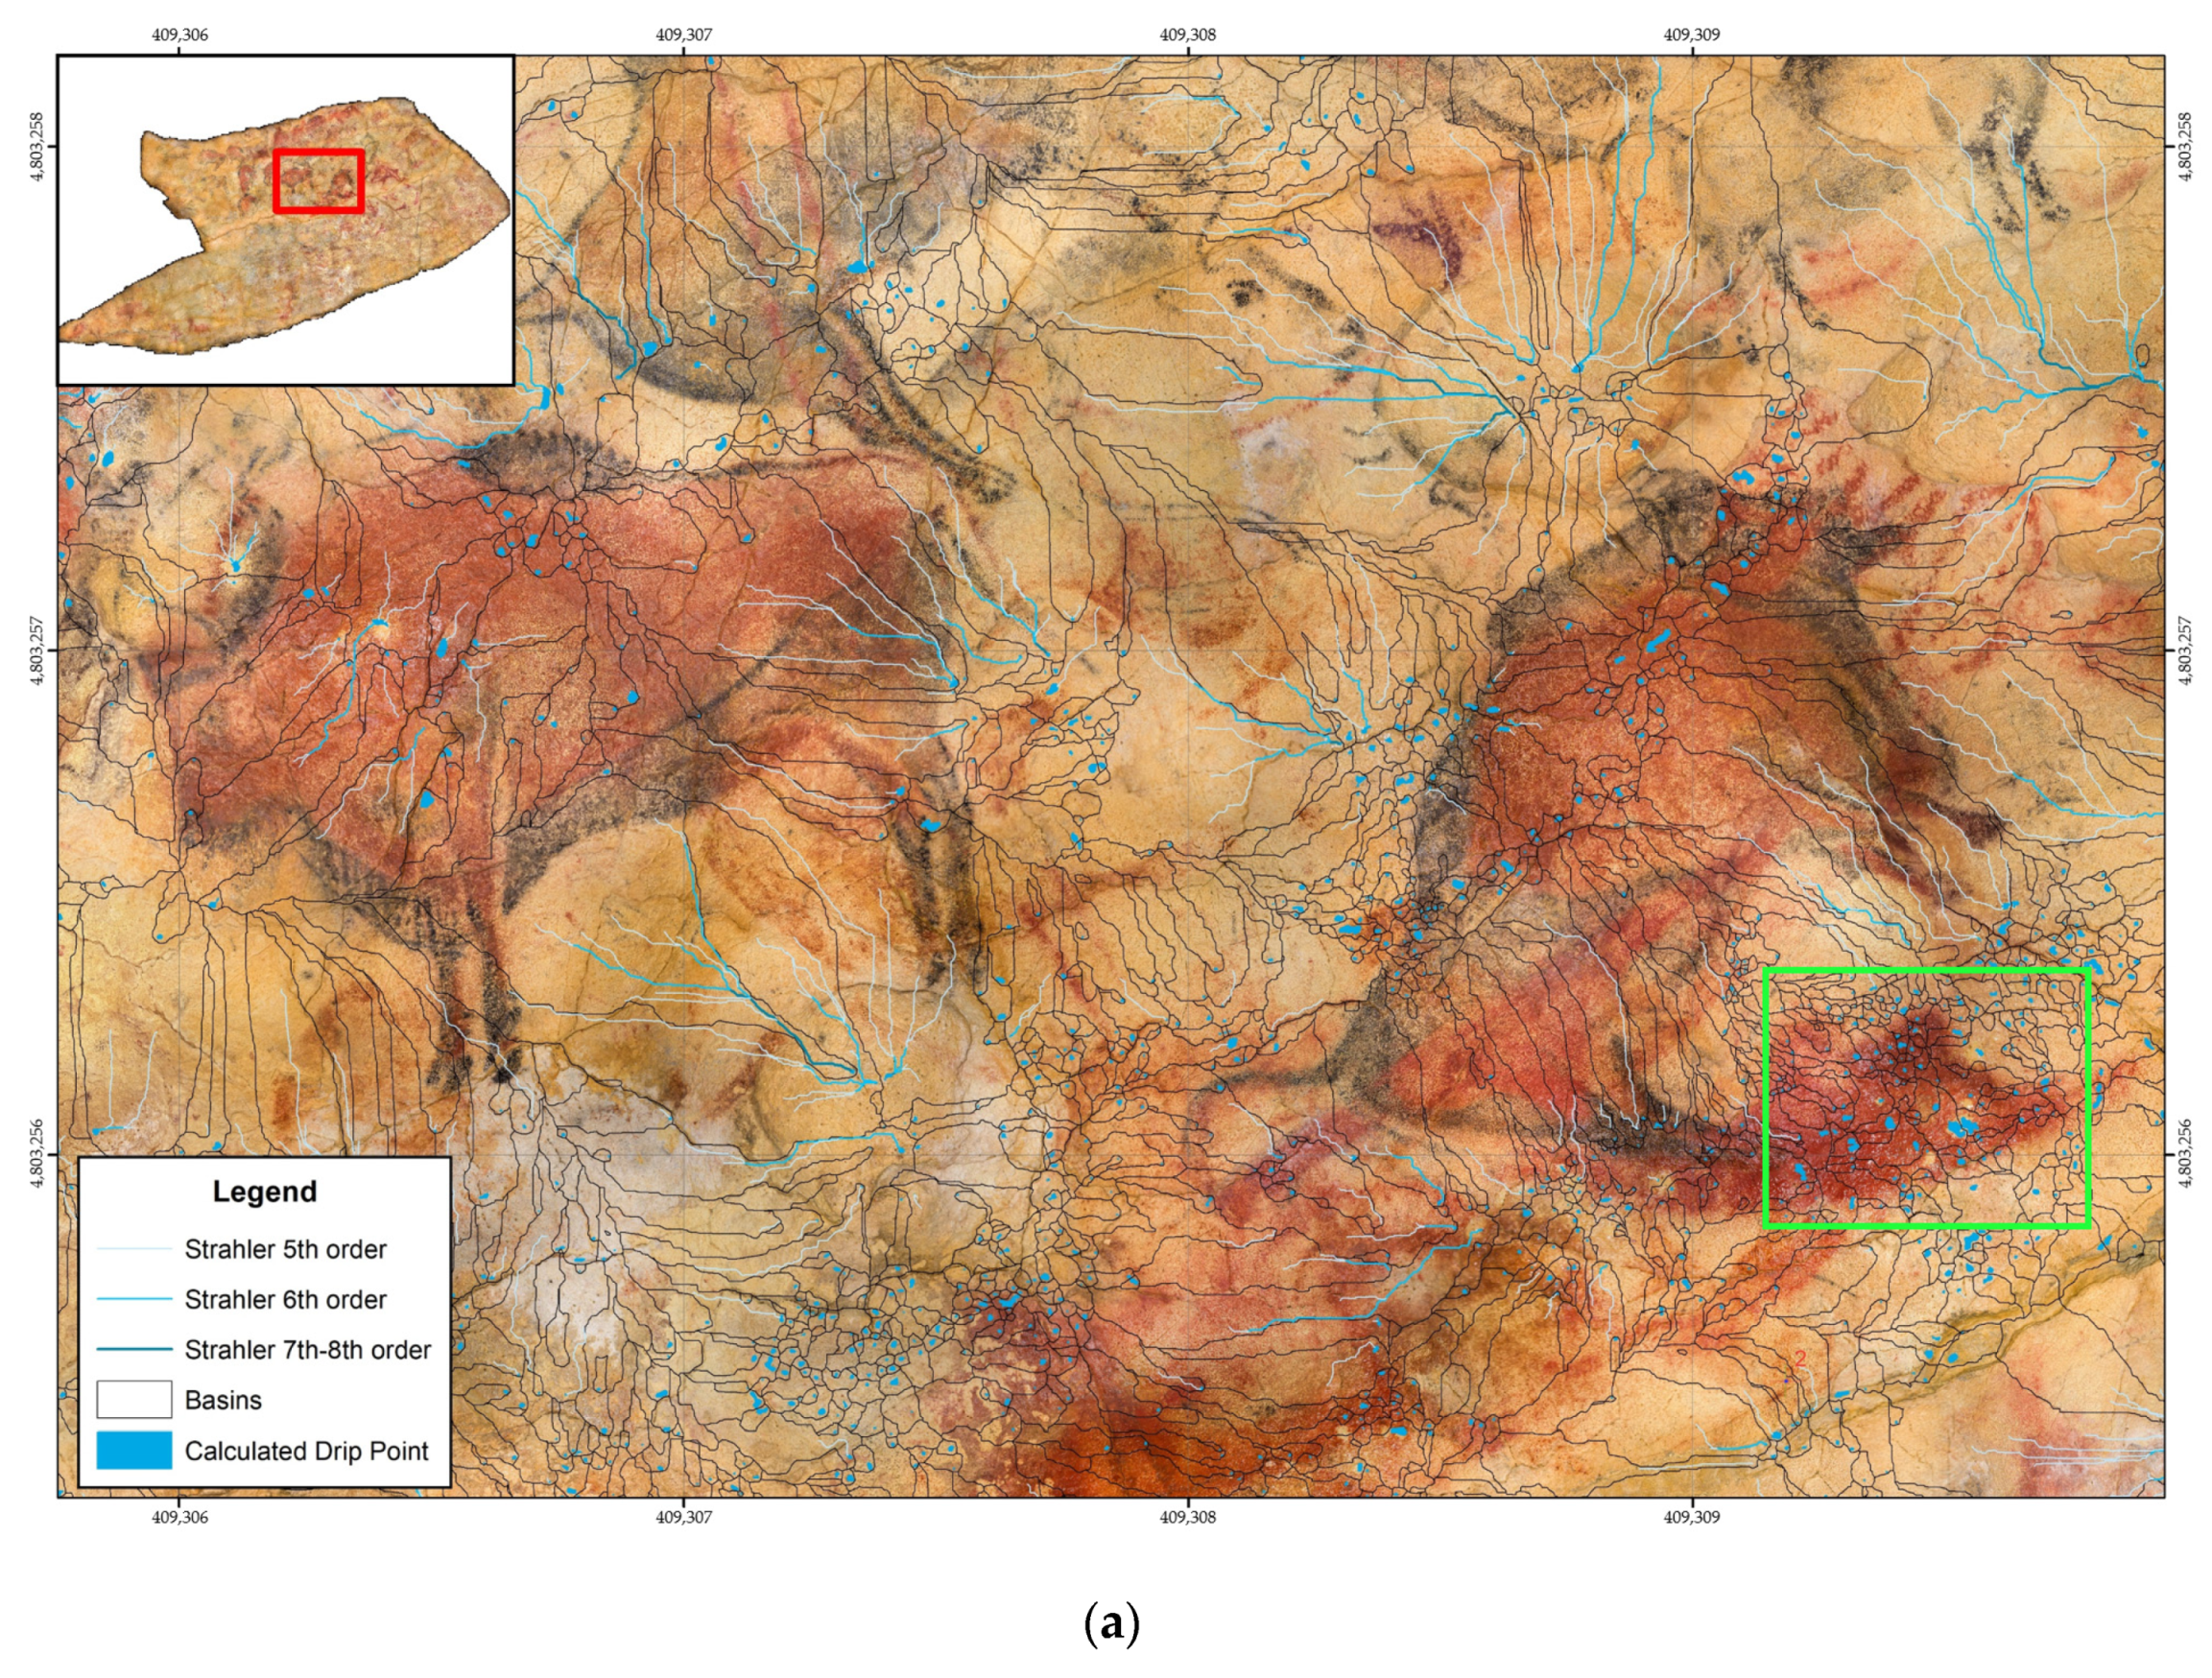
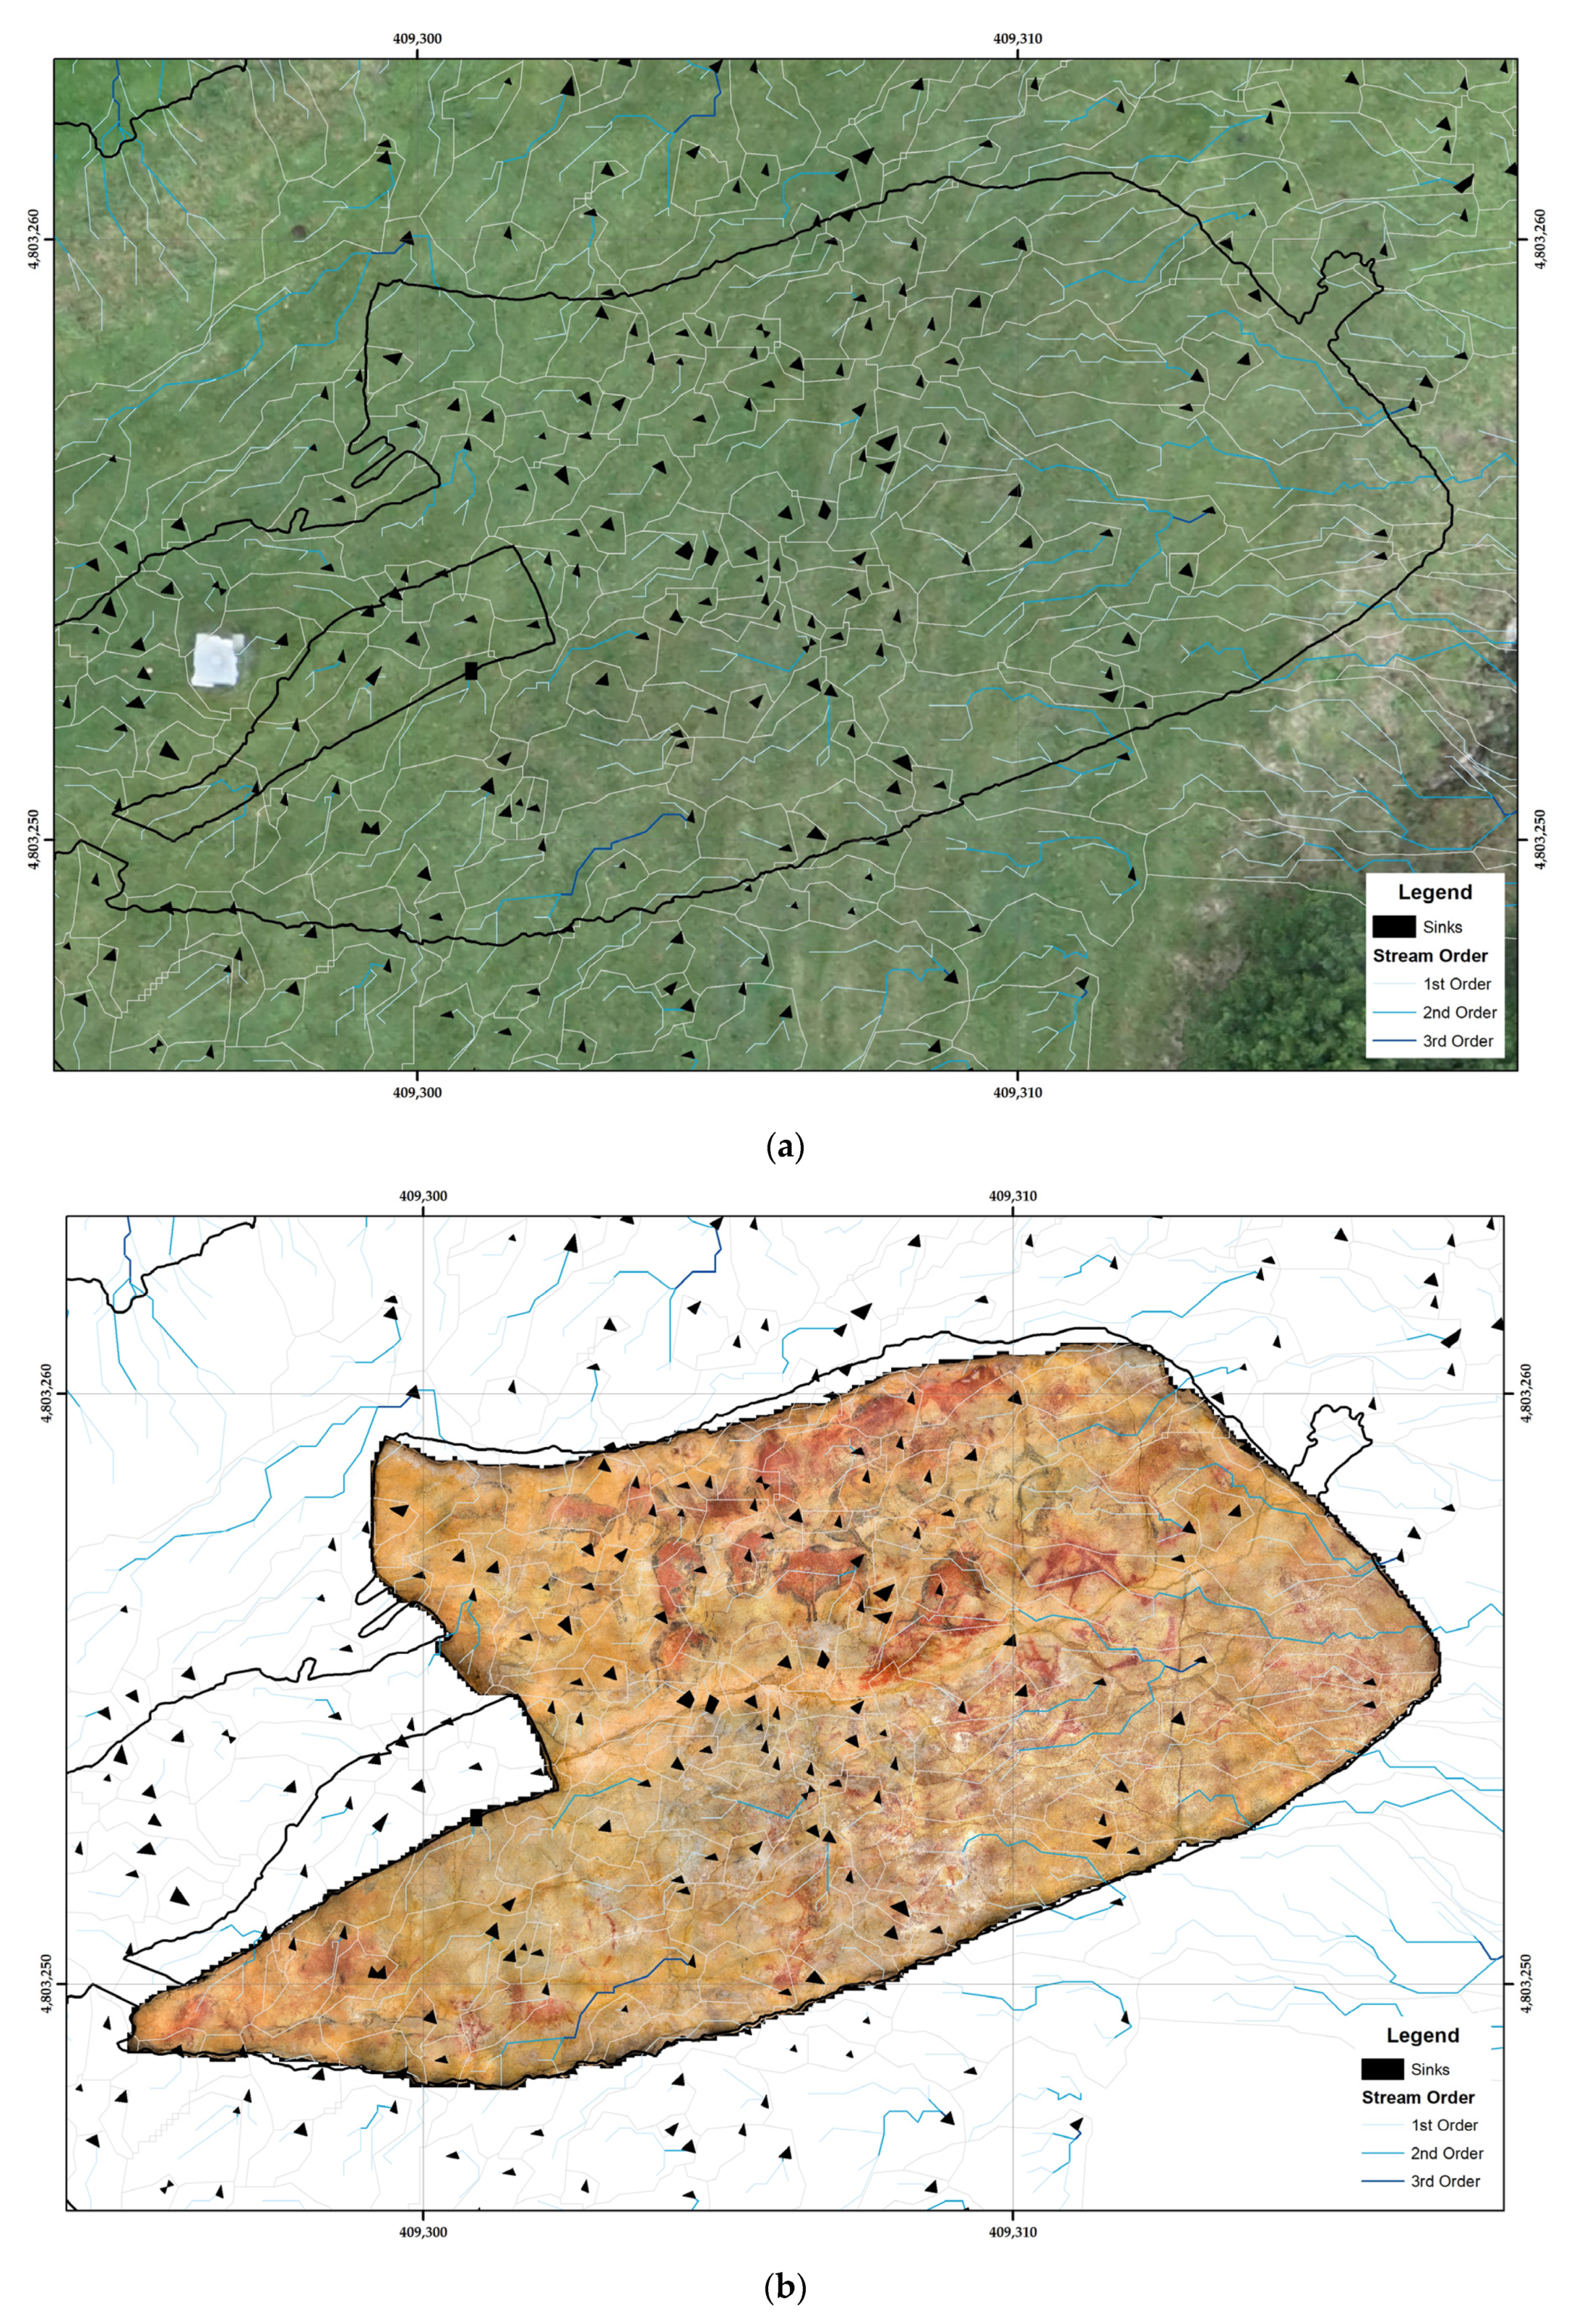
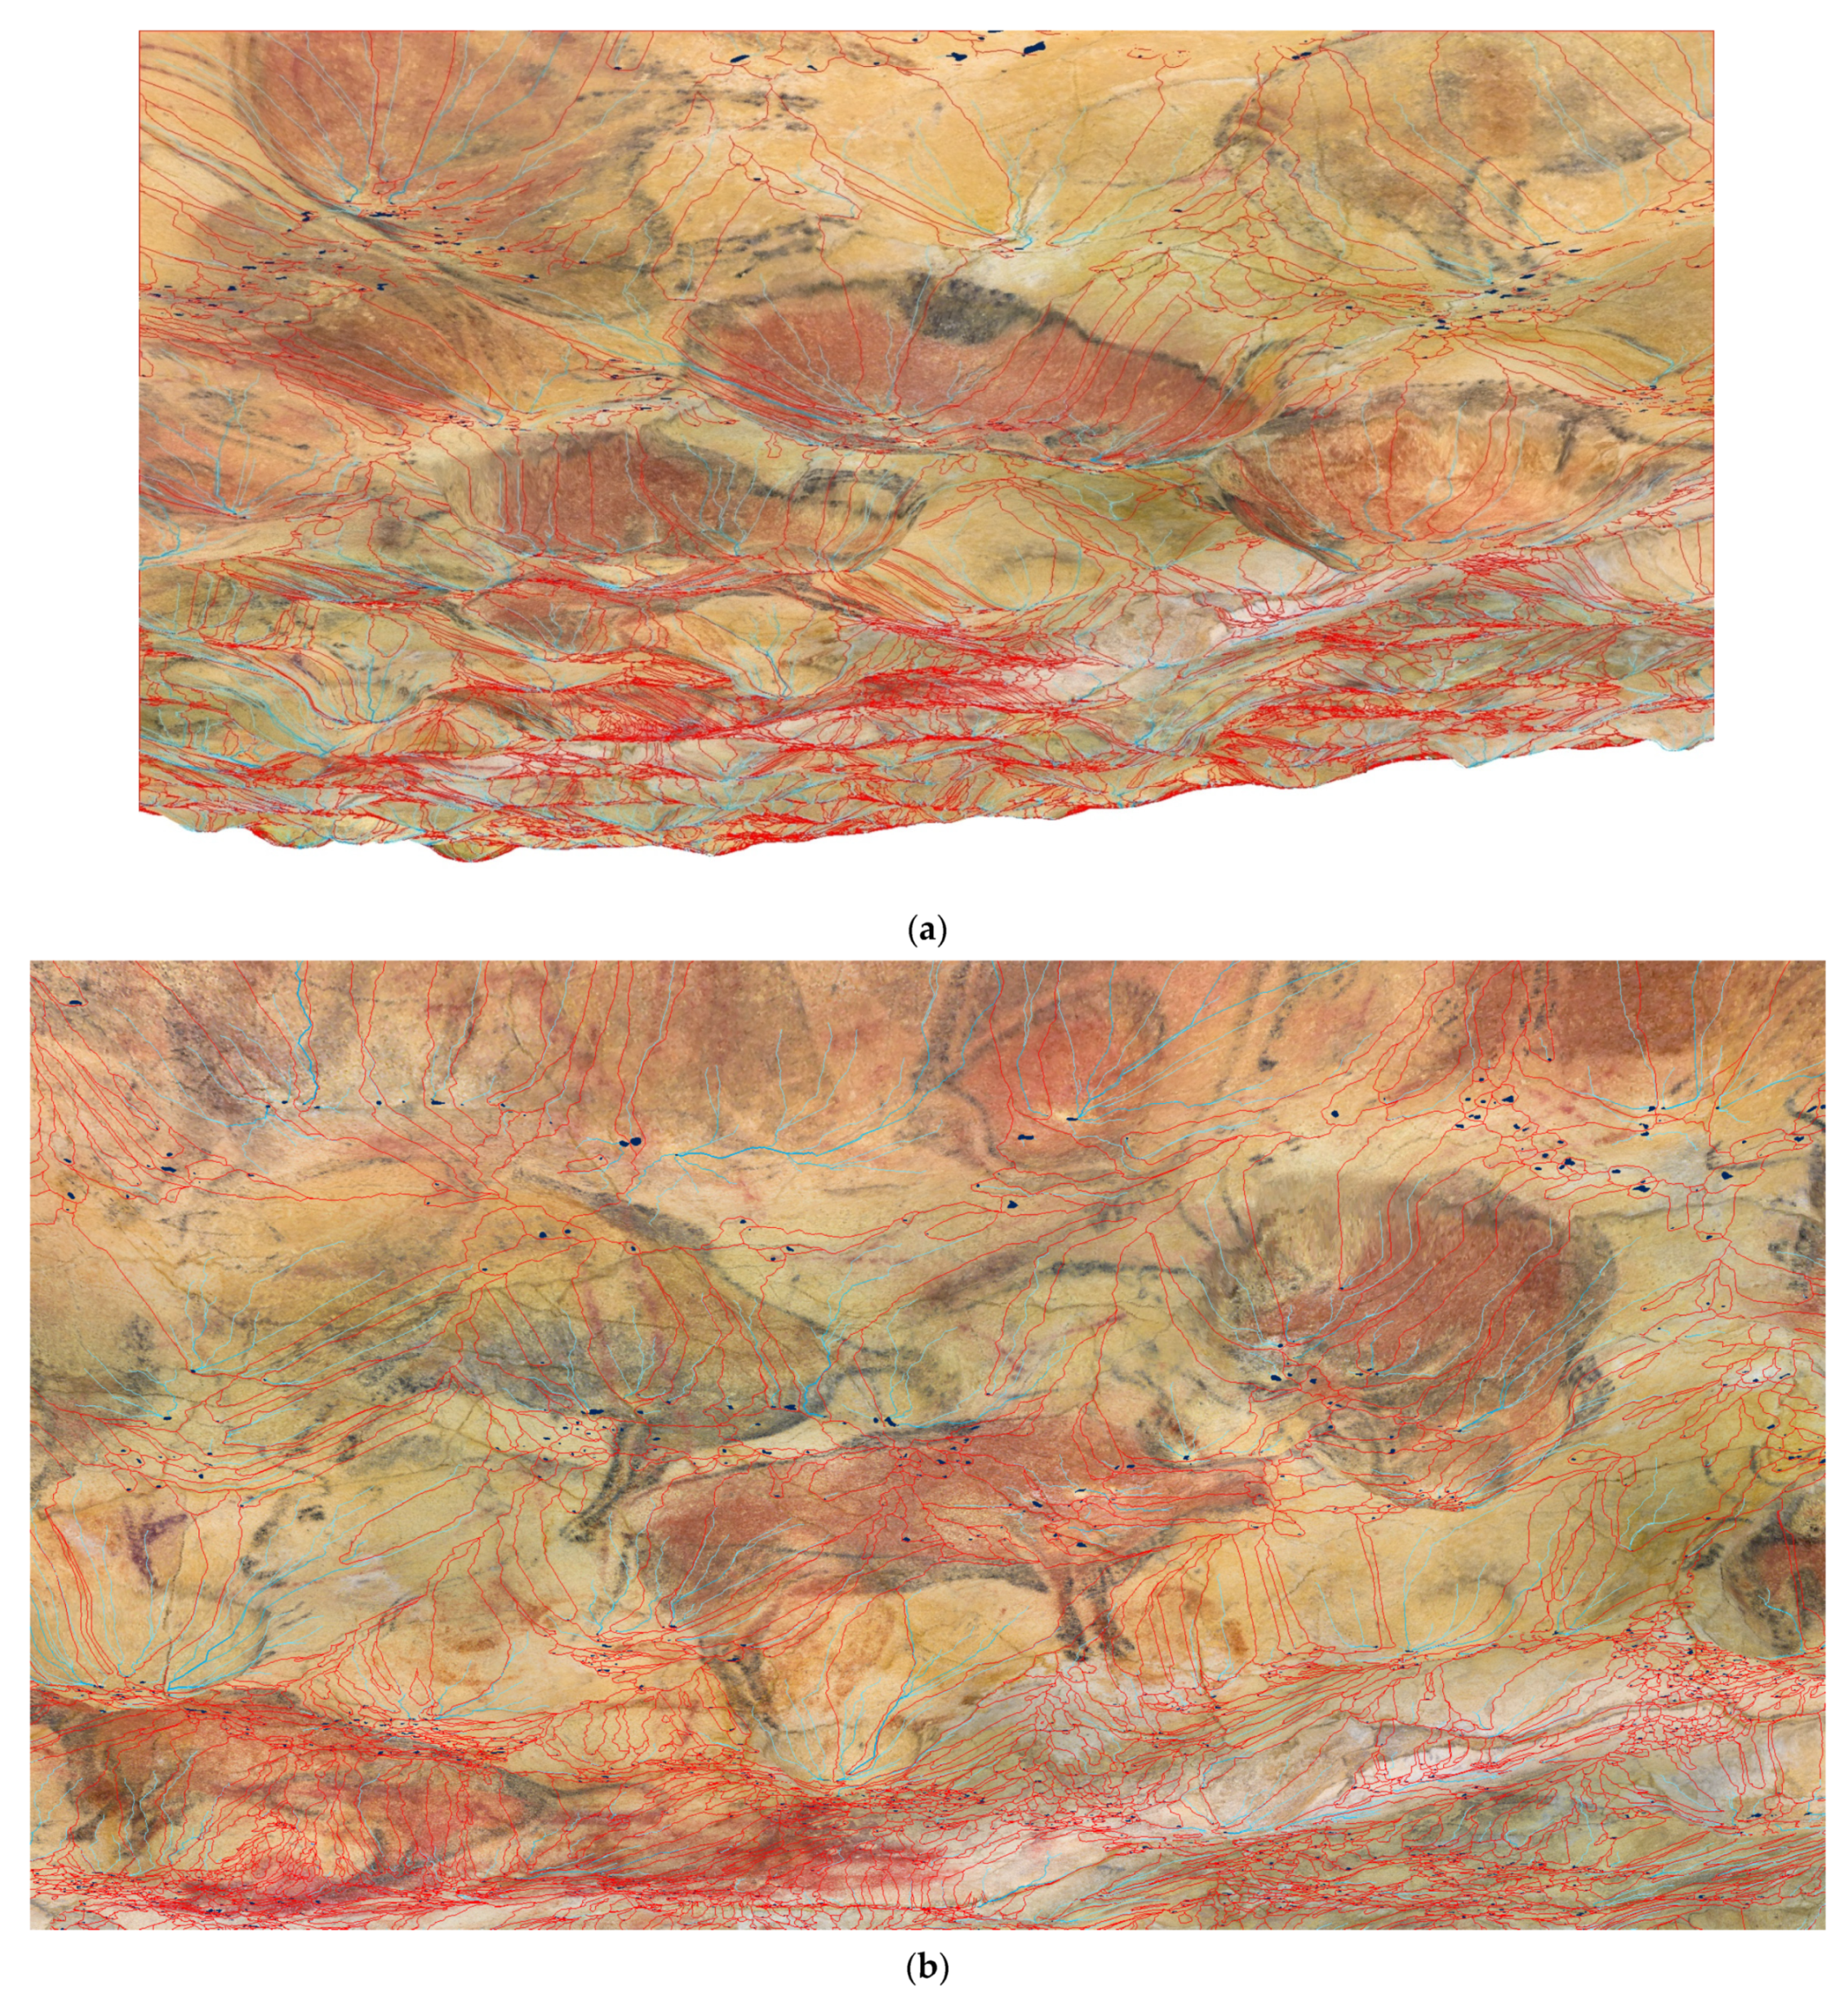
The study of the deterioration processes that, due to infiltration water, are directly associated with fractures or diaphragms in a cave such as Altamira requires the use of techniques such as the following. The initial step involves a comprehensive geological assessment of the fractured overlying layer, accurately mapping potential sinks, streams, and basins. By utilizing QGIS [59] software, a high-resolution photogrammetric flight with a pixel size as fine as 2 cm has been used to make the calculations. This detailed imagery enables the calculation of sinks, streams, and contribution basins, providing a precise understanding of the surface area each basin encompasses (Figure 7).
Following the geospatial assessment, the obtained data are superimposed with the orthoimage of the Polychrome Hall (Figure 7b). This overlay allows for a nuanced examination, identifying sinks that correlate with surfaces affected by pigment migration and wash-out processes, distinguishing currently active sinks, and projecting potential future active sinks. This approach, combined with the systematic monitoring and follow-up to which we subject the affected areas with active dripping points of the Polychromes ceiling, puts us in a position to intuit the behavior of the water, pre-dictating and consequently anticipating possible damage to the paintwork.
The application of GIS and photogrammetric technology not only offers a comprehensive view of the cave overlying layer but also provides a powerful tool for ongoing conservation efforts [88,89,90,91,92]. The curators obtain valuable information on the possible fractures and fissures directly involved with the processes of paint wash-out located within each of the documented basins.

3.2. Results of the GPR Overlying Layer: Attributes

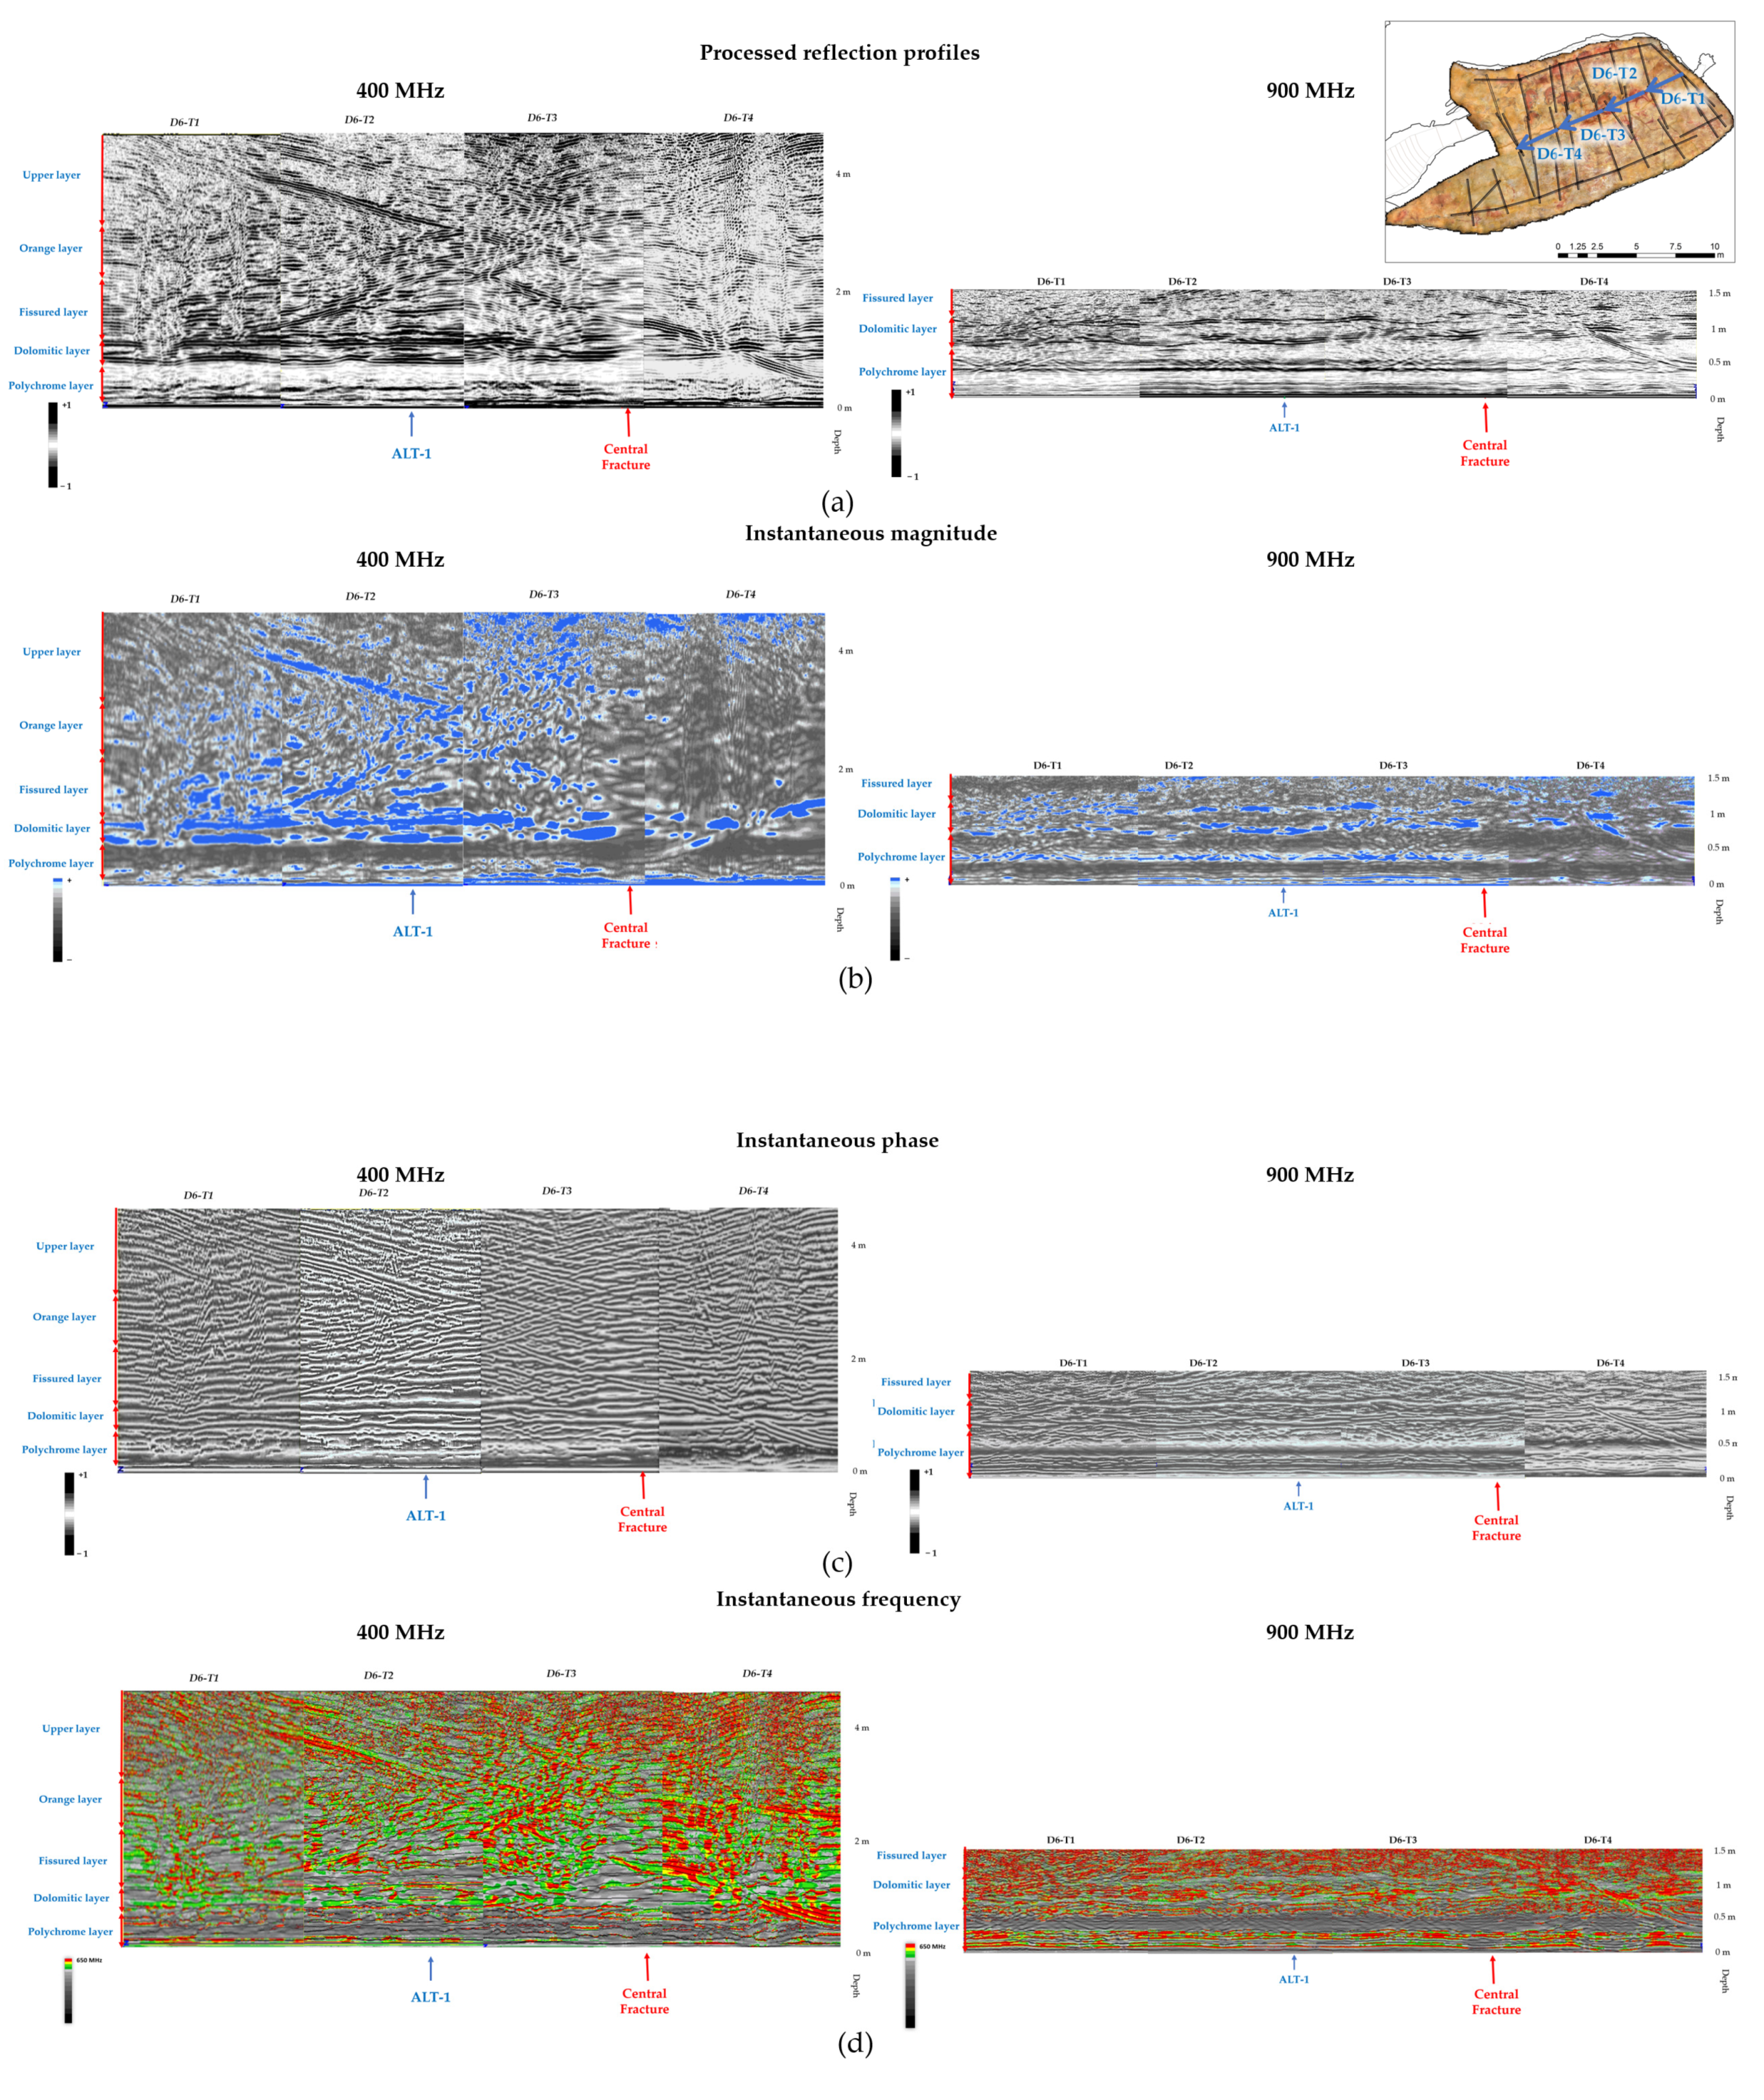
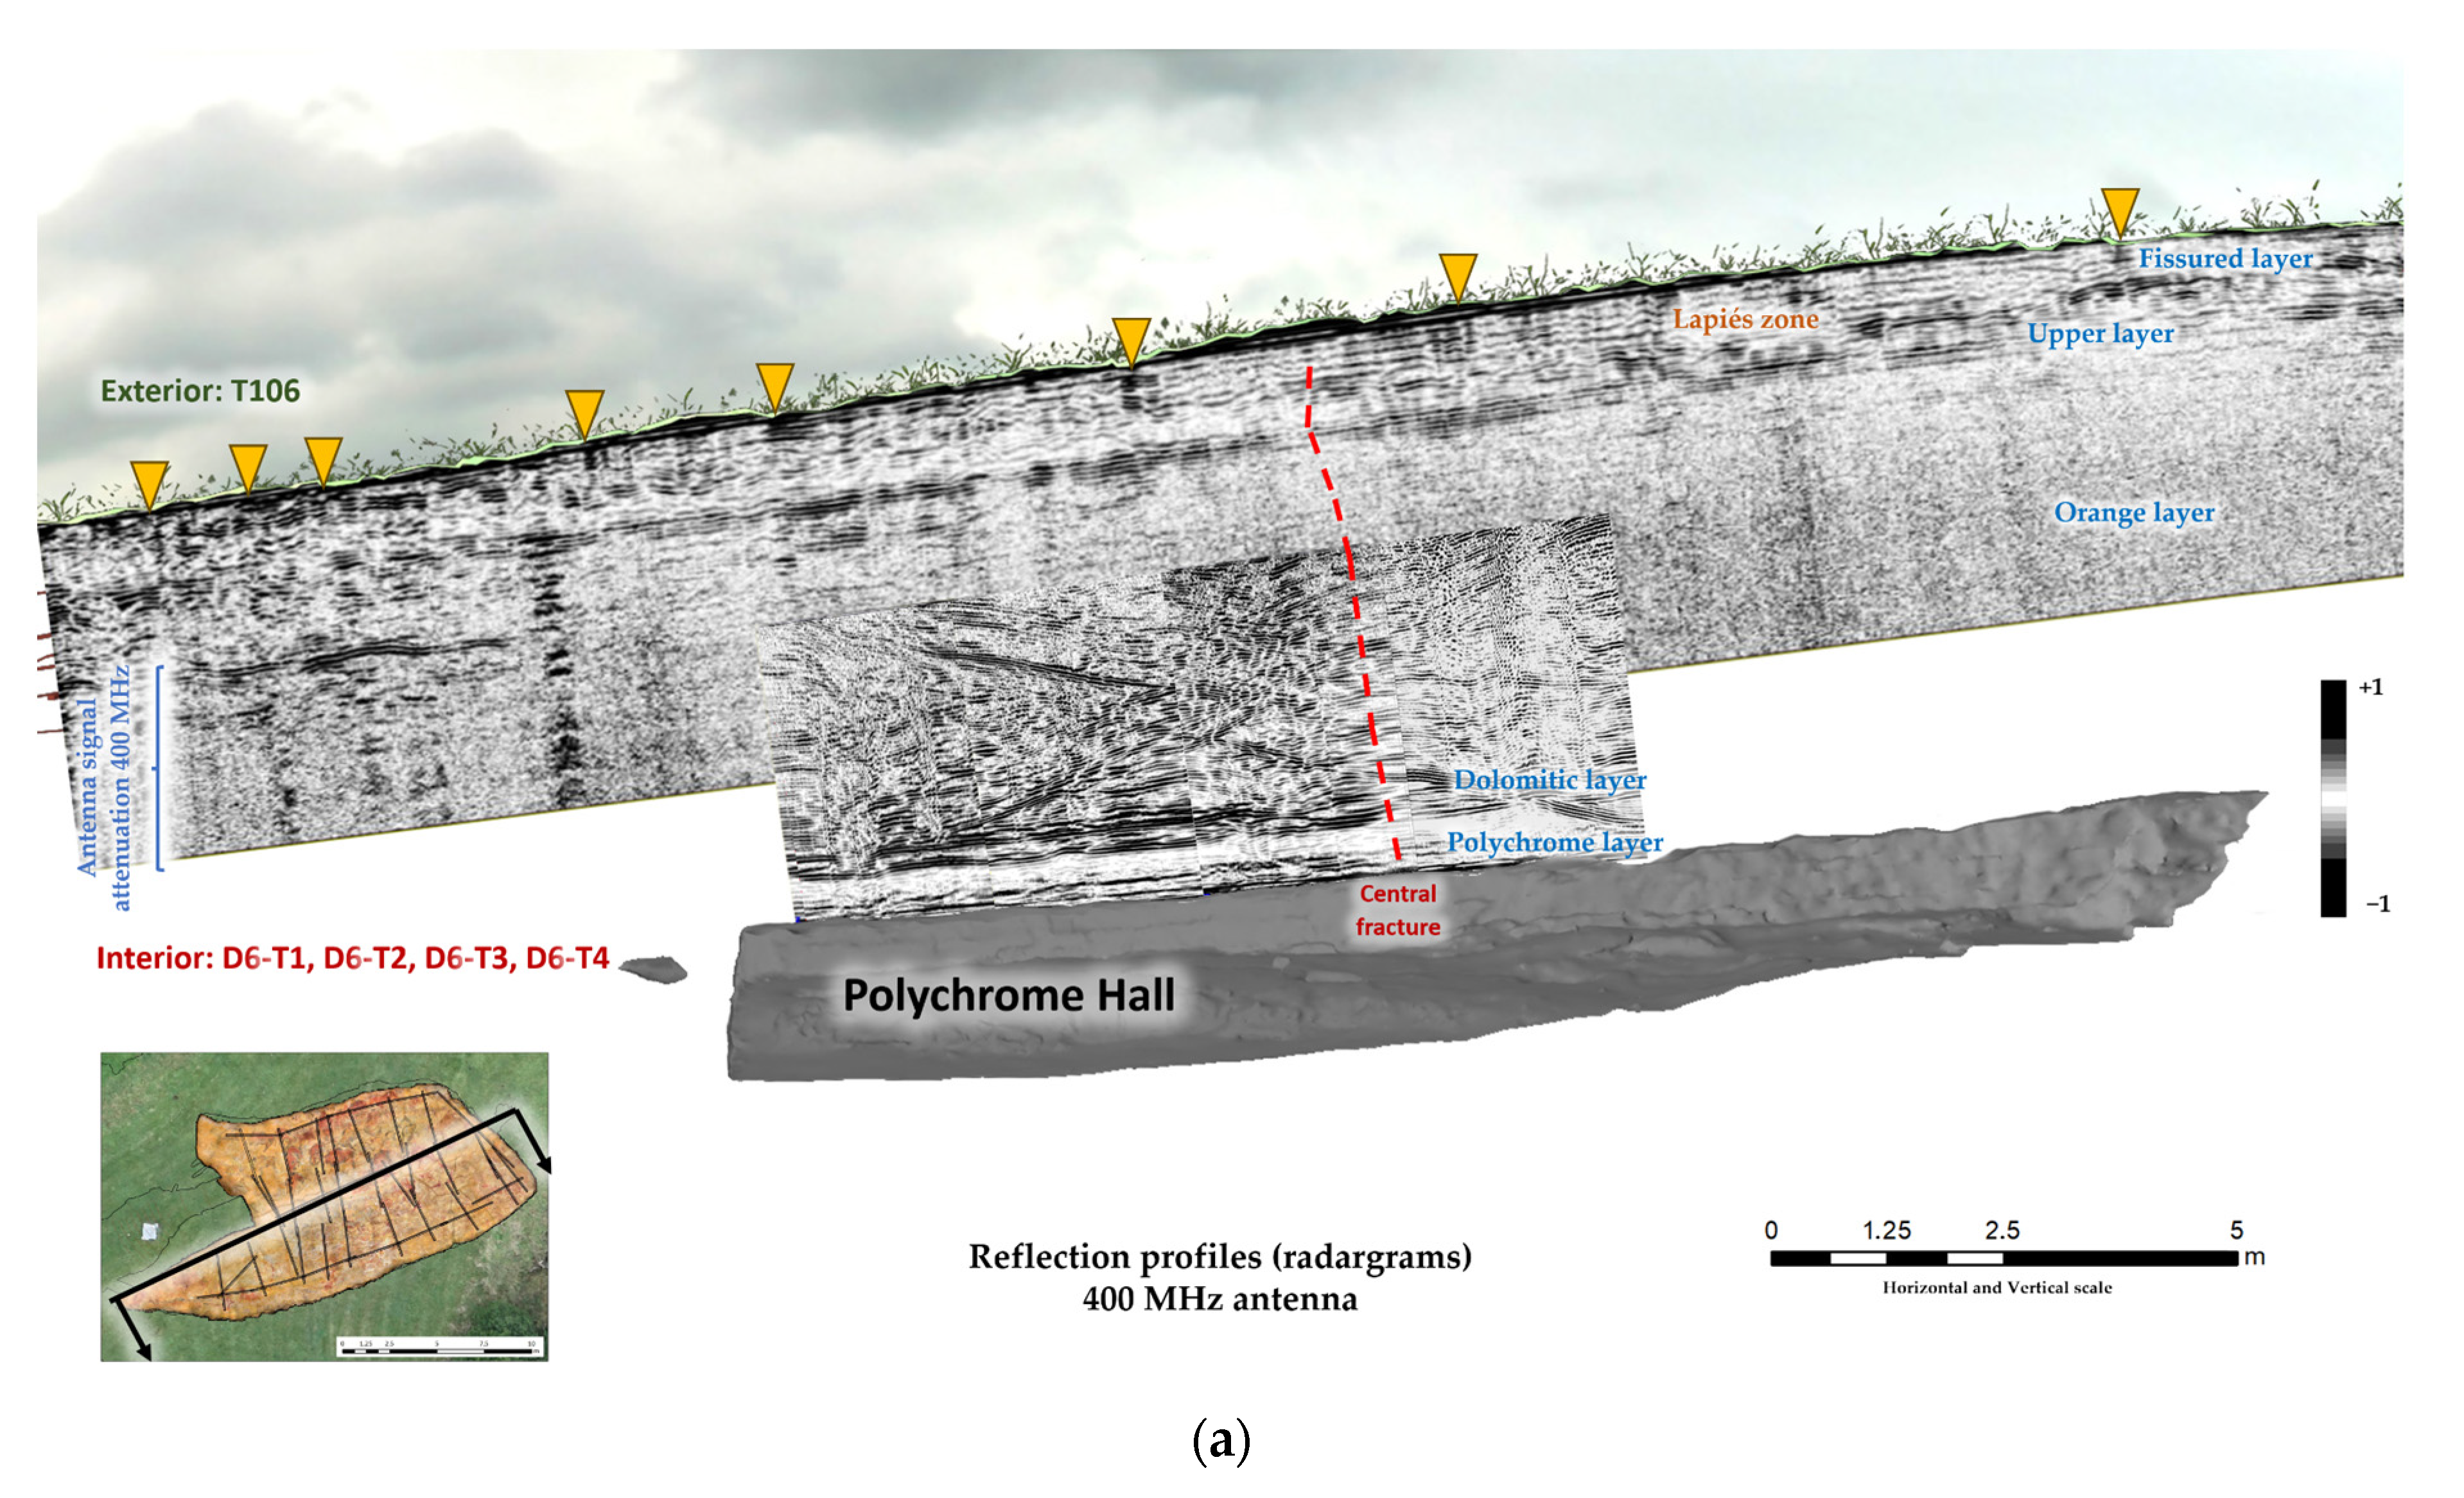
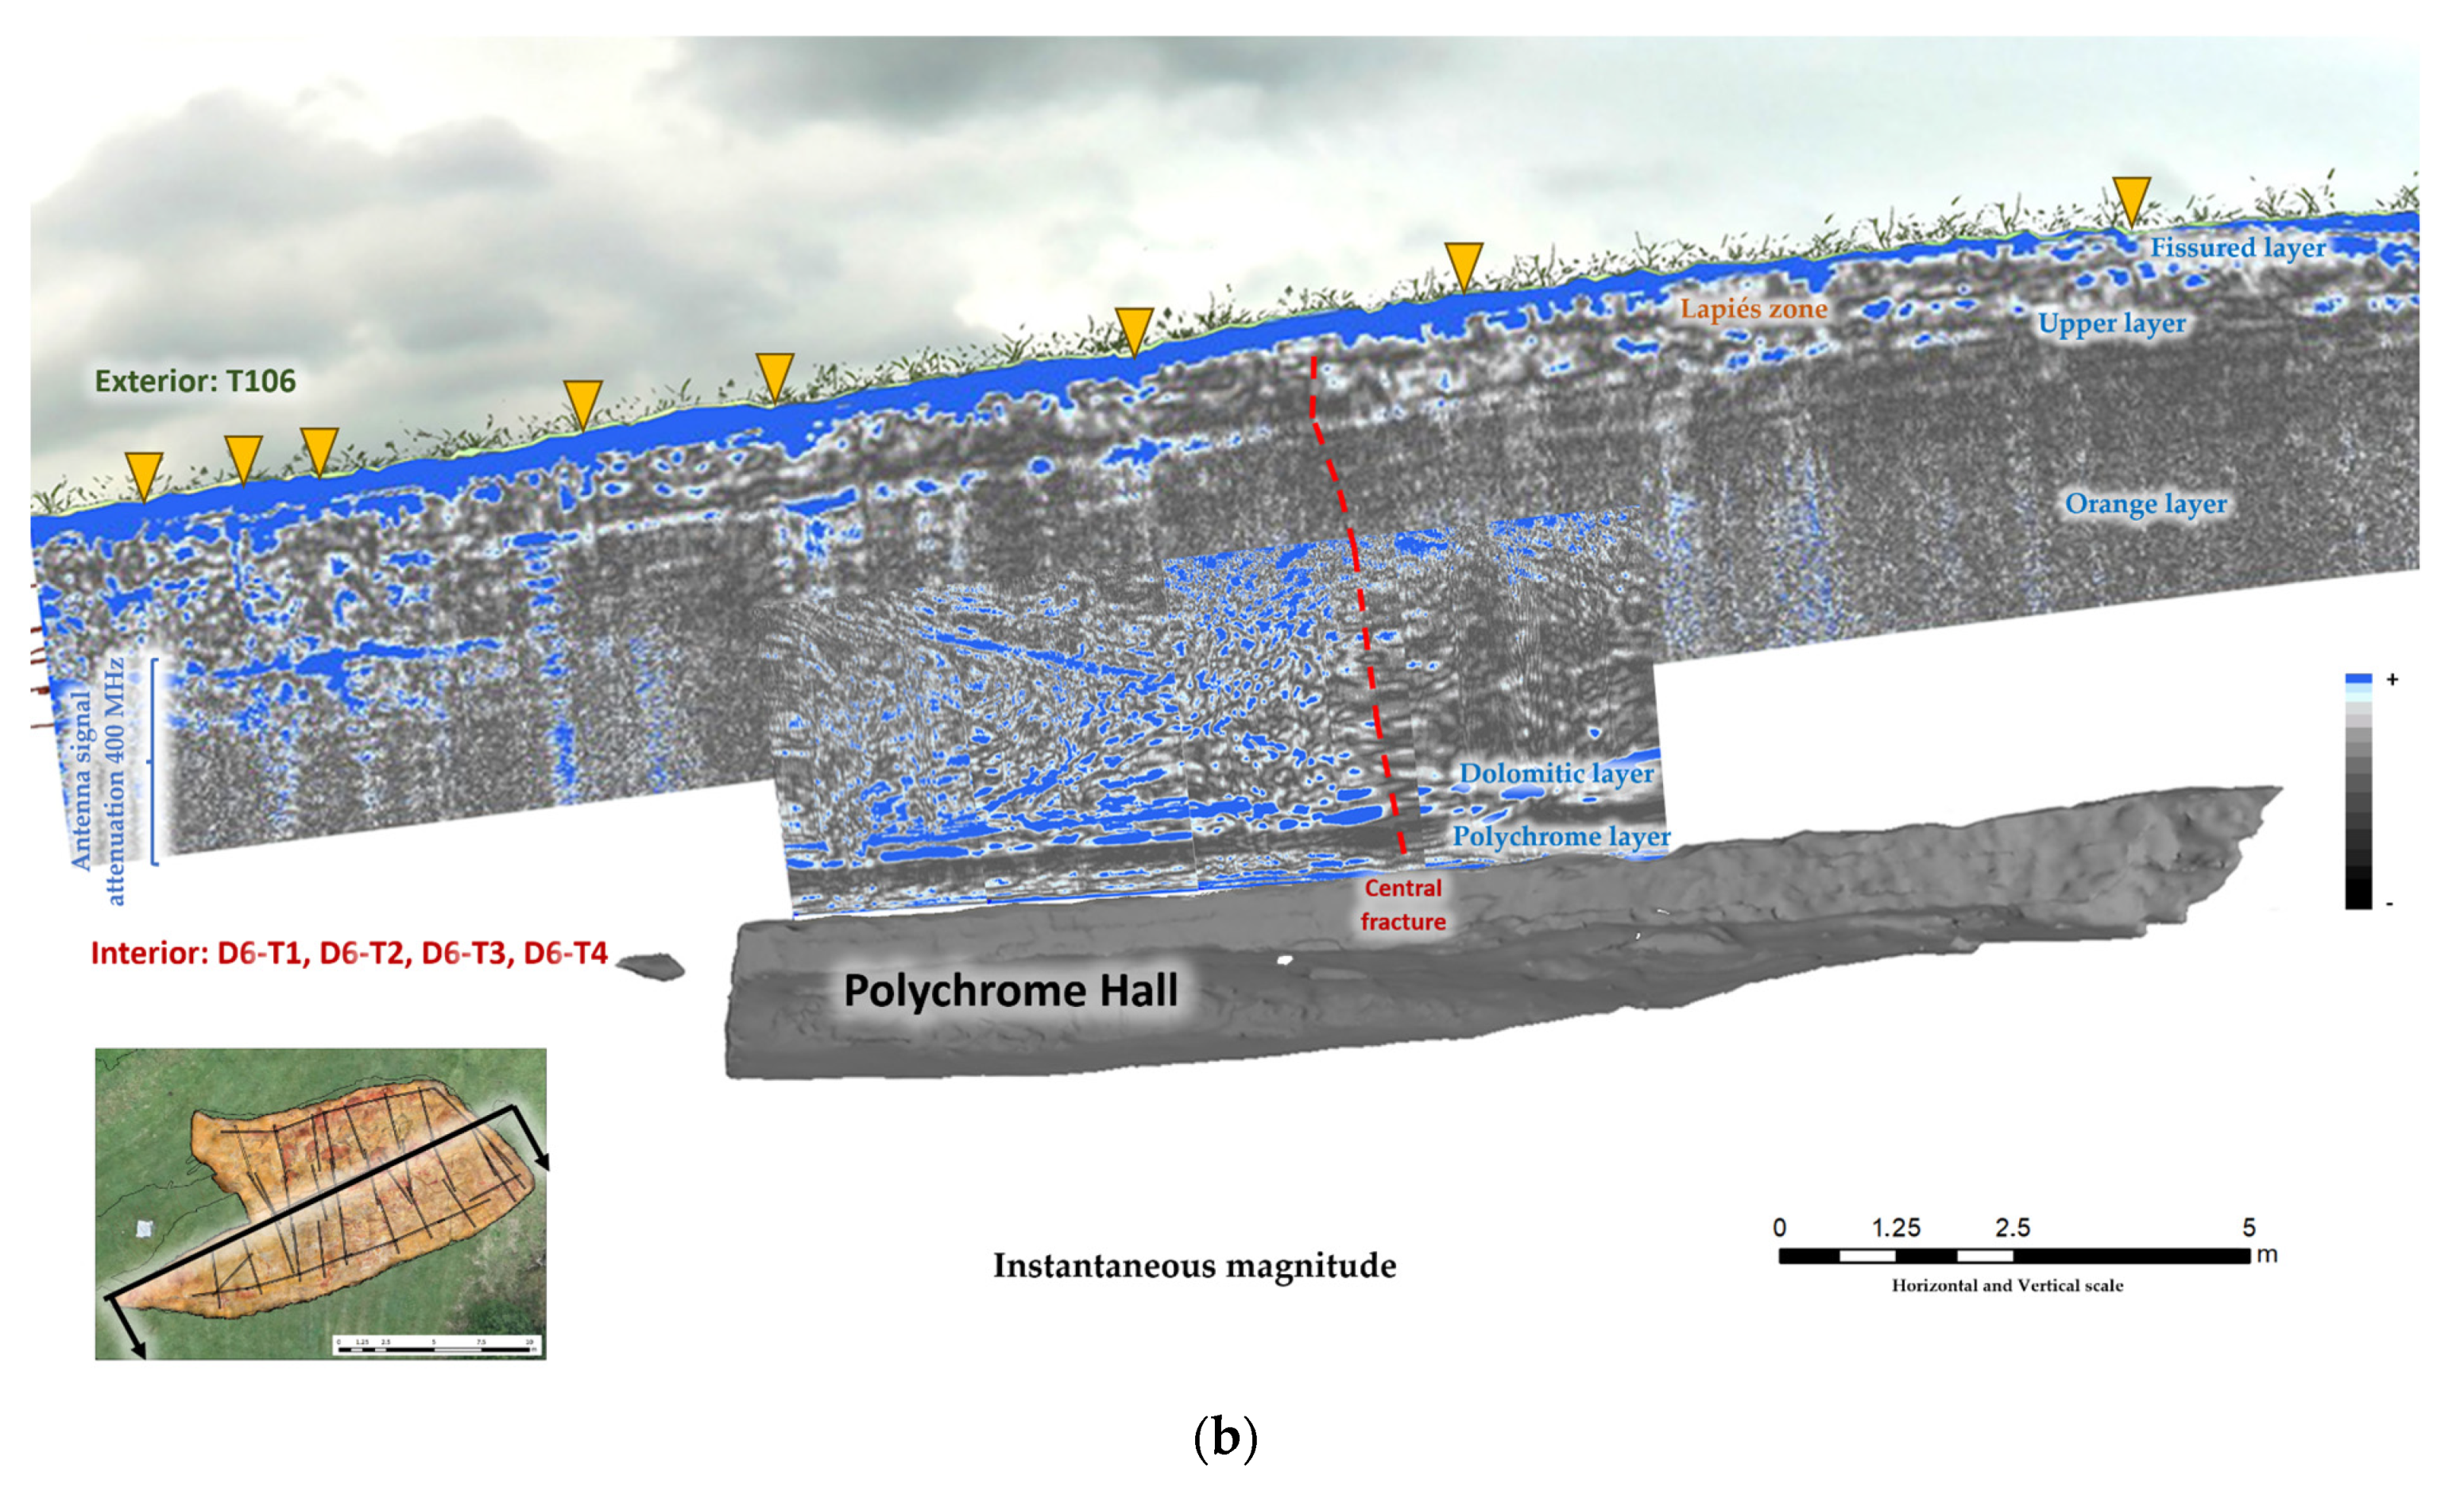
GPR instantaneous attributes have been applied as a robust and intuitive tool to complement and enhance the information obtained from karst structure with standard processing and interpretation of GPR reflection profiles recorded using the 400 MHz and 900 MHz antennas (Figure 8). The use of instantaneous magnitude, phase, and frequency attributes has facilitated the characterization of the main moisture/water zones within the overlying layer of the Polychrome Hall. The instantaneous magnitude attribute display is useful to show the raw energy reflected by an area, interface, or layer. The karst structure of the overlying layer has a significant moisture/water content, being an influential factor for the dielectric permittivity values of its carbonate rocks since the dielectric permittivity of water (81) is much higher than that of any other geological material (3–40). According to expression (3), high-amplitude radar reflections are also generated at the interfaces of water-affected (wetter) subsurface areas with respect to the surrounding carbonate rocks of lower dielectric permittivity (drier). As shown in Figure 8a, the highest amplitude radar reflections recorded have occurred within the same carbonate layer or at interfaces with considerably contrasting electromagnetic properties due to the presence of moisture/water zones. This instantaneous magnitude attribute has enabled the detection of preferential moisture/water flows or pathways at the time of GPR data acquisition. It also provides a better indication of their boundary characteristics and dimensions (Figure 8b). The instantaneous phase information has allowed us to improve the visualization of the discontinuities detected in the Polychrome Hall’s overlying layer detected in the radar records. This attribute is most strongly affected by significant changes in dielectric permittivity due to the presence of moisture/water in this karst structure. These changes involve electromagnetic impedance contrast. The instantaneous phase attribute has been used to follow the continuity of the reflectors/discontinuities recorded in areas of the overlying layer where attenuation of the electromagnetic signal occurs (Figure 8c). The instantaneous frequency attribute shows how the radar signal is being filtered out by the carbonate rocks in the overlying layer of the Polychrome Hall (Figure 8d). The instantaneous frequency attribute shows the existence of zones with a smaller decrease in the high-frequency spectrum in relation to changes in the dielectric permittivity values of the carbonate rocks due to the presence of fluids in the discontinuities (fractures, joints, pores, detachments). This presence of moisture/water zones in the discontinuities of carbonate rocks is marked by significantly lower instantaneous frequencies than in the dry zones of the surrounding carbonate rocks. This is a useful feature for determining their contour shapes and morphological sizes.
With the previous information, we can conclude
  • The vertical fractures condition important water access routes to the innermost parts of the cap, causing pockets or accumulations of relevant moisture in the contact zone between the end of the dolomitic layer and the beginning of the Polychromes layer. This accumulation of moisture in the contact of both layers will generate, as the preferential disintegration of the dolomitic layer is taking place, the percolation of water towards the areas closer to the surface of the Ceiling, generating, therefore, a greater risk for the conservation of the painting by activating new processes of dragging and migration of the painting.
  • Vertical fractures, often associated with diagonal planes (detachments), exhibit inclined cleavage surfaces that generate cavities in the rock, forming a porous topology. These cavities, resulting from the intricate interplay between fractures and detachments, serve as potential hydrogeological interconnection pathways, fostering subsurface water flow and enabling seepage and moisture transfer along these lines of weakness. This hydrogeological phenomenon, akin to the “communicating vessels” principle, underscores the structures’ role in helping with water migration through limestone, thus influencing subsurface dynamics. In the alterations seen in Altamira [18], the Polychrome Hall’s ceiling shows a film of discontinuous, irregularly distributed, and sometimes carbonated clays between the limestone substrate and the painting. These clays, subjected to internal tensions from moisture variations, lead to the loss of pigment adhesion and detachment from the support. Concurrently, environmental humidity contributes to carbonate dissolution, promoting mineral decomposition reactions on the limestone surface [93]. Ultimately, losing pigment adhesion is linked to the water’s physical-chemical features, incorporating CO2 and nutrients from the soil [24]. This water reaches the ceiling’s surface through the outer soil cover, causing partial limestone dissolution and forming interconnected depressions. Functioning like a hydrographic network, these depressions transport paint, carbonates, salts, clays, quartz fragments, and dolomite, among other products, to various drip points [40].
  • Observations from radargrams indicate that in the southern zone, neighboring the central fracture, moisture presence is notably less pronounced, aligning with the depicted radar imagery. The detected moisture appears to originate from surrounding areas associated with the take-off planes of the northern zone, with the central fracture acting as the distinguishing boundary between these zones. Furthermore, upon surface-level analysis of photogrammetric images in ALT1, particularly at locations with pigment fall, an evident water flow trajectory has been identified. This flow is observed to transport pigment through a network of cracks and fissures that notably align with the general dip of the Ceiling, indicating a directional correlation between the fissures and the flow pattern. This indicates that the greater moisture that influences the southern zone near the central fracture and near the entrance is due to the action or precedence of the northern part near the central fracture but not directly from the south. This tells us of a clear north and south zonation and that the moisture input comes almost exclusively from the central rift to the north. In the south, maybe the lack of moisture is not a sign that the area is better preserved or less affected by internal fractures, but rather that these are sealed, clogged, and have a plugging effect for this moisture, and that the moisture that is recorded comes from other adjacent areas. This is also reflected in the surface of the ceiling because, in the southern zone, there are fewer dripping points and more speleothems, carbonations, or concretions, which indicate that in the past, this zone was active and that these internal fractures percolated moisture or water, which washed paint, but that now this no longer occurs or at least does not occur as significantly as in the northernmost zone.
  • Focusing on other possible causes associated with the loss of pigment that could be accelerating the processes of dragging and washing of paint, it is worth mentioning the presence, not constant or permanent, of more surface humidity that as small laminar flows of water are concentrated in the central part of the ceiling of the Polychrome Hall, on both sides of the large fracture sealed with mortar, at about 70 cm in both north and south directions (for example, the control zone ALT1_1 has a distance of 68 cm in the north direction regarding the large central fracture).
  • Recent geophysical prospecting studies [41,42] carried out in the cave of Altamira, both from the overlying layer and from inside the Polychrome Hall, have shown that the large central fracture has a vertical development that, from a depth of 1.4 m in relation to the outer overlying layer, penetrates to the ceiling of the Polychrome Hall itself. In addition, the study concludes that the mortar filler applied by injection from the interior over this large fracture penetrates between 21 cm and 30 cm deep. At certain points, this filling is changed/deteriorated, generating a partial percolation of the water flows; however, at the best-preserved points, this filling is acting as a “plug”, diverting the water flows to adjacent areas.

3.3. Hydrology of Polychrome Ceiling

Using a detailed 3D model with a GSD better than 200 microns, hydrographic calculations have been executed to unveil critical geological features. The focus has been on determining contribution basins, streams, and dripping points, providing an understanding of water flow within the studied environment. The calculated basins serve as a pivotal metric, offering insights into the amount and activity of cracks. Concurrently, channels are mapped to discern the trajectory of water flow, including the directionality of potential pigment entrainment. This high-resolution model has enabled the examination of the hydrographic network, contributing to a comprehensive understanding of the geological dynamics.
To ensure the accuracy and reliability of the hydrographic calculations, a rigorous validation process has been implemented. The results have been systematically contrasted with real-world observations in the field or through orthoimage (Figure 9), creating a verification that includes dripping points in washed areas. This verification step is essential in confirming the fidelity of the 3D model’s predictions for aligning virtual representations with real geological features.
The significance of these hydrographic calculations extends beyond mere visualization, offering valuable information about the water distribution and pathways (Figure 10). Dripping points, which pinpoint areas where water ultimately reaches the ground, are important indicators of the hydrological behavior of the environment. This detailed analysis not only furthers our understanding of active cracks and water channels but also sheds light on the specific locales where water interacts with the cave floor, informing broader insights into the geological processes at play in the studied area.

4. Discussion

In our investigation, centered on data integration, geomatics, GPR, and the conservation of caves, the past studies and working hypotheses emphasize the critical importance of comprehensive considerations. Data integration stands out as an indispensable factor, providing a foundational framework for a more holistic understanding of the subject [94]. Historically, research efforts have often neglected the amalgamation of diverse datasets, opting instead for isolated fragments that may inadequately capture the complexity of the phenomenon under investigation.
The significance of outdoor hydrology, particularly its profound impact on various environmental and geological variables, is paramount. A nuanced understanding of outdoor hydrology is essential to ensure the precision and reliability of research outcomes. Similarly, the overlying layer assumes an important role in geological and environmental investigations, influencing moisture distribution, corrosion or microcorrosion processes, and the habitat suitability for diverse organisms. As our discussion unfolds, these interrelated elements will be carefully examined to shed light on their collective contribution to the broader scientific understanding of the cave conservation challenges [95].
Focusing on the specific case of the Polychrome Hall, this study reveals a predominant susceptibility to humidity-related deterioration processes. The sources of moisture stemming from rainwater infiltration or condensation processes have multifaceted repercussions, notably encompassing stone support corrosion and carbonate precipitation. Specifically, when addressing support corrosion, it is essential to clarify that it pertains to limestone corrosion induced by condensation water directly and indirectly by CO2 concentration, which triggers water acidification (whether in the form of water sheets or droplets), thus inciting the corrosion process. When discussing carbonate precipitation, the reference is to infiltration water laden with calcium carbonate that precipitates onto the ceiling surface, instigating distinctive alterations such as glazes. Additionally, humidity contributes to pigment migration due to infiltration water entrainment, banding and diffusion halo formation, and the proliferation of microorganisms.
The consistently damp condition of the hall ceiling, characterized by water percolation, seepage, and intermittent dripping, is closely associated with specific geological features, such as fractures from the surface penetrating vertically to almost the ceilings of the cave and hairline cracks and cracking. Despite seasonal variations, the relative humidity remains saturated throughout the year, influenced by both dripping and condensation processes.
The primary objective of the conservation efforts undertaken at the cave of Altamira is to mitigate the deterioration resulting from processes related to water infiltration. Our interest is focused on understanding and reconstructing the trajectories of dripping water on its way to the drip points, causing the transport of clay deposits or pigments seen in various areas. By doing so, we establish a direct link between water penetrating the surface through fracture planes and its journey from the innermost zones of the mountain range, eventually incorporating it into the surface of the ceiling, which acts as one of the many water “catchment basins”. Along its path, this water has the potential to carry away clay or pigment particles adhered to the ceiling’s surface.
This research has practical implications for conservation. The placement of georeferenced soil cores makes it possible to precisely locate the drips involved in pigment carry-over; observing the provenance of that water from its source, thanks to the examination of pigment particles linked to these drips, we can identify their sources and correlate them with basin studies, providing insights into patterns and frequencies of occurrences. The analysis conducted provides a comprehensive understanding of these events, linking them to external climatic factors and other indirect phenomena. This information is important for effective conservation and preservation strategies aimed at safeguarding the cave of Altamira. Indirect factors like the interaction of CO2 with the environment can influence the site’s conservation, potentially helping to form pigment and limestone rock deposits. This CO2-driven process might acidify water, detaching rock particles from the cave’s ceiling. This detachment could compromise the integrity of ancient rock paintings if limestone particles adhere to the pigments. Monitoring these indirect factors becomes imperative, given their potential impact on the long-term preservation of this significant archaeological site and cultural heritage.
The evaluation of the state of the overlying layer from the dolomitic level to the Polychrome level using a reliable and non-destructive solution based on the use of a high-frequency GPR. The objective will be the high-resolution survey to know in detail the trajectory followed by the water from the dolomitic layer to the Polychrome level, allowing the calculation of thicknesses, the existence of possible voids, zones of presence/absence of water, cracks, and fractures. This study, applied in a systematic way, allows us to know the difference in behavior and movement of the water in the ceiling of Polychromes.
The standard GPR interpretation method successfully identifies discontinuities in the overlying Polychrome Hall layer; however, it may not be effective in recognizing areas of moisture/water prone to seepage or waterways (Figure 11a). Therefore, the use of the Hilbert transform to the obtained radar signal to extract attributes has improved the identification of the inherent properties of the geological materials of the overlying Polychrome Hall layer, as the instantaneous magnitude attribute to identify areas of moisture/water potential for seepage or waterways (Figure 11b).
As shown in Figure 11, the presence of these moisture zones is mainly related to two lateral sources (Figure 11a): one on the south side clearly associated with the large central fracture (dashed red line), and another on the north side from a fracture of similar length to the central one, which even begins at a higher level (almost one meter from the surface). This vertical fracture reaches almost the surface of the ceiling of the Polychrome Hall at the great bison’s belly and hind legs, which are located in the active drip zone ALT1 (Figure 5). This moisture zone clearly comes from higher elevations. In addition, it is related to a central fracture (indicated by the red dashed line) and to the seepage of water flowing down the northwest-southeast dip (Figure 11b). This is corroborated by analyzing the photogrammetry images of the ceiling surface taken in the active drip zone ALT1. In this active drip zone ALT1 with pigment fall, water flowing is observed, which carries pigments through a series of fractures and fissures that seem to run in favor of the ceiling dip. Likewise, the moisture sources described above are also the same for the belly area of the great bison.
Furthermore, this quantitative transformation of the obtained GPR data ensures the objectivity of the attribute results, which serves as a valuable input to the multisensor analysis for better interpretation. Additionally, this attribute analysis contributes to a better understanding of the gas exchange and drip processes in this karst system. Planning 3D GPR studies on isoattribute surfaces can help monitor the pathways of matter exchange flows and their spatial and temporal variations in karstic formations containing caves with rock art. Since 3D GPR monitoring is mainly based on the relationships between GPR signals, there are discontinuities and moisture in the internal structure of each karst system.
The preservation of rock art in caves such as Altamira shows an unstable conservation environment and presents important remains, with the most worrying factors being water, geology, biodegradation, and human presence. Understanding the dynamics of these factors and reducing the alterations they generate requires the development of effective conservation strategies. These strategies should aim to control deterioration agents such as temperature, moisture, and CO2.
CO2, combined with water, plays a pivotal role in the dissolution and entrainment processes of the supporting rock [95,96,97,98]. Microcorrosion, loss of adhesion, cracking, washing, and loss of support are alarming processes. Although these processes have been occurring since the formation of these caves, they remain active today [99,100,101,102].
In the case of the cave of Altamira, these processes associated with washing away and loss of support are particularly concerning as they result in the loss of paint. Understanding the underlying dynamics of these processes, which are associated with the loss of pigment fixation to the support and its migration and washing towards the dripping points, is important. This knowledge is essential for designing strategies to control each alteration agent and the interactions between them. The findings from this study can inform the development of such strategies, contributing to the preservation of these invaluable heritage assets.
Recent geophysical prospecting studies conducted in the cave of Altamira [41,42], encompassing both the exterior and interior of the Polychrome Hall, have revealed noteworthy insights (Figure 11). Specifically, the investigation indicates that the prominent central fracture, highlighted in red within the imagery, extends vertically from a depth of 1.4 m relative to the exterior surface, penetrating up to the ceiling of the Polychrome Hall itself. A mortar filler applied through injection in the 1920s reaches depths between 21 and 30 cm within this substantial fracture, acting as an important “plug” that diverts water flows away from the crack to adjacent areas. This diversion is of paramount significance as the infiltration water, originally entering through the central fracture, is redirected in its final centimeters to collateral zones. This redirection leads to irreparable consequences for certain paintings near the crack, as it introduces an additional volume of water, resulting in the emergence of new dripping points associated with this infiltration water (Figure 5).
The dip and pronounced fissuring responsible for the separation of the Polychrome stratum from its immediate overlying stratum [103] contribute to the percolation of a greater water volume toward the north side from the central fracture. Additionally, it is noteworthy that the southern zone, characterized by a higher prevalence of speleothems in the upper layers above the dolomitic layer, creates a sealing effect preventing water access on the southern side. This inhibits the conduction of infiltration water in the upper strata to areas situated north of the substantial fracture.

5. Conclusions

Applying an integrated model in this hydrographic study has shed light on the water/moisture pathways within a karst system and their subsequent impact on the Polychrome ceiling, a critical part of rock art conservation.
Our study revealed that the vertical cracks or discontinuities associated with the joint system of the rock mass forming the Polychrome Hall’s ceiling play a significant role in the activation of deterioration processes of paints and supporting rock. These discontinuities divide the rock’s interior, constituting the Polychrome’s overlying layer into vertical “blocks”, helping with the flow of water and gases and enabling communication between the horizontal stratigraphic planes of different limestone layers.
Furthermore, vertical discontinuities extend from near the surface to the Polychrome layer, contributing materials/substances from the quarry’s higher levels. This finding can significantly aid in the conservation efforts of such invaluable rock art.
The exterior UAV model helped with a comprehensive analysis of water flow patterns, contributing to a more accurate depiction of the hydrological network.
The GPR data offered valuable insights into the composition and features of the overlying layers above the karst system, aiding in understanding the geological context and potential vulnerabilities contributing to water infiltration.
GPR mapping successfully identified discontinuities within the geological formations, critical for delineating potential pathways for water movement and assessing the risk of water pooling or moisture storage. Mapping these discontinuities enhances our understanding of the dynamics between surface water and the karst system.
By correlating GPR data with observed cave conditions, we could link specific water flow patterns to the activation of microcorrosion processes that induce the partial dissolution of the limestone rock. This connection provides a clearer understanding of the mechanisms responsible for the degradation of cave structures, with implications for preserving valuable cultural and geological features such as rock art.
The study underscores the environmental impact of water movement within the karst system on the preservation of rock art. The dissolution processes of the rock, partly induced by the infiltration water, directly threaten the integrity of the paint as it is located on the limestone itself.
The findings from this study can inform the development of conservation strategies aimed at mitigating the adverse effects of water on cave structures and rock art. These can include indirect interventions to avoid the pigment entrainment processes generated by the water film on the ceiling surface.
It is possible to consider specific risk mitigation measures based on the research findings. These measures include restricting access to the cave during periods of high water accumulation in the ceiling since visits generate excess CO2 incorporated into the water. Therefore, access is discouraged at certain times. We have proposed setting specific times of permanence in the cave and in the Polychrome Hall, such as 120 min from October to April and 80 min from May to September, maintaining internal climatic conditions within limits established through the analysis of historical data.
Expanding the knowledge of the dynamics of water access by studying the geophysical survey at different times of the year and relating it to external rainfall periods has been suggested. We also suggest relating the moisture data to the influence of CO2 and external humidity on the cap, which acts as an impermeable layer for the degassing of the cave. In addition, determining the relative moisture in the GPR records and correlating it with external rainfall to better understand the climatology in the overlying layer has been proposed.
To expand knowledge about the preferred water pathways, three-dimensional GPR monitoring is recommended for each season of the year over periods of several years. This would provide important information on water pathways both outside and inside the Polychrome overlying layer. In addition, GPR zonation and classification of the Polychrome overlying layer is proposed to identify the number and typology of discontinuities present, which would be fundamental to understanding the structure and behavior of the rock formation.

Author Contributions

Conceptualization, V.B., F.G. and A.P.; methodology, V.B., F.G. and A.P.; software, V.B. and F.G.; validation, C.D.L.H., F.G. and A.P.; formal analysis, V.B., F.G. and A.P.; investigation, V.B., F.G. and A.P.; resources, V.B., C.D.L.H. and P.F.; data curation, V.B. and F.G.; writing—original draft preparation, V.B., F.G. and A.P.; writing—review and editing, V.B., F.G. and A.P.; visualization, V.B., F.G. and A.P.; supervision, V.B., C.D.L.H. and P.F.; project administration, V.B., C.D.L.H. and P.F.; funding acquisition, V.B., C.D.L.H. and P.F. All authors have read and agreed to the published version of the manuscript.

Funding

This research was funded by the Department of Innovation, Industry, Tourism and Trade of the Regional Government of Cantabria in the context of aid to encourage industrial research and innovation in companies, project “SImulador Climático del Karst de cuevas de especial valor. (SICLIKA)”, grant number 2016/INN/25.

Data Availability Statement

The research data supporting this publication are not publicly available. The data were collected by GIM Geomatics as part of the research and conservation studies of the Cave. These data are kept in the Museo Nacional y Centro de Investigación de Altamira.

Acknowledgments

The authors of this work would like to thank the GIM Geomatics company for its support of the project and, especially, J. Herrera.

Conflicts of Interest

The authors declare no conflicts of interest.

References

  1. Xu, S.; Sirieix, C.; Ferrier, C.; Lacanette-Puyo, D.; Riss, J.; Malaurent, P. A Geophysical Tool for the Conservation of a Decorated Cave—A Case Study for the Lascaux Cave. Archaeol. Prospect. 2005, 22, 283–292. [Google Scholar] [CrossRef]
  2. Caselles, J.O.; Clapés, J.; Sagasti, J.I.S.; Gracia, V.P.; Santana, C.G.R. Integrated GPR and Laser Vibration Surveys to Preserve Prehistorical Painted Caves: Cueva Pintada Case Study. Int. J. Arch. Herit. 2021, 15, 669–677. [Google Scholar] [CrossRef]
  3. Hœrlé, S.; Huneau, F.; Salomon, A.; Denis, A. Using the ground-penetrating radar to assess the conservation condition of rock-art sites. Comptes Rendus Geosci. 2007, 339, 536–544. [Google Scholar] [CrossRef]
  4. Huneau, F.; Denis, A.; Salomon, A. First use of geological radar to assess the conservation condition of a South African rock art site: Game Pass Shelter (KwaZulu-Natal). S. Afr. J. Sci. 2008, 104, 251–254. [Google Scholar]
  5. Smith, B.W.; Black, J.L.; Mulvaney, K.J.; Hœrlé, S. Monitoring Rock Art Decay: Archival Image Analysis of Petroglyphs on Murujuga, Western Australia. Conserv. Manag. Archaeol. Sites 2021, 23, 198–220. [Google Scholar] [CrossRef]
  6. Dragovich, D.; Amiraslani, F. Conservation and Co-Management of Rock Art in National Parks: An Australian Case Study. Heritage 2023, 6, 6901–6916. [Google Scholar] [CrossRef]
  7. Banerjee, R.; Srivastava, P.K. Remote Sensing Based Identification of Painted Rock Shelter Sites: Appraisal Using Advanced Wide Field Sensor, Neural Network and Field Observations. In Remote Sensing Applications in Environmental Research; Society of Earth Scientists Series; Srivastava, P., Mukherjee, S., Gupta, M., Islam, T., Eds.; Springer: Cham, Switzerland, 2014. [Google Scholar] [CrossRef]
  8. Ravindran, T.R.; Arora, A.K.; Singh, M.; Ota, S.B. On-and off-site Raman study of rock-shelter paintings at world-heritage site of Bhimbetka. J. Raman Spectrosc. 2013, 44, 108–113. [Google Scholar] [CrossRef]
  9. De Las Heras, C. El Descubrimiento de la Cueva de Altamira; Lasheras, J.A., Ed.; Redescubrir Altamira; Turner: Madrid, Spain, 2003. [Google Scholar]
  10. Heras Martín, C.; Lasheras, J.A. L’art paléolithique a Altamira. Rev. Monum. Doss. Les Grottes Ornées 2006, 2, 46–49. [Google Scholar]
  11. de las Heras Martín, C.; Lasheras Corruchaga, J.A. Altamira cave. In Pleistocene and Holocene Hunter-Gatherers in Iberia and the Gibraltar Strait: The Current Archaeological Record; Ramos, R.S., Roura, E.C., de Castro, J.M.B., Ferreras, J.L.A., Eds.; Universidad de Burgos & Fundación Atapuerca: Burgos, Spain, 2014; pp. 615–627. ISBN 978-84-92681-95-2. [Google Scholar]
  12. Nardino, M.; Prada-Freixedo, A.; Famulari, D.; Brilli, L.; Cavaliere, A.; Carotenuto, F.; Chieco, C.; Gioli, B.; Giordano, T.; Martelli, F.; et al. Intensive campaign on continuous isotopic sampling for environmental criticality in the Stalactites cave of Altamira karst. In Proceedings of the Science and Art IX, Science and Technology Applied to Heritage Conservation, Madrid, Spain, 17–19 October 2022; La Ciencia y el Arte IX. Ciencias y Tecnologías Aplicadas a la Conservación del Patrimonio; Ministerio de Cultura y Deporte: Madrid, Spain, 2023; pp. 159–170. [Google Scholar]
  13. Sainz, C.; Fábrega, J.; Rábago, D.; Celaya, S.; Fernandez, A.; Fuente, I.; Fernandez, E.; Quindos, J.; Arteche, J.L.; Quindos, L. Use of Radon and CO2 for the Identification and Analysis of Short-Term Fluctuations in the Ventilation of the Polychrome Room Inside the Altamira Cave. Int. J. Environ. Res. Public Health 2022, 19, 3662. [Google Scholar] [CrossRef]
  14. Cuezva, S. Dinámica Microambiental de un Medio Kárstico Somero (Cueva de Altamira, Cantabria): Microclima, Geomicrobiología y Mecanismos de Interacción Cavidad-Exterior. Ph.D. Thesis, Universidad Complutense de Madrid, Madrid, Spain, 2008; p. 320. [Google Scholar]
  15. Portero García, J.M. Cartografía de la Hoja n.º 34 (Torrelavega) del Mapa Geológico de España, MAGNA, a escala E. 1:50.000 (2.ª Serie); IGME: Madrid, Spain, 1976. [Google Scholar]
  16. Hoyos, M.; Bustillo, A.; García, A.; Martín, C.; Ortiz, R.; Y Suazo, C. Características Geológico-Kársticas de la Cueva de Altamira (Santillana del Mar, Santander); Informe Ministerio de Cultura: Madrid, Spain, 1981; 81p. [Google Scholar]
  17. Sánchez, M.A.; Foyo, A.; Tomillo, C.; Iriarte, E. Geological risk assessment of the Altamira Cave: A proposed Natural Risk Index and Safety Factor for the protection of prehistoriccaves. Eng. Geol. 2007, 94, 180–200. [Google Scholar] [CrossRef]
  18. Hoyos, M. Procesos de alteración de soporte y pintura en diferentes cuevas con arte rupestre del norte de España: Santimamiñe, Arenaza, Altamira y Llonín. In La Protección y Conservación del Arte Rupestre Paleolítico; Principado de Asturias: Oviedo, Spain, 1993; pp. 51–74. [Google Scholar]
  19. Hoyos, M.; Soler, V.; Sánchez-Moral, S.; Cañaveras, J.C.; Sanz-Rubio, E. Carbon Dioxide Fluxes in Karstic Caves (Altamira and Tito Bustillo Caves, Spain); International Geological Correlation Programme 379 Newsletter; IGCP: Paris, France, 1998; pp. 43–44. [Google Scholar]
  20. Villar, E. Proyecto Científico Técnico Encaminado a la Conservación de las Pinturas de Altamira; Centro de Investigación y Museo de Altamira; Monografías 5; Ministerio de Cultura: Madrid, Spain, 1979. [Google Scholar]
  21. Villar, E. Propagación de la onda térmica anual a través de discontinuidades de aire subterráneas. An. Física Ser. B 1986, 82, 132–142. [Google Scholar]
  22. Villar, E.; Fernández, P.L.; Gutiérrez, I.; Quindós, L.S.; Soto, J. Influence of visitors on carbon dioxide concentrations in Altamira Cave. Cave Sci. 1986, 13, 21–24. [Google Scholar]
  23. De Las Heras, C.; Lafuente, C.; Gonzalo, B.; Lasheras, J.A.; Blanco, M.; Cirujano, C.; Herrero, A.; del Egido, M. Historia de la conservación de la cueva de Altamira (1868–2012). In Programa de Investigación para la Conservación Preventiva y Régimen de Acceso a la Cueva de Altamira; Guichen, G., Ed.; Ministerio de Educación, Cultura y Deporte: Madrid, Spain, 2014; Volume II. [Google Scholar]
  24. Sánchez-Moral, S. Estudio Integral del Estado de Conservación de la Cueva de Altamira y su Arte Paleolítico (2007–2009). Perspectivas Futuras de Conservación. Monografías del Museo Nacional y Centro de Investigación de Altamira, No. 24; Ministerio de Educación, Cultura y Deporte: Madrid, Spain, 2014. [Google Scholar]
  25. Sánchez-Moral, S.; Cuezva, S.; García-Antón, E.; Fernández-Cortes, A.; Elez, J.; Benavente, D.; Cañaveras, J.C.; Jurado, V.; Rogerio-Candelera, M.A.; Saiz-Jiménez, Y.C. Microclimatic monitoring in Altamira cave: Two decades of scientific projects for its conservation. In The Conservation of Subterranean Cultural Heritage; Saiz-Jiménez, C., Ed.; CRC Press: London, UK, 2014; pp. 139–144. [Google Scholar]
  26. Hoyos, M. Altamira en peligro: Consideraciones previas. Foros Banesto sobre el Patrimonio Histórico. Fundación Cultural Banesto: Madrid, Spain, 1994; pp. 182–196. [Google Scholar]
  27. Ministerio de Cultura y Deporte; Universidad de Cantabria; CSIC; Universidad del País Vasco; de Guichen, G. Programa de Investigación Para la Conservación Preventiva y Régimen de Acceso de la Cueva de Altamira (2012–2014); Ministerio de Cultura y Deporte: Madrid, Spain, 2014; Volume II. [Google Scholar]
  28. Ministerio de Cultura y Deporte; Universidad de Cantabria; CSIC; Universidad del País Vasco; de Guichen, G. Programa de Investigación Para la Conservación Preventiva y Régimen de Acceso de la Cueva de Altamira (2012–2014); Ministerio de Cultura y Deporte: Madrid, Spain, 2014; Volume IV. [Google Scholar]
  29. Ford, D.; Williams, P. Karst Hydrogeology and Geomorphology; Wiley: Hoboken, NJ, USA, 2007. [Google Scholar]
  30. Mangin, A. Contribution à L’étude Hydrodynamique Des Aquifères Karstiques. Ph.D. Thesis, Université de Dijon, Dijon, France, 1975. [Google Scholar]
  31. Dreybrodt, W. Processes in Karst Systems-Physics, Chemistry, and Geology; Physical Environment; Springer: Berlin/Heidelberg, Germany, 1988. [Google Scholar]
  32. Bögli, A. Karst Hydrology and Physical Speleology; Springer: Berlin/Heidelberg, Germany, 1980. [Google Scholar]
  33. Class, H.; Bürkle, P.; Sauerborn, T.; Trötschler, O.; Strauch, B.; Zimmer, M. On the role of density-driven dissolution of CO2 in phreatic karst systems. Water Resour. Res. 2021, 57, e2021WR030912. [Google Scholar] [CrossRef]
  34. Goldscheider, N.; Chen, Z.; Auler, A.S.; Bakalowicz, M.; Broda, S.; Drew, D.; Hartmann, J.; Jiang, G.; Moosdorf, N.; Stevanovic, Z.; et al. Global distribution of carbonate rocks and karst water resources. Hydrogeol. J. 2020, 28, 1661–1677. [Google Scholar] [CrossRef]
  35. Class, H.; Keim, L.; Schirmer, L.; Strauch, B.; Wendel, K.; Zimmer, M. Seasonal Dynamics of Gaseous CO2 Concentrations in a Karst Cave Correspond with Aqueous Concentrations in a Stagnant Water Column. Geosciences 2023, 13, 51. [Google Scholar] [CrossRef]
  36. Liu, F.; Jiang, G.; Wang, J.; Guo, F. The Recharge Process and Influencing Meteorological Parameters Indicated by Cave Pool Hydrology in the Bare Karst Mountainous Area. Sustainability 2021, 13, 1766. [Google Scholar] [CrossRef]
  37. Jeong, S.-W.; Yum, B.-W.; Ryu, D.-W.; Lee, H.-J.; Jung, B. The Influence of Clay Content on Cave-ins in Tank Model Tests and Monitoring Indicators of Sinkhole Formation. Appl. Sci. 2019, 9, 2346. [Google Scholar] [CrossRef]
  38. Tian, F.; Wang, Z.; Cheng, F.; Xin, W.; Fayemi, O.; Zhang, W.; Shan, X. Three-Dimensional Geophysical Characterization of Deeply Buried Paleokarst System in the Tahe Oilfield, Tarim Basin, China. Water 2019, 11, 1045. [Google Scholar] [CrossRef]
  39. Espinasa, L.; Ornelas-García, C.P.; Legendre, L.; Rétaux, S.; Best, A.; Gamboa-Miranda, R.; Espinosa-Pérez, H.; Sprouse, P. Discovery of Two New Astyanax Cavefish Localities Leads to Further Understanding of the Species Biogeography. Diversity 2020, 12, 368. [Google Scholar] [CrossRef]
  40. Valle, F.J.; Moya, J.S.; y Cendrero, A. Estudio de la roca soporte de las pinturas rupestres de la cueva de Altamira. Zephyrus 1978, XXVIII–XXIX, 5–15. [Google Scholar]
  41. Bayarri, V.; Prada, A.; García, F.; Díaz-González, L.M.; De Las Heras, C.; Castillo, E.; Fatás, P. Integration of Remote-Sensing Techniques for the Preventive Conservation of Paleolithic Cave Art in the Karst of the Altamira Cave. Remote Sens. 2023, 15, 1087. [Google Scholar] [CrossRef]
  42. Bayarri, V.; Prada, A.; García, F. A Multimodal Research Approach to Assessing the Karst Structural Conditions of the Ceiling of a Cave with Palaeolithic Cave Art Paintings: Polychrome Hall at Altamira Cave (Spain). Sensors 2023, 23, 9153. [Google Scholar] [CrossRef] [PubMed]
  43. Forte, E.; Pipan, M.; Casabianca, D.; Di Cuia, R.; Riva, A. Imaging and characterization of a carbonate hydrocarbon reservoir analogue using GPR attributes. J. Appl. Geophys 2012, 81, 76–87. [Google Scholar] [CrossRef]
  44. Chopra, S.; Marfurt, K.J. Seismic attributes—A historical perspective. Geophysics 2005, 70, 3–28. [Google Scholar] [CrossRef]
  45. Ehret, B. Pattern recognition of geophysical data. Geoderma 2010, 160, 111–125. [Google Scholar] [CrossRef]
  46. Chen, Q.; Sidney, S. Seismic attribute technology for reservoir forecasting and monitoring. Lead. Edge 1997, 16, 445–448. [Google Scholar] [CrossRef]
  47. Taner, M.T.; Koehler, F.; Sheriff, R.E. Complex seismic trace analysis. Geophysics 1979, 44, 1041–1063. [Google Scholar] [CrossRef]
  48. Böniger, U.; Tronicke, J. Improving the interpretability of 3D GPR data using target–specific attributes: Application to tomb detection. J. Archaeol. Sci. 2010, 37, 360–367. [Google Scholar] [CrossRef]
  49. Corbeanu, R.M.; Mcmechan, G.A.; Szerbiak, R.B.; Soegaard, K. Prediction of 3D fluid permeability and mudstone distributions from ground-penetrating radar (GPR) attributes: Example from the Cretaceous Ferron member, east-central Utah. Geophysics 2002, 67, 1495–1504. [Google Scholar] [CrossRef]
  50. Zhao, W.; Forte, E.; Levi, S.T.; Pipan, M.; Tian, G. Improved high-resolution GPR imaging and characterization of prehistoric archaeological features by means of attribute analysis. J. Archaeol. Sci. 2015, 54, 77–85. [Google Scholar] [CrossRef]
  51. Zhao, W.; Forte, E.; Pipan, M. Texture Attribute Analysis of GPR Data for Archaeological Prospection. Pure Appl. Geophys. 2016, 173, 2737–2751. [Google Scholar] [CrossRef]
  52. Bayarri-Cayón, V.; Latova, J.; Castillo, E.; Lasheras, J.A.; De Las Heras, C.; Prada, A. Nueva ortoimagen verdadera del Techo de Polícromos de la Cueva de Altamira. In ARKEOS|Perspectivas em Diálogo, nº 37. XIX International Rock Art Conference IFRAO 2015. Symbols in the Landscape: Rock Art and Its Context. Conference Proceedings; Instituto Terra e Memória: Tomar, Portugal, 2015; pp. 2308–2320. ISBN 978-84-9852-463-5. [Google Scholar]
  53. Bayarri-Cayón, V.; Castillo, E. Caracterización geométrica de elementos complejos mediante la integración de diferentes técnicas geomáticas. Resultados obtenidos en diferentes cuevas de la Cornisa Cantábrica. In Proceedings of the VIII Semana Geomática Internacional, Barcelona, Spain, 3–5 March 2009. [Google Scholar]
  54. Leick, A.; Rapoport, L.; Tatarnikov, D. GPS Satellite Surveying, 4th ed.; John Wiley & Sons: New York, NY, USA, 2015. [Google Scholar]
  55. Teunissen, P.; Khodabandeh, A. Review and principles of PPP-RTK methods. J. Geod. 2015, 89, 217–240. [Google Scholar] [CrossRef]
  56. TOPCON. Topcon Hyper II GNSS Receiver Specifications. Available online: https://topconcare.com/en/hardware/gnss-receivers/hiper-ii/specifications/ (accessed on 16 October 2023).
  57. TOPCON. Topcon Tools 8. Technical Datasheet. Available online: https://topconcare.com/en/software/office-applications/topcon-tools-8/ (accessed on 16 October 2023).
  58. Bayarri, V.; Castillo, E.; Ripoll, S.; Sebastián, M.A. Control of Laser Scanner Trilateration Networks for Accurate Georef-erencing of Caves: Application to El Castillo Cave (Spain). Sustainability 2021, 13, 13526. [Google Scholar] [CrossRef]
  59. QGIS Development Team. QGIS Geographic Information System; Open Source Geospatial Foundation: Beaverton, OR, USA, 2022; Available online: http://qgis.osgeo.org (accessed on 27 July 2023).
  60. Smith, J. Topographic Analysis in Hydrology. J. Hydrol. Sci. 2015, 60, 775–789. [Google Scholar]
  61. Strahler, A.N. Hypsometric (area-altitude) analysis of erosional topology. Geol. Soc. Am. Bull. 1952, 63, 1117–1142. [Google Scholar] [CrossRef]
  62. Horton, R.E. Erosional development of streams and their drainage basins: Hydrophysical approach to quantitative morphology. Geol. Soc. Am. Bull. 1945, 56, 275–370. [Google Scholar] [CrossRef]
  63. Ercoli, M.; Pauselli, C.; Cinti, F.R.; Forte, E.; Volpe, R. Imaging of an active fault: Between 3D GPR data and outcrops at the Castrovillari fault, Calabria, Italy. Interpretation 2015, 3, SY57–SY66. [Google Scholar] [CrossRef]
  64. Tomecka-Suchoń, S. Ground penetrating radar use in flood prevention. Acta Geophys. 2019, 67, 1679–1691. [Google Scholar] [CrossRef]
  65. Davis, J.L.; Annan, A.P. Ground-penetrating radar for high-resolution mapping of soil and rock stratigraphy. Geophys. Prospect. 1989, 37, 531–551. [Google Scholar] [CrossRef]
  66. Reiss, S.; Reicherter, K.; Reuther, C.D. Visualization and characterization of active normal faults and associated sediments by high-resolution GPR. Geol. Soc. Lond. Spec. Publ. 2003, 211, 247–255. [Google Scholar] [CrossRef]
  67. Van den Bril, K.; Grégoire, C.; Swennen, R.; Lambot, S. Ground-penetrating radar as a tool to detect rock heterogeneities (channels, cemented layers and fractures) in the Luxembourg Sandstone Formation (Grand-Duchy of Luxembourg). Sedimentology 2007, 54, 949–967. [Google Scholar] [CrossRef]
  68. van Overmeeren, R. Radar Facies of Unconsolidated Sediments in the Netherlands: A Radar Stratigraphy Interpretation Method for Hydrogeology. J. Appl. Geophys. 1998, 40, 1–18. [Google Scholar] [CrossRef]
  69. Orlando, L. Semiquantitative evaluation of massive rock quality using ground penetrating radar. J. Appl. Geophys. 2003, 52, 1–9. [Google Scholar] [CrossRef]
  70. Toshioka, T.; Tsuchida, T.; Sasahara, K. Application of GPR to detecting and mapping cracks in rock slopes. J. Appl. Geophys. 1995, 33, 119–124. [Google Scholar] [CrossRef]
  71. Batayneh, A.T.; Zumlot, T.; Ghrefat, H.; El-Waheidi, M.M.; Nazzal, Y. The Use of Ground Penetrating Radar for Mapping Rock Stratigraphy and Tectonics: Implications for Geotechnical Engineering. J. Earth Sci. 2014, 25, 895–900. [Google Scholar] [CrossRef]
  72. Pipan, M.; Baradello, L.; Forte, E.; Prizzon, A. GPR study of bedding planes, fractures, and cavities in limestone. In Proceedings of the SPIE 4084, Eighth International Conference on Ground Penetrating Radar, Gold Coast, Australia, 23–26 May 2000. [Google Scholar] [CrossRef]
  73. Bermejo, L.; Ortega, A.I.; Parés, J.M.; Campaña, I.; Bermúdez de Castro, J.M.; Carbonell, E.; Conyers, L.B. Karst feature interpretation using ground-penetrating radar: A case study from the Sierra de Atapuerca, Spain. Geomorphology 2020, 367, 107311. [Google Scholar] [CrossRef]
  74. Batayneh, A.; Abueladas, A.; Moumani, K. Use of Ground-Penetrating Radar for Assessment of Potential Sinkhole Conditions: An Example from Ghor al Haditha Area, Jordan. Env. Geol. 2002, 41, 977–983. [Google Scholar] [CrossRef]
  75. Chalikakis, K.; Plagnes, V.; Guerin, R.; Valois, R.; Bosch, F.P. Contribution of geophysical methods to karst-system exploration: An overview. Hydrogeol. J. 2011, 19, 1169–1180. [Google Scholar] [CrossRef]
  76. Grasmueck, M.; Quintà, M.C.; Pomar, K.; Eberli, G.P. Diffraction imaging of subvertical fractures and karst with full-resolution 3D Ground-Penetrating Radar. Geophys. Prospect. 2013, 61, 907–918. [Google Scholar] [CrossRef]
  77. García-García, F.; Valls-Ayuso, A.; Benlloch-Marco, J.; Valcuende-Payá, M. An optimization of the work disruption by 3D cavity mapping using GPR: A new sewerage project in Torrente (Valencia, Spain). Constr. Build. Mater. 2017, 154, 1226–1233. [Google Scholar] [CrossRef]
  78. Sénéchal, P.; Perroud, H.; Sénéchal, G. Interpretation of reflection attributes in a 3-D GPR survey at Vallée d’Ossau, western Pyrenees, France. Geophysics 2000, 65, 1435–1445. [Google Scholar] [CrossRef]
  79. McClymont, A.F.; Green, A.G.; Streich, R.; Horstmeyer, H.; Tronicke, J.; Nobes, D.C.; Pettinga, J.R.; Campbell, J.K.; Langridge, R.M. Visualization of active faults using geometric attributes of 3D GPR data: An example from the Alpine Fault Zone, New Zealand. Geophysics 2008, 73, 11–23. [Google Scholar] [CrossRef]
  80. Reis, J.A.; Castro, D.L.; Jesus, T.E.; Filho, F.P. Characterization of collapsed paleocave systems using GPR attributes. J. Appl. Geophys. 2014, 103, 43–56. [Google Scholar] [CrossRef]
  81. Gao, Q.; Wang, S.; Peng, T.; Peng, H.; Oliver, D.M. Evaluating the structure characteristics of epikarst at a typical peak cluster depression in Guizhou plateau area using ground penetrating radar attributes. Geomorphology 2020, 364, 107015. [Google Scholar] [CrossRef]
  82. Allroggen, N.; Heincke, B.; Koyan, P.; Wheeler, W.; Rønning, J. 3D GPR attribute classification: A case study from a paleokarst breccia pipe in the Billefjorden area on Spitsbergen, Svalbard. Geophysics 2020, 87, 1–52. [Google Scholar] [CrossRef]
  83. Conyers, L.B. Ground-Penetrating Radar for Archaeology, 3rd ed.; Rowman and Littlefield Publishers: Lanham, MD, USA; Alta Mira Press: Lanham, MD, USA, 2013; p. 241. [Google Scholar]
  84. Daniels, D.J. Ground Penetrating Radar, 2nd ed.; IEE Radar, Sonar and Navigation Series 15, Ed.; The Institution of Electrical Engineers: London, UK, 2004; p. 752. [Google Scholar] [CrossRef]
  85. Toomey, R.S. Geological Monitoring of Caves and Associated Landscapes; Young, R., Norby, L., Eds.; Geological Monitoring: Boulder, CO, USA; Geological Society of America: Boulder, CO, USA, 2009; pp. 27–46. [Google Scholar] [CrossRef]
  86. Kalhor, K.; Ghasemizadeh, R.; Rajic, L.; Alshawabkeh, A. Assessment of groundwater quality and remediation in karst aquifers: A review. Groundw. Sustain. Dev. 2019, 8, 104–121. [Google Scholar] [CrossRef]
  87. Beynen, P.E. Karst Management; Springer: Berlin/Heidelberg, Germany, 2011. [Google Scholar]
  88. Bayarri, V. Algoritmos de Análisis de Imágenes Multiespectrales e Hiperespectrales para la Documentación e Interpretación del Arte Rupestre. Ph.D. Thesis, Universidad Nacional de Educación a Distancia, Madrid, Spain, May 2020. Available online: http://e-spacio.uned.es/fez/view/tesisuned:ED-Pg-TecInd-Vbayarri (accessed on 25 January 2021).
  89. Bayarri, V.; Sebastián, M.A.; Ripoll, S. Hyperspectral Imaging Techniques for the Study, Conservation and Management of Rock Art. Appl. Sci. 2019, 9, 5011. [Google Scholar] [CrossRef]
  90. Bayarri, V.; Castillo, E.; Ripoll, S.; Sebastián, M.A. Improved Application of Hyperspectral Analysis to Rock Art Panels from El Castillo Cave (Spain). Appl. Sci. 2021, 11, 1292. [Google Scholar] [CrossRef]
  91. Bayarri, V.; Latova, J.; Castillo, E.; Lasheras, J.A.; De Las Heras, C.; Prada, A. Nueva documentación y estudio del arte empleando técnicas hiperespectrales en la Cueva de Altamira. In ARKEOS|Perspectivas em Diálogo, nº 37. XIX International Rock Art Conference IFRAO 2015. Symbols in the Landscape: Rock Art and Its Context. Conference Proceedings; Instituto Terra e Memória: Tomar, Portugal, 2015; ISBN 978-84-9852-463-5. [Google Scholar]
  92. Ripoll, S.; Bayarri, V.; Muñoz, F.J.; Latova, J.; Gutiérrez, R.; Pecci, H. El arte rupestre de la cueva de El Castillo (Puente Viesgo, Cantabria): Unas reflexiones metodológicas y una propuesta cronológica. In Capítulo en Libro Cien Años de Arte Rupestre Paleolítico Centenario del Descubrimiento de la Cueva de la Peña de Candamo (1914–2014); Ediciones Universidad de Salamanca: Salamanca, Spain, 2014; ISBN 978-84-9012-480-2. [Google Scholar]
  93. Cendrero, A. Influencia de la composición de la roca soporte en el deterioro de las pinturas de Altamira. In Proceedings of the Altamira Symposium, Santillana del Mar, Spain, 1979; Ministerio de Cultura: Madrid, Spain, 1981; pp. 579–580. [Google Scholar]
  94. Ontañon, R.; Bayarri, V.; Herrera, J.; Gutierrez, R. The conservation of prehistoric caves in Cantabria, Spain. In The Conservation of Subterranean Cultural Heritage; CRC Press/Balkema: Boca Raton, FL, USA; Taylor & Francis Group: London, UK, 2014; ISBN 978-1-315-73997-7. [Google Scholar]
  95. Bernardi, A.; Todorov, V.; Hiristova, J. Microclimatic analysis in St. Stephan’s church, Nessebar, Bulgaria after interventions for the conservation of frescoes. J. Cult. Herit. 2000, 1, 281–286. [Google Scholar] [CrossRef]
  96. Camuffo, D. The microclimate inside the Pollaiolo and Botticelli rooms in the Uffizi Gallery, Florence. J. Cult. Herit. 2002, 3, 155–161. [Google Scholar] [CrossRef]
  97. Hoyos, M.; Soler, V.; Cañaveras, J.C.; Sánchez-Moral, S.; Sanz-Rubio, E. Microclimatic characterization of a karstic cave: Human impact on microenvironmental parameters of a prehistoric rock art cave (Candamo Cave, northern Spain). Environ. Geol. 1998, 33, 231–242. [Google Scholar] [CrossRef]
  98. Zerboni, A.; Villa, F.; Wu, Y.-L.; Solomon, T.; Trentini, A.; Rizzi, A.; Cappitelli, F.; Gallinaro, M. The Sustainability of Rock Art: Preservation and Research. Sustainability 2022, 14, 6305. [Google Scholar] [CrossRef]
  99. Martin-Pozas, T.; Fernandez-Cortes, A.; Cuezva, S.; Cañaveras, J.C.; Benavente, D.; Duarte, E.; Saiz-Jimenez, C.; Sanchez-Moral, S. New insights into the structure, microbial diversity and ecology of yellow biofilms in a Paleolithic rock art cave (Pindal Cave, Asturias, Spain). Sci. Total Environ. 2023, 897, 165218. [Google Scholar] [CrossRef] [PubMed]
  100. Sileo, S.; Terenzio Gizzi, F.; Masini, N. Low cost monitoring approach for the conservation of frescoes: The crypt of St. Francesco d’Assisi in Irsina (Basilicata, Southern Italy). J. Cult. Herit. 2017, 23, 89–99. [Google Scholar] [CrossRef]
  101. Sammartino, M.P.; Cau, G.; Reale, R.; Ronca, S.; Visco, G. A multidisciplinary diagnostic approach preliminary to the restoration of the country church “San Maurizio” located in Ittiri (SS), Italy. Herit. Sci. 2014, 2, 4. [Google Scholar] [CrossRef]
  102. Bastian, F.; Jurado, V.; Nováková, A.; Alabouvette, C.; Saiz-Jimenez, C. The microbiology of Lascaux cave. Microbiology 2010, 156, 644–652. [Google Scholar] [CrossRef]
  103. Cabrera Garrido, J.M. Conservación de la Cueva de Altamira: Sugerencias para un programa de trabajo. In Altamira Symposium; Ministerio de Cultura: Madrid, Spain, 1981; pp. 621–641. [Google Scholar]
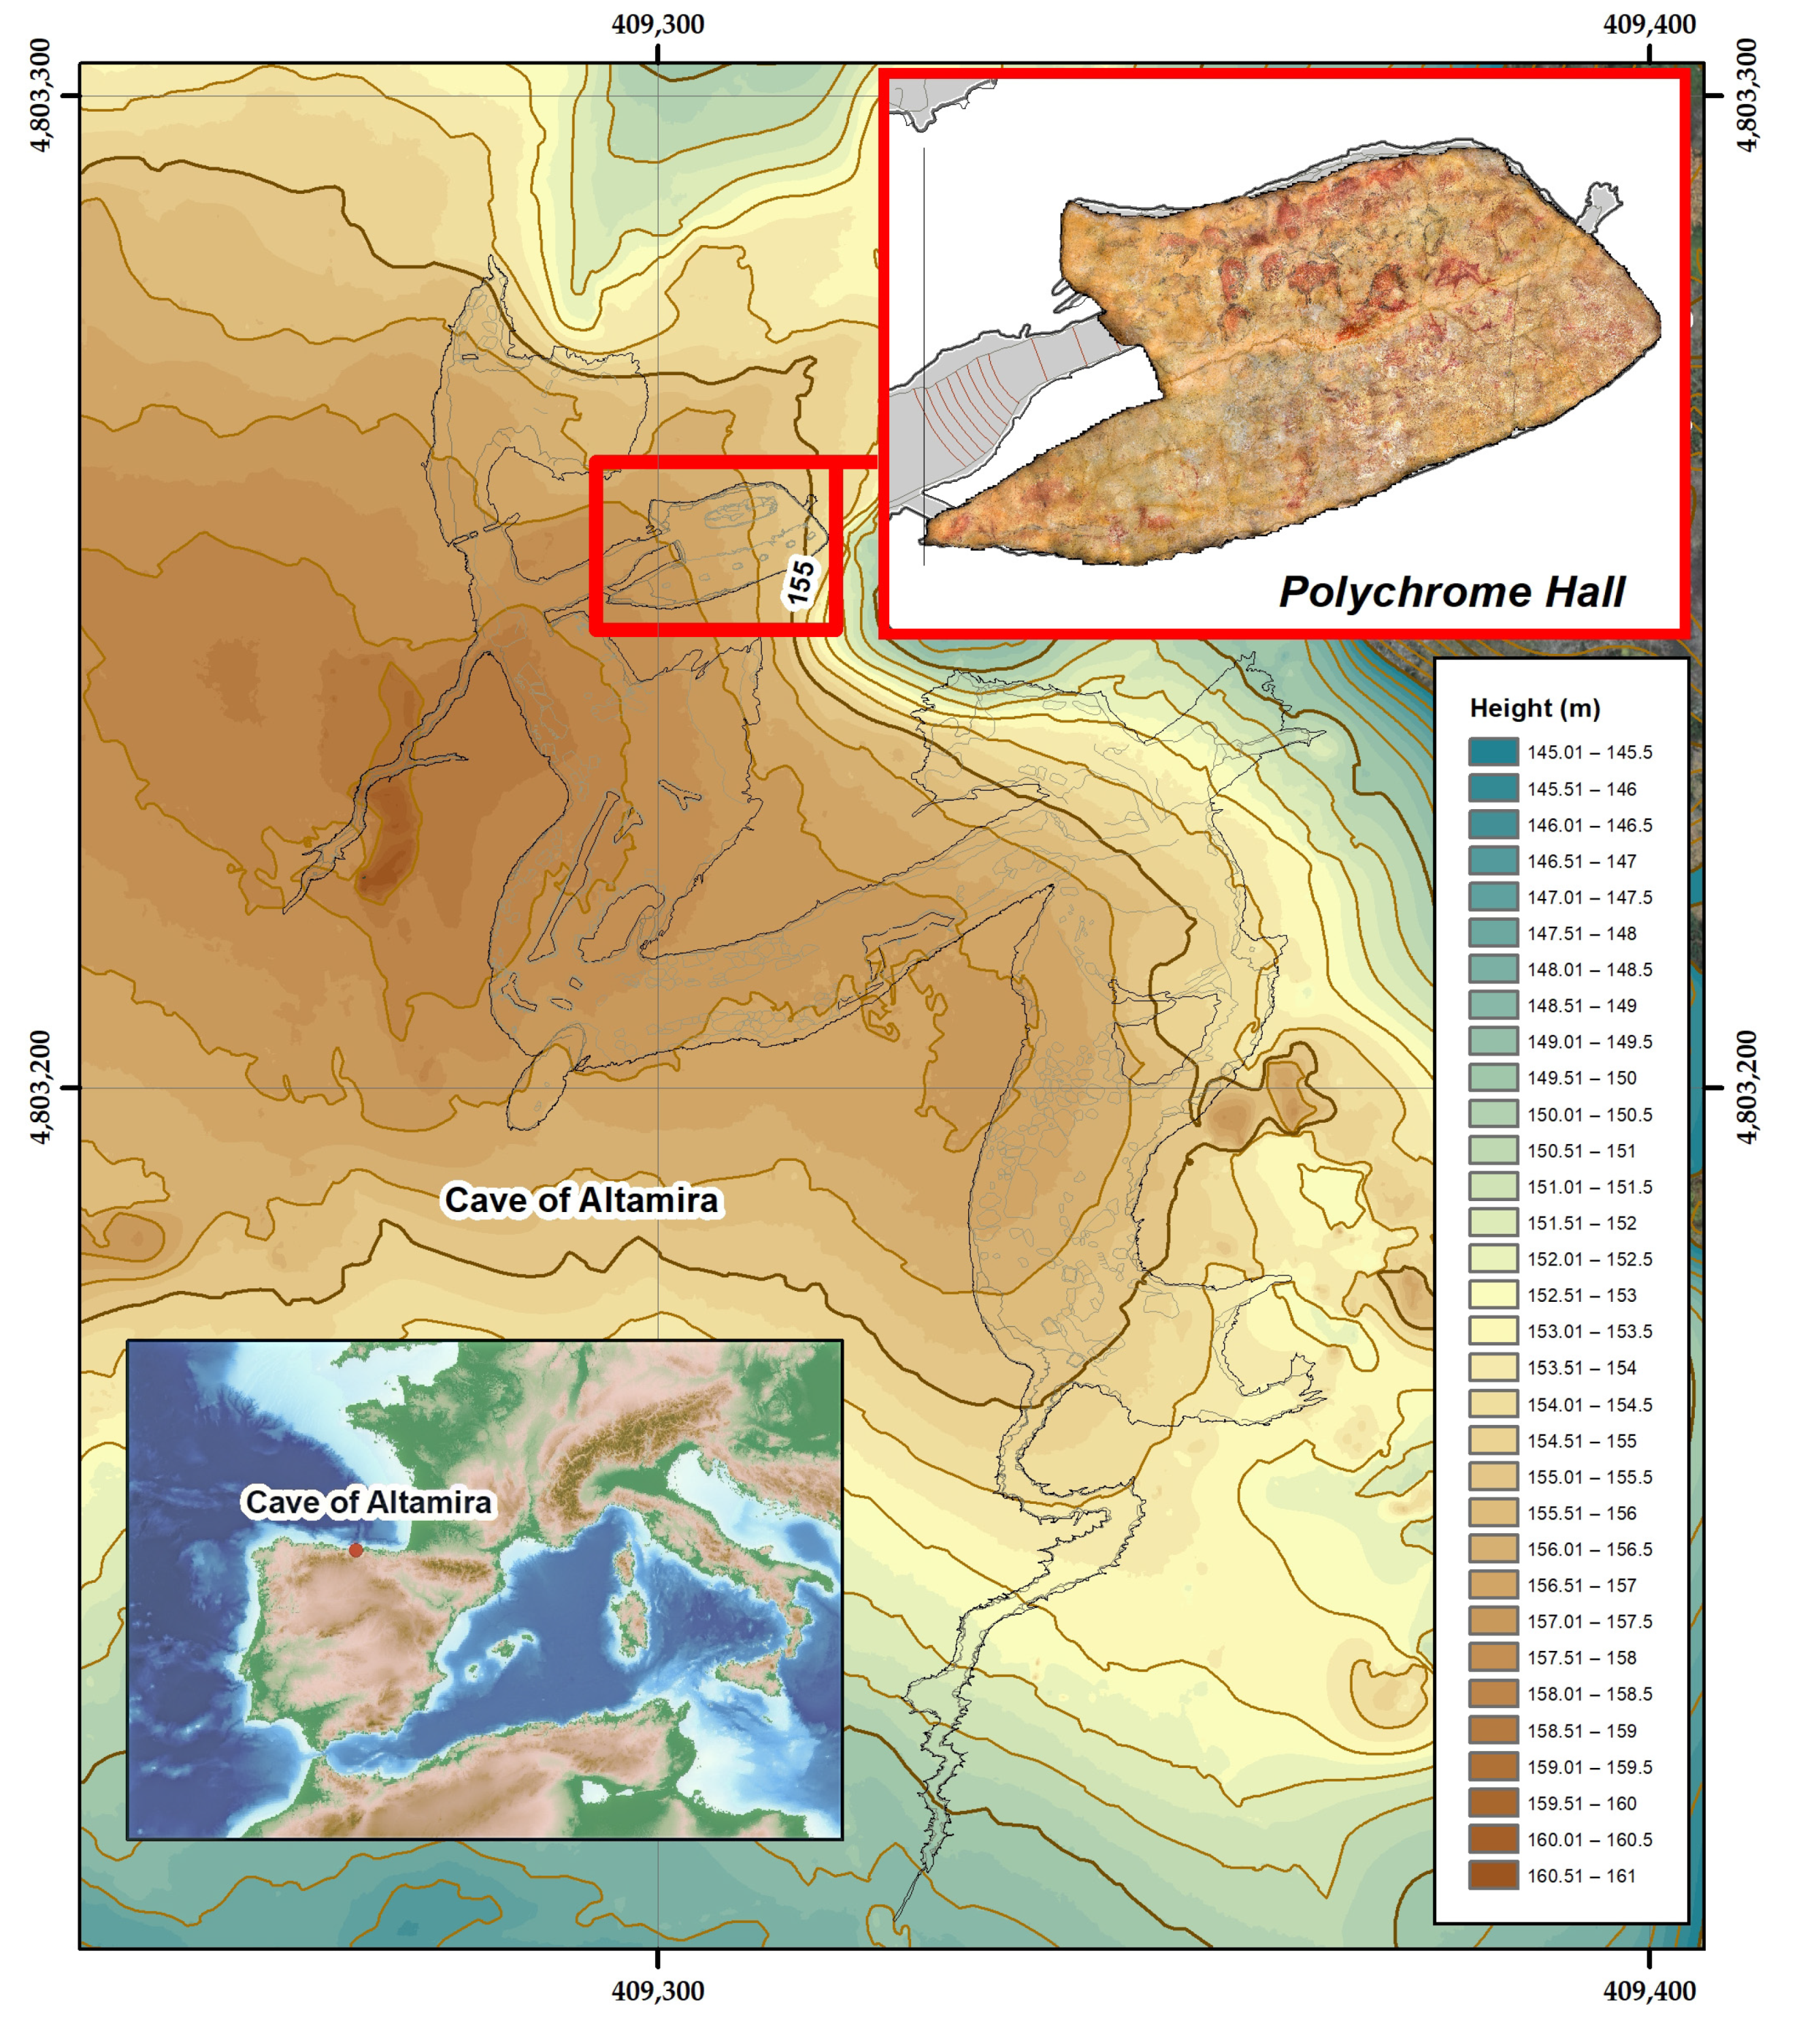
Figure 1. Location and map of the surroundings of cave of Altamira where the outline of the cavity is projected onto the surface (shown by a black line). It is also shown highlighting the orthoimage of the ceiling of the Polychrome Hall where the cave paintings are located.
Remotesensing 16 00197 g001
Figure 2. Image showing the microcorrosion of the supporting rock and the craquele of the pigment. Note that white areas are produced by light glints so no information is available.
Remotesensing 16 00197 g002
Figure 3. General workflow scheme followed in this study (adapted from [41,42]). The black hexagons indicate the integrated models, the gray hexagons the analysis performed on the models and the colored hexagons the analysis performed from the previous ones.
Remotesensing 16 00197 g003
Figure 4. (a) Overlap of exterior sinks, interior drip points, position of the central fracture and position of the GPR profiles projected on the ceiling of the Polychrome Hall that were carried out with the 400 MHz and 900 MHz antennas. The green rectangle shows the position of (b) Image with detail of the central fracture sealed with mortar framed in green in (a).
Remotesensing 16 00197 g004
Figure 5. (a) Location of the ALT-1 active drip zone at the hind legs of the great bison figure (marked in a green rectangle). (b) Image with detail of the hind leg area of the great bison showing active drip points (indicated with blue polygons) and streams (indicated with blue lines). The thicker the blue lines (streams) the higher the hierarchy in the ALT-1 active drip zone.
Remotesensing 16 00197 g005aRemotesensing 16 00197 g005b
Figure 6. Detailed image of a sheet of water on Polychrome ceiling showing the surface tension of the water.
Remotesensing 16 00197 g006
Figure 7. (a) Basins, sinks and classified streams according to the Strahler method [61] in the overlying layer of the Polychrome Hall; (b) Superimposition of the above results on the orthoimage of the Polychrome ceiling.
Remotesensing 16 00197 g007
Figure 8. Example of GPR attributes from Hilbert transform on reflection profiles D6-T1, D6-T2, D6-T3 and D6-T4 recorded with the 400 MHz and 900 MHz antennas air-coupled to the ceiling of the Polychrome Hall. (a) Processed reflection profiles, and after the application of the following attributes: (b) instantaneous magnitude; (c) instantaneous phase; (d) instantaneous frequency. The active drip zone ALT-1 (indicated by the blue arrow) and the central fracture (indicated by the red arrow) are shown. The correlation of these reflection profiles with the stratigraphic layers of the Polychrome Hall overlying layer is also shown (the thicknesses of each recorded layer are indicated by red vertical arrows).
Remotesensing 16 00197 g008
Figure 9. (a) Superimposition of basin, streams, drip points on orthoimage to check washed calculated points with real ones; (b) drip point located in the hump area or central part of the bison.
Remotesensing 16 00197 g009
Figure 10. (a) General view of the 3D model of basins in Polychrome Hall ceiling showing the basins, streams and drip points; (b) Detail view of the model shown in Figure 9.
Remotesensing 16 00197 g010
Figure 11. (a) Cross section showing the main vertical discontinuities in the overlying Polychrome Hall layer obtained by precise georeferencing of the inner reflection profiles D6-T1, D6-T2, D6-T3 and D6-T4 and the outer reflection profile T106; (b) Cross section with the instantaneous magnitude attribute derived from these refraction profiles shows the main areas of moisture/water infiltration or water pathways in the overlying Polychrome Hall layer. The central fracture can be seen to run from the lapiés zone (fissured layer) to the basal surface of the Polychrome layer (indicated by the red dashed line). The surface sinks coinciding with or close to the layout of these reflection profiles have been plotted (indicated by ochre triangles). Also shown are the signal attenuation zone with the 400 MHz antenna and the correlation of the reflection profiles with the stratigraphic units of the overlying layer of the Polychrome Hall.
Remotesensing 16 00197 g011aRemotesensing 16 00197 g011b
Disclaimer/Publisher’s Note: The statements, opinions and data contained in all publications are solely those of the individual author(s) and contributor(s) and not of MDPI and/or the editor(s). MDPI and/or the editor(s) disclaim responsibility for any injury to people or property resulting from any ideas, methods, instructions or products referred to in the content.