Abstract
Climate change mitigation requires countries to report their annual greenhouse gas (GHG) emissions and sinks, including those from land use, land use change, and forestry (LULUCF). In Finland, the LULUCF sector plays a crucial role in achieving net-zero GHG emissions, as the sector is expected to be a net sink. However, accurate estimates of LULUCF-related GHG emissions, such as methane (CH), remain challenging. We estimated LULUCF-related CH emissions in Finland in 2013–2020 by combining national land cover and remote-sensed surface wetness data with CH emissions estimated by an inversion model. According to our inversion model, most of Finland’s CH emissions were attributed to natural sources such as open pristine peatlands. However, our research indicated that forests with thin tree cover surrounding open peatlands may also be a significant source of CH. Unlike open pristine peatlands and pristine peatlands with thin tree cover, surrounding transient forests are included in the Finnish GHG inventory if they meet the criteria used for forest land. The current Finnish national GHG inventory may therefore underestimate CH emissions from forested organic soils surrounding open peatlands, although more precise methods and data are needed to verify this. Given the potential impact on net GHG emissions, CH emissions from transitional forests on organic soils should be further investigated. Furthermore, the results demonstrate the potential of combining atmospheric inversion modelling of GHGs with diverse data sources and highlight the need for methods to more easily combine atmospheric inversions with national GHG inventories.
1. Introduction
To mitigate climate change, countries are committed to reporting their annual greenhouse gas (GHG) emissions and sinks from different sectors, including land use, land use change, and forestry (LULUCF) [1,2]. In Finland, the LULUCF sector plays an essential role in the efforts to achieve net zero greenhouse gas emissions, as the national climate and energy strategy relies on the LULUCF sector being a net sink [3,4]. This has been the case, but due to continued extensive logging, a decline in tree growth, and increased emissions from organic soils, the LULUCF sector in Finland was a net source for the first time in 2021 [5,6].
Concerning LULUCF GHG emissions and their uncertainties, peatlands are particularly relevant, as they contain a significant amount of carbon and the dynamics of CH and CO fluxes are complex. More than half (56%) of Finland’s 10.2 million hectares of peatlands were drained in the mid-1900s for wood production, and together with other exploitation of peatlands, this has reduced the total carbon storage in peat by 3–10% in Finland [7]. Drained peatland mainly emits CO from peat decomposition, but the ecosystem can also act as a carbon sink if it is rich in growing-phase trees that store carbon [6,8], though wet ditches can partly offset the carbon uptake due to CH emissions [9]. In contrast, even though undrained open pristine and restored water-logged peatlands accumulate carbon and, thus, may eventually become carbon sinks, they emit CH, which is a more potent greenhouse gas than CO.
Open pristine wetlands are often surrounded by managed forests and an intermediate zone with low tree cover, for which emissions and sinks are included in the Finnish national GHG inventory if they meet the criteria of a forest. The transitional woodland area between the forest and the open peatland can already be a notable source of CH [10,11,12]. In addition, mineral soils, which are usually a sink for CH, may emit CH if they are wet enough [13]. This leads to the possibility of underestimated CH emissions in current national greenhouse gas inventories.
The known uncertainties in national LULUCF CH inventories highlight the need for independent methods to verify the reported CH emissions [14,15]. Atmospheric inversion models have proven useful in estimating global and regional GHG budgets [16] and have been used to validate national GHG inventories [17,18]. The atmospheric inversion models combine bottom-up emission estimates and atmospheric transport models with observed atmospheric concentrations to estimate the spatial and temporal distribution of CH sources and sinks. The observed atmospheric concentrations are an integrated product of several factors, including human activities, natural fluxes, atmospheric transport, and atmospheric and land sinks. The inverse models use this information and their uncertainties to refine the bottom-up emission estimates used as priors [19].
The inversion models are best at estimating a total budget for a GHG, but further decomposition into emission sectors is more complicated. The inversion model used in this study, CarbonTracker Europe—CH [20], optimises two emission sources, anthropogenic and natural, separately but simultaneously. The main anthropogenic CH emission sources in Finland belong to the inventory sectors of agriculture, waste, and energy. CH emissions from industrial processes are negligible but are also included in the anthropogenic emissions. The fifth reported emission sector is LULUCF, but although LULUCF CH emissions are included in the national GHG inventories, they are not included in the anthropogenic inventory estimates used in the inversion model. Furthermore, since LULUCF CH emissions have a peatland-related origin, their spatial distribution coincides with natural CH emissions. Thus, it is expected that the inversion model will mainly classify LULUCF CH emissions in the same category as open pristine peatland emissions. This collocation of different types of emission sources requires us to develop advanced approaches to distinguish LULUCF CH emissions: emissions that are classified as anthropogenic but have a natural origin.
Although inversion models are a promising tool for verifying national GHG inventories, several issues remain to be resolved before their emission estimates can be compared with the inventories. A critical factor is the availability of concentration observations, both spatially and temporally. Earth observation satellites, such as Sentinel-5P/TROPOMI, have the potential to become a valuable source of observations as they cover the globe within days at a higher resolution than current global inversion models. However, the use of such observations is not straightforward, especially in the northern high latitudes, as TROPOMI observations have been shown to have a bias in the high northern latitudes and also the temporal availability is limited due to the polar night [21,22]. As Finland has a relatively dense in situ observing network with six stations from south to north, Finland represents a good case study of what current inversion models can resolve using surface observations.
The aim of this study is to investigate the correlation between CH emissions and the LULUCF sector as well as different land use categories in Finland and to determine whether it is possible to extract this information from the inversion results. We combine national and remote sensing data with an advanced inversion model and statistical methods to estimate LULUCF-related CH emissions in Finland in 2013–2020. The inversion model setup of CarbonTracker Europe—CH is selected as the most suitable option for optimising emissions in Finland. As an anthropogenic prior, we use the CAMS-REG inventory, which utilizes national GHG inventories, and redistributes these CH emissions over Finland based on statistics collected and reported by Statistics Finland. As a natural prior, emission estimates from two ecosystem models, JSBACH-HIMMELI and LPX-Bern DYPTOP, are used. The study is divided into three sections. First, the spatial distribution of CH emissions, optimised by inversion, is analysed in together with the annual totals from 2013–2020. Secondly, the optimised CH emission estimates from the inversion model are divided into the Corine land cover classes [23]. Elevated CH emissions are observed in the land cover classes ‘Wetlands, Open bog’ and ‘Transitional woodland, peat’ in comparison to other Corine land cover classes. Therefore, the final part focuses on further investigating the relationship between these classes and CH emissions using the remotely sensed surface water and wetness product, Copernicus Water and Wetness 2018 [24]. We do not focus on how environmental factors affect CH emissions but concentrate on the land cover types that emit CH.
2. Materials and Methods
2.1. Finland’s Landscape
Finland is a country in northern Europe with a diverse landscape that includes forests and open peatlands. Of the total land area of 26.3 million hectares, approximately 86% is used for forestry, with peatlands accounting for one-third of this area [25]. Finland’s peatlands can be roughly divided into raised bogs in the south and northern aapamire (fen) zones [26]. Notably, more than 50% of the peatland area has been drained, with more intensive draining observed in southern Finland, where 88–90% of the peatland area has been affected, compared to less than a quarter in Lapland [7]. Population density also differs between the south and the north, as most Finns live in the south. The five largest southern municipalities (Helsinki, Espoo, Tampere, Vantaa, and Turku) alone account for almost a third (30%) of the population [27].
These regional differences influence the sources of CH emissions in Finland. Most anthropogenic CH emissions come from the south, where most people and agricultural activities are located. On the other hand, most natural CH emissions come from the north, where there are large areas of open pristine peatlands (Figure 1 and Figure 2).
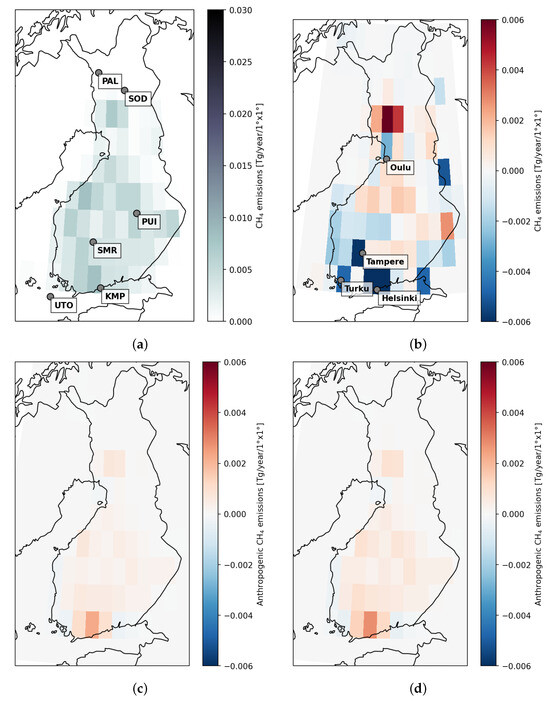
Figure 1.
Annual average from 2013–2020 of (a) the redistributed CAMS-REG CH emissions, (b) the difference between the redistributed CAMS-REG and the original CAMS-REG, (c) the difference between the optimised anthropogenic CH emissions from Inv and the redistributed CAMS-REG emissions, and (d) the difference between the optimised anthropogenic CH emissions from Inv and the redistributed CAMS-REG emissions. The location of Finnish measurement sites are shown in (a) and the location of four large cities in Finland in (b).
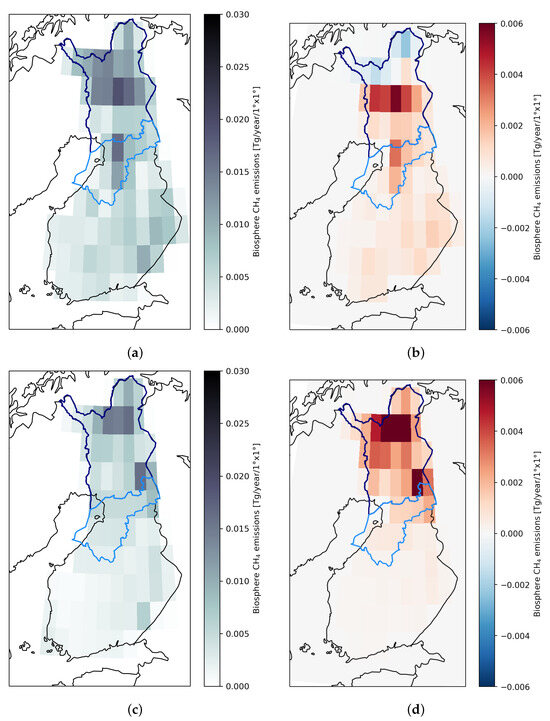
Figure 2.
Annual average from 2013–2020 of (a) the optimised natural CH emissions from Inv, (b) the difference between the optimised and the prior (JSBACH) natural CH emissions from Inv, (c) the optimised natural CH emissions from Inv, (d) the difference between the optimised and the prior (LPX) natural CH emissions from Inv. The region North Ostrobothnia is shown with a light blue borderline and Lapland is shown with a dark blue borderline.
2.2. Atmospheric Inversion Model CarbonTracker Europe—CH
In this study, we used the atmospheric inverse model Carbon Tracker Europe—CH (CTE-CH, [20]) which estimated CH emissions at a 1° × 1° (about 110 km × 40–60 km in Finland) resolution over the high northern latitudes using in situ measurements of atmospheric CH concentrations. The system consisted of prior flux maps (the “first guess” of the emissions) for different emission sources, an atmospheric chemistry transport model TM5 [28], and an ensemble Kalman filter data assimilation scheme [29,30] with an ensemble size of 500 and a 5-week lag. TM5 was run at a global horizontal resolution of 4° × 6° (latitude × longitude) with a 1° × 1° zoom and a 2° × 3° intermediate zoom around the 1° × 1° zoom grid over Europe (see [31]), constrained by 3-hourly ECMWF ERA5 meteorological data [32]. The vertical direction was divided into 25 hybrid sigma pressure levels from the surface to the top of the atmosphere. The monthly atmospheric sink due to photochemical reactions with OH, Cl, and O(D) was accounted for based on Houweling et al. (2014) [33] and Brühl and Crutzen (1993) [34]. The inversion model did not take into account year-to-year variations in atmospheric sinks and did not optimise atmospheric sinks.
We used observations from a global in situ measurement network including the NOAA GLOBALVIEWplus ObsPack v3.0 dataset [35] and the observations provided by the National Institute for Environmental Studies (JR-STATION: Japan–Russia Siberian Tall Tower Inland Observation Network, Ver1.2 [36]) and the Finnish Meteorological Institute [31]. We used observations from six Finnish sites covering the whole of Finland from south to north (locations in Figure 1a and observations in Supplementary Figure S2). Two of the Finnish sites were located in urban areas, three in natural areas and one in an oceanic area. Globally, there were 174 stations altogether in 2013–2020 (see Supplementary Figure S1 for the location of the sites). The list of Finnish sites can be found in Supplementary Table S1 and others in Table S2. The data included weekly discrete air samples as well as hourly continuous measurements. The data were filtered according to the institutions’ quality flags. Only data points representing well-mixed conditions were used: the hourly continuous observations were pre-processed to daily averages by averaging from 12 to 4 pm local time, except for the high mountain sites, from which averages were taken from 0 to 4 am local time, similar to Tsuruta et al. (2017) [20]. The observation uncertainties (also called model–data mismatch [37]) were defined for each site based on site characteristics and measurement accuracy adapted from previous studies [20,31,37], and they also reflected the ability of the model to forecast the atmospheric concentrations. The observational uncertainty ranged from 4.5 to 75 ppb among the global sites and from 15 to 30 ppb among the Finnish sites.
We simultaneously optimised anthropogenic and natural fluxes at a resolution of 1° × 1° over Canada, the USA, Europe and Russia, and regionally elsewhere (Supplementary Figure S1). The prior uncertainties for the anthropogenic and natural fluxes were set at 80% for land fluxes and 20% for ocean fluxes and assumed to be uncorrelated. The spatial correlation was defined by an exponential decay [30], with a correlation length of 100 km between the 1° × 1° grid-based optimisation domains, 500 km over other land domains, and 900 km over ocean domains. The inversion model runs started at the beginning of 2004, but only values from 2013 on were examined here. In this study, the weekly CTE-CH emission estimates were aggregated to annual or summer (June–September) values for the years 2013–2020.
2.3. Prior Emissions
Atmospheric inversion models rely on atmospheric data to estimate the sources and sinks of greenhouse gases. However, these data have limited spatial or temporal coverage, making the inversion problem ill-posed. Thus, prior information, which provides estimates of the sources and sinks of methane emissions, is needed to constrain the inversion problem.
As an anthropogenic prior, we used a combination of a European CAMS-REG-v4 CH emissions inventory [38] and a global EDGAR6 inventory [39]. In Finland, the CAMS-REG emissions were redistributed based on Statistics Finland’s national GHG inventories of livestock and landfill distributions (see details in Section 2.3.1). For natural a priori, we used estimates from two ecosystem models: JSBACH-HIMMELI [40,41] and LPX-Bern DYPTOP version 1.4 [42,43,44,45]. For other a priori sources, we used estimates from GFED v4.1s [46] for fire, VISIT [47] for termites, and those calculated based on ECMWF data for ocean sources [20]. Average total prior CH emissions were globally 503 Tg/year with JSBACH-HIMMELI-HIMMELI and 496 with LPX-Bern DYPTOP and in Finland 0.57 Tg/year with JSBACH-HIMMELI and 0.38 Tg/year with LPX-Bern DYPTOP.
The emission estimates from JSBACH-HIMMELI used as a natural prior are called JSBACH from now on, and the optimised CH emissions with JSBACH are referred to as Inv. Similarly, emissions from LPX-Bern DYPTOP used as a natural prior are called LPX, and the optimised emissions with it are referred to as Inv.
2.3.1. Anthropogenic
The CAMS-REG-v4 inventory is a European high-resolution anthropogenic emission inventory. It aggregates officially reported national emissions and distributes the country’s total emissions based on multiple proxies depending on the source. The LULUCF CH emissions are not included in the CAMS-REG. To obtain the most up-to-date CH prior emission estimates in Finland, we redistributed the CAMS-REG CH emissions over Finland based on statistics collected and reported by Statistics Finland, similarly to Tsuruta et al. [31]. The agricultural livestock emissions were redistributed based on the number of cows in each municipality. Waste emissions were also distributed based on solid waste disposal and wastewater CH emissions at the municipality level. The redistribution was performed at a 0.1° × 0.1° resolution and converted afterwards to a 1° × 1° resolution for inversion modelling.
2.3.2. Natural
The natural prior emissions were obtained from two ecosystem models: JSBACH-HIMMELI and LPX-Bern DYPTOP v1.4. They include CH emissions from peatlands and mineral lands. In JSBACH-HIMMELI, the division between peatlands and mineral lands is based on Corine Land Cover Classification, with peatlands referring to open bogs and inland marshes and mineral lands to all other lands, including managed and unmanaged forest and non-forest lands. Mineral lands act as a sink of CH if the soil is dry but emit CH if the average soil moisture in a grid cell is high enough. Anoxic organic soil conditions and carbon input from vegetation induce CH emissions in peatlands. The short-term emission variation is driven by soil water table level and temperature. Emissions from peatlands are much higher per unit area than those from mineral lands, but the small areal cover of peatlands may result in lower total emissions than emissions from mineral lands. In Finland, JSBACH-HIMMELI’s peatland emissions strongly dominate over mineral land emissions. LPX-Bern DYPTOP simulates the development of peatlands using a topography-driven approach. LPX-Bern DYPTOP also simulates the sources and sinks at mineral lands similarly to JSBACH-HIMMELI, as well as emissions from inundated lands.
2.4. Methane Emission Estimates of the Finnish GHG Inventory
Finnish national anthropogenic CH emissions are reported annually by Statistics Finland and include emissions from the agriculture, waste, energy, and industry sectors as well as the LULUCF emissions and removals [6]. The reporting follows the IPCC 2006 reporting guidelines with the 2019 refinement [48]. The agriculture sector was the largest CH sector in the national inventory during the study period 2013–2020. The majority of agricultural CH emissions came from the enteric fermentation of domestic animals. The second largest CH sector was the waste sector. It was the only sector which showed a notable decrease in CH emissions during the study period. The energy sector was the second smallest and included CH emissions mainly from incomplete combustion of wood fuels and fugitive CH emissions from natural gas. CH emissions from the industrial processes and product use sector were negligible.
The LULUCF sector included CH emissions from drained organic forest soils and managed wetlands, i.e., peat extraction sites and land converted to inland water or other wetlands. CH emissions from organic forest soils were mainly from ditches (on average 0.023 Tg/year from ditches and 0.005 Tg/year from forest soils), although ditches accounted for only 2.5% of the drained forest area [6,49]. While CH emissions from forest soils were calculated based on country-specific emission factors [8], which also took into account the state of drainage (poorly or recently drained land and also net uptake for well-drained land), CH emissions from ditches were based on emission factors given in the IPCC Wetlands Supplement [49]. The emissions from managed wetlands were only about 3% of those from forests and came mostly from peat extraction sites.
2.5. Land Cover Classification Map
Corine Land Cover (CLC) classification [50] is a pan-European land cover and land use classification which is produced as part of the European Copernicus Land Monitoring programme led by the European Environment Agency. Finnish Environment Centre SYKE led the production of the Finnish national Corine Land Cover classification in 2000, 2006, 2012, and 2018. It is based on combining the interpretation of land cover from satellite images and information about land use from different spatial databases, such as a topographic database of the Finnish National Land Survey.
The latest CLC classification was made in 2018, and its national raster version consists of 49 land cover and land use classes with a 20 m pixel size. Mapping changes between the years 2012–2018 were performed with a 0.5 ha minimum mapping unit. The Finnish CLC has been generalised according to European CLC specifications [50], resulting in vector data with a 25 ha minimum mapping unit, a 100-meter minimum width, and 44 classes [23,51,52].
The land cover and LULUCF data used here were based on the Finnish national Corine Land Cover 2018. Afforestation or deforestation of forests was acquired using Finnish CLC Changes 2012–2018. The five main classes (Settlement, Agricultural lands, Forest land, Wetlands and Water) were further divided based on the underlying soil type to mineral and peat land. The soil types of agricultural areas were based on the Finnish Soil Database. The land cover and land use classes with their proportional shares used in this study were
- Settlement (2.4%)
- Agricultural lands, mineral soil (5.7%)
- Agricultural lands, peat (0.7%)
- Forest land, mineral soil (33.1%)
- Forest land, peat (11.1%)
- Forest land, afforested mineral soil (10.3%)
- Forest land, afforested peat (<0.0%)
- Transitional woodland (tree crown cover 10–30%), mineral soil (4.4%)
- Transitional woodland, peat (2.2%)
- Transitional woodland, deforested (<0.0%)
- Transitional woodland, peat, deforested (0.2%)
- Open mineral soil (tree crown cover < 10%) (5.1%)
- Wetlands, Marsh (0.2%)
- Wetlands, Open bogs (5.1%)
- Wetlands, peat production (0.3%)
- Water (sea, lake, river) (19.4%)
The proportions of different classes were computed for 10 km × 10 km grids, because the inverse modelling system used a much larger grid size (1° × 1°) than the 20-meter pixel size of Finnish CLC.
It is important to recognise the difference between CLC and the classifications used in the Finnish national GHG inventory to estimate LULUCF GHG emissions. While CLC describes the current situation (e.g., tree cover) in a given period, the national GHG inventory also relies on knowledge of land use. Thus, land classified as ‘Forest’ remains ‘Forest’ even if it is temporarily unstocked as a result of human intervention or natural causes, but is expected to revert to forest [6].
2.6. Copernicus Water and Wetness
Copernicus High-Resolution Layers [53] provide information on specific land cover characteristics and are complementary to land cover data. The High-Resolution Layer Water and Wetness (WAW, version 2.0) [24] describes the occurrence of water and wet surfaces over the period 2009–2018, and it is based on an analysis of long-term optical and microwave satellite imagery. The product is part of the Copernicus Land Monitoring Service, which provides geographical information on land cover and its changes, land use, vegetation state, water cycle, and earth surface energy variables over Europe [24].
The Copernicus WAW contains four wetness classes: permanent water, temporary water, permanent wet, and temporary wet. Considering CH emissions, the class ‘permanent wet’ is the most relevant because it corresponds to Finnish bogs the best [54]. The class ‘temporary wet’ could also contain information on whether forests on peat would be wet enough to emit CH. Unfortunately, the dataset is unreliable over Finland [54] as it categorizes the northern fells as ‘temporary wet’ and has a large data gap over middle Finland. The spatial resolution of the Copernicus WAW is 10 m × 10 m, but it was aggregated here to the resolution of 1° × 1° by computing the proportion of the ‘permanent wet’ class.
2.7. Using Linear Regression to Estimate LULUCF Methane Emissions
Even though the resolution of CTE-CH is high over Finland (approximately 110 km × 40–60 km) compared to other global inversion models [55], its resolution is still coarse compared to the heterogeneous landscape in Finland (see e.g., [56]) and to the resolution of the land cover map (20 m × 20 m). To detect LULUCF-related CH emissions from the inversion model estimates, we trained an ordinary least squares linear regression model [57] with annual natural and anthropogenic CH emission estimates from Inv and Inv. The training was conducted at a resolution of 10 km × 10 km which was between the resolutions of CTE-CH and land cover maps. If the training had been at the resolution of 1° × 1°, there would have been too many different land cover classes in each grid cell (see Supplement Figure S8 for the 1° × 1° land cover correlations). A higher resolution than 10 km × 10 km would have meant that different land cover classes would have connected with the same CH emissions.
The fraction of each land cover class was calculated at 10 km × 10 km and land cover classes with a larger total area than 755 km (0.2% of the total area of Finland in the Corine land cover map) were used as explanatory variables in the model training. The excluded classes were ‘Forest land, afforested peat’, ‘Transitional woodland, deforested’, ‘Transitional woodland, peat, deforested’, and ‘Wetlands, Marsh’. The exclusion was performed to streamline the analysis since it was expected that the listed classes would not have resulted in reliable results given the large difference between the resolution of the inversions and the land cover map.
The annual CH emissions were resampled to a resolution of 10 km × 10 km in a unit of g/m/year using the kd-tree nearest neighbour approach in a Python package called pyresample [58]. The resampled CH emissions were then used as the response values in the linear regression model. With the trained model we estimated the annual emissions for a hypothetical grid cell that would have been occupied by only one land cover class, i.e., we took the fitted coefficient of the land cover class summed with the intercept term as the estimate of CH for that land cover class. The model was trained and emissions per land cover class were estimated separately with natural, anthropogenic, and total posterior CH emission estimates to assess whether different land cover classes would stand out from the rest depending on the CH source. As the land cover map extended over the whole study period and did not include interannual variability, the training and prediction of CH emissions was conducted separately for each year 2013–2020 using CH emission estimates from the corresponding year, but using the same land cover map for each year to estimate the range of annual variation in CH emissions.
3. Results
3.1. Spatial and Annual Methane Emission Estimates in Finland
The annual averages of the redistributed CAMS-REG CH emissions based on Finnish spatial anthropogenic activity data were more uniformly distributed than the original CAMS-REG CH emissions (Figure 1a). High values in the coastal area and near large cities in Finland (Helsinki, Tampere, Turku, and Oulu) (Figure 1b), were decreased, and the excess emissions from the aforementioned regions were relocated to Lapland and central Finland. When the redistributed CAMS-REG CH emissions were optimised with CTE-CH, the changes were reinforced further, i.e., emissions in the coastal areas decreased and those in Lapland increased (Figure 1c,d). Southernmost Finland was an exception: the optimisation increased the anthropogenic emissions around Helsinki. The differences between the optimised estimates of the anthropogenic emissions and the redistributed CAMS-REG emissions used as the anthropogenic prior were similar, regardless of whether we used LPX or JSBACH as the natural prior, although the absolute increase in the optimised anthropogenic emissions was larger when LPX was used. The absolute magnitude of the CAMS-REG CH and the optimised anthropogenic CH emissions from Inv and in Inv can be seen in the Supplementary Figure S3.
Natural CH emissions increased in the optimisation in general throughout Finland both in Inv and in Inv (Figure 2). Only emissions in the northernmost Lapland were reduced from JSBACH on average. Otherwise, in Lapland, where optimisation also increased anthropogenic CH emissions, the increase in the natural CH emission was the strongest, regardless of whether the natural prior was LPX or JSBACH. In central and southern Finland, JSBACH had larger natural emissions than LPX, and this difference was amplified further by the optimisation.
In line with the annual averages of anthropogenic emissions discussed above, annually calculated Finnish natural CH emissions were always higher than their priors in both Inv and Inv in 2013–2020 (Figure 3a). JSBACH was approximately twice as high as LPX, but optimisation reduced the difference between Inv and Inv to 1.6 times on average, as optimisation increased emissions from LPX more than from JSBACH. In 2016, there were high natural emissions, and particularly Inv emissions were increased from LPX. Inv also showed high emissions in 2020, but this was not seen in Inv, although Inv emissions were approximately constant during 2018–2020 while the emissions of the prior LPX decreased.
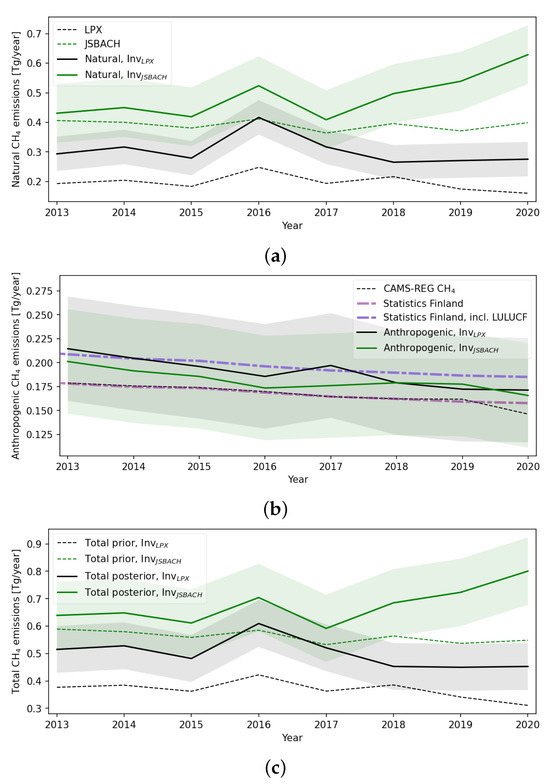
Figure 3.
Annual (a) natural, (b) anthropogenic, and (c) total CH emissions in Finland. The prior emissions from LPX and JSBACH are shown with dashed lines and the optimised posterior emissions are with solid lines. Shaded areas around posterior emissions show one standard deviation of the ensemble distributions. The CH emissions from the Finnish national inventory without and with LULUCF emissions reported by Statistics Finland also are shown with the anthropogenic emissions (b).
Both the anthropogenic inventories and the inversion estimates of anthropogenic CH emissions decreased in Finland during the study period 2013–2020 (Figure 3b) but they had small differences in their magnitudes. The emission estimates from CAMS-REG were the same as the Statistics Finland emissions, as CAMS-REG used the national inventories in their estimations. The posterior emissions were increased from CAMS-REG and were also close to or higher than the Statistics Finland emission estimates with the LULUCF emissions. Nonetheless, the inventory estimates were within the uncertainties of the inversions. The optimised anthropogenic emissions of Inv were higher than in Inv until 2017, after which Inv and Inv agreed well with each other.
In the optimised CH emissions, LULUCF CH emissions were probably mostly included in the natural emissions and not in the anthropogenic emissions since the location of LULUCF CH emissions coincided with the wetland emissions and the LULUCF emissions were not included in CAMS-REG CH inventory (see also Section 3.2). The natural emissions of Inv were 15 times higher and those of Inv were 10 times higher on average than the reported LULUCF CH emissions (0.03 Tg/year on average) which was expected, as the natural emissions included CH emissions from open pristine peatlands, which are an important source of CH in Finland. The difference between natural posterior and prior CH emissions was 0.1 Tg/year on average for both JSBACH and LPX, which is over three times higher than the reported LULUCF CH emissions. Although the ecosystem models might have underestimated the emissions from open pristine peatlands, this difference could also be because the LULUCF emissions are not accounted for in the CAMS-REG inventory.
Total CH emissions were higher in Inv ( Tg/year on average) than in Inv ( Tg/year on average) as seen in Figure 3c. The annual variation, as well as the difference between the total emissions in Inv and Inv, were due to the changes in the estimated natural emissions since natural emissions and their variation were larger than anthropogenic emissions.
3.2. Methane Emissions by Land Cover Class Estimated with Linear Regression
When linear regression was used to estimate the CH emissions by a land cover class using the optimised annual natural CH emission estimates in Finland, the two inversions, Inv and Inv, mostly agreed (Figure 4). The results with natural prior emissions, JSBACH and LPX, are shown in Supplementary Figure S4. The results were similar to those with the optimised emissions, although the differences between different land cover classes are larger with the optimised emissions (i.e., classes with high estimated emissions with the prior emissions had even higher emissions with the posterior, and land cover classes estimated as sinks had even larger sinks with the posterior). The two land cover classes with the highest predicted natural emissions were ‘Transitional woodland, peat’ and ‘Wetland, Open bogs’. These two classes also showed a high correlation with each other (see Figure 5), meaning that many grid cells contained both land cover types. Two other land cover classes, ‘Forest land, peat’ and ‘Forest land, mineral’, also had high spatial correlations with ‘Wetland, Open bogs’ but these two classes did not have high estimated CH emissions. In addition, linear regression predicted a CH sink for transitional woodland mineral soil. This was more pronounced with Inv than with Inv.
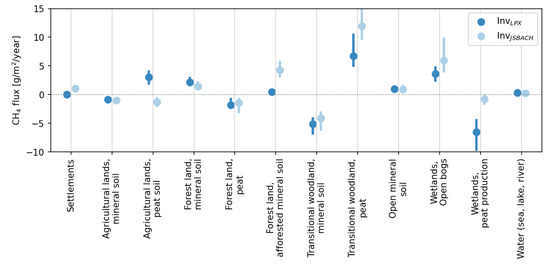
Figure 4.
The range of the annual natural CH fluxes (2013–2020) for selected land cover classes estimated with linear regression using optimised natural CH emissions from Inv and Inv.
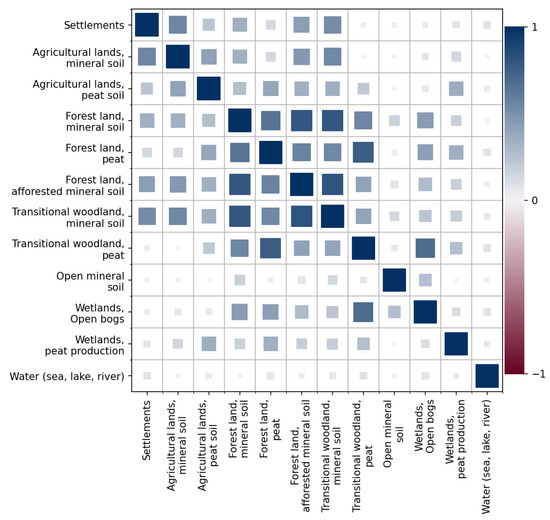
Figure 5.
Pairwise Pearson correlation coefficient of the selected Corine land cover classes at a resolution of 10 km × 10 km in Finland. The colour of a square is related to the correlation coefficient and the size to the absolute value of the coefficient: a value of one (or minus one) would fill the cell completely and zero would mean that there would be no square. The correlation corresponds to whether many grid cells contain both land cover types.
The natural annual CH emissions were also decomposed to different land cover classes using the original inversion model resolution of 1° × 1° and the relative magnitude of the land cover classes (Supplementary Section S1) and the machine learning method called XGBoost [59] (Supplementary Section S2(). Based on these methods, higher average CH emissions were also found for the land cover classes ‘Transitional Forest, Peatland’ and ‘Wetland, Open Bog’ (see Supplementary Figures S4 and S8).
When the linear regression model was trained with annual anthropogenic CH emissions, ‘Agricultural lands, peat soil’ and ‘Wetland, peat production’ were the most prominent classes (Figure 6). Predicted emissions in other classes were close to zero, with ‘Settlements’ showing a bit larger emissions. In the anthropogenic prior, CAMS-REG CH, the largest Finnish sources were landfills and agricultural activities, i.e., mainly livestock-related emissions. Landfills are typically located near the settlements whereas livestock stroll on agricultural lands. Thus, the location of these sources and the land cover classes highlighted by the statistical method agreed well. However, these sources are not part of the LULUCF sector and are GHG inventory categories on their own.
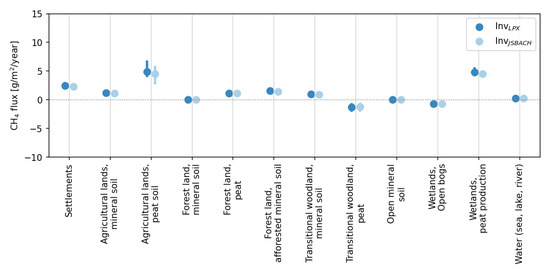
Figure 6.
The range of annual anthropogenic CH fluxes (2013–2020) for selected land cover classes estimated with linear regression using optimised anthropogenic CH emissions from Inv and Inv.
The predicted CH emissions trained with annual total emissions resembled the combination of the natural and anthropogenic emission results (Figure 7): the natural and anthropogenic sources listed above (‘Transitional woodland, peat’, ‘Wetland, Open bogs’ and ‘Agricultural lands, peat soil’) were elevated from the rest of the land cover classes. This further affirms that the linear regression model was able to detect the relevant land cover types related to CH sources and sinks.
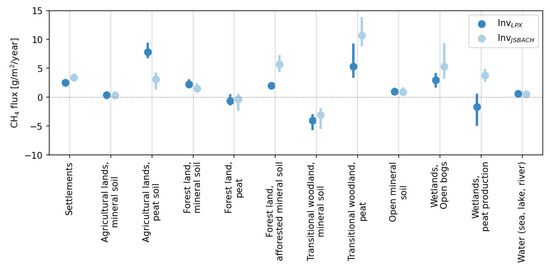
Figure 7.
The range of annual total CH fluxes (2013–2020) for selected land cover classes estimated with linear regression using optimised total CH emissions from Inv and Inv.
Since livestock-related CH emissions belong to the agriculture sector and not to LULUCF emissions, the emissions in ‘Transitional woodland, peat’ and ‘Wetland, Open bogs’ are the most interesting to study further.
3.3. Comparison with Land Cover Classes and Remote Sensing Wetness Map
Distribution maps of the land cover classes ‘Transitional woodland, peat’ and ‘Wetland, Open bogs’ are shown in Figure 8. As already stated, the two land cover classes were located in the same areas as the spatial correlation between the two classes was high (Figure 5). Their distributions nonetheless varied since ‘Wetland, Open bogs’ was often the dominating land cover class in northern Finland, whereas the extent of ‘Transitional woodland, peat’ was smaller (Figure 8). To study further the potentiality of the two land cover classes, ‘Wetland, Open bogs’ and ‘Transitional woodland, peat’, being significant CH sources, we used the category ‘permanent wet’ from the Copernicus Water and Wetness dataset, as it is meant to represent open peatlands the best. The comparison with the Copernicus WAW and CH emissions was made in a 1° × 1° resolution.
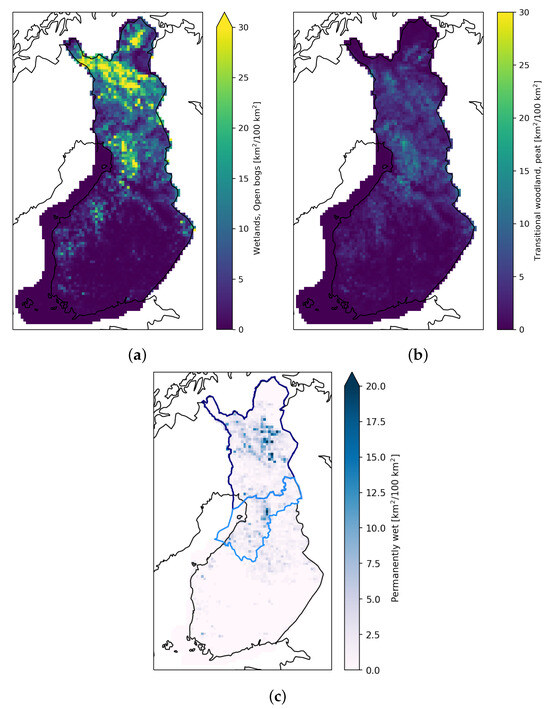
Figure 8.
Extent in a 10 km × 10 km resolution of (a) land cover class ‘Wetland, Open bogs’ in 2013–2018, (b) land cover class ‘Transitional woodland, peat’ in 2013–2018 and (c) Copernicus Water and Wetness, ‘permanent wet’ in 2009–2018. The region North Ostrobothnia is shown with a light blue borderline and Lapland is shown with a dark blue borderline.
Figure 9 shows the relationship between average summer (June–September) natural emission estimates and the extent of ‘Wetland, Open bogs’ in Finland. The correlation was stronger with the emission estimates of Inv than with Inv but in both inversions, the correlation strengthened notably after the optimisation, i.e., correlations were stronger with posterior emission estimates than with prior emissions. Figure 9 also shows the relationships between the extent of Copernicus WAW “permanent wet” and the aforementioned variables. It seems that grid cells, where the permanent wet area was the largest, had also the highest natural CH emissions and that emissions were increased from prior to posterior more in general if the grid cell was wet. The correlation between the extent of ‘permanent wet’ and ‘Wetlands, Open bog’ was also high ().
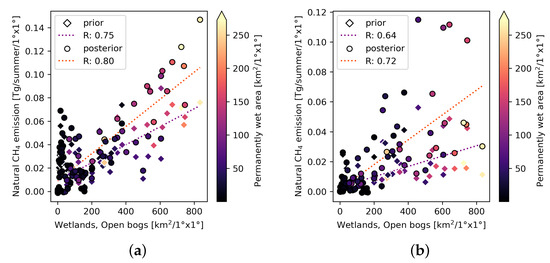
Figure 9.
Scatter plots of the average natural summer CH emissions in Finland from 2013–2020 estimated with (a) Inv and (b) Inv and extents of the land cover class ‘Wetland, Open bogs’. Diamonds show the prior emissions and circles show the optimised emissions. Dashed lines are ordinary least squares linear fits: yellow with the prior and blue with the optimised emission estimates. Their Pearson correlations are shown in the legends. The colours of the markers show the extent of the permanent wet area in a given grid cell according to the Copernicus WAW.
When the relationships between the natural CH emission estimates, the Copernicus WAW ‘permanent wet’ classification and the extent of the land cover class ‘Transitional woodland, peat’ were studied in the same manner, the correlations were weaker compared to those with an open bog, but they were still reasonable. (Figure 10). The Pearson correlation coefficient between ‘Transitional woodland, peat’ and ‘permanent wet’ was . Correlation between ‘Transitional woodland, peat’ and natural CH emission estimates from Inv was again higher than with estimates from Inv. The highest emission estimates were in grid cells where the extent of ‘Transitional woodland, peat’ was average; however, these grid cells were also wet according to Copernicus WAW ‘permanent wet’.
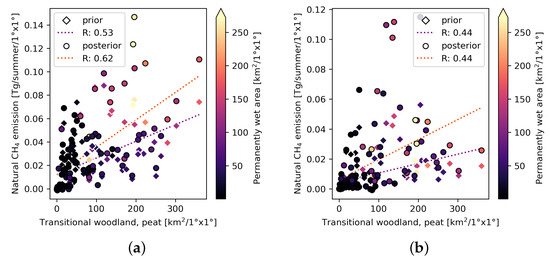
Figure 10.
Scatter plots of the average natural summer CH emissions in Finland from 2013–2020 estimated with (a) Inv and (b) Inv and extents of the land cover class ‘Transitional woodland, peat’. Diamonds show the prior emissions and circles show the optimised emissions. Dashed lines are ordinary least squares linear fits: yellow with the prior and blue with the optimised emission estimates. Their Pearson correlations are shown in the legends. The colours of the markers show the extent of the permanent wet area in a given grid cell according to the Copernicus WAW.
4. Discussion
We developed an inversion system to estimate CH emissions at the national scale in Finland. Together with a Corine land cover map and statistical analysis, we identified the land cover classes associated with the largest CH emissions. Interestingly, emissions categorized as natural by the inversion model were contributed not only to open pristine peatlands (‘Wetland, Open bogs’) but also to ‘Transitional woodland, peat’. The class ‘Wetland, Open bogs’ includes areas with open peatlands and peatlands with tree cover less than 10%. ‘Transitional woodland, peat’, on the other hand, includes forest land on peat where tree cover is between 10% and 30%, which is often located between open peatlands and forest. Unlike the emissions from open pristine peatlands, these identified emissions from the transitional woodlands might belong to LULUCF emissions in Finland and thus to the Finnish national GHG inventory.
In an inversion model system, the distributions of the posterior emissions can be strongly coupled to the distributions of prior emissions. In this study, it was also seen that the distributions of the natural posterior CH emission estimates followed those of the natural prior emissions in both Inv and Inv. The CH emissions were increased from the prior, except for northernmost Finland in Inv, where emissions decreased from JSBACH. Thus, the uncertainties in the prior emission distributions contributed to the posterior emission uncertainties. To assess the uncertainties in the natural emissions, we used emissions from two different ecosystem models as the natural prior to obtaining a range of optimised estimates. JSBACH-HIMMELI has also been developed specifically for northern ecosystems [60], making it suitable for modelling CH emissions in Finland. As an anthropogenic prior, we used the CAMS-REG inventory, which uses nationally reported data and distributions from Finnish experts responsible for reporting the Finnish GHG inventory.
The CH emissions contributed to different land cover types with linear regression results that were similar between the two inversions used: Inv and Inv. The most noticeable difference was for the class ‘Agricultural lands, peat soil’, as the emissions were highest from ‘Agricultural lands, peat soil’ with the total Inv, while the largest class with the total Inv was ‘Transitional woodland, peat’. Nevertheless, for both inversions, the estimated emissions of ‘Agricultural lands, peat soil’ were larger with the anthropogenic than with the natural emission estimates emphasising their anthropogenic origin. In addition, the natural Inv posterior results were higher than the prior results (Supplementary Figure S4). Thus, the inversion model most likely misclassified some of the anthropogenic emissions as natural emissions when LPX was used. Agricultural lands coincide with livestock grazing lands, which is a likely cause of the high estimates.
A second difference was with ‘Wetlands, peat production’, which was a larger sink when using the natural Inv emissions than when using Inv. However, for both inversions, the contribution of anthropogenic CH emissions to ‘Wetlands, peat production’ was about the same as for ‘Agricultural lands, peat soil’. The two land cover types are located in the same regions and have a high correlation, especially at the 1° × 1° resolution (Supplementary Figure S8).
Copernicus WAW ‘permanent wet’ had the largest values in Lapland and North Ostrobothnia in 2009–2018 (Figure 8c). In these regions, the correlation of the extent of the land cover classes ‘Wetland, Open bogs’ and ‘Transitional woodland, peat’ was also high. However, the natural CH emission estimates in North Ostrobothnia were not notably higher in posteriors than in priors unlike in Lapland (Figure 2). This might have been due to low values in the prior emissions and their uncertainties (80% of the prior emission) which might have prevented optimisation of increasing emissions in the area. In particular, LPX had low values in North Ostrobothnia. In JSBACH, there were a couple of grid cells with higher CH emissions in North Ostrobothnia, and these grid cells also had high natural posterior emissions.
The land cover type ‘Forest land, peat’ was often located near ‘Transitional woodland, peat’ (Figure 5). This can be expected since the ‘Transitional woodland’ class includes forested areas with a canopy cover of 10–30% whereas ‘Forest’ had to have a canopy cover of more than 30%. As the ‘Transitional woodland’ was also collocated with ‘Wetland, Open bogs’, the correlations showed the spatial transition from forest to open peatland or from open peatland to forest. These correlations further confirmed that ‘Transitional woodland, peat’ is an area between forests and open peatlands, and that this relationship was also reserved after the downscaling of the land cover map from 20 m × 20 m to 10 km × 10 km. Thus, CH emissions from ‘Transitional woodland, peat’ might have been significant, especially since the pixels with high ‘Transitional woodland, peat’ extent were often defined as permanent wet by the Copernicus Water and Wetness data product, indicating wet soil [8].
The reported national LULUCF CH emissions were mainly from the drainage ditches (0.23 Tg CH/year, i.e., 76% of the total LULUCF CH budget), which were based on the IPCC reported emission factor (21.7 g/m/year) [6]. The emission factors used to calculate CH emissions from organic forest soils were country-specific and took into account whether drainage ditches were maintained or whether the water table level was similar to that of open pristine peatlands. If the ditches were maintained, the forest soil was counted as a CH sink (−0.28 g/m/year), and if they were in poor condition, an emission factor of 1.16 g/m/year was used, which is higher than the emission factor given in the IPCC Wetlands Supplement for the boreal forest (0.2–0.7 g/m/year) [6,49]. The absolute CH emissions given by linear regression are not directly comparable to the measured values since using the inversion model estimates in 10 km × 10 km made the statistical analysis more sensitive to the areas of the land cover classes. Thus, it is more meaningful to compare the relative proportions of the estimated CH emissions per land cover class. However, the CH emissions in ‘Transitional woodland, peat’ were estimated to be between 5 and 15 g/m/year, falling within the range of values for both forest soil and ditches.
The proximity of the land cover types ‘Transitional woodland, peat’ and ‘Wetland, open bogs’ complicated the separation of emission sources and increased uncertainty as to whether the estimated emissions from transitional woodland should have been included in the ‘Wetland, open bogs’ class, a known large CH source. Nonetheless, the predicted emissions from Inv and Inv were higher in transitional woodland than in peatland. Our results may indicate either unmaintained ditches or a natural transition zone between peatlands and forests where transitional forests near the peatlands occasionally flood and become a source. This raises the question of whether the CH emissions from transitional woodlands should be revised in the national GHG inventory. However, previous studies have suggested that transition zones have low emissions [10], while others have found emissions in the littoral zone around lakes [61].
We acknowledge that using only land cover classes in the linear regression to estimate LULUCF-related CH emissions is a simple method. CH emissions are influenced by not only land cover types but by meteorological factors, such as soil moisture and temperature. Since these factors vary seasonally, additional data sources and finer time scales should be used to study CH emissions more accurately with statistical analysis. However, our goal was not to create a universal model for predicting CH emissions based on land cover data but to analyse existing datasets and investigate potential connections between CH emissions and different land cover types within the LULUCF sector. Additionally, it is important to note that the land cover data used differs from the land cover data used in the LULUCF GHG emission estimates of the Finnish national GHG inventories. This difference is due to differences in their definitions: Corine land cover reflects the current state of the land area, while the national GHG inventory takes into account factors such as land use and the likelihood that a land area will be covered by forest in the future.
The availability of data related to land cover types and soil surface wetness was limited in our study, as the datasets did not have annual or seasonal variations. This prevented us from analysing the results in more detail. To determine the importance of ‘Transitional forest, peat’ as a source of CH, a higher resolution inversion model would be essential, ideally at least 0.1° × 0.1°. This would need high-quality CH concentration data, such as TROPOMI observations [21], to robustly constrain the CH emissions. In addition, to refine the national inventory estimates, it would be necessary to investigate the correlation between elevated emissions on transitional woodland and variables such as nutrient status, tree cover, low evaporation, high water table, and peat thickness. The variables should also have observations starting from 1990 onward to ensure consistency in the national GHG inventory.
Although we could not provide an absolute estimate of CH emissions from transitional forests, our analysis suggests that these emissions should not be neglected, as the area of transitional forests is almost half the area of open peatland. The natural emission estimated by the inversion model (on average Tg/year in Inv and Tg/year in Inv) were significantly higher than the anthropogenic CH emission estimated in the national inventory (0.22 Tg/year), let alone the LULUCF CH emissions (0.03 Tg/year). Thus, if even a small portion of the optimised natural emissions should rather have been included in the anthropogenic emissions category, this would mean a significant increase in anthropogenic CH emissions. However, the total CO emissions would still be higher than the CH emissions, although the uncertainty in the CH emissions is relatively higher [62]. As peatland restoration is likely to increase, the importance of understanding CH emissions from peatlands will also increase in the future.
5. Conclusions
We estimated annual natural and anthropogenic Finnish CH emissions with the atmospheric inversion model CTE-CH in 2013–2020 and investigated how the CH emissions were related to the different land cover classes (Corine land cover) and the occurrence of surface wetness (Copernicus Water and Wetness). In this study, we also compared our CH emission estimates with the national GHG inventory and discussed the differences between the CH emission estimates from the inversion model and the inventory. To our knowledge, this was the first time that estimates from an atmospheric inversion model were combined with the LULUCF sector.
We were able to show differences in CH emissions from different land cover classes based on our inversion model results. The inversion model CTE-CH attributed Finnish CH emissions mainly to natural sources, i.e., open peatlands. Further analysis suggested that emissions from forests with a thin tree cover were also included in the inversion model’s estimate of natural emissions. The CH emissions from forests with a thin tree cover are included in the Finnish national GHG inventory as forests are defined as managed land in Finland when the tree cover is higher than 10%. The results presented here indicate that the magnitude of CH emissions from organic forest soils may be significantly larger than estimated in the national GHG inventory. It is important to note that the analysis was carried out at a relatively coarse resolution (1° × 1° compared to 20 m × 20 m of land cover maps), so further investigation using a high-resolution inversion model with remotely sensed atmospheric CH concentrations is recommended to confirm these results. In addition, measurements from forests with a thin tree cover should be conducted to identify which ecological variables are associated with high CH emissions, in order to use these results in the national GHG inventory estimates.
Since the organic forest floor is known to be a source of CH when the water table level is high enough, the spatial correlations between the surface wetness from the Copernicus Water and Wetness data product, CH emissions, and the two highlighted land cover classes, ‘Wetlands, open bogs’ and ‘Transitional woodland, peat’ were further studied. The analysis of surface wetness showed that regions with high values of “permanent wet” surface were predominantly found in Lapland and North Ostrobothnia. These regions also showed a strong correlation with the extent of the land cover classes ‘Wetlands, open bogs’ and ‘Transitional woodland, peat’. The natural CH emission estimates from regions identified as “permanent wet” by the Copernicus Water and Wetness data product showed a notable increase in the optimised emissions compared to the ecosystem estimates (JSBACH and LPX) used as priors, especially in Lapland. In North Ostrobothnia, the increase from the priors was smaller, especially with Inv.
The results of this study highlight the potential of combining atmospheric inversion modelling of greenhouse gases with data from diverse sources. Wider use of such methods is therefore encouraged. In addition, more emphasis should be placed on developing methods to more easily combine atmospheric inversions with national greenhouse gas inventories. Overall, this study provides valuable insights into the accuracy of current estimates of CH emissions in Finland and highlights the need for continued research and refinement of emissions inventories to support effective climate change mitigation strategies.
Supplementary Materials
The following are available online at https://www.mdpi.com/article/10.3390/rs16010000/s1, Figure S1: Optimization regions. The grey region was optimized at 1° latitude × 1° longitude resolution. Circles show the locations of the in situ observation sites from which the concentration observations were used in this study. Figure S2: Daily averaged CH mole fraction observations [ppb] in Finnish measurement stations in 2013–2020. The duplicate sites mark the data set before and after the site was included in ICOS. In Pallas, there were also taken flask samples which are shown with discontinuous colour lines. Figure S3: Annual average from 2013–2020 of (a) the redistributed CAMS-REG CH emissions, (b) the original CAMS-REG, (c) the optimised anthropogenic CH emissions from Inv and (d) the optimised anthropogenic CH emissions from Inv. Figure S4: The range of the annual natural CH fluxes (2013–2020) for selected land cover classes estimated with linear regression using prior and optimised natural CH emissions from Inv and Inv. Figure S5: The range of annual natural CH fluxes (2013–2020) decomposed for selected land cover classes estimated using proportional Corine land cover classes. Figure S6: The range of annual anthropogenic CH fluxes (2013–2020) decomposed for selected land cover classes estimated using proportional Corine land cover classes. Figure S7: The range of annual total CH fluxes (2013–2020) decomposed for selected land cover classes estimated using proportional Corine land cover classes. Figure S8: Pairwise Pearson correlation coefficient of the selected Corine land cover classes at a resolution of 1° × 1° in Finland. The colour of a square is related to the correlation coefficient and the size to the absolute value of the coefficient: an absolute value would fill the cell and a zero value would mean that there would be no square. Figure S9: The range of the annual natural CH fluxes (2013–2020) for selected land cover classes estimated with XGBoost using optimised natural CH emissions from Inv and Inv. Figure S10: The range of annual anthropogenic CH fluxes (2013–2020) for selected land cover classes estimated with XGBoost using optimised anthropogenic CH emissions from Inv and Inv. Figure S11: The range of annual total CH fluxes (2013–2020) for selected land cover classes estimated with XGBoost using optimised total CH emissions from Inv and Inv. Table S1: List of the Finnish surface observation sites used in inversions. Observation Uncertainty (Obs. Unc.) is used to define diagonal values in the observation covariance matrix. The data type is categorized into two measurements (discrete (D) and continuous (C)). Table S2: List of surface observation sites used in inversions. Observation Uncertainty (Obs. Unc.) is used to define diagonal values in the observation covariance matrix. The data type is categorized into two measurements (discrete (D) and continuous (C)).
Author Contributions
M.K.T., A.T. and T.A. participated in the design of the study; M.K.T. performed the data processing, prepared and performed the model runs, and prepared the visualisations for the manuscript; A.T. helped with the setup of the CTE-CH and TM5 model runs; M.K.T. performed the analysis and preparation of the original manuscript together with T.A. and M.T.; V.T. processed the Copernicus Water and Wetness data and helped with their use and also helped with processing the spatial data to different resolutions; M.T. and I.A. provided the Corine land cover maps and helped to analyse the results with the Copernicus Water and Wetness data; M.H. and T.T. provided the Finnish LULUCF CH inventory estimates; A.L., T.M. and M.R. performed the JSBACH-HIMMELI model runs and provided the CH emission estimates used in the inversion; T.A. provided general advice on the analysis and writing process; S.N. provided insights into general issues surrounding national GHG inventories and offered information regarding the inventory categories and the methodologies employed for inventory calculations; A.N.A. coordinated the project in which the study was conducted. All authors have read and approved the published version of the manuscript.
Funding
This research was funded by the project FPCUP (Framework Partnership Agreement on Copernicus User Uptake), Action 2019-2-49 “Developing supports for monitoring and reporting of GHG emissions and removals from land use, land use change and forestry” (219/SI2.818795/07 (CLIMA)), the Academy of Finland Center of Excellence (272041), EU-H2020 VERIFY (776810), FIRI-ICOS Finland (345531), ICOS-ERIC (281250), Academy of Finland Grant no. 307331 (UPFORMET), 351311 (GHGSUPER), 337552 (Flagship) and 312932 (Sompa), and MMM Grant no. 4400T-2105 (TURNEE), EU-Horizon Eye-Clima (101081395), EU-Alfawetlands (101056844), EU-Wethorizons (101056848), and EU LIFE21-CCM-LV-LIFE PeatCarbon–101074396.
Data Availability Statement
The model results, inputs and code will be provided on request from the corresponding author (Maria Tenkanen, maria.tenkanen@fmi.fi). The Finnish GHG inventory is provided by Statistics Finland in https://stat.fi/tilasto/khki, accessed on 26 September 2023. The specific Corine Land Cover data used in this study can be requested by the corresponding author, or Markus Törmä (markus.torma@syke.fi); the European Cors Land Cover data is available in https://land.copernicus.eu/en/products/corine-land-cover, accessed on 26 September 2023. The Copernicus Water and Wetness data are available in https://land.copernicus.eu/en/products/high-resolution-layer-water-and-wetness/water-and-wetness-status-2018, accessed on 26 September 2023.
Acknowledgments
We thank the teams behind the LPX-Bern DYPTOP v1.4 and CAMS-REG CH (Netherlands Organisation for Applied Scientific Research) for providing the model estimates. We also thank the European Union’s project FPCUP Action 2019-2-49 “Developing supports for monitoring and reporting of GHG emissions and removals from land use, land use change and forestry” (219/SI2.818795/07 (CLIMA)) for their support. We are grateful for CSIRO Oceans and Atmosphere, Climate Science Centre (CSIRO), Environment and Climate Change Canada (EC), the Hungarian Meteorological Service (HMS), the Institute for Atmospheric Sciences and Climate (ISAC), the Institute on Atmospheric Pollution of the National Research Council (IIA), the Institute of Environmental Physics, University of Heidelberg (IUP), Laboratoire des Sciences du Climat et de l’Environnement (LSCE), Lawrence Berkeley National Laboratory (LBNL-ARM), the Environment Division Global Environment and Marine Department Japan Meteorological Agency (JMA), the Main Geophysical Observatory (MGO), the Max Planck Institute for Biogeochemistry (MPIBGC), National Institute for Environmental Studies (NIES), Norwegian Institute for Air Research (NILU), the Pennsylvania State University (PSU), Swedish University of Agricultural Sciences (SLU) [63], the Swiss Federal Laboratories for Materials Science and Technology (EMPA), Umweltbundesamt Germany/Federal Environmental Agency (UBA), Umweltbundesamt Austria/Environment Agency Austria (EAA) as the data provider for Sonnblick, University of Bristol (UNIVBRIS), University of Exeter (Elena Kozlova), and University of Urbino (UNIURB) for performing high-quality CH measurements at global sites and making them available through the GAW-WDCGG and personal communications. We also thank ICOS PIs for providing the data/facilities on the atmospheric CH concentration products. In situ observations collected over the US Southern Great Plains were supported by the Office of Biological and Environmental Research of the US Department of Energy under contract no. DE-AC02-05CH11231 as part of the Atmospheric Radiation Measurement (ARM) Program, ARM Aerial Facility (AAF), and Terrestrial Ecosystem Science (TES) Program. Measurements at Jungfraujoch were supported by ICOS Switzerland.
Conflicts of Interest
The authors declare no conflicts of interest. Also, the funders had no role in the design of the study; in the collection, analysis, or interpretation of data; in the writing of the manuscript, or in the decision to publish the results.
Abbreviations
The following abbreviations are used in this manuscript:
| GHG | Greenhouse gas |
| LULUCF | Land use, land use change and forestry |
| CTE-CH | The inversion model CarbonTracker Europe—CH |
| CAMS-REG | Copernicus Atmosphere Monitoring Service Regional inventory; an anthropogenic emission inventory developed for the European domain |
| LPX | CH emission estimates from the ecosystem model LPX-Bern DYPTOP |
| JSBACH | CH emission estimates from the ecosystem model JSBACH-HIMMELI |
| Inv | Optimised CH emission estimates with CTE-CH using LPX as the natural prior emissions |
| Inv | Optimised CH emission estimates with CTE-CH using JSBACH as the natural prior emissions |
| Copernicus WAW | Copernicus Water and Wetness; describes the occurrence of water and wet surfaces over the period 2009–2018 |
References
- United Nations Framework Convention on Climate Change. The Paris Agreement. 2015. Available online: https://unfccc.int/documents/184656 (accessed on 26 September 2023).
- United Nations Framework Convention on Climate Change. Revision of the UNFCCC Reporting Guidelines on Annual Inventories for Parties Included in Annex I to the Convention, Decision 24/CP.19. 2013, pp. 1–54. Available online: https://unfccc.int/resource/docs/2013/cop19/eng/10a03.pdf (accessed on 26 September 2023).
- Ministry of Economic Affairs and Employment. Carbon Neutral Finland 2035—National Climate and Energy Strategy; Ministry of Economic Affairs and Employment: Helsinki, Finland, 2022. Available online: https://julkaisut.valtioneuvosto.fi/bitstream/handle/10024/164323/TEM_2022_55.pdf (accessed on 26 September 2023).
- Vikfors, S.; Mutanen, A.; Ollila, P.; Tuomainen, T. Maankäyttösektori EU:n Ilmastopolitiikassa (Land use Sector in the EU Climate Policy: Assessment on the Proposal of COM(2021) 554 Final by the European Commission). 2022. Available online: https://mmm.fi/documents/1410837/107434499/Maank%C3%A4ytt%C3%B6sektori_EUn_ilmastopolitiikassa.pdf/f44f8bf5-5566-1c74-7666-4787c1c3b266/Maank%C3%A4ytt%C3%B6sektori_EUn_ilmastopolitiikassa.pdf (accessed on 26 September 2023). (In Finnish).
- Statistics Finland. Official Statistics of Finland (OSF): Greenhouse Gases. 2021. Available online: https://stat.fi/en/publication/cktldez2g39g20c53gh3lp5jo (accessed on 13 December 2023).
- Statistics Finland. Greenhouse Gas Emissions in Finland 1990 to 2021. National Inventory Report under the UNFCCC and the Kyoto Protocol; Statistics Finland: Helsinki, Finland, 2023.
- Turunen, J.; Valpola, S. The influence of anthropogenic land use on finnish peatland area and carbon stores 1950–2015. Mires Peat 2020, 26, 26. [Google Scholar] [CrossRef]
- Ojanen, P.; Minkkinen, K.; Alm, J.; Penttilä, T. Soil–atmosphere CO2, CH4 and N2O fluxes in boreal forestry-drained peatlands. For. Ecol. Manag. 2010, 260, 411–421. [Google Scholar] [CrossRef]
- Peacock, M.; Granath, G.; Wallin, M.B.; Högbom, L.; Futter, M.N. Significant emissions from forest drainage ditches—An unaccounted term in anthropogenic greenhouse gas inventories? J. Geophys. Res. Biogeosci. 2021, 126, e2021JG006478. [Google Scholar] [CrossRef]
- Tupek, B.; Minkkinen, K.; Pumpanen, J.; Vesala, T.; Nikinmaa, E. CH4 and N2O dynamics in the boreal forest-mire ecotone. Biogeosciences 2015, 12, 281–297. [Google Scholar] [CrossRef]
- Ullah, S.; Moore, T.R. Biogeochemical controls on methane, nitrous oxide, and carbon dioxide fluxes from deciduous forest soils in eastern Canada. J. Geophys. Res. 2011, 116, G03010. [Google Scholar] [CrossRef]
- Martikainen, P.J.; Nykänen, H.; Alm, J.; Silvola, J. Change in fluxes of carbon dioxide, methane and nitrous oxide due to forest drainage of mire sites of different trophy. Plant Soil 1995, 168–169, 571–577. [Google Scholar] [CrossRef]
- Lohila, A.; Aalto, T.; Aurela, M.; Hatakka, J.; Tuovinen, J.P.; Kilkki, J.; Penttilä, T.; Vuorenmaa, J.; Hänninen, P.; Sutinen, R.; et al. Large contribution of boreal upland forest soils to a catchment-scale CH4 balance in a wet year. Geophys. Res. Lett. 2016, 43, 2946–2953. [Google Scholar] [CrossRef]
- Maksyutov, S.; Eggleston, S.; Woo, J.H.; Fang, S.; Witi, J.; Gillenwater, M.; Goodwin, J.; Tubiello, F. 2019 Refinement to the 2006 IPCC Guidelines for National Greenhouse Gas Inventories; IPCC: Interlaken, Switzerland, 2019; Volume 1, Chapter 6; pp. 1–45. Available online: https://www.ipcc-nggip.iges.or.jp/public/2019rf/index.html (accessed on 26 September 2023).
- Leip, A.; Skiba, U.; Vermeulen, A.; Thompson, R.L. A complete rethink is needed on how greenhouse gas emissions are quantified for national reporting. Atmos. Environ. 2018, 174, 237–240. [Google Scholar] [CrossRef]
- Deng, Z.; Ciais, P.; Tzompa-Sosa, Z.A.; Saunois, M.; Qiu, C.; Tan, C.; Sun, T.; Ke, P.; Cui, Y.; Tanaka, K.; et al. Comparing national greenhouse gas budgets reported in UNFCCC inventories against atmospheric inversions. Earth Syst. Sci. Data 2022, 14, 1639–1675. [Google Scholar] [CrossRef]
- Henne, S.; Brunner, D.; Oney, B.; Leuenberger, M.; Eugster, W.; Bamberger, I.; Meinhardt, F.; Steinbacher, M.; Emmenegger, L. Validation of the Swiss methane emission inventory by atmospheric observations and inverse modelling. Atmos. Chem. Phys. 2016, 16, 3683–3710. [Google Scholar] [CrossRef]
- Lunt, M.F.; Manning, A.J.; Allen, G.; Arnold, T.; Bauguitte, S.J.; Boesch, H.; Ganesan, A.L.; Grant, A.; Helfter, C.; Nemitz, E.; et al. Atmospheric observations consistent with reported decline in the UK’s methane emissions (2013–2020). Atmos. Chem. Phys. 2021, 21, 16257–16276. [Google Scholar] [CrossRef]
- Houweling, S.; Bergamaschi, P.; Chevallier, F.; Heimann, M.; Kaminski, T.; Krol, M.; Michalak, A.M.; Patra, P. Global inverse modeling of CH4 sources and sinks: An overview of methods. Atmos. Chem. Phys. 2017, 17, 235–256. [Google Scholar] [CrossRef]
- Tsuruta, A.; Aalto, T.; Backman, L.; Hakkarainen, J.; van der Laan-Luijkx, I.T.; Krol, M.C.; Spahni, R.; Houweling, S.; Laine, M.; Dlugokencky, E.; et al. Global methane emission estimates for 2000–2012 from CarbonTracker Europe-CH4 v1.0. Geosci. Model Dev. 2017, 10, 1261–1289. [Google Scholar] [CrossRef]
- Tsuruta, A.; Kivimäki, E.; Lindqvist, H.; Karppinen, T.; Backman, L.; Hakkarainen, J.; Schneising, O.; Buchwitz, M.; Lan, X.; Kivi, R.; et al. CH4 Fluxes Derived from Assimilation of TROPOMI XCH4 in CarbonTracker Europe-CH4: Evaluation of Seasonality and Spatial Distribution in the Northern High Latitudes. Remote Sens. 2023, 15, 1620. [Google Scholar] [CrossRef]
- Lindqvist, H.; Kivimäki, E.; Tsuruta, A.; Karppinen, T.; Backman, L.; Schneising, O.; Buchwitz, M.; Lorente Delgado, A.; Kivi, R.; Chen, H. Evaluation of Sentinel 5P TROPOMI methane observations at high latitudes. Remote Sens. 2023, in press.
- Härmä, P.; Autio, I.; Teiniranta, R.; Hatunen, S.; Törmä, M.; Kallio, M.; Kaartinen, M. Final Report: Specific Contract No 3436/R0-COPERNICUS/EEA. 56936 Implementing Framework Service Contract No EEA/IDM/R0/16/009/Finland; Technical Report 377; Finnish Environment Centre SYKE: Helsinki, Finland, 2019; Available online: https://www.syke.fi/download/noname/%7B725215CE-EE17-4B5F-A531-CD525425B28C%7D/144830 (accessed on 26 September 2023).
- European Environment Agency. Copernicus Land Monitoring Service High Resolution Land Cover Characteristics. Water & Wetness 2018. 2020. Available online: https://sdi.eea.europa.eu/catalogue/copernicus/api/records/7992f641-bf77-47b7-b0c1-74fc832b78b1?language=all (accessed on 7 December 2023). [CrossRef]
- Vaahtera, E.; Peltola, A.; Torvelainen, J.; Uotila, E. Finnish Statistical Yearbook of Forestry; Natural Resources Institute Finland (LUKE): Helsinki, Finland, 2023. Available online: http://urn.fi/URN:ISBN:978-952-380-584-2 (accessed on 26 September 2023).
- Väliranta, M.; Salojärvi, N.; Vuorsalo, A.; Juutinen, S.; Korhola, A.; Luoto, M.; Tuittila, E.S. Holocene fen–bog transitions, current status in Finland and future perspectives. Holocene 2017, 27, 752–764. [Google Scholar] [CrossRef]
- Statistics Finland. Official Statistics of Finland (OSF): Population Structure. 2022. Available online: https://www.stat.fi/tup/suoluk/suoluk_vaesto_en.html (accessed on 8 December 2023).
- Krol, M.; Houweling, S.; Bregman, B.; van den Broek, M.; Segers, A.; van Velthoven, P.; Peters, W.; Dentener, F.; Bergamaschi, P.; Broek, M.V.D.; et al. The two-way nested global chemistry-transport zoom model TM5: Algorithm and applications. Atmos. Chem. Phys. 2005, 5, 417–432. [Google Scholar] [CrossRef]
- Van der Laan-Luijkx, I.T.; van der Velde, I.R.; van der Veen, E.; Tsuruta, A.; Stanislawska, K.; Babenhauserheide, A.; Zhang, H.F.; Liu, Y.; He, W.; Chen, H.; et al. The CarbonTracker Data Assimilation Shell (CTDAS) v1.0: Implementation and global carbon balance 2001–2015. Geosci. Model Dev. 2017, 10, 2785–2800. [Google Scholar] [CrossRef]
- Peters, W.; Miller, J.B.; Whitaker, J.; Denning, A.S.; Hirsch, A.; Krol, M.C.; Zupanski, D.; Bruhwiler, L.; Tans, P.P. An ensemble data assimilation system to estimate CO2 surface fluxes from atmospheric trace gas observations. J. Geophys. Res. Atmos. 2005, 110, 1–18. [Google Scholar] [CrossRef]
- Tsuruta, A.; Aalto, T.; Backman, L.; Krol, M.C.; Peters, W.; Lienert, S.; Joos, F.; Miller, P.A.; Zhang, W.; Laurila, T.; et al. Methane budget estimates in Finland from the CarbonTracker Europe-CH4 data assimilation system. Tellus B Chem. Phys. Meteorol. 2019, 71, 1565030. [Google Scholar] [CrossRef]
- Hersbach, H.; Bell, B.; Berrisford, P.; Hirahara, S.; Horányi, A.; Muñoz-Sabater, J.; Nicolas, J.; Peubey, C.; Radu, R.; Schepers, D.; et al. The ERA5 global reanalysis. Q. J. R. Meteorol. Soc. 2020, 146, 1999–2049. [Google Scholar] [CrossRef]
- Houweling, S.; Krol, M.; Bergamaschi, P.; Frankenberg, C.; Dlugokencky, E.J.; Morino, I.; Notholt, J.; Sherlock, V.; Wunch, D.; Beck, V.; et al. A multi-year methane inversion using SCIAMACHY, accounting for systematic errors using TCCON measurements. Atmos. Chem. Phys. 2014, 14, 3991–4012. [Google Scholar] [CrossRef]
- Brühl, C.; Crutzen, P.J. MPIC Two-Dimensional Model; Technical Report; NASA: Washington, DC, USA, 1993.
- Schuldt, K.N.; Aalto, T.; Andrews, A.; Aoki, S.; Arduini, J.; Baier, B.; Bergamaschi, P.; Biermann, T.; Biraud, S.C.; Boenisch, H.; et al. Multi-Laboratory Compilation of Atmospheric Methane Data for the Period 1983–2020; Obspack_ch4_1_GLOBALVIEWplus_v3.0_2021-05–07; NOAA Earth System Research Laboratory, Global Monitoring Laboratory: Boulder, CO, USA, 2021. [Google Scholar] [CrossRef]
- Sasakawa, M.; Shimoyama, K.; Machida, T.; Tsuda, N.; Suto, H.; Arshinov, M.; Davydov, D.; Fofonov, A.; Krasnov, O.; Saeki, T.; et al. Continuous measurements of methane from a tower network over Siberia. Tellus Ser. B Chem. Phys. Meteorol. 2010, 62, 403–416. [Google Scholar] [CrossRef]
- Bruhwiler, L.; Dlugokencky, E.; Masarie, K.; Ishizawa, M.; Andrews, A.; Miller, J.; Sweeney, C.; Tans, P.; Worthy, D. CarbonTracker-CH4: An assimilation system for estimating emissions of atmospheric methane. Atmos. Chem. Phys. 2014, 14, 8269–8293. [Google Scholar] [CrossRef]
- Kuenen, J.; Dellaert, S.; Visschedijk, A.; Jalkanen, J.P.; Super, I.; Denier van der Gon, H. CAMS-REG-v4: A state-of-the-art high-resolution European emission inventory for air quality modelling. Earth System Sci. Data 2022, 14, 491–515. [Google Scholar] [CrossRef]
- European Commission and Joint Research Centre; Olivier, J.; Guizzardi, D.; Schaaf, E.; Solazzo, E.; Crippa, M.; Vignati, E.; Banja, M.; Muntean, M.; Grassi, G.; et al. GHG Emissions of All World—2021 Report; Publications Office of the European Union: Brussels, Belgium, 2021. [Google Scholar] [CrossRef]
- Raivonen, M.; Smolander, S.; Backman, L.; Susiluoto, J.; Aalto, T.; Markkanen, T.; Mäkelä, J.; Rinne, J.; Peltola, O.; Aurela, M.; et al. HIMMELI v1.0: HelsinkI Model of MEthane buiLd-up and emIssion for peatlands. Geosci. Model Dev. 2017, 10, 4665–4691. [Google Scholar] [CrossRef]
- Kleinen, T.; Mikolajewicz, U.; Brovkin, V. Terrestrial methane emissions from the Last Glacial Maximum to the preindustrial period. Clim. Past 2020, 16, 575–595. [Google Scholar] [CrossRef]
- Lienert, S.; Joos, F. A Bayesian ensemble data assimilation to constrain model parameters and land-use carbon emissions. Biogeosciences 2018, 15, 2909–2930. [Google Scholar] [CrossRef]
- Stocker, B.D.; Spahni, R.; Joos, F. DYPTOP: A cost-efficient TOPMODEL implementation to simulate sub-grid spatio-temporal dynamics of global wetlands and peatlands. Geosci. Model Dev. 2014, 7, 3089–3110. [Google Scholar] [CrossRef]
- Spahni, R.; Wania, R.; Neef, L.; Van Weele, M.; Pison, I.; Bousquet, P.; Frankenberg, C.; Foster, P.N.; Joos, F.; Prentice, I.C.; et al. Constraining global methane emissions and uptake by ecosystems. Biogeosciences 2011, 8, 1643–1665. [Google Scholar] [CrossRef]
- Spahni, R.; Joos, F.; Stocker, B.D.; Steinacher, M.; Yu, Z.C. Transient simulations of the carbon and nitrogen dynamics in northern peatlands: From the Last Glacial Maximum to the 21st century. Clim. Past 2013, 9, 1287–1308. [Google Scholar] [CrossRef]
- Van der Werf, G.R.; Randerson, J.T.; Giglio, L.; van Leeuwen, T.T.; Chen, Y.; Rogers, B.M.; Mu, M.; van Marle, M.J.E.; Morton, D.C.; Collatz, G.J.; et al. Global fire emissions estimates during 1997–2016. Earth Syst. Sci. Data 2017, 9, 697–720. [Google Scholar] [CrossRef]
- Ito, A.; Inatomi, M. Use of a process-based model for assessing the methane budgets of global terrestrial ecosystems and evaluation of uncertainty. Biogeosciences 2012, 9, 759–773. [Google Scholar] [CrossRef]
- Intergovernmental Panel on Climate Change. Wetlands. In 2019 Refinement to the 2006 IPCC Guidelines for National Greenhouse Gas Inventories; Calvo Buendia, E., Tanabe, K., Kranjc, A., Baasansuren, J., Fukuda, M., Ngarize, S., Osako, A., Pyrozhenko, Y., Shermanau, P., Federici, S., Eds.; IPCC: Interlaken, Switzerland, 2019; Volume 4, Chapter 7; pp. 1–7. [Google Scholar]
- Intergovernmental Panel on Climate Change. 2013 Supplement to the 2006 IPCC Guidelines for National Greenhouse Gas Inventories: Wetlands; IPCC: Kanagawa, Japan, 2014; pp. 1–55. [Google Scholar]
- Heymann, Y.; Steenmans, C.; Croissille, G.; Bossard, M. Corine Land Cover—Technical Guide; Technical Report; Office for Official Publications of the European Communities: Luxembourg, 1994. [Google Scholar]
- Törmä, M.; Härmä, P.; Hatunen, S.; Teiniranta, R.; Kallio, M.; Järvenpää, E. Change detection for Finnish CORINE land cover classification. In Proceedings of the Earth Resources and Environmental Remote Sensing/GIS Applications II, Prague, Czech Republic, 20–22 September 2011; Volume 8181. [Google Scholar] [CrossRef]
- Härmä, P.; Teiniranta, R.; Törmä, M.; Repo, R.; Järvenpää, E.; Kallio, M. The Production of Finnish Corine Land Cover 2000 Classification. XXth Isprs Congr. 2004, 2000, 1330–1335. [Google Scholar]
- European Environment Agency. Copernicus Land Monitoring Service: High Resolution Layers. Available online: https://land.copernicus.eu/pan-european/high-resolution-layers (accessed on 7 December 2023).
- Kallio, M. HRL 2018 Look & Feel Verification Report for Wetness and Water (WaW); Technical Report; Finnish Environment Institute SYKE: Helsinki, Finland, 2021. [Google Scholar]
- Saunois, M.; Stavert, A.R.; Poulter, B.; Bousquet, P.; Canadell, J.G.; Jackson, R.B.; Raymond, P.A.; Dlugokencky, E.J.; Houweling, S.; Patra, P.K.; et al. The Global Methane Budget 2000–2017. Earth Syst. Sci. Data 2020, 12, 1561–1623. [Google Scholar] [CrossRef]
- Kou, D.; Virtanen, T.; Treat, C.C.; Tuovinen, J.; Räsänen, A.; Juutinen, S.; Mikola, J.; Aurela, M.; Heiskanen, L.; Heikkilä, M.; et al. Peatland Heterogeneity Impacts on Regional Carbon Flux and Its Radiative Effect Within a Boreal Landscape. J. Geophys. Res. Biogeosci. 2022, 127. [Google Scholar] [CrossRef]
- Pedregosa, F.; Varoquaux, G.; Gramfort, A.; Michel, V.; Thirion, B.; Grisel, O.; Blondel, M.; Prettenhofer, P.; Weiss, R.; Dubourg, V.; et al. Scikit-learn: Machine Learning in Python. J. Mach. Learn. Res. 2011, 12, 2825–2830. [Google Scholar]
- Hoese, D.; Raspaud, M.; Lahtinen, P.; Roberts, W. Lavergne. Pytroll/Pyresample: Version 1.16.0. 2020. Available online: https://pyresample.readthedocs.io/ (accessed on 26 September 2023).
- Chen, T.; Guestrin, C. XGBoost: A Scalable Tree Boosting System. In Proceedings of the 22nd ACM SIGKDD International Conference on Knowledge Discovery and Data Mining, New York, NY, USA, 13–17 August 2016; Volume 42, pp. 785–794. [Google Scholar] [CrossRef]
- Susiluoto, J.; Raivonen, M.; Backman, L.; Laine, M.; Makela, J.; Peltola, O.; Vesala, T.; Aalto, T. Calibrating the sqHIMMELI v1.0 wetland methane emission model with hierarchical modeling and adaptive MCMC. Geosci. Model Dev. 2018, 11, 1199–1228. [Google Scholar] [CrossRef]
- Juutinen, S.; Alm, J.; Larmola, T.; Huttunen, J.T.; Morero, M.; Saarnio, S.; Martikainen, P.J.; Silvola, J. Methane (CH4) release from littoral wetlands of Boreal lakes during an extended flooding period. Glob. Chang. Biol. 2003, 9, 413–424. [Google Scholar] [CrossRef]
- Solazzo, E.; Crippa, M.; Guizzardi, D.; Muntean, M.; Choulga, M.; Janssens-Maenhout, G. Uncertainties in the Emissions Database for Global Atmospheric Research (EDGAR) emission inventory of greenhouse gases. Atmos. Chem. Phys. 2021, 21, 5655–5683. [Google Scholar] [CrossRef]
- Marklund, P.; Ottosson-Löfvenius, M.; Smith, P. ICOS ATC CH4 Release, Svartberget (150.0 m), 1 June 2017–28 February 2022. 2022. Available online: https://hdl.handle.net/11676/atargbJjvxhGDR2Yov09hD-E (accessed on 26 September 2023).
Disclaimer/Publisher’s Note: The statements, opinions and data contained in all publications are solely those of the individual author(s) and contributor(s) and not of MDPI and/or the editor(s). MDPI and/or the editor(s) disclaim responsibility for any injury to people or property resulting from any ideas, methods, instructions or products referred to in the content. |
© 2023 by the authors. Licensee MDPI, Basel, Switzerland. This article is an open access article distributed under the terms and conditions of the Creative Commons Attribution (CC BY) license (https://creativecommons.org/licenses/by/4.0/).