Abstract
In the field of digital cultural heritage (DCH), 2D/3D digitization strategies are becoming more and more complex. The emerging trend of multimodal imaging (i.e., data acquisition campaigns aiming to put in cooperation multi-sensor, multi-scale, multi-band and/or multi-epochs concurrently) implies several challenges in term of data provenance, data fusion and data analysis. Making the assumption that the current usability of multi-source 3D models could be more meaningful than millions of aggregated points, this work explores a “reduce to understand” approach to increase the interpretative value of multimodal point clouds. Starting from several years of accumulated digitizations on a single use-case, we define a method based on density estimation to compute a Multimodal Enhancement Fusion Index (MEFI) revealing the intricate modality layers behind the 3D coordinates. Seamlessly stored into point cloud attributes, MEFI is able to be expressed as a heat-map if the underlying data are rather isolated and sparse or redundant and dense. Beyond the colour-coded quantitative features, a semantic layer is added to provide qualitative information from the data sources. Based on a versatile descriptive metadata schema (MEMoS), the 3D model resulting from the data fusion could therefore be semantically enriched by incorporating all the information concerning its digitization history. A customized 3D viewer is presented to explore this enhanced multimodal representation as a starting point for further 3D-based investigations.
1. Introduction
In the field of cultural heritage studies, digitally born or derived resources are used nowadays to document, analyse and share valuable information gathered on tangible artefacts. For the past two decades, 2D and 3D-imaging techniques have been evolving to unveil the upcoming challenges and potential of digital replicas applied to cultural assets. However, we can consider that the digitization process in itself (optimization and scalability aside) is no longer a scientific issue, as we can literally scan almost any object with smart devices that fit into our pocket. During this period and even more so now that digitization is accessible and affordable, a massive but sparse digital data catalogue is being collected and growing. One can foresee from this ongoing massive digitization phase, the need for centralized shared deposits communicating between data lakes and warehouses. This leads us to the first issue of exponentiality as the data are multiplying in number, size and mass, excluding the wealth of uninterpreted data. More recently, the DCH field has seen a shift towards multimodal approaches, aiming to explore the cooperation of the data collected with different modalities (i.e., time, scale, dimension, etc.). Multimodal datasets encompass the diversity and complexity of the data accumulated from several experts using different sensors at different times in variable contexts. Indeed, this type of multi-source documentation represents the large majority of the works presented by the scientific community nowadays. This leads us to the second issue of intricacy, as it becomes more complex to access and extract meaningful information out of the latent and cross-relations between numerous datasets. It is also raising challenges down- and upstream of data fusion (discussed in Section 2), as it implies that data lineage processes must be improved from context-dependent practices. Based on these observations, one expects the expansion of an overgrowing mass of unstructured and unexploited data for which scientific communities, including CH-related ones, are currently exploring and mining with (supervised or unsupervised) machine learning approaches. In the DCH field, the work on semantics has taken on a new dimension in recent years, extracting with classification and segmentation methods with semantic features hidden within multi-layered data attributes [1], either improving its linkage with web-semantic aspects by means of FAIR principles [2], or oriented towards ontologically driven reasoning or computing [3]. These leads are relevant and interesting for CH studies; however, this paper does not deal directly with this.
Instead, we introduce a method one step prior (i.e., before the potential semantic extraction/exploration), following the belief that the multimodal datasets contain meaningful information that could possibly guide semantically driven approaches. This idea emerged while trying to exploit a substantial data collection made from digital surveys on a single heritage object. Like many other heritage sites or objects across the world, a multidisciplinary scientific team worked on a small chapel from the 15th century, having known recurrent data acquisition campaigns for the past few years. Facing the inability to record, understand and efficiently link our gathered data, we have begun this work improving the analysis of our multimodal dataset using a computational method. The core problem emerged from the evidence that, after the registration and data merging, amounted to nothing more than hundreds of millions of unstructured geometric coordinates belonging to attributes stacked into a 3D space. The informative and interpretative values of such a massive and complex 3D dataset is in this primal state, close to zero. Furthermore, even a powerful workstation would deliver a poor experience in terms of visualization and interaction with the model. The hypothesis motivating this work was that the accumulation of data and more importantly its deviation, carried important information about how the model was completed and what it is composed of. To this end, we envisioned to create an indicative heat-map to reveal where the model has more information and where it is lacking. The idea was to generate a fusion index, to range and enhance the underlying information stored into multi-source 3D reconstruction. In this way, the metric computed acts like a data fusion “indicatrix”, understood as a quantitative index reflecting an overlapping score from spatial and geometric features.
This paper presents our ongoing attempt to define a multimodal enhancement fusion index (MEFI) dedicated to CH-oriented 3D reconstruction. MEFI is a “reduce to understand” data processing strategy aiming to reveal low-level semantic features enhanced with metadata to improve data traceability from multi-source reconstruction. In Provençal speaking, mèfi (derived from se mefisa, se mesfisa) is a very frequently used interjection, corresponding to the French méfiance. It replaces the imperative “Beware!”. This was used in our case to focus on over- and under-documented areas in the digitized model. Additionally, it could serve as a method to guide the understanding and interpretation of complex and heterogeneous datasets. As MEFI is correlated with data fusion issues, some outcomes are discussed towards innovative computational or InfoViz methods contributing to multimodal fusion strategies in CH application. This section has introduced MEFI into a more generic scientific reasoning and motivation. A state-of-the-art method is proposed in Section 2, in which discussion and value of the method are articulated among related works. In Section 3, the Notre-Dame des-Fontaînes data collection is presented as a use case in the context of the study. The complete methodology is detailed in Section 4, where step-by-step explanations and the MEFI pseudocode of is provided. The results are presented and discussed in Section 5, while the development of a custom viewer is detailed in Section 5.1. The limits and perspectives of the work are given in Section 5.2. Conclusions and discussions of MEFI’s scientific value and possible contributions to CH-oriented studies are given in Section 6.
2. State-of-the-Art
In a recent work [4] based on former research [5], an extensive and comprehensive definition of multimodality in the field of DCH was proposed. In this research, multimodality is understood as several modalities cooperating to improve for the significance of a digital-based reconstruction for different purposes. The following section aims to clarify and delimit the core ins and outs of our study, namely, the data fusion in the 3D multimodal reconstruction framework for cultural heritage applications.
From early CH-oriented works made in 2010 [6], we know that the expected improvement of a data fusion process is generally motivated to (i) exploit the strengths of a technique, (ii) compensate for its individual weakness, (iii) derive multiple levels of detail (LOD), and (iv) improve consistency for its predefine purpose (modelling, analysis, diagnosis, etc.). Therefore, a dataset is considered as multimodal if its source data are composed of various sensors, scales, spectra, collected at different times, or by numerous experts and with the resultant combination being greater (from an informative point of view) than the sum of its elements. Prosaically speaking, data fusion ideally follows the leitmotif 1+1=3. Accordingly, several works from CH literature discuss the combination of imaging techniques, either in their spectral [7], scalar [8] or temporal [9] aspects, and extent synchronic [5] or diachronic [10] approaches. The novel works show a trend that the majority of ongoing practices and projects are integrating or moving towards multimodal imaging, outlining a critical direction for future research. Nevertheless, as reported in [11,12], current multimodal scenarios are often restricted to dual cross-modalities, and most of the time a technique is subordinated to the other. In many works, if not all, photogrammetry has been used as a bridging technique [5,7,12,13,14,15]. In this work, we tried to extend the capacity to manage cooperating modalities, intentionally variable in number and type. In this end, the dataset used mixes no less than 28 sources obtained with five main imaging techniques (see Section 3). That being said, combining this many sources was challenging, particularly in terms of data fusion issues.
As reported by a few works addressing data fusion in the CH field [16,17], difficulties lie in the fact that the merging of data can interfere at almost any step of the workflow with different dimension-based approaches; 2D–2D, 2D–3D or 3D–3D (the last one being the most used). Generally, among many methods [18], data registration is achieved by best-fit approaches derived from iterative closest point (ICP) algorithms for purely 3D data else with mutual information [19] when dealing with 2D/3D approaches. The classification proposed and derived from [20] also includes data-based levels (point-, feature-, or surface-based registration methods) and purpose-based levels (from raw data to semantically driven approaches). In other words, the authors express the strong requirement to know the specific characteristics of each modality in order for the fusion to make sense. Other interesting insights for data fusion can be taken from the more abundant engineering literature [21,22,23]. In this field, it is well known that data fusion models are developed for ad hoc applications with highly variable performances. Therefore, an evaluation step is required, influenced by two factors. Upstream, by the degree of confidence (DoC) related to the intrinsic quality or uncertainty of the inputs, on which a scoring or rating system is applied. Interestingly, even from a quick literature review, one can make a list of phenomena that degrade data fusion, many of which are highly representative of CH-oriented multimodal datasets (lack of ground truth, imperfection, outliers, heterogeneity, conflictual data, dimensionality, registration error, redundancy, operational time, or processing framework). Downstream, by the disposal of measure of performance (MoP) tools to evaluate the supposed superiority of the output, as depicted in Figure 1. Similar to [11], it is noticed that performing data fusion is usually restricted to rigid and formatted data. Unfortunately, this is far from the reality concerning CH applications, where methods and tools are as rich and heterogeneous as the heritage objects. This may explain the gap between the CH domain and its related fields (e.g., remote sensing, medical imaging, etc.) when it comes to multimodal data fusion.

Figure 1.
Schematic diagram representing data fusion.
Another challenge was identified by [24] concerning the complexity of performing the fusion of hard and soft data [25]. Transposed to our domain, hard data would be quantitative sensing data (in multiple forms, pixels, point clouds, geometrics attributes and features), while soft data would be other semantically loaded resources qualifying each source (also in multiple forms, metadata/paradata, annotations, linked-data, etc.). This specific point motivated the connection between MEMoS (see Figures in the Section 3) and MEFI, because the correlation of soft and hard data seems to have more potential than a simple overlapping score between point clouds.
In spite of everything, comparison and cross-analysis tools for point clouds are still required for our study. Current 3D data analysis methods solely propose pair-wise comparisons based on point-sets and/or meshes and is mostly dedicated to change detection [26]. It is important to notice that the solution exposed below, if based on these methods, would require successive pairwise computations, increasing the computational cost and complexity. Indeed, Cloud-to-cloud distance (C2C) or cloud-to-mesh distance (C2M) are commonly used methods, both accessible with the CloudCompare library. It is possible to go beyond this simple but yet effective C2C computation with the multi-scale model-to-model cloud comparison (M3C2) that improves the multi-resolution abilities and is available as a plug-in for CloudCompare [27]. Both methods are influenced by the initial understanding of the components (overlapping, intrinsic quality, spatial extension, and precision map) with a direct analogy to the DoC. Some innovative works related to data fusion [28,29,30] integrate multiple features [31,32,33] to increase the possible data integration performance. Few examples of effective and efficient cross-source 3D data fusion have been given [34,35] to emphasize the difference between these works and the method proposed. Unlike these references, we do not aim to compete on qualitative improvement in terms of accuracy and/or completeness because our goal is to increase the quality of the informative value and interpretative potential from multi-source point clouds. In this context, so-called integrated approaches are mainly oriented towards the definition of a supervision tool powered by advanced data visualization frameworks. The solutions developed here vary in terms of the type of data (2D to 3D to 4D to nD), the context, and the purpose of the application (CH documentation, archaeology, structural health monitoring for built heritages). Several works could help in distinguishing reality-based modelling and other realms of modeling. A first kind of approach is related to parametric-based modelling (BIM/H-BIM) in which the semantic is embedded and constrained to the attributes and relations supported in the IFC classes [36]. At the territory scale, data specialization is tackled by GIS and its web-implementation, enabling the linking of 3D assets to its documentation, possibly with linked open data [37] or a 4D framework [38]. At the object or monument scale, we can assimilate recent multi-layer [39] or multi-dimensional [40] viewers to geometric information systems. The main limitation of each tool, including methods relying on 3D reality-based point clouds, is the lack of data transfer [41]. Currently, more and more CH-oriented systems are being proposed by the community [42,43,44] for whose MEFI aim to provide a new way to handle multi-source 3D assets.
Nevertheless, it should be noted that due to simplification of the current stage of development, the proposed method is limited in terms of imaging techniques and data types; however, field is open to discussion of other heritage science techniques. Indeed, as discussed in [11], the multimodal issue in CH data fusion is as complex and challenging as “the collection of metric, scanning, spectral, chemical, geophysical, constructional and climatic data” apprehended as a closed loop (see Figure 2).
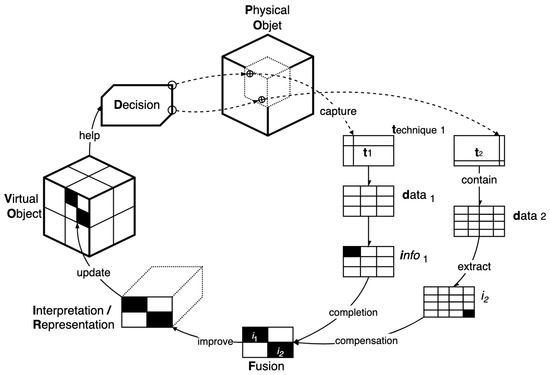
Figure 2.
Schematic diagram representing a CH-oriented data fusion operative chain.
3. Context of the Study
As presented and discussed in the section above, multimodal data fusion in CH is an open issue, especially because of the non-linear and non-deterministic ways to document and digitize heritage artefacts. By extrapolating, we could say that the procedural scheme to generate digital cultural heritage assets is as unique as the history of the physical object itself. With this work, we attempt to “upgrade” our understanding of digital production, hoping it will help us to understand the physical object behind it. To this end, an experiment was made on a genuine DCH object with all its defects and imperfections. The asset type was chosen at the architectural scale because the main complexity remains in the multi-scalar aspect (from metre to infra-millimetre spatial observations). In input, we take scattered point clouds of the same chapel (see Figure 3) and our goal is to enhance their understanding through a single representation resulting from these data and answering some of the following questions; What was the area surveyed, who applied which modality and how, when and possibly why was it performed?
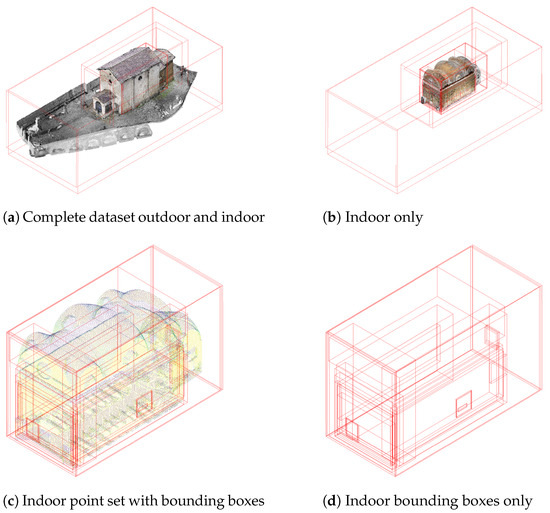
Figure 3.
Overview of the NDF 3D data collection.
Notre-Dame des Fontaînes Chapel
In order to evaluate the MEFI in a real scenario, we composed a use case of very sparse and heterogeneous 3D data, as this is probably the case for most CH objects and DH research contexts. The data collection included several overlapping multimodal layers as listed below:
- Time: Several data acquisition campaigns (six) were conducted in various research projects (four) between 2015 and 2021. In addition, archival resources (mostly photographs) beginning in 1950 exist and more missions are planned in the close future.
- Scale: Different strategies and devices were applied indoor/outdoor, using terrestrial and aerial approaches with high variability in terms of spatial resolution (between 85 points and 0.1 point for 1 cm).
- Sensor: Range- and image-based sensing were utilized. In total, 14 sensors models corresponding to four sensor types (photographic, phase-shift, telemetric and thermal imaging sensor) were used with no less than 10 imaging techniques. In addition, work it planned concerning data-integration regarding spectroscopic (LIBS, XRF) acoustic measurements (ultrasound, SRIR) and climatic sensors (temperature, hydrometry).
- Spectral: Some imaging techniques were collected at different spectral band ranges (visible, near-infrared and ultraviolet). In this study, only multi-spectral photographic-based techniques were integrated; however, multi-spectral RTI and hyperspectral imaging has been performed.
- Actors: These data were captured by several researchers (seven) from different teams and expertise fields with differing experience levels and methods.
Together, the work represents over 250 millions points distributed across 28 point clouds. The complexity of the collected data is complicated to apprehend; thus, we created graphical representations from our metadata framework called MEMoS [4] to help understand the sources (see Figure 4 and Figure 5). Briefly, MEMoS is a versatile metadata schema aiming to reinforce the data provenance of CH-oriented multimodal imaging. It is based the W7 ontological cross-domain model [45] introduced by Ram and Lui in the late 2000s [46]. For each point cloud, an MEMoS file is affiliated in the JSON format filled with descriptive metadata structured into seven sections, namely; WHO, WHEN, WHERE, WHAT, HOW, WHICH, and WHY. Mapping this metadata template with CIDOC-CRM was conducted to further explore the web-semantic aspects, of which guidance is given in the reference above.
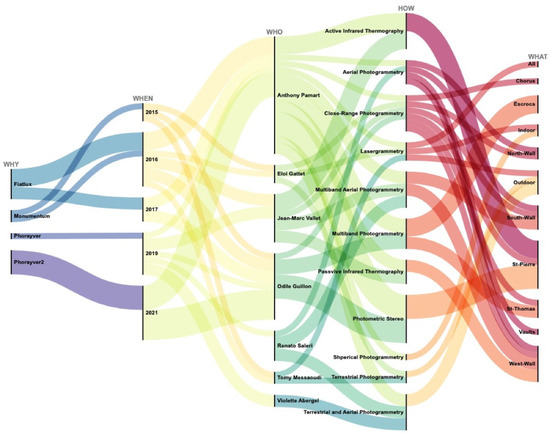
Figure 4.
MEMoS-based graphical representation revealing the correlation between the projects, dates, actors, techniques and areas surveyed.
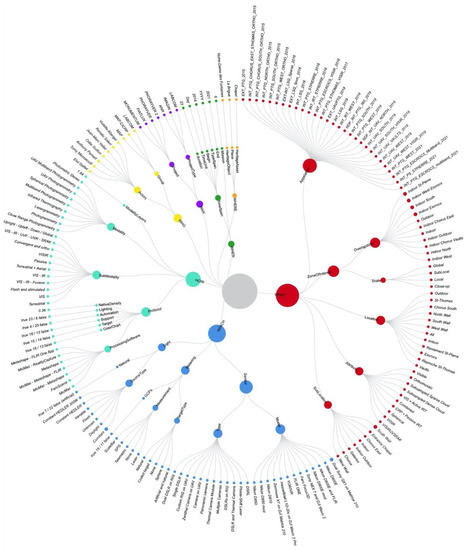
Figure 5.
Graphical representation of the MEMoS-based data fusion synthesizing the digitization activities held at Notre-Dame des Fontaînes since 2014.
4. Methodology
For this research, we make the assumption that CH-oriented multimodal practices can be represented by the schematic overview in Figure 2, where a physical object is instantiated by a virtual object by combining the digitization activities. In our scenario, data fusion is a crucial step to enhance the virtual object by improving its interpretative representative value. Our goal is to define a data fusion model augmented with descriptive metadata dedicated to decision-making [20]. Following this objective the model could be used and reused to guide future data acquisition campaigns. MEFI can be employed on CH assets, surveyed and monitored by multiple 3D scanning campaigns, at site or monument scales. It is rare that movable heritages are scanned more than once. One could think that it could be used in archaeological contexts but not in excavation, as this destructive process implies the lost of redundant data on which the core of the MEFI is based. For the same reason, MEFI hasn’t been tested on highly damaged sites, but this interesting lead should be investigated further in future works.
Some methodological choices have been made to align the requirements of the method with the issues exposed in the previous sections. The exponentiality issue has motivated the definition of a new method instead of relying on pair-wise limited metrics (e.g., C2C, and M3C2) while preserving the ability to handle large datasets (i.e., Octree resampling, etc.) [13,47]. The intricacy issue defined the prerequisite for the method to simultaneously manage several multimodal layers (i.e., epoch, resolution, scale and/or spectral dimensions). On the other hand, we focused on 3D-oriented examination to simplify the formalization and development of the method, but also limit, at the current stage, the scope of the techniques supported. The data were processed by conventional but variable lasergrammetric and photogrammetric methods and software programs, not detailed in this paper (this information can be retrieved in Figure 5 under the following path WHICH > Protocol > ProcessingSoftware). At the moment, even if the importance of the data quality DoC is known and has been discussed, the metrics integrated into some point clouds (e.g., point confidence attributes) are ignored during the fusion step. That being said, the only requirement is to have overlapping 3D point clouds that have been previously co-registered (See Figure 6). It is also important to clean the point clouds to avoid noise and outliers. The registration could be made using conventional 2D to 3D (feature- or marker-based) and/or 3D methods (e.g., ICPs), both used in the use case presented. Of course, the registration uncertainty must be compatible with the target analysis level, in our case the RMS was estimated to be below 1 cm error for all the point sets (while the analysis level is set to 4 cm). As shown in the overview of the 3D dataset (see Figure 3), not all the data are spatially connected and interlinked; hence, the interest of the overlapping and co-registration mapping proposed in Figure 6a,b. The methodology developed to build the multimodal fusion index is composed of the following main components:
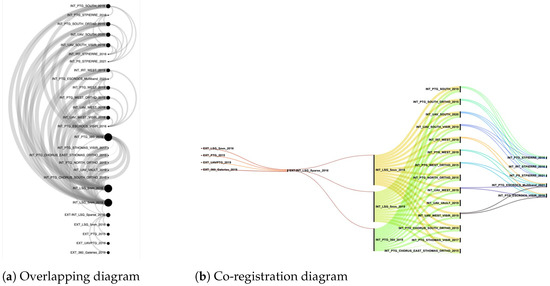
Figure 6.
Data-driven representation revealing the spatial correlation between the point cloud sources.
- Semantisation: The semantic labelling of each point cloud source is obtained beforehand thanks to the extensive MEMoS-based description. For a given naming value, matching is made between the name of the point cloud and the appellation attribute stored in the WHAT section. During the fusion step, the original cloud index is stored in the scalar field serving on the viewer side to retrieve and display a complete description of the source modality.
- Density estimation: The density is first estimated for each source with a variable local neighbouring radius (LNR). This helps to track of the local density that may vary according to the resolution of the point cloud source. The densities are unified using the LNR as a scaling factor to obtain a comparable approximation with regard to the multi-resolution of sources. A third and last density computation is made after the fusion, allowing to count the number of overlapping modalities for a given cell-size of the Octree.
- Octree computation and sampling: The multi-dimensional aspect of the sources (i.e., the scale and resolution) imply the need to unify the scale-space of the 3D datasets. The Octree is used as an underlying spatial grid, enabling multiple in-depth levels of detail. The sampling, based on a given Octree level, helps to discretize the point clouds to a comparable resolution while preserving the spatial coherence (e.g., Octree grid).
- Features scaling and fusion: Managing the variable dimensionality of the sources (i.e., spatial extensions, scales and resolutions) causes many issues on the computational side. At different steps of the algorithm, a feature scaling (using a min–max normalization method) is required to reach a comparative multi-source purpose. Feature aggregation is made from basic arithmetic functions, with a final formula obtained by an empirical trial-and-error process. This direction obtains a fusion index that preserve the local and absolute density variations, integrating the spatial overlapping of the modalities.
- Visual enhancement: As the densities were highly variable, the distribution of the feature values could lead to some visualization issues. As MEFI is an indicative attribute, some transformations could be made on the scalar field to improve their interpretative value (e.g., histogram equalization). This explains the bilateral smoothing applied in the last step to improve the distribution of values and decrease the impact of outliers and noise on the gradient. Once MEFI is computed, a colour map is created and fitted to the histogram. In the end a custom rainbow-based colour map is generated, but many others (diverging, wave, etc.) could be used and adapted to better reveal the MEFI features.
We chose to base the computation on the CloudCompare software [48] as it is an efficient, user-friendly and widely used tool in the CH community. At the current stage of development, the process was made directly through the GUI, even though some steps are accessible with CLI. The automatization and generalization of the method, planned for future works (see Section 5.2) and would be simplified by Python wrappers for CloudCompare (CloudCompy and the CloudCompare Python Plugin). The computational part is explained hereafter and detailed in pseudocode (see Algorithm A1 in Appendix A).
Given a list of raw co-registered point clouds, the method returns a single point cloud subsampled according to a definite observation scale. The resulting point cloud is enriched with a scalar field called a Multimodal Enhancement Fusion Index (MEFI) derived from a single geometric features (density). The index is expressed for each point within a range between 0 and 255, associated with a histogram-fitted colour map [49,50]. It is used to indicate if for a given 3D coordinate the fusion of multiple point-sets are rather sparse and isolated or dense and redundant. Unlike pair-wise methods (C2C and M3C2), MEFI can handle a list of point clouds with cumulative and comparative perspectives. MEFI has the ability to manage highly variable and heterogeneous sources, especially in terms of scale and resolution. This scalability issue has been tackled by the Octree data structure. In this way, according to a predefine minimal observation scale (i.e., the finest subdivision of the Octree), the whole computation can be swiftly interpolated for others down-scaling levels (see Figure 7). However, because we intend to deal with variable sources, preliminary tests faced the issue of outliers (either because point clouds were too sparse or too dense). The steps to compute the MEFI are three-fold and detailed hereafter as: defining variables, preparing data, and index computation.
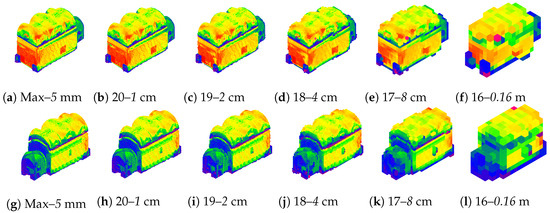
Figure 7.
MEFI interpolation for different Octree levels and the corresponding cell size. (a–f) View from the south-west, (g–l) and from the north-east.
For this reason we introduced, in step one, the notion of the observation scale to limit the impact of outliers. The aim of the observation scale is to define a metric range on which the index can be computed. It is derived from two intricate parameters, the minimal observation scale (mOS) sets the limit over which a higher density will be ignored and the final observation scale (fOS) which defines the scale unit for the computation. These values should be modulated according to the scale of the object itself and the spatial resolution of the digitization. The relation between mOS and fOS underlies the Octree subdivision level. In CloudCompare, the Octree has a maximum depth of 21, and is allowed to force the computation for a target cell size at the maximum level. At each level, the cell size is multiplied by two. Hence, for an mOS set to 0.005 (e.g., 5 mm) and equal to the minimum cell size, the respective sublevels are 0.01, 0.02, 0.04, 0.8, 0.16 and so on. In this study, the level 18 equivalent to a 4 cm cell size has been defined as a suitable unit for the fOS. As mentioned in the software documentation, Octree is particularly suited for spatial indexing, to optimize comparison algorithms, and efficient extraction of nearest neighbours, all fundamental elements for the proposed method. Indeed, relying on Octree for MEFI provides many advantages as it ensures spatial consistency between all sources, allows multi-scale approaches and quicken density computation (based on nearest neighbours).
In step two, for each point-cloud, data processing is initialized by a common Octree computation. Then, a density geometric features is calculated based on the number of neighbours with the LNR automatically given by CloudCompare from a statistical approach. The computational cost is significantly reduced at the expense of computing the density with a fixed LNR (for example the fOS), as clouds have very variable densities. The density is directly stored in a scalar field, attributing each point a value representing the number of neighbours within the LNR. At this point, a conditional statement is required to verify the density distribution among the sources, if the value of the LNR is below the mOS the raw point cloud is cleaned by a duplicated vertex removal function by giving the LNR as the minimum distance between the points. On this cleaned point cloud, the density computation is repeated and if the LNR still exceeds the mOS threshold, then the raw point cloud is subsampled at the maximum depth of the Octree (in our case, the equivalent to spatial subsampling with a 5 mm spacing between points). This point is important because it could affect the scalar distribution, resulting in visualization issues. When the optimized density is computed, the LNR value is stored in a scalar field as a constant. Additionally, a multimodal score (see Figure 8b) is also stored as a constant scalar field, if the point cloud contains other sub-modalities. For example, a point cloud resulting from a multi-band photogrammetric acquisition. In this case, the score is equal to the number of sub-modalities performed (e.g., two for a combined acquisition for visible and infrared wavelengths). This score is used in the next step to weight the computation. In fact, a dual-band point cloud carries twice the information of a visible RGB one. Meanwhile, the density previously computed only expresses a local neighbouring variation for a given point-set and cannot be compared with another. A scale-consistent density (see scaled density in Figure 8a) is calculated using arithmetic functions on scalar fields by dividing the initial density by the LNR value stored in R. Finally, the point cloud is subsampled according to the target unit set by fOS. At the end of this step, a list of homogeneously subsampled PCDs are obtained, each one enriched with scale-consistent scalar-fields used in the next data fusion step.
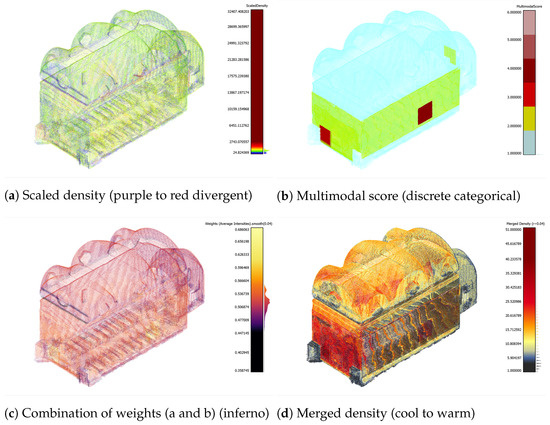
Figure 8.
Separated components used to compute MEFI (enhanced with custom colour maps).
In step three, all or a representative subset of point clouds (e.g., indoor, outdoor or any area of interest) are merged into a single point cloud. The merging function in CloudCompare preserves all 3D coordinates and automatically concatenates scalar fields with the same label. This point cloud inherits from previously computed scalar fields (density, R, multimodal score and scaled density, see Figure 8) and is enriched by an original cloud index to recall which point-set was the source of each point. From this output a new density is calculated (see merged density, in Figure 8d) based on the number of neighbours, but this time with an LNR defined as equal to the fOS (4 cm in our case). As the sources were subsampled at the same resolution and with a similar Octree grid, this returns the number of points for each cell of the Octree and enables the number of overlapping point clouds to be approximated at the cell level. Once equalized with the maximum feature scaling, a clear indicator of data redundancy is provided and expressed on the [0; 255] range. To complete the MEFI, two weights are added in the form of intensities (e.g., coded between the [0; 1] range). The first weight is derived from the logarithmic function apply to the scaled density scalar field. The second weight uses the root square of the multimodal score scalar field (see Figure 8b). The logarithmic and the root square are used to attenuate the impact of outliers, particularly if the maximum of each component is too high according to the mean or median value, tending to exponentially stretch the distribution of values. It is even more problematic in the case (such as ours) where high-resolution data (high scaled density value) are composed of multiple sub-modalities (top multimodal score) located in the area surveyed several times (high merged density). The weights are combined with simple arithmetic meaning (see Figure 8c). The MEFI is finally computed by multiplying the equalized merged density with the combined weights. However, as the merged point cloud has sparse density it results in a noisy visualization; therefore, the scalar field is smoothed using bilateral filtering. The parametrization of the filter is straightforward, giving the fOS as the spatial sigma and maximum of the MEFI as a scalar sigma. In order to resolve 3D visualization issues, the enhanced point cloud is resampled to fit the fOS, defined as suitable for analytical purposes.
5. Results and Discussions
The MEFI should not be considered as an end itself, but instead as a new starting point for further investigation. In this case, it revealed what was known within our team (validating somehow the method) unlike that this information was hidden, only available verbally or textually, following a thorough reading of our mission reports. The MEFI brought to light that we mostly worked on the west wall, with a strong focus on the “Escrocs” scene next to the entrance and the “St. Pierre” iconographic scene situated on the south wall (see Figure 9a). One can note the forgotten areas in the chorus, the surrounding west entrances, and above the cornices (see Figure 9b). At this point, the index could be easily used to highlight specific areas with simple filtering tools, as shown in Figure 10. For visualization issues, the dataset was split corresponding to the inside and outside. The outdoor acquisitions consisted of only five point-sets with reduced overlap, making the MEFI less meaningful and interesting (see Figure 6). The main difficulty was found in the management of the density deviation in the point cloud that diverged in scale and resolution. As an indicator, the mean scaled density values varied between 229 for the less dense and 5340 for the most dense, with a standard deviation of 3861. Even though the MEFI acutely reveals where data are concentrated, it does not directly provide information about the modality present for each point. Thus, we used the original cloud index scalar field, computed during the fusion step, to match and retrieve information on the data sources stored in the MEMoS description. Moreover, one can imagine more complex requests linking hard and soft data to explore 3D datasets within innovative visualization frameworks [15,39,51]. For example, one could filter the point cloud by technique and/or actor or reveal a specific multimodal combination for a given date. The foundations of such a prospective tool are outlined in the following subsections.
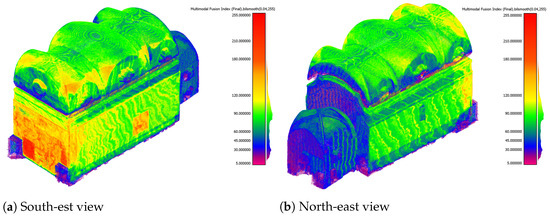
Figure 9.
Final point cloud enriched with MEFI.
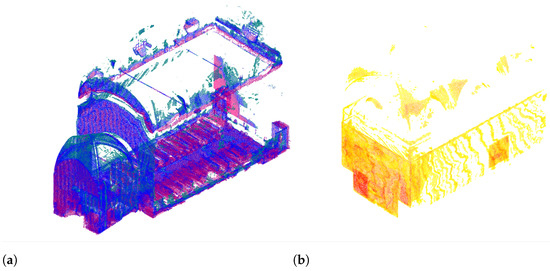
Figure 10.
Filtering on extreme low and high MEFI values to reveal multimodal discrepancies. (a) Highlighted sparse and isolated areas (MEFI ≤ 40) from north-east view. (b) Highlighted dense and redundant zones (MEFI ≥ 110) from south-west view.
5.1. A Custom Potree-Based Viewer
Nowadays, there are more and more ways to document reality-based 3D reconstructions by attaching metadata and/or paradata, whether through the use of description standards [52,53,54] or dedicated platforms [55,56,57,58]. On the other hand, data can be published to web pages using dedicated libraries [59,60,61]. Nonetheless, from a dissemination point of view, the visualization of 3D point clouds and related information are still considered as two distinct issues. Their union is generally considered through two systems, one including a 3D viewer, the other a table or list of metadata.
Yet, in the case of multimodal CH reconstructions resulting from the fusion of many sources, this is insufficient. Firstly, as previously discussed, the attributes qualifying the overall point cloud (average density, average overlap, etc.) do not really enrich the end-user’s understanding of the nature of the manipulated data, their origins, and their specificities. Secondly, the use of multiple sources leads to sparse metadata and paradata specific to each acquisition modality, which can therefore differ greatly from one another. Thus, the relevant information for the user may be very variable depending on the areas of interest of the final 3D point cloud. Thus, one must consider the additional information and visualization issues from a very local point of view. Furthermore, some initiatives intend to address the visualization of multi-layered data [14,39,62] (especially multi-spectral ones), but so far, beyond the support of multiple textures, 3D web visualization libraries do not really provide the possibility of exploiting the attributes resulting from these acquisition processes and their richness.
Considering this, we wanted to develop a 3D web-viewer, due to the need for a dissemination solution allowing us to benefit from the MEFI as an additional texture without losing the initial colours of the point cloud, but also to experiment ways of combining 3D visualizations with local metadata/paradata visualizations. To do so, we used Potree.JS, a free open-source library offering a WebGL-based renderer for large point clouds [59]. It is based on the prior generation of an Octree, performed using PotreeConverter 1.7 [63]. From the input point cloud, PotreeConverter generates a binary file per node, as well as a JSON-formatted file specifying the properties of the point cloud, in particular its attributes. For the conversion, only the Euclidean coordinates of each point are required, but the software still supports some optional attributes (e.g., normals or intensity).
To exploit the computed MEFI in the web-viewer, we first exported the point cloud in the PLY format, storing, besides the classical columns (i.e., coordinates, colours, normals), two additional custom attributes: the MEFI and an original cloud index, both given as integers. To perform the conversion of the PLY file into an Octree, PotreeConverter starts by reading the header to determine the properties of each point and their order. Then, for each point, an instance of the Point class is created and fetches its Euclidean coordinates and properties – only the one supported by Potree’s WebGL renderer. At the end of the Octree generation, the final files are written. As this process initially only covers some common attributes, we had to make a slight modification to the library in the second step, to preserve our custom MEFI and original cloud index attributes.
From this point, we were able to implement new functions into the web-viewer to support these attributes and exploit them for visualization. The MEFI was mainly used in the shader, to create a new gradient texture (see Figure 11a), which can, if necessary, be combined with others in a Potree composite texture. The MEFI numerical value corresponding to each point can be retrieved by the user with a point-picking tool. To query local metadata, we implemented a tool based on ray casting, allowing the real-time retrieval of all existing metadata and paradata concerning the hovered 3D point. Briefly, the principle is as follows: if we know the original cloud index value of a 3D point, then we can know which acquisition modality was used to generate it. It is then easy to query a JSON file containing the appropriate metadata, whether it is a local file or a document from an NoSQL database, to obtain the relevant information and display it directly in the viewer. In this way, the end-user can access in real time all the characteristics of the point cloud, be it its geometric and visual characteristics, a visual appreciation of the result of the multimodal fusion (the MEFI gradient), or any additional information associated with the 3D coordinates. A tool which operates in a relatively similar way also provides a count of the various modalities encountered within a 10 × 10 pixel square area and the mean value of their MEFI scores (see Figure 11b). We are currently working on a function that will use the original cloud index value to filter regions of the point cloud by acquisition modality. For example, one can hide all 3D points not generated from a photogrammetric acquisition in visible light. This kind of function is already widely used when it comes to classification and does not present any implementation issues.
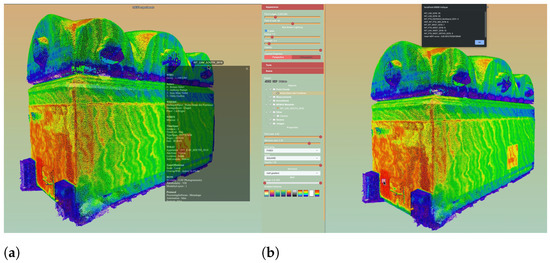
Figure 11.
Screen captures of the experimental MEFI features integrated into the Potree-based viewer. (a) MEMoS-based JSON associated with each 3D point; (b) multi-picking tool returning an overview of the overlapping modalities.
5.2. Limits and Future Works
With all these experiments, we intend to minimize the ambiguities likely to affect the interpretation and/or re-use of the data, in a context where 3D data is often manipulated by numerous researchers of different disciplinary backgrounds who were not involved in its acquisition or processing.
At the current and early stage of development, the MEFI shows promise with room for improvement. Firstly, solutions will be explored to overcome the limits of the 3D-dependent method. This will be investigated while trying to integrate other techniques, sensors and related data available on the NDF digital data collection; not only technical photography, RTI, hyperspectral imaging but also LIBS, XRF, sampling microscopy, thermographic and acoustic measurements [62,64]. Currently, non-3D techniques have been indirectly referenced, meaning that photogrammetric coverage has generally been made on the same documented area by another of the above-mentioned techniques. In these zones, the multimodal score (see Figure 8b) is augmented within the closest related point cloud to inform the user that multiple imaging modalities were performed. Of course the data are not merged, but we could at least identify that those techniques were applied simultaneously to the photogrammetric survey, which acts as an efficient pre-localization method. Despite our efforts to minimize the computation side, some aberrations and artefacts are still visible in the final index. To name a few, one could spot the reddish areas on the vaults which do not correspond to a meaningful overlap of modalities but are a consequence of insufficient cleaning of the source point clouds. Additionally, we could not remove the zebra artefacts, mostly visible on the south and north walls or the vaults as a counter-effect of the spatial subsampling steps. The computation itself could be improved by relying on the Octree method, this time not only for the representation, but to generate and/or modulate the index directly in the spatial grid instead of the point clouds. This resulted from the choice to operate the first experiment on the GUI version of CloudCompare. The next steps will aim to improve reproducibility by testing and adapting the MEFI on other use-cases. Meanwhile, automation and generalization of the method will benefit from Python bindings to exploit different packages (CloudCompPy, PyMeshLab, PCL, Open3D). In this way, the MEFI 2.0 could, for example, gain in computational cost and efficiency with prior overlap estimation based on oriented bounding boxes [65] and subsequent robust IoU estimation [66]. In addition, during the development, using more weights (e.g., qualitative metrics) could lead the MEFI towards an MoP tool. In a more prospective vision, this could overcharge and complicate the data for which the 3D file format would become inefficient, hence encapsulating it into a free-form and machine-learning friendly format using the HDF5 protocol. File format issues have already been encountered during this study, as the initial solution for semantic labelling was based on LAS classification. However, because of the inadequacy of the Q-Layer plugin in CloudCompare and some restrictions on the viewer side, custom attributes in the PLY format was preferred as a proof of concept. Ultimately, the soft and hard data represented in this study with 2D MEMoS-based visualization and 3D MEFI-based interaction, respectively, aim to be unified in a single framework. To this end, the conventional 3D visualization experience will be enhanced with semantic overlays.
Finally, the MEFI does not pretend to be a multi-feature index, as it is based on a single simple and highly understandable feature, easily accessible through open-source libraries. Relying on a widely diffuse and well-described feature, rather than sophisticated and supposedly more powerful, yet opaque solutions is a strong and assertive decision. Indeed, the MEFI could inherit multi-feature fusion benefits [67], but this point is left for possible future works and is out of the scope of this article. Following the idea that reducing the entanglement paradigms of data and representation is the most efficient human-driven approach to understand them [68], the question here has more epistemological aspects to better apprehend the nature of the manipulated data [69] rather than strictly technological prospects. That being said, we would like to state a disclaimer of non-interest in current ML/DL approaches, despite their contributions to data/information/sensor fusion issues [70]. They are challenging and thrilling methods but with a well-known inability to manage heterogeneous data, and are therefore excluded from this study. At the current stage of development, the MEFI is enabled to perform data integration from 3D point cloud representations. However, the integration of meshed surfaces based on their vertices is possible; however, this will require some adaptations on both the computational and visualization sides. As an example, it is not meant to natively digest raster or vector data, but we can rely on other powerful tools to spatialize and propagate attributes between 3D geometries and 2D resources, i.e., AIOLI [40]. Indeed, nothing prevents us from importing 3D regions from the annotation process before MEFI computation or to base the annotation on an MEFI-enriched point-set. This would be, in our sense, the most efficient way to integrate miscellaneous semantic information (e.g., humidity, temperature, colorimetry, materials, degradation etc.) at the purpose level. Another more sophisticated way, if data fusion ever appeared to be meaningful, would be to convert or bridge the MEFI with voxel-based methods, on which it is still possible to grasp semantic segmentation [71]. Based on recent work [72], we could also have the ability to work semantic label transfer between real-based modelling (i.e., enriched point cloud) and parametric-based modelling (i.e., H-BIM).
6. Conclusions
In this work, we presented a computational method providing an MEFI to 3D point clouds. We have developed a methodology to synthesize into a single point cloud a complex dataset obtained through multimodal 3D surveys. Their main issue of sparse resolutions and accuracies has been tackled by an Octree spatial grouping approach. This method can improve our understanding and therefore the interpretation of multi-source 3D models for CH-oriented studies. From a list of overlapping and registered point clouds, the proposed method returns, with reasonable and efficient computational cost, a density-based fusion index directly stored in point cloud attributes, easily readable by any 3D viewers. Combined with data-fitted colour maps, it acts similarly to a 3D heatmap to reveal the spatial variation between sparse and isolated or dense and redundant data, unveiling the multimodal digitization strategy deployed on heritage sites or objects. These first MEFI results show interesting aptitudes to managing multi-modal datasets, i.e., with simultaneous spatio-temporal layers. Interestingly, it is also robust to multi-resolution and multi-scale data thanks to the support of Octree spatial gridding. In this work, we also presented a lead for the data integration of semantic layers based on a descriptive capture metadata schema and CIDOC-CRM compliant format MEMoS [4], consequently contributing to improving data provenance in CH multimodal practices. In order to demonstrate the potential added-value to data analysis and interpretative prospects, a customized Potree viewer was developed to enhance the quantitative MEFI 3D features with qualitative and semantically enriched attributes. In conclusion, we hope that this work will contribute to CH-oriented studies towards intermodality (i.e., the passing and sharing information between several modality) and more prospectively to the upcoming leads and challenges in “hypermodality” (i.e., the interaction between cross-correlated complex geometric and semantic features).
Author Contributions
Conceptualization, A.P.; methodology, A.P.; software, A.P. and V.A.; validation, All authors; formal analysis, A.P.; investigation, A.P.; resources, A.P.; data curation, A.P.; writing—original draft preparation, A.P. and V.A.; writing—review and editing, A.P. and V.A.; visualization, A.P. and V.A.; supervision, L.d.L. and P.V. All authors have read and agreed to the published version of the manuscript.
Funding
This research received no external funding.
Data Availability Statement
All data used for this study, including soft data (metadata) and hard data (point clouds) are accessible and shared under the Etalab Open License 2.0. Pamart, Anthony (2023) « MEFI-Enriched 3D Multimodal Dataset of Notre Dame des Fontaines Chapel » (Dataset) NAKALA. https://doi.org/10.34847/nkl.b09eh54s (Last accessed: 2 May 2023).
Acknowledgments
The authors would like to acknowledge the stakeholders of the case studies presented in this study, namely, the tourism department of the city of La Brigue for access provided to the Notre-Dame des Fontaines chapel. In addition, the authors would like to acknowledge all experts involved in the data acquisition campaigns, especially the ones mentioned in the WHO section of the MEMoS metadata description (see Figure 4 and Figure 5) who contributed to the creation of this multimodal dataset.
Conflicts of Interest
The authors declare no conflict of interest.
Abbreviations
The following abbreviations are used in this manuscript, in order of appearance:
| DCH | Digital cultural heritage |
| CH | Cultural heritage |
| MEFI | Multimodal enhancement fusion index |
| ICP | Iterative closest points |
| DoC | Degree of confidence |
| MoP | Measure of performance |
| MEMoS | Metadata-enriched multimodal documentation system |
| C2C | Cloud to cloud |
| C2M | Cloud to mesh |
| M3C2 | Linear dichroism |
| H-BIM | Heritage building information modelling |
| IFC | Industry foundation classes |
| RMS | Root mean square |
| LNR | Local neighbouring radius |
| PCD | Point cloud data |
| GUI | Graphical user interface |
| CLI | Command line interface |
| PLY | Polygon file format |
| NDF | Notre Dame des Fontaines |
| RTI | Reflectance transformation imaging |
| LIBS | Laser-induced breakdown spectroscopy |
| XRF | X-ray fluorescence |
| PCL | Point cloud library |
| IoU | Intersection or union |
| HDF5 | Hierarchical data format version 5 |
Appendix A
| Algorithm A1: Pseudocode of Multimodal Enhancement Fusion Index computational method |
| Data: List of N registered and overlaping Point Cloud Data (PCD) Result: Single PCD enhanced with Multimodal Fusion Index STEP ONE/Defining variables Set minimal (e.g., 5 mm): 0.005; min = in (21); final (fOS) is defined by OctreeSubDivisionLevel; If : then (=4 cm) STEP TWO/Preparing each source data for fusion 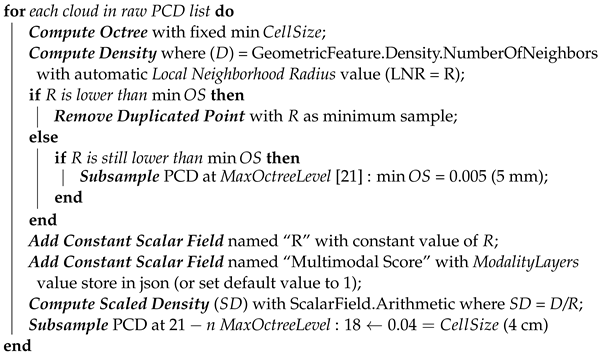 STEP THREE/Computing point cloud fusion enhanced with multimodal index Merge subsampled PCD; Compute Merged Density where () = GeometricFeature.Density.NumberOfNeighbors with R = Analysis CellSize; Equalize Merged Density () with ScalarField.Arithmetic where ; Compute with; ; ; Combine with arithmetic mean; ; Compute Multimodal Enhancement Fusion Index () with ScalarField.Arithmetic ; Apply ScalarField.BilateralFilter with and ; Equalize with ScalarField.Arithmetic ; Resample at MaxOctreeLevel: (fOS = 4 cm) |
References
- Matrone, F.; Grilli, E.; Martini, M.; Paolanti, M.; Pierdicca, R.; Remondino, F. Comparing machine and deep learning methods for large 3D heritage semantic segmentation. ISPRS Int. J. Geo-Inf. 2020, 9, 535. [Google Scholar] [CrossRef]
- Poux, F.; Neuville, R.; Van Wersch, L.; Nys, G.A.; Billen, R. 3D Point Clouds in Archaeology: Advances in Acquisition, Processing and Knowledge Integration Applied to Quasi-Planar Objects. Geosciences 2017, 7, 96. [Google Scholar] [CrossRef]
- Buitelaar, P.; Cimiano, P.; Frank, A.; Hartung, M.; Racioppa, S. Ontology-based information extraction and integration from heterogeneous data sources. Int. J. Hum. Comput. Stud. 2008, 66, 759–788. [Google Scholar] [CrossRef]
- Pamart, A.; De Luca, L.; Véron, P. A metadata enriched system for the documentation of multi-modal digital imaging surveys. Stud. Digit. Herit. 2022, 6, 1–24. [Google Scholar] [CrossRef]
- Pamart, A.; Guillon, O.; Vallet, J.M.; De Luca, L. Toward a multimodal photogrammetric acquisition and processing methodology for monitoring conservation and restoration studies. In Proceedings of the 14th EUROGRAPHICS Workshop on Graphics and Cultural Heritage, Genova, Italy, 5–7 October 2016. [Google Scholar]
- Remondino, F.; Rizzi, A. Reality-based 3D documentation of natural and cultural heritage sites—techniques, problems, and examples. Appl. Geomat. 2010, 2, 85–100. [Google Scholar] [CrossRef]
- Mathys, A.; Jadinon, R.; Hallot, P. Exploiting 3D multispectral texture for a better feature identification for cultural heritage. ISPRS Ann. Photogramm. Remote Sens. Spat. Inf. Sci. 2019, IV-2/W6, 91–97. [Google Scholar] [CrossRef]
- Guidi, G.; Russo, M.; Ercoli, S.; Remondino, F.; Rizzi, A.; Menna, F. A Multi-Resolution Methodology for the 3D Modeling of Large and Complex Archeological Areas. Int. J. Archit. Comput. 2009, 7, 39–55. [Google Scholar] [CrossRef]
- Markiewicz, J.; Bochenska, A.; Kot, P.; Lapinski, S.; Muradov, M. The Integration of The Multi-Source Data for Multi-Temporal Investigation of Cultural Heritage Objects. In Proceedings of the 2021 14th International Conference on Developments in eSystems Engineering (DeSE), Sharjah, United Arab Emirates, 7–10 December 2021; IEEE: Sharjah, United Arab Emirates, 2021; pp. 63–68. [Google Scholar] [CrossRef]
- Rodríguez-Gonzálvez, P.; Guerra Campo, Á.; Muñoz-Nieto, Á.L.; Sánchez-Aparicio, L.J.; González-Aguilera, D. Diachronic reconstruction and visualization of lost cultural heritage sites. ISPRS Int. J. Geo-Inf. 2019, 8, 61. [Google Scholar] [CrossRef]
- Adamopoulos, E.; Rinaudo, F. 3D interpretation and fusion of multidisciplinary data for heritage science: A review. In Proceedings of the 27th CIPA International Symposium-Documenting the Past for a Better Future, Avila, Spain, 1–5 September 2019; International Society for Photogrammetry and Remote Sensing: Bethesda, MA, USA, 2019; Volume 42, pp. 17–24. [Google Scholar]
- Adamopoulos, E.; Tsilimantou, E.; Keramidas, V.; Apostolopoulou, M.; Karoglou, M.; Tapinaki, S.; Ioannidis, C.; Georgopoulos, A.; Moropoulou, A. Multi-Sensor Documentation of Metric and Qualitative Information of Historic Stone Structures. ISPRS Ann. Photogramm. Remote Sens. Spat. Inf. Sci. 2017, 4, 1–8. [Google Scholar] [CrossRef]
- Tschauner, H.; Salinas, V.S. Stratigraphic modeling and 3D spatial analysis using photogrammetry and octree spatial decomposition. In Digital Discovery: Exploring New Frontiers in Human Heritage: CAA 2006: Computer Applications and Quantitative Methods in Archaeology, Proceedings of the 34th Conference, Fargo, ND, USA, April 2006; pp. 257–270. Available online: https://proceedings.caaconference.org/paper/cd28_tschauner_siveroni_caa2006/ (accessed on 3 April 2023).
- Pamart, A.; Ponchio, F.; Abergel, V.; Alaoui M’Darhri, A.; Corsini, M.; Dellepiane, M.; Morlet, F.; Scopigno, R.; De Luca, L. A complete framework operating spatially-oriented RTI in a 3D/2D cultural heritage documentation and analysis tool. ISPRS—Int. Arch. Photogramm. Remote Sens. Spat. Inf. Sci. 2019, XLII-2/W9, 573–580. [Google Scholar] [CrossRef]
- Grifoni, E.; Bonizzoni, L.; Gargano, M.; Melada, J.; Ludwig, N.; Bruni, S.; Mignani, I. Hyper-dimensional Visualization of Cultural Heritage: A Novel Multi-analytical Approach on 3D Pomological Models in the Collection of the University of Milan. J. Comput. Cult. Herit. 2022, 15, 1–15. [Google Scholar] [CrossRef]
- Ramos, M.; Remondino, F. Data fusion in Cultural Heritage—A Review. ISPRS—Int. Arch. Photogramm. Remote Sens. Spat. Inf. Sci. 2015, XL-5/W7, 359–363. [Google Scholar] [CrossRef]
- Adamopoulos, E.; Rinaudo, F. Close-Range Sensing and Data Fusion for Built Heritage Inspection and Monitoring—A Review. Remote Sens. 2021, 13, 3936. [Google Scholar] [CrossRef]
- Huang, X.; Mei, G.; Zhang, J.; Abbas, R. A comprehensive survey on point cloud registration. arXiv 2021, arXiv:2103.02690. [Google Scholar]
- Pintus, R.; Gobbetti, E.; Callieri, M.; Dellepiane, M. Techniques for seamless color registration and mapping on dense 3D models. In Sensing the Past; Springer: Cham, Switzerland, 2017; pp. 355–376. [Google Scholar]
- Klein, L.A. Sensor and Data Fusion: A Tool for Information Assessment and Decision Making (SPIE Press Monograph Vol. PM138SC); SPIE Press: Bellingham, WA, USA, 2004. [Google Scholar] [CrossRef]
- Hall, D.L.; Steinberg, A. Dirty Secrets in Multisensor Data Fusion; Technical Report; Pennsylvania State University Applied Research Laboratory: University Park, PA, USA, 2001. [Google Scholar]
- Boström, H.; Andler, S.F.; Brohede, M.; Johansson, R.; Karlsson, E.; Laere, J.V.; Niklasson, L.; Nilsson, M.; Persson, A.; Ziemke, T. On the Definition of Information Fusion as a Field of Research; IKI Technical Reports; HS-IKI-TR-07-006; Institutionen för Kommunikation och Information: Skövde, Sweden, 2007. [Google Scholar]
- Lahat, D.; Adali, T.; Jutten, C. Multimodal data fusion: An overview of methods, challenges, and prospects. Proc. IEEE 2015, 103, 1449–1477. [Google Scholar] [CrossRef]
- Khaleghi, B.; Khamis, A.; Karray, F.O.; Razavi, S.N. Multisensor data fusion: A review of the state-of-the-art. Inf. Fusion 2013, 14, 28–44. [Google Scholar] [CrossRef]
- Hall, D.L.; McNeese, M.; Llinas, J.; Mullen, T. A framework for dynamic hard/soft fusion. In Proceedings of the 2008 11th International Conference on Information Fusion, Sun City, South Africa, 1–4 November 2008; pp. 1–8. [Google Scholar]
- Antova, G. Application of Areal Change Detection Methods Using Point Clouds Data. IOP Conf. Ser. Earth Environ. Sci. 2019, 221, 012082. [Google Scholar] [CrossRef]
- James, M.R.; Robson, S.; Smith, M.W. 3-D uncertainty-based topographic change detection with structure-from-motion photogrammetry: Precision maps for ground control and directly georeferenced surveys: 3-D uncertainty-based change detection for SfM surveys. Earth Surf. Process. Landf. 2017, 42, 1769–1788. [Google Scholar] [CrossRef]
- Hänsch, R.; Weber, T.; Hellwich, O. Comparison of 3D interest point detectors and descriptors for point cloud fusion. ISPRS Ann. Photogramm. Remote Sens. Spat. Inf. Sci. 2014, II-3, 57–64. [Google Scholar] [CrossRef]
- Farella, E.M.; Torresani, A.; Remondino, F. Quality Features for the Integration of Terrestrial and UAV Images. ISPRS—Int. Arch. Photogramm. Rem. Sens. Spatial Inf. Sci. 2019, XLII-2-W9, 339–346. [Google Scholar] [CrossRef]
- Li, Y.; Liu, P.; Li, H.; Huang, F. A Comparison Method for 3D Laser Point Clouds in Displacement Change Detection for Arch Dams. ISPRS Int. J. Geo-Inf. 2021, 10, 184. [Google Scholar] [CrossRef]
- Weinmann, M.; Jutzi, B.; Mallet, C.; Weinmann, M. Geometric features and their relevance for 3D point cloud classification. ISPRS Ann. Photogramm. Remote Sens. Spat. Inf. Sci. 2017, IV-1/W1, 157–164. [Google Scholar] [CrossRef]
- Ioannou, Y.; Taati, B.; Harrap, R.; Greenspan, M. Difference of normals as a multi-scale operator in unorganized point clouds. In Proceedings of the 2012 Second International Conference on 3D Imaging, Modeling, Processing, Visualization & Transmission, Zurich, Switzerland, 13–15 October 2012; pp. 501–508. [Google Scholar]
- Hackel, T.; Wegner, J.D.; Schindler, K. Joint classification and contour extraction of large 3D point clouds. ISPRS J. Photogramm. Remote Sens. 2017, 130, 231–245. [Google Scholar] [CrossRef]
- Li, W.; Wang, C.; Zai, D.; Huang, P.; Liu, W.; Wen, C.; Li, J. A Volumetric Fusing Method for TLS and SFM Point Clouds. IEEE J. Sel. Top. Appl. Earth Obs. Remote Sens. 2018, 11, 3349–3357. [Google Scholar] [CrossRef]
- Li, S.; Ge, X.; Hu, H.; Zhu, Q. Laplacian fusion approach of multi-source point clouds for detail enhancement. ISPRS J. Photogramm. Remote Sens. 2021, 171, 385–396. [Google Scholar] [CrossRef]
- Yang, X.; Grussenmeyer, P.; Koehl, M.; Macher, H.; Murtiyoso, A.; Landes, T. Review of Built Heritage Modelling: Integration of HBIM and Other Information Techniques. J. Cult. Heritage 2020, 46, 350–360. [Google Scholar] [CrossRef]
- Nishanbaev, I.; Champion, E.; McMeekin, D.A. A Web GIS-Based Integration of 3D Digital Models with Linked Open Data for Cultural Heritage Exploration. ISPRS Int. J. Geo-Inform. 2021, 10, 684. [Google Scholar] [CrossRef]
- Ortega-Alvarado, L.M.; García-Fernández, Á.L.; Conde-Rodríguez, F.; Jurado-Rodríguez, J.M. Integrated and Interactive 4D System for Archaeological Stratigraphy. Archaeol. Anthropol. Sci. 2022, 14, 203. [Google Scholar] [CrossRef]
- Jaspe-Villanueva, A.; Ahsan, M.; Pintus, R.; Giachetti, A.; Marton, F.; Gobbetti, E. Web-based exploration of annotated multi-layered relightable image models. J. Comput. Cult. Heritage (JOCCH) 2021, 14, 1–29. [Google Scholar] [CrossRef]
- Manuel, A.; Abergel, V. Aïoli, a Reality-Based Annotation Cloud Platform for the Collaborative Documentation of Cultural Heritage Artefacts. In Proceedings of the Un Patrimoine Pour L’avenir, Une Science Pour le Patrimoine, Paris, France, 15–16 March 2022. [Google Scholar]
- Dutailly, B.; Portais, J.C.; Granier, X. RIS3D: A Referenced Information System in 3D. J. Comput. Cult. Heritage 2023, 15, 1–20. [Google Scholar] [CrossRef]
- Soler, F.; Melero, F.J.; Luzón, M.V. A Complete 3D Information System for Cultural Heritage Documentation. J. Cult. Heritage 2017, 23, 49–57. [Google Scholar] [CrossRef]
- Richards-Rissetto, H.; von Schwerin, J. A catch 22 of 3D data sustainability: Lessons in 3D archaeological data management & accessibility. Digit. Appl. Archaeol. Cult. Herit. 2017, 6, 38–48. [Google Scholar]
- Nova Arévalo, N.; González, R.A.; Beltrán, L.C.; Nieto, C.E. A Knowledge Management System for Sharing Knowledge About Cultural Heritage Projects. SSRN Elect. J. 2023. Available online: https://ssrn.com/abstract=4330691 (accessed on 3 April 2023). [CrossRef]
- Liu, J.; Ram, S. Improving the Domain Independence of Data Provenance Ontologies: A Demonstration Using Conceptual Graphs and the W7 Model. J. Database Manag. 2017, 28, 43–62. [Google Scholar] [CrossRef]
- Ram, S.; Liu, J. A semiotics framework for analyzing data provenance research. J. Comput. Sci. Eng. 2008, 2, 221–248. [Google Scholar] [CrossRef]
- Georgiev, I.; Georgiev, I. An Information Technology Framework for the Development of an Embedded Computer System for the Remote and Non-Destructive Study of Sensitive Archaeology Sites. Computation 2017, 5, 21. [Google Scholar] [CrossRef]
- Girardeau-Montaut, D. CloudCompare (Version 2.12.4) [GPL Software]. 2022. Available online: https://www.danielgm.net/cc/ (accessed on 4 April 2023).
- Crameri, F.; Shephard, G.E.; Heron, P.J. The misuse of colour in science communication. Nat. Commun. 2020, 11, 5444. [Google Scholar] [CrossRef]
- Liu, Y.; Heer, J. Somewhere Over the Rainbow: An Empirical Assessment of Quantitative Colormaps. In Proceedings of the 2018 CHI Conference on Human Factors in Computing Systems, Montreal, QC, Canada, 21–26 April 2018; Association for Computing Machinery: New York, NY, USA, 2018; pp. 1–12. [Google Scholar] [CrossRef]
- Bares, A.; Keefe, D.F.; Samsel, F. Close Reading for Visualization Evaluation. IEEE Comput. Graphics Appl. 2020, 40, 84–95. [Google Scholar] [CrossRef]
- D’Andrea, A.; Fernie, K. 3D ICONS metadata schema for 3D objects. Newsl. Archeol. CISA 2013, 4, 159–181. [Google Scholar]
- D’Andrea, A.; Fernie, K. CARARE 2.0: A metadata schema for 3D cultural objects. In Proceedings of the 2013 Digital Heritage International Congress (DigitalHeritage), Marseille, France, 28 October 2013–1 November 2013; Volume 2, pp. 137–143. [Google Scholar] [CrossRef]
- Hermon, S.; Niccolucci, F.; Ronzino, P. A Metadata Schema for Cultural Heritage Documentation. In Electronic Imaging & the Visual Arts: EVA 2012 Florence, 9–11 May 2012; Firenze University Press: Firenze, Italy, 2012. [Google Scholar] [CrossRef]
- Tournon, S.; Baillet, V.; Chayani, M.; Dutailly, B.; Granier, X.; Grimaud, V. The French National 3D Data Repository for Humanities: Features, Feedback and Open Questions. In Proceedings of the Computer Applications and Quantitative Methods in Archaeology (CAA) 2021, Lymassol (Virtual), Cyprus, 14–18 June 2021. [Google Scholar]
- Meghini, C.; Scopigno, R.; Richards, J.; Wright, H.; Geser, G.; Cuy, S.; Fihn, J.; Fanini, B.; Hollander, H.; Niccolucci, F.; et al. ARIADNE: A Research Infrastructure for Archaeology. J. Comput. Cult. Herit. (JOCCH) 2017, 10, 1–27. [Google Scholar] [CrossRef]
- Petras, V.; Hill, T.; Stiller, J.; Gäde, M. Europeana—A Search Engine for Digitised Cultural Heritage Material. Datenbank-Spektrum 2017, 17, 41–46. [Google Scholar] [CrossRef]
- Boutsi, A.M.; Ioannidis, C.; Soile, S. An Integrated Approach to 3D Web Visualization of Cultural Heritage Heterogeneous Datasets. Remote Sens. 2019, 11, 2508. [Google Scholar] [CrossRef]
- Schutz, M. Potree: Rendering Large Point Clouds in Web Browsers. Master’s Thesis, Institute of Computer Graphics and Algorithms, Vienna University of Technology, Vienna, Austria, 2016. [Google Scholar]
- Potenziani, M.; Callieri, M.; Dellepiane, M.; Corsini, M.; Ponchio, F.; Scopigno, R. 3DHOP: 3D Heritage Online Presenter. Comput. Graph. 2015, 52, 129–141. [Google Scholar] [CrossRef]
- CesiumJS: 3D Geospatial Visualization for the Web. 2022. Available online: https://cesium.com/platform/cesiumjs/ (accessed on 2 September 2022).
- Bergerot, L.; Blaise, J.Y.; Pamart, A.; Dudek, I. Visual Cross-Examination of Architectural and Acoustic Data: The 3d Integrator Experiment. Int. Arch. Photogramm. Remote Sens. Spat. Inf. Sci. 2022, 46, 81–88. [Google Scholar] [CrossRef]
- Schutz, M. GitHub—Potree/PotreeConverter: Create Multi Res Point Cloud to Use with Potree. 2022. Available online: https://github.com/potree/PotreeConverter (accessed on 2 September 2022).
- Blaise, J.Y.; Dudek, I.; Pamart, A.; Bergerot, L.; Vidal, A.; Fargeot, S.; Aramaki, M.; Ystad, S.; Kronland-Martinet, R. Acquisition and Integration of Spatial and Acoustic Features: A Worflow Tailored to Small-Scale Heritage Architecture; IMEKO International Measurement Confederation: Budapest, Hungary, 2022. [Google Scholar] [CrossRef]
- Chang, C.T.; Gorissen, B.; Melchior, S. Fast oriented bounding box optimization on the rotation group SO (3,R). ACM Trans. Graphics (TOG) 2011, 30, 1–16. [Google Scholar]
- Xu, J.; Ma, Y.; He, S.; Zhu, J. 3D-GIoU: 3D Generalized Intersection over Union for Object Detection in Point Cloud. Sensors 2019, 19, 4093. [Google Scholar] [CrossRef]
- Zhang, Y.; Li, K.; Chen, X.; Zhang, S.; Geng, G. A multi feature fusion method for reassembly of 3D cultural heritage artifacts. J. Cult. Herit. 2018, 33, 191–200. [Google Scholar] [CrossRef]
- Buglio, D.L.; Derycke, D. Reduce to Understand: A Challenge for Analysis and Three-dimensional Documentation of Architecture. In Environmental Representation: Bridging the Drawings and Historiography of Mediterranean Vernacular Architecture; Lodz University of Technology: Lodz, Poland, 2015. [Google Scholar]
- Verhoeven, G.J.; Santner, M.; Trinks, I. FROM 2D (TO 3D) TO 2.5D – NOT ALL GRIDDED DIGITAL SURFACES ARE CREATED EQUALLY. ISPRS Ann. Photogramm. Remote Sens. Spat. Inf. Sci. 2021, VIII-M-1–2021, 171–178. [Google Scholar] [CrossRef]
- Jusoh, S.; Almajali, S. A systematic review on fusion techniques and approaches used in applications. IEEE Access 2020, 8, 14424–14439. [Google Scholar] [CrossRef]
- Poux, F.; Billen, R. Voxel-Based 3D Point Cloud Semantic Segmentation: Unsupervised Geometric and Relationship Featuring vs. Deep Learning Methods. ISPRS Int. J. Geo-Inf. 2019, 8, 213. [Google Scholar] [CrossRef]
- Croce, V.; Caroti, G.; Piemonte, A.; De Luca, L.; Véron, P. H-BIM and Artificial Intelligence: Classification of Architectural Heritage for Semi-Automatic Scan-to-BIM Reconstruction. Sensors 2023, 23, 2497. [Google Scholar] [CrossRef] [PubMed]
Disclaimer/Publisher’s Note: The statements, opinions and data contained in all publications are solely those of the individual author(s) and contributor(s) and not of MDPI and/or the editor(s). MDPI and/or the editor(s) disclaim responsibility for any injury to people or property resulting from any ideas, methods, instructions or products referred to in the content. |
© 2023 by the authors. Licensee MDPI, Basel, Switzerland. This article is an open access article distributed under the terms and conditions of the Creative Commons Attribution (CC BY) license (https://creativecommons.org/licenses/by/4.0/).