Abstract
The measurement of volcanic gases, such as CO2 and SO2, emitted from summit craters and fumaroles is crucial to monitor volcanic activity, providing estimations of gases fluxes, and geochemical information that helps to assess the status and the risk level of an active volcano. During high degassing events, the measurement of volcanic emissions is a dangerous task that cannot be performed using hand portable or backpack carried gas analysis systems. Measurements of gases plumes could be safety achieved by using instruments mounted on UAS (Unmanned Aerial System). In this work, we present the measurements of CO2, SO2, and H2S gases collected with a miniaturized MultiGAS instrument during 2021 and 2022 field campaigns. They took place at several thermally active areas in Italy: Pisciarelli (Naples, Italy), Stromboli volcano (Messina, Italy), and Parco Naturalistico delle Biancane (Grosseto, Italy).
1. Introduction
Characterization of gas emissions at dangerous or difficult to reach areas (i.e., geothermal areas or active volcanoes) without risking injuries or even the lives of scientists and personnel performing the analysis during field campaigns can be enhanced with the use of miniaturized instruments mounted onboard Unmanned Aerial System (UAS) [1].
In this study, we report results of plume investigations at Italian sites, using a small MultiGAS sensing payload (miniGAS) designed for either hand-portable, ground and airborne platform operations. The measurements of CO2, H2S, and SO2 were collected both hand carrying the instrument and mounting it on the UAS. The selected areas were Italian thermally active sites (Figure 1) that were well studied in terms of gases emission: Pisciarelli area (at NE of the Solfatara volcano, Napoli) and Stromboli Island are characterized by volcanic activity, while Parco Naturalistico delle Biancane (Grosseto) presents thermal manifestation with fumaroles in a geothermal context. While particular attention is given to the two active volcanic areas (Pisciarelli and Stromboli) with a constant monitoring of gases measured by ground stations and dedicated field campaigns [2,3,4], Parco Naturalistico delle Biancane is characterized by a geothermal field with hot and pressurized fluids used for the production of electricity [5,6] and requires gases measurements for geothermal system characterization. For these reasons, the measurement of the gases needs more attention for both volcanic surveillance and geothermal prospection (Figure 2). Specifically, close to Pisciarelli, there are numerous inhabited centers which could be interested by gases exhalations; volcanic activity of Stromboli is usually characterized by violent eruptions that can be dangerous for citizens and tourists; geothermal area of Parco delle Biancane is continuous interested by underground phenomena manifested with gases emissions and heating of the surface.
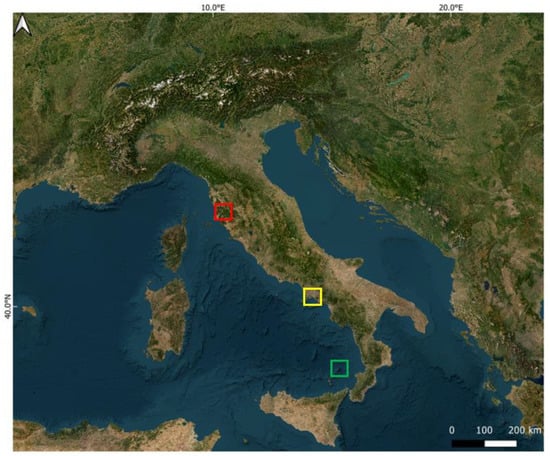
Figure 1.
Test sites location: Pisciarelli area (yellow box), Stromboli Island (green box) and Parco Naturalistico delle Biancane (red box). Basemap from ESRI satellite (World_Imagery (MapServer)—ArcGIS).
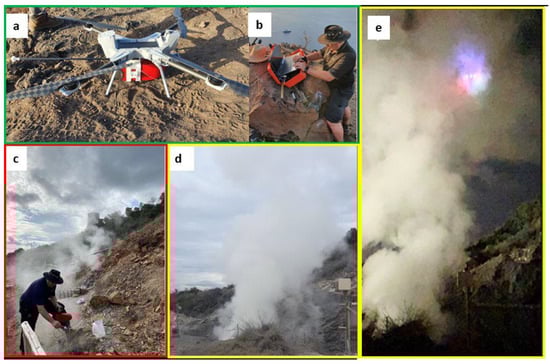
Figure 2.
Field campaigns: (a) miniGAS mounted on SR-X4 [9] UAS during the Stromboli field campaign; (b) real-time remote data collection (1 km from the summit); (c) miniGAS at the Parco Naturalistico delle Biancane site hand carried during ground survey; (d) Pisciarelli biggest fumarole; (e) miniGAS mounted on SR-X4 UAS collecting data of gas concentration during the night (Pisciarelli).
The gas content information obtained from in situ measurements or from UAS systems is also useful to assess and validate satellite retrievals [7,8]. The integration of satellite and in situ collected data can be used, for example, to improve retrieval of SO2 emissions from craters.
2. Materials, Methods, and Sites Description
2.1. Miniature MultiGAS Sensing Payload
The miniGAS instrument (Figure 3) was developed by Dr. Jorge Andres Diaz and includes temperature, pressure, relative humidity, SO2, and H2S electrochemical sensors and a non-dispersing near infrared CO2 sensor. Moreover, it also includes a GPS sensor, onboard data storage, and telemetry via mid-range RF antennas with up to 1.5 km of connectivity range for real-time and remote in situ gas data collections. The new version (miniGAS PRO) deployed during the 2022 Italian campaigns consists of a Campbell CR310 data logger recording signals from a PP System CO2 infrared spectrometer (SBA-5 OEM; 0–2000 ppm concentration range), which also includes a solid-state H2O partial pressure sensor (0–40 mbar range). The data logger also records signals from up to four City Technology (UK) electrochemical sensors: two for SO2 (EZT3ST/F; 0–200 ppm; 2TD2G-1A 0–10 ppm concentration range), one for H2S (0–50 ppm; 2TC4E-1AEZT3H; 0–50 ppm; concentration range), and one optional H2 sensor T3HYT; 0–100 ppm concentration range). Gas enters the inlet located 1.2 m away from the drone core. The distance was selected to reduce the effects of the rotor draft flow over the plume to sample “undisturbed plume gas” as much as possible. The gas sample is circulated through the system through ¼ PTFE tubing by a small diaphragm pump at a flowrate of ~1.2 lpm, which connects the inlet to the sensor array. A 1.2 um PTFE Teflon filter is attached to the tubing as an inlet to avoid dust, particles, and small droplets into the miniGAS. Moreover, information on time, temperature, pressure, relative humidity, and position are also recorded with the gas concentration data and prepared to be send by telemetry by the data logger. Data is both recorded and transmitted at 1 Hz from the UAS to a laptop computer via radio transmitter (RF-407 RPSMA radio transmitter from Campbell Scientific at 915–928 Mz.). The miniGAS has a universal adapter for easy and quick integration to different UAS platforms.
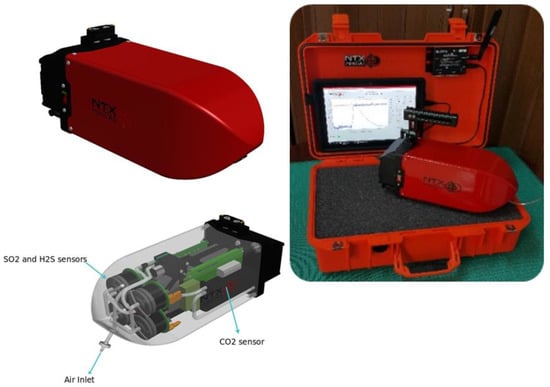
Figure 3.
miniGAS PRO System.
The weight of the miniGAS PRO version is 1.5 kg, this includes the rechargeable LiPo battery (which allow up to 2 h of operation) and the weatherproof glass/carbo fiber aerodynamic case. The size is 28 cm L × 12 cm H × 12 cm W), which makes it very compact for multirotor or fix wing drone operation. Earlier versions of the miniGAS (Alpha, Beta) have been flight tested and deployed in Costa Rica within the Turrialba volcano plume [1,10,11,12,13] using different drones and tethered balloons platforms, generating real time 3D gas concentration plots of active volcanic plumes. The miniGAS PRO is a newer version from the earlier miniGAS NTX deployed during the Solfatara-Vulcano 2015 campaign to characterize fumarolic sites [14]. Improvements include better electrochemical and infrared sensors, more robust data logger, lighter frame, ruggedized fiber glass/carbon case for harsh conditions, new GPS, new PCBs, and better software-hardware interfaces. This newer version has been successfully deployed within active volcanic plumes at Turrialba and Masaya volcanoes [15,16,17], Mt. Etna in 2018, Poas volcano [18], Kilauea volcano [19], Manam and Tavurvur volcanoes in 2019 [20], and at an industrial field gas sensing application in Scotland and Kazakhstan in 2019.
The measurements were conducted either by hand carrying the instrument into the fumaroles (“sampling walk”) or by flying different UAS over the fumarolic sites. Each gas sensor is calibrated prior to each deployment using calibration gases (Zero and Span gas concentration values for each sensor). Following this approach, the system is exposed to the calibration gases via sample bag connected to the inlet and once stable, the analog signals are adjusted to the know concentration to provide in real time calibrated concentration data. Time response (system response time and sensor response time) is incorporated as part of the calibration process of the miniGAS, so concentration data reflect exact GPS position and exact concentration values when sampling for a short period of time. Raw data (Digital, voltage and mA signals) are also recorded and transmitted during the field measurements for post field deployment calibration if necessary.
2.2. Unmanned Aerial System (UAS)
The SR-X4 system is a multi-rotor drone designed to optimize performance by reducing weight and dimensions, in order to provide a multi-role and multipurpose instrument with high performance in terms of operating range and autonomy [9].
SR-X4 quadcopter UAS has an extended flight endurance and range, allowing to fly up to 40 min, 15 km away, and carrying a payload of up to 2 kg. Table 1 reports the main features. The SR-X4 System is a multi-role system with great versatility, able to maximize performance in flight and range. It is extremely accurate and quiet, with fast actuation times and it features a high load capacity. This UAS is the ideal platform to integrate specialized and multi-sensor payloads, suitable for missions that require a large operational range and high persistence on the area of interest. The entire system can be easily transported in a practical fly case or even in a tactical backpack compliant with the “Iata” standard. It also has the possibility to integrate a thermal payload (Figure 4).

Table 1.
UAS SR-X4 main technical characteristics.
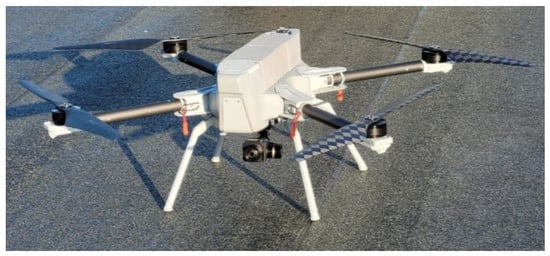
Figure 4.
SR-X4 quadcopter UAS.
2.3. Field Campaigns
Three field campaigns were conducted in different sites (Table 2).
Table 2.
Sites where PRO sensor was used. The third column report the modality of data acquisition.
Pisciarelli fumarole is one of the main fumaroles located at the NE part of the Solfatara area (Naples) [21,22,23,24]. This fumarolic field is about 0.03 km2 fault-related hydrothermal area and has shown clear signs of increasing hydrothermal activity during the ongoing phase of unrest. Pisciarelli is characterized by the presence of large mud pools with intense bubbling, and by high flow rate fumaroles emitting a H2O-CO2 rich gas mixture with minor H2S [23]. In recent years, the fumarolic field of Pisciarelli has experienced an evident increase in activity, which has been marked by temperature increases, by the opening of new vigorous vents and boiling pools, and by the occurrence of seismic activity localized in the area [21]. Fumaroles emit vapors characterized by the absence of acidic gas species (i.e., SO2, HCl, and HF) that are typical of high-temperature magmatic gas emissions. They also exhibit detectable amounts of species formed in the hydrothermal environment (i.e., CH4). These compositions suggest fumarolic steam originates from a hydrothermal system [22].
The Parco Naturalistico delle Biancane, located in Southern Tuscany, belongs to the Larderello geothermal field [25]. It is characterized by the presence of geothermal surface manifestation (i.e., hot spring, mud pool, fumarole, and soil alteration). The Larderello-Travale geothermal system is exploited for energy production with about 30% of the Tuscany energy demand [5,6]. The Larderello geothermal area is a magmatic-driven geothermal system located in the inner Northern Apennines [25]. The Parco Naturalistico delle Biancane is located in the southern sector of the Larderello-Travale geothermal field. It extends over an area of approximately 100,000 m2. Previous studies on Parco Naturalistico delle Biancane test site demonstrated that the fluids released consist mostly of water at its boiling point and are primarily composed of H2O. Other components include CO2, N2, H2S, H2, and CH4, with trace amounts of O2 and noble gases [26].
Continuous degassing and moderate explosive eruptions characterize the ordinary (or background) activity of the Stromboli Volcano [27,28,29,30]. For the Stromboli volcano, the gases observations are collected from safe locations, hundreds of meters from the erupting vents. The summit of Stromboli volcano, the northernmost island of the Aeolian volcanic arc (Italy), reaches 924 m in altitude. The island represents the top part of a large 2500 m high stratovolcano emerging from the Tyrrhenian Sea floor. In this context, gaseous volcanic emissions consist of a variety of different compounds and are dominated by water vapor (H2O), carbon dioxide (CO2), sulfur dioxide (SO2), and hydrogen sulfide (H2S). The ratio of these gases varies depending on the type of eruptive activity [31].
The Istituto Nazionale di Geofisica e Vulcanologia (INGV) is responsible for the seismic and volcanic surveillance through the installation and management of monitoring networks, technologically advanced, in order to monitor the entire national territory and the Mediterranean basin. In recent decades, the use of drones equipped with sensors to measure the gases emitted by active volcanoes demonstrated that even in inaccessible, active and dangerous volcanoes, is the only way to implement important measures to characterize the state of activity in safe conditions. INGV fleet counts about 40 aircrafts with visible and thermal cameras and the miniGAS payload to measure volcanic gases [32].
3. Results
3.1. Pisciarelli
During the field campaign held on November 2021 and July 2022, at Pisciarelli area, gases measurements were collected by mounting the miniGAS on SR-X4 drone. The aim of November 2021 campaign was to test the miniGAS measuring the volcanic gases present in the main fumarolic plume to better understand its geochemistry. Figure 5 shows the flight path of the UAS for both missions. The colors vary according to the CO2 concentration, from green (background level values) to red (high concentration values). The evident saturation of CO2 (Figure 5) is because the measurements were collected when the drone went into the volcanic plume.
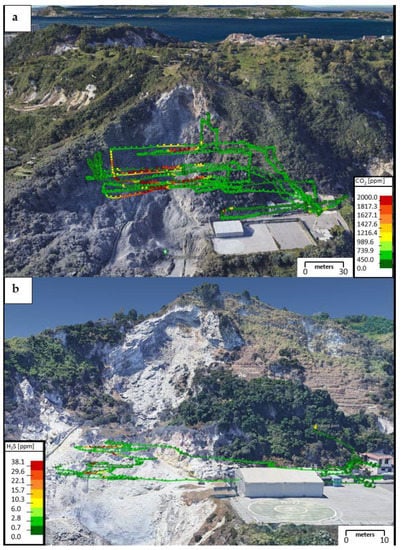
Figure 5.
Pisciarelli: (a) November 2021 path of the drone and CO2 concentration. Green to red colors indicate increasing values of the gas concentration. (b) July 2022 H2S concentration taken by UAS. Overlaying maps from Google Earth.
By analyzing the data, no SO2 concentration in accordance with [23]; however, significant concentrations of CO2 and H2S are present. The major fumarolic fluid gases in a hydrothermal system, excluding H2O, are CO2 and H2S.
Moreover, the CO2/H2S ratio calculation helps to establish a common reference point and to maintain coherence in measurement (Figure 6).
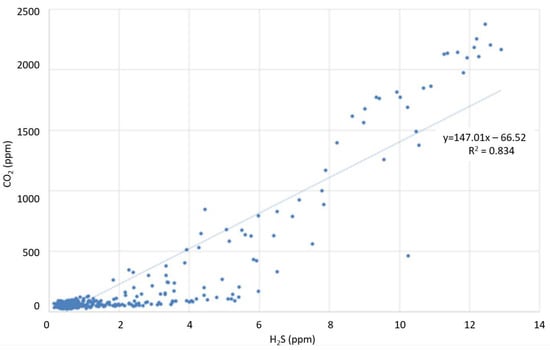
Figure 6.
CO2 vs. H2S concentration (ppm) scatterplot. The CO2/H2S ratio is represented in blue circles. Line represents the best-fit regression.
All CO2 concentrations are corrected for the atmospheric background (about 410 ppm, which is consistent with the European Centre for Medium-Range Weather Forecasts, ECMWF model estimations [33]). The CO2/H2S ratio value of about 147 in Pisciarelli indicates that the fumarole is dominated by carbon dioxide and has very low levels of hydrogen sulfide. The ratios are independent of sampling altitude and distance to the fumarole.
This measured value of the CO2/H2S ratio is in line with the same ratio measured at the fumaroles of the Solfatara in recent years [24].
3.2. Parco Naturalistico Delle Biancane
The gas data measurements at Parco Naturalistico delle Biancane, (May 2022) were collected by hand-carrying the miniGAS. The distance between the gas systems and the ground was approximatively of 20 cm and this permitted a very detailed analysis of the fumaroles present on site (Figure 7).
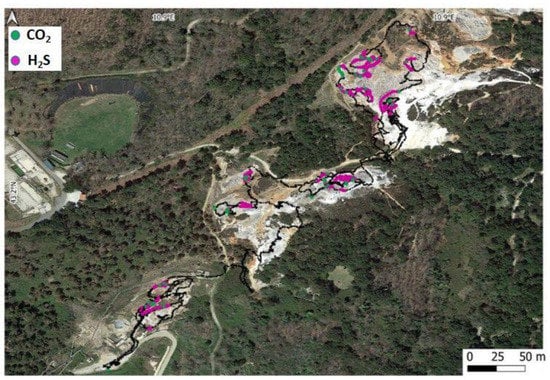
Figure 7.
Parco Naturalistico delle Biancane: CO2, H2S and path of the miniGAS ground measurements; location of measurements (black), peaks of H2S (green), and CO2 concentration peaks (>600 ppm, purple). Basemap from Google Satellite (World_Imagery (MapServer)—ArcGIS).
By comparing the measurements collected during the May 2022 field campaign and the ones collected by [34], we can consider that:
- (1)
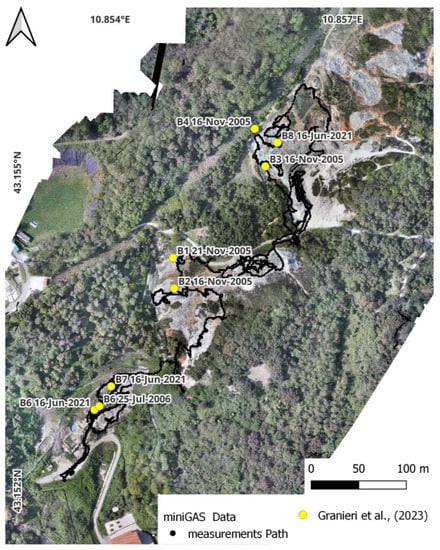 Figure 8. Main fumaroles measured by Granieri et al. [34] (circle in yellow with name and date of measurement) over miniGAS path measurements. Visible image collected by camera mounted on during the May field campaign.
- (2)
- Despite the different period, instrumentation and methodology used by the authors to measure CO2 and H2S, in respect to ours, concentration values are similar and comparable (Table 3). Specifically, Table 3 reports the CO2/H2S ratio for two representatives fumaroles (B4 and B6) measured by [34] and miniGAS, respectively.
Table 3. Comparison of CO2/H2S ratio between [34] and miniGAS measurements.
The results obtained during the May 2022 field campaign seems to be consistent with measurements achieved by [34].
3.3. Stromboli
In the frame of FIRST (ForecastIng eRuptive activity at Stromboli volcano: timing, eruptive style, size, intensity, and duration) project, a field campaign on Stromboli volcano was organized with the aim to collect information on gases concentration emitted by the volcano. The project, in fact, is aimed at improving the ability of the scientific community to forecast the Stromboli behavior in terms of changes in the eruptive style and scale of the future expected eruption, basing on the monitoring data and on geophysical and geochemical observables. In particular, it is aimed at defining the state of the volcano, distinguishing between background activity and exceptional eruptions (such as violent explosions, paroxysms, or flank eruptions), combining together the monitoring data from the INGV networks, satellite data, and the numerical modelling of gas and magma propagation [35].
During the field campaign held on September 2022, the first in situ measurements of a volcanic plume from Stromboli summit craters, using the miniGAS chemical instrument integrated into the SR-X4 UAS, were collected. The UAS was piloted by hand inside the volcanic plume at different heights. The instrument on-board measured CO2, SO2, H2S, and H2O gases together with GPS position.
Figure 9 shows the in situ measurements of CO2 and SO2 gas concentration taken at the active degassing plume of Stromboli volcano.
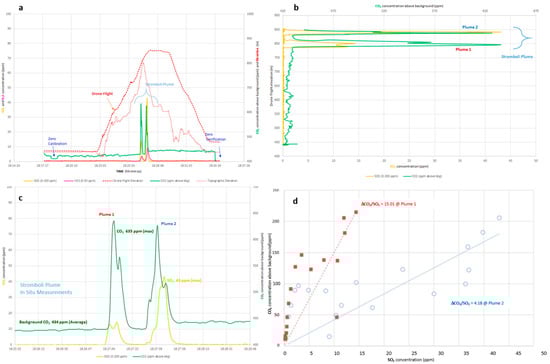
Figure 9.
Stromboli volcano field campaign results using SR-X4 + miniGAS PRO. (a) Measured gas concentrations of CO2, H2S, SO2 and drone altitude (in meters) during drone flight; (b) Altitude vs. CO2 and SO2 to provide plume height and thickness; (c) Detailed CO2, SO2 concentration vs. time; (d) CO2/SO2 ratios for Stromboli measured plumes. The red squares represent the CO2/SO2 ratio for the Plume 1, blue circles the CO2/SO2 ratio for the Plume 2 and the lines the best-fit regression for Plume 1 and Plume 2 (red and blue respectively).
The miniGAS mounted on UAS flew through the active plume two times, which were located between 800 and 850 amsl. The volcano presented small eruptions during the gas data collection. Two distinct plumes are observed, the first one (denoted Plume 1 in Figure 9b,c), with a high content of CO2 concentration above background levels is 15 times higher than the SO2 concentration. Plume 2 (Figure 9b,c), located 50 m higher than Plume 1, has a smaller CO2/SO2 ratio, CO2 above background concentration is just 4.2 times the SO2 content, which might be indicative of the variability and source and location of each gas emitted plume.
Unfortunately, because of a wildfire occurred in May 2022 (which destroyed the vegetation) and mudslides three months later, the accessibility to the summit area was very dangerous; for this reason, the “home” point for the UAS was chosen away from the crater, which is a safer location during Strombolian activity (Figure 10).
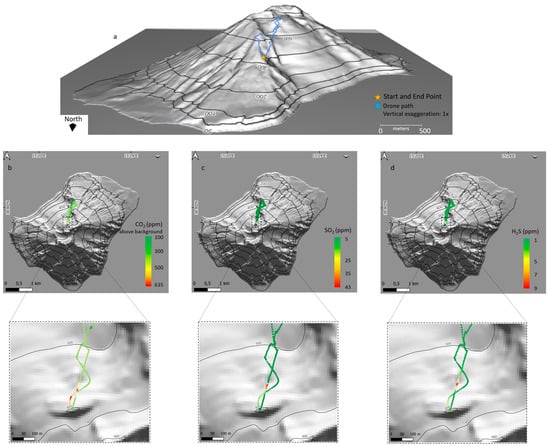
Figure 10.
Stromboli volcano: (a) path of the drone overplot on DEM at 10 m of spatial resolution [36]; gases concentration with their zoom: (b) CO2 gas concentration visualization (green to red colors indicate increasing values of the concentration), (c) SO2 gas concentration map, (d) H2S gas concentration map.
4. Discussion and Conclusions
In this paper, we have demonstrated that MultiGAS systems, such as the miniGAS PRO version, carried by drones is a viable option for systematic gas measurements of volcanic emissions. It offers a robust system for the monitoring of volcanic activity using UASs but can also be hand carried for a more detailed monitoring when conditions are favorable to visit the fumarolic site.
The gas instrumentation, camera manufactures, and drone industry have evolved to provide small, simple, and easy to deploy volcanic UAS for routine and rapid respond field campaigns. INGV has implemented a capability to routinely monitoring the Italian volcanoes with the UAS to measure gases and map active areas to correlate with ground and satellite base measurements.
Active sites, such as Pisciarelli, Parco Naturalistico delle Biancane, and Stromboli, but also other Italian volcanoes have been monitored using UAS by INGV. These UAS measurements provide crucial parameters in terms of geochemical data and mapping information to assess the status and the risk level of an active volcano and monitor the development of volcanic activity without risking INGV personnel. Same or similar instrumentation can be implemented at volcanic observatories around the world to monitor volcanic activity at a distance to provide a quick and safe risk assessment. More advances in the area of payload and UAS developments are underway to further impact the field of volcanic research and monitor.
Future work will concentrate in the improvements of the miniGAS payload including more sensors to detect and retrieve other emitted gases characteristics (such as CH4). Moreover, the capability to mount the thermal cameras and the gas sensors at the same time onboard the UAS will be analyzed. This upgrade will be tested on these three test sites and other volcanic and thermal areas in Italy (i.e., Vulcano and Mt. Etna).
Another area of work is the estimation of volcanic CO2 from remote sensing and in situ validation. In situ measurements of carbon dioxide emissions could be useful for the validation of CO2 enhancements (XCO2) from satellite. In fact, the availability of hyperspectral images from satellite is very challenging for gases analysis. Specifically, the PRISMA (PRecursore IperSpettrale della Missione Applicativa) Italian mission provides hyperspectral images in the range 400–2500 nm with a spatial resolution of 30 m [37]. The spectral range includes the CO2 absorption bands around 2000 nm in the SWIR (Short Wave Infra-Red) region. In this framework, the development of algorithms and employment hyperspectral data to estimate CO2 concentrations inside volcanic plumes is constantly evolving [38]. Although satellite data have a huge potential to cover large areas and for safety of the researchers, gases emissions are not so easy to detect and estimate. Our objective is the comparison between satellite and miniGAS measurements in order to be confidence on the considered retrieval methodologies. While satellites can readily detect and measure SO2 emissions [39], estimations of volcanic CO2 emissions are more challenging because the high background concentration in the atmosphere (about 400 ppm). The only way to get accurate readings is to take samples near active vents. For this reason, next field campaigns will be planned in order to collect data in synchronous with satellite passages. Considering that sensors aboard satellites measure gases in the total atmospheric column (this means the entire vertical column of air between the satellite and ground), it is fundamental to design the flight path of the drone to obtain gases fluxes estimations from the vents with the aim to make local measurements comparable with satellite estimations.
Author Contributions
Conceptualization, M.S. and J.A.D.; methodology and software, J.A.D.; validation, M.S., R.A., V.R. and M.M.; drones, E.M., P.B. and G.A.; data curation, F.R. and E.C. Sensor Calibration, J.F.; writing—original draft preparation, M.S. and J.A.D.; funding acquisition, M.F.B. All authors have read and agreed to the published version of the manuscript.
Funding
Part of this research was funded by the Project FIRST-ForecastIng eRuptive activity at Stromboli volcano: timing, eruptive style, size, intensity, and duration, INGV-Progetto Strategico Dipartimento Vulcani 2019 (Delibera n. 144/2020). UCR funded GasLab-CICANUM activities under Research Project #915-C0-116 (VAMOS-UAS) through the Vicerrectoria de Investigacion. INFICON contributed with field travel funding for J.A.D. and instrument calibration at ISS facilities.
Data Availability Statement
Data collected by miniGAS PRO are available by contacting the correspondence author.
Acknowledgments
Special thanks to Giuseppe De Rosa, volcanological guide for its help in the Stromboli field campaign. The authors wish to thank the reviewers for their constructive comments.
Conflicts of Interest
The authors declare no conflict of interest.
References
- Pieri, D.; Diaz, J.A. In Situ Sampling of Volcanic Emissions with a UAV Sensor web: Progress and Plans. In Dynamic Data-Driven Environmental Systems Science; Springer: Berlin/Heidelberg, Germany, 2015. [Google Scholar]
- Giudicepietro, F.; Calvari, S.; Alparone, S.; Bianco, F.; Bonaccorso, A.; Bruno, V.; Caputo, T.; Cristaldi, A.; D’Auria, L.; De Cesare, W.; et al. Integration of Ground-Based Remote-Sensing and In Situ Multidisciplinary Monitoring Data to Analyze the Eruptive Activity of Stromboli Volcano in 2017–2018. Remote Sens. 2019, 11, 1813. [Google Scholar] [CrossRef]
- Chiodini, G.; Cioni, R.; Guidi, M.; Raco, B.; Marini, L. Soil CO2 flux measurements in volcanic and geothermal areas. Appl. Geochem. 1998, 13, 543–552. [Google Scholar] [CrossRef]
- O’Dwyer, M.; Padgett, M.J.; McGonigle, A.J.S.; Oppenheimer, C.; Inguaggiato, S. Real-time measurement of volcanic H2S and SO2 concentrations by UV spectroscopy. Geophys. Res. Lett. 2003, 30, 12. [Google Scholar] [CrossRef]
- Enel Report. Available online: https://www.enel.com/investors/overview (accessed on 20 February 2023).
- Geothermal Electricity Production Statistics for Italy. Available online: https://www.terna.it/it/sistema-elettrico/statistiche/pubblicazioni-statistiche (accessed on 20 February 2023).
- Corradini, S.; Guerrieri, L.; Stelitano, D.; Salerno, G.; Scollo, S.; Merucci, L.; Prestifilippo, M.; Musacchio, M.; Silvestri, M.; Lombardo, V.; et al. Near real-time monitoring of the Christmas 2018 Etna eruption using SEVIRI and products validation. Remote Sens. 2020, 12, 1336. [Google Scholar] [CrossRef]
- Silvestri, M.; Cardellini, C.; Chiodini, G.; Buongiorno, M.F. Satellite-derived surface temperature and in situ measurement at Solfatara of Pozzuoli (Naples, Italy). Geochem. Geophys. Geosystems 2016, 17, 2095–2109. [Google Scholar] [CrossRef]
- SR-X4 UAS. Web Site. Available online: https://siralab.it/sr-x4/ (accessed on 18 April 2023).
- Diaz, J.; Corrales, E.; Madrigal, Y.; Pieri, D.; Bland, G.; Miles, T.; Fladeland, M. Volcano Monitoring with small Unmanned Aerial Systems. In Proceedings of the Infotech@ Aerospace, Garden Grove, CA, USA, 19–21 June 2012; p. 2522. [Google Scholar]
- Pieri, D.; Diaz, J.A.; Bland, G.; Fladeland, M.; Madrigal, Y.; Corrales, E.; Alegria, O.; Alan, A.; Realmuto, V.; Miles, T.; et al. In situ observations and sampling of volcanic emissions with NASA and UCR unmanned aircraft, including a case study at Turrialba volcano, Costa Rica. Geol. Soc. Lond. 2013, 380, 321–352. [Google Scholar] [CrossRef]
- Diaz, J.A.; Pieri, D.; Wright, K.; Sorensen, P.; Kline-Shoder, R.; Arkin, C.R.; Fladeland, M.; Bland, G.; Buongiorno, M.F.; Ramirez, C.; et al. Unmanned aerial mass spectrometer systems for in-situ volcanic plume analysis. J. Am. Soc. Mass Spectrom. 2015, 26, 292–304. [Google Scholar] [CrossRef]
- Xi, X.; Johnson, M.; Jeon, S.; Fladeland, M.; Pieri, D.; Diaz, J.A.; Bland, G.L. Constraining the sulfur dioxide degassing flux from Turrialba volcano, Costa Rica using unmanned aerial system measurement. J. Volcanol. Geotherm. Research. 2016, 325, 110–118. [Google Scholar] [CrossRef]
- Silvestri, M.; Diaz, J.A.; Vita, F.; Musacchio, M.; Puchalla, J.; Falcone, S.; Buongiorno, M.F.; Doumaz, F.; Wright, K. Improved instruments for volcanic plume observation for monitoring purpose: Solfatara and Vulcano island preliminary result. Rapp. Tec. INGV 2016, 349, 1–44. [Google Scholar]
- Stix, J.; de Moor, J.M.; Rüdiger, J.; Alan, A.; Corrales, E.; D’Arcy, F.; Diaz, J.A.; Liotta, M. Degassing of Turrialba and Masaya volcanoes, Central America, measured by drone. J. Geophys. Res. Solid Earth 2018, 123, 6501–6520. [Google Scholar]
- Liu, E.J.; Wood, K.; Mason, E.; Edmonds, M.; Aiuppa, A.; Giudice, G.; Bitetto, M.; Francofonte, V.; Burrow, S.; Richardson, T.; et al. Dynamics of outgassing and plume transport revealed by proximal unmanned aerial system (UAS) measurements at Volcán Villarrica, Chile. Geochem. Geophys. Geosyst. 2019, 20, 730–750. [Google Scholar] [CrossRef]
- D’Arcy, F.; Alan, A.; Corrales, E.; Rüdiger, J.; de Moor, J.M.; Diaz, J.A.; Stix, J. Drones measure gases at volcanoes during international field campaign. EOS 2018. [Google Scholar]
- de Moor, J.M.; Stix, J.; Avard, G.; Muller, C.; Corrales, E.; Diaz, J.A.; Alan, A.; Brenes, J.; Pacheco, J.; Aiuppa, A.; et al. Insights on hydrothermal-magmatic interactions and eruptive processes at Poás volcano (Costa Rica) from high-frequency gas monitoring and drone measurements. Geophys. Res. Lett. 2019, 46, 1293–1302. [Google Scholar] [CrossRef]
- Vernier, J.-P.; Kalnajs, L.; Diaz, J.A.; Reese, T.; Corrales, E.; Alan, A.; Vernier, H.; Holland, L.; Patel, A.; Rastogi, N.; et al. Volcano Rapid Response Balloon Campaign during the 2018 Kilauea Eruption. Bull. Am. Meteorol. Soc. 2020, 101, E1602–E1618. [Google Scholar] [CrossRef]
- Liu, E.J.; Aiuppa, A.; Alan, A.; Arellano, S.; Bitetto, M.; Bobrowski, N.; Carn, S.; Clarke, R.; Corrales, E.; de Moor, J.M.; et al. Aerial strategies advance volcanic gas measurements at inaccessible, strongly degassing volcanoes. Sci. Adv. 2020, 60, eabb9103. [Google Scholar] [CrossRef]
- Chiodini, G.; Avino, R.; Caliro, S.; Minopoli, C. Temperature and pressure gas geoindicators at the Solfatara fumaroles (Campi Flegrei). Ann. Geophys. 2011, 54, 2. [Google Scholar]
- Chiodini, G.; Caliro, S.; Avino, R.; Bini, G.; Giudicepietro, F.; De Cesare, W.; Ricciolino, P.; Aiuppa, A.; Cardellini, C.; Petrillo, Z.; et al. Hydrothermal pressure-temperature control on CO2 emissions and seismicity at Campi Flegrei (Italy). J. Volcanol. Geotherm. Res. 2021, 414, 107245. [Google Scholar] [CrossRef]
- Tamburello, G.; Caliro, S.; Chiodini, G.; De Martino, P.; Avino, R.; Minopoli, C.; Carandente, A.; Rouwet, D.; Aiuppa, A.; Costa, A.; et al. Escalating CO2 degassing at the Pisciarelli fumarolic system, and implications for the ongoing Campi Flegrei unrest. J. Volcanol. Geotherm. Res. 2019, 384, 151–157. [Google Scholar] [CrossRef]
- Buono, G.; Caliro, S.; Paonita, A.; Pappalardo, L.; Chiodini, G. Discriminating carbon dioxide sources during volcanic unrest: The case of Campi Flegrei caldera (Italy). Geology 2023, 51, 397–401. [Google Scholar] [CrossRef]
- Romagnoli, P.; Arias, A.; Barelli, A.; Cei, M.; Casini, M. An updated numerical model of the Larderello–Travale geothermal system, Italy. Geothermics 2010, 39, 292–313. [Google Scholar] [CrossRef]
- Taussi, M.; Brogi, A.; Liotta, D.; Nisi, B.; Perrini, M.; Vaselli, O.; Zambrano, M.; Zucchi, M. CO2 and heat energy transport by enhanced fracture permeability in the Monterotondo Marittimo-Sasso Pisano transfer fault system (Larderello Geothermal Field, Italy). Geothermics 2022, 105, 102531. [Google Scholar] [CrossRef]
- Inguaggiato, S.; Vita, F.; Cangemi, M.; Inguaggiato, C.; Calderone, L. The monitoring of CO2 soil degassing as indicator of increasing volcanic activity: The paroxysmal activity at Stromboli volcano in 2019–2021. Geosciences 2021, 11, 169. [Google Scholar] [CrossRef]
- Burton, M.R.; Caltabiano, T.; Murè, F.; Salerno, G.; Randazzo, D. SO2 flux from Stromboli during the 2007 eruption: Results from the FLAME network and traverse measurements. J. Volcanol. Geotherm. Res. 2009, 182, 214–220. [Google Scholar] [CrossRef]
- Inguaggiato, S.; Vita, F.; Rouwet, D.; Bobrowski, N.; Morici, S.; Sollami, A. Geochemical evidence of the renewal of volcanic activity inferred from CO2 soil and SO2 plume fluxes: The 2007 Stromboli eruption (Italy). Bull. Volcanol. 2011, 9, 176. [Google Scholar] [CrossRef]
- Inguaggiato, S.; Vita, F.; Cangemi, M.; Calderone, L. Increasing Summit Degassing at the Stromboli Volcano and Relationships with Volcanic Activity (2016–2018). Geosciences 2019, 9, 176. [Google Scholar] [CrossRef]
- Aiuppa, A.; Federico, C.; Giudice, G.; Giuffrida, G.; Guida, R.; Gurrieri, S.; Liuzzo, M.; Moretti, R.; Papale, P. The 2007 eruption of Stromboli volcano: Insights from real-time measurement of the volcanic gas plume CO2/SO2 ratio. J. Volcanol. Geotherm. Res. 2009, 182, 221–230. [Google Scholar] [CrossRef]
- INGV UAS Based CAL/VAL Activities. Available online: https://cos.ingv.it/index.php/news-events/presentations/calibration-validation/15-uas-based-for-cal-val-activities/file (accessed on 18 April 2023).
- ECMWF Web Site. Available online: https://www.ecmwf.int/ (accessed on 18 April 2023).
- Granieri, D.; Mazzarini, F.; Cerminara, M.; Calusi, B.; Scozzari, A.; Menichini, M.; Lelli, M. Shallow portion of an active geothermal system revealed by multidisciplinary studies: The case of Le Biancane (Larderello, Italy). Geothermics 2023, 108, 102616. [Google Scholar] [CrossRef]
- FIRST Project. Available online: https://progetti.ingv.it/it/progetti-dipartimentali/vulcani/first (accessed on 14 March 2023).
- Tarquini, S.; Nannipieri, L. The 10 m-resolution TINITALY DEM as a trans-disciplinary basis for the analysis of the Italian territory: Current trends and new perspectives. Geomorphology 2017, 281, 108–115. [Google Scholar] [CrossRef]
- Lopinto, E.; Ananasso, C. The Prisma hyperspectral mission. In Proceedings of the 33rd EARSeL Symposium, Towards Horizon 2020, Matera, Italy, 3–6 June 2013; pp. 3–7. [Google Scholar]
- Romaniello, V.; Spinetti, C.; Silvestri, M.; Buongiorno, M.F. A Methodology for CO2 Retrieval Applied to Hyperspectral PRISMA Data. Remote Sens. 2021, 13, 4502. [Google Scholar] [CrossRef]
- Carn, S.A.; Fioletov, V.E.; McLinden, C.A.; Li, C.; Krotkov, N.A. A decade of global volcanic SO2 emissions measured from space. Sci. Rep. 2017, 7, 44095. [Google Scholar] [CrossRef]
Disclaimer/Publisher’s Note: The statements, opinions and data contained in all publications are solely those of the individual author(s) and contributor(s) and not of MDPI and/or the editor(s). MDPI and/or the editor(s) disclaim responsibility for any injury to people or property resulting from any ideas, methods, instructions or products referred to in the content. |
© 2023 by the authors. Licensee MDPI, Basel, Switzerland. This article is an open access article distributed under the terms and conditions of the Creative Commons Attribution (CC BY) license (https://creativecommons.org/licenses/by/4.0/).