


Geothermal Exploration in the Burwash Landing Region, Canada, Using Three-Dimensional Inversion of Passive Electromagnetic Data
 ,
,
Abstract
1. Introduction
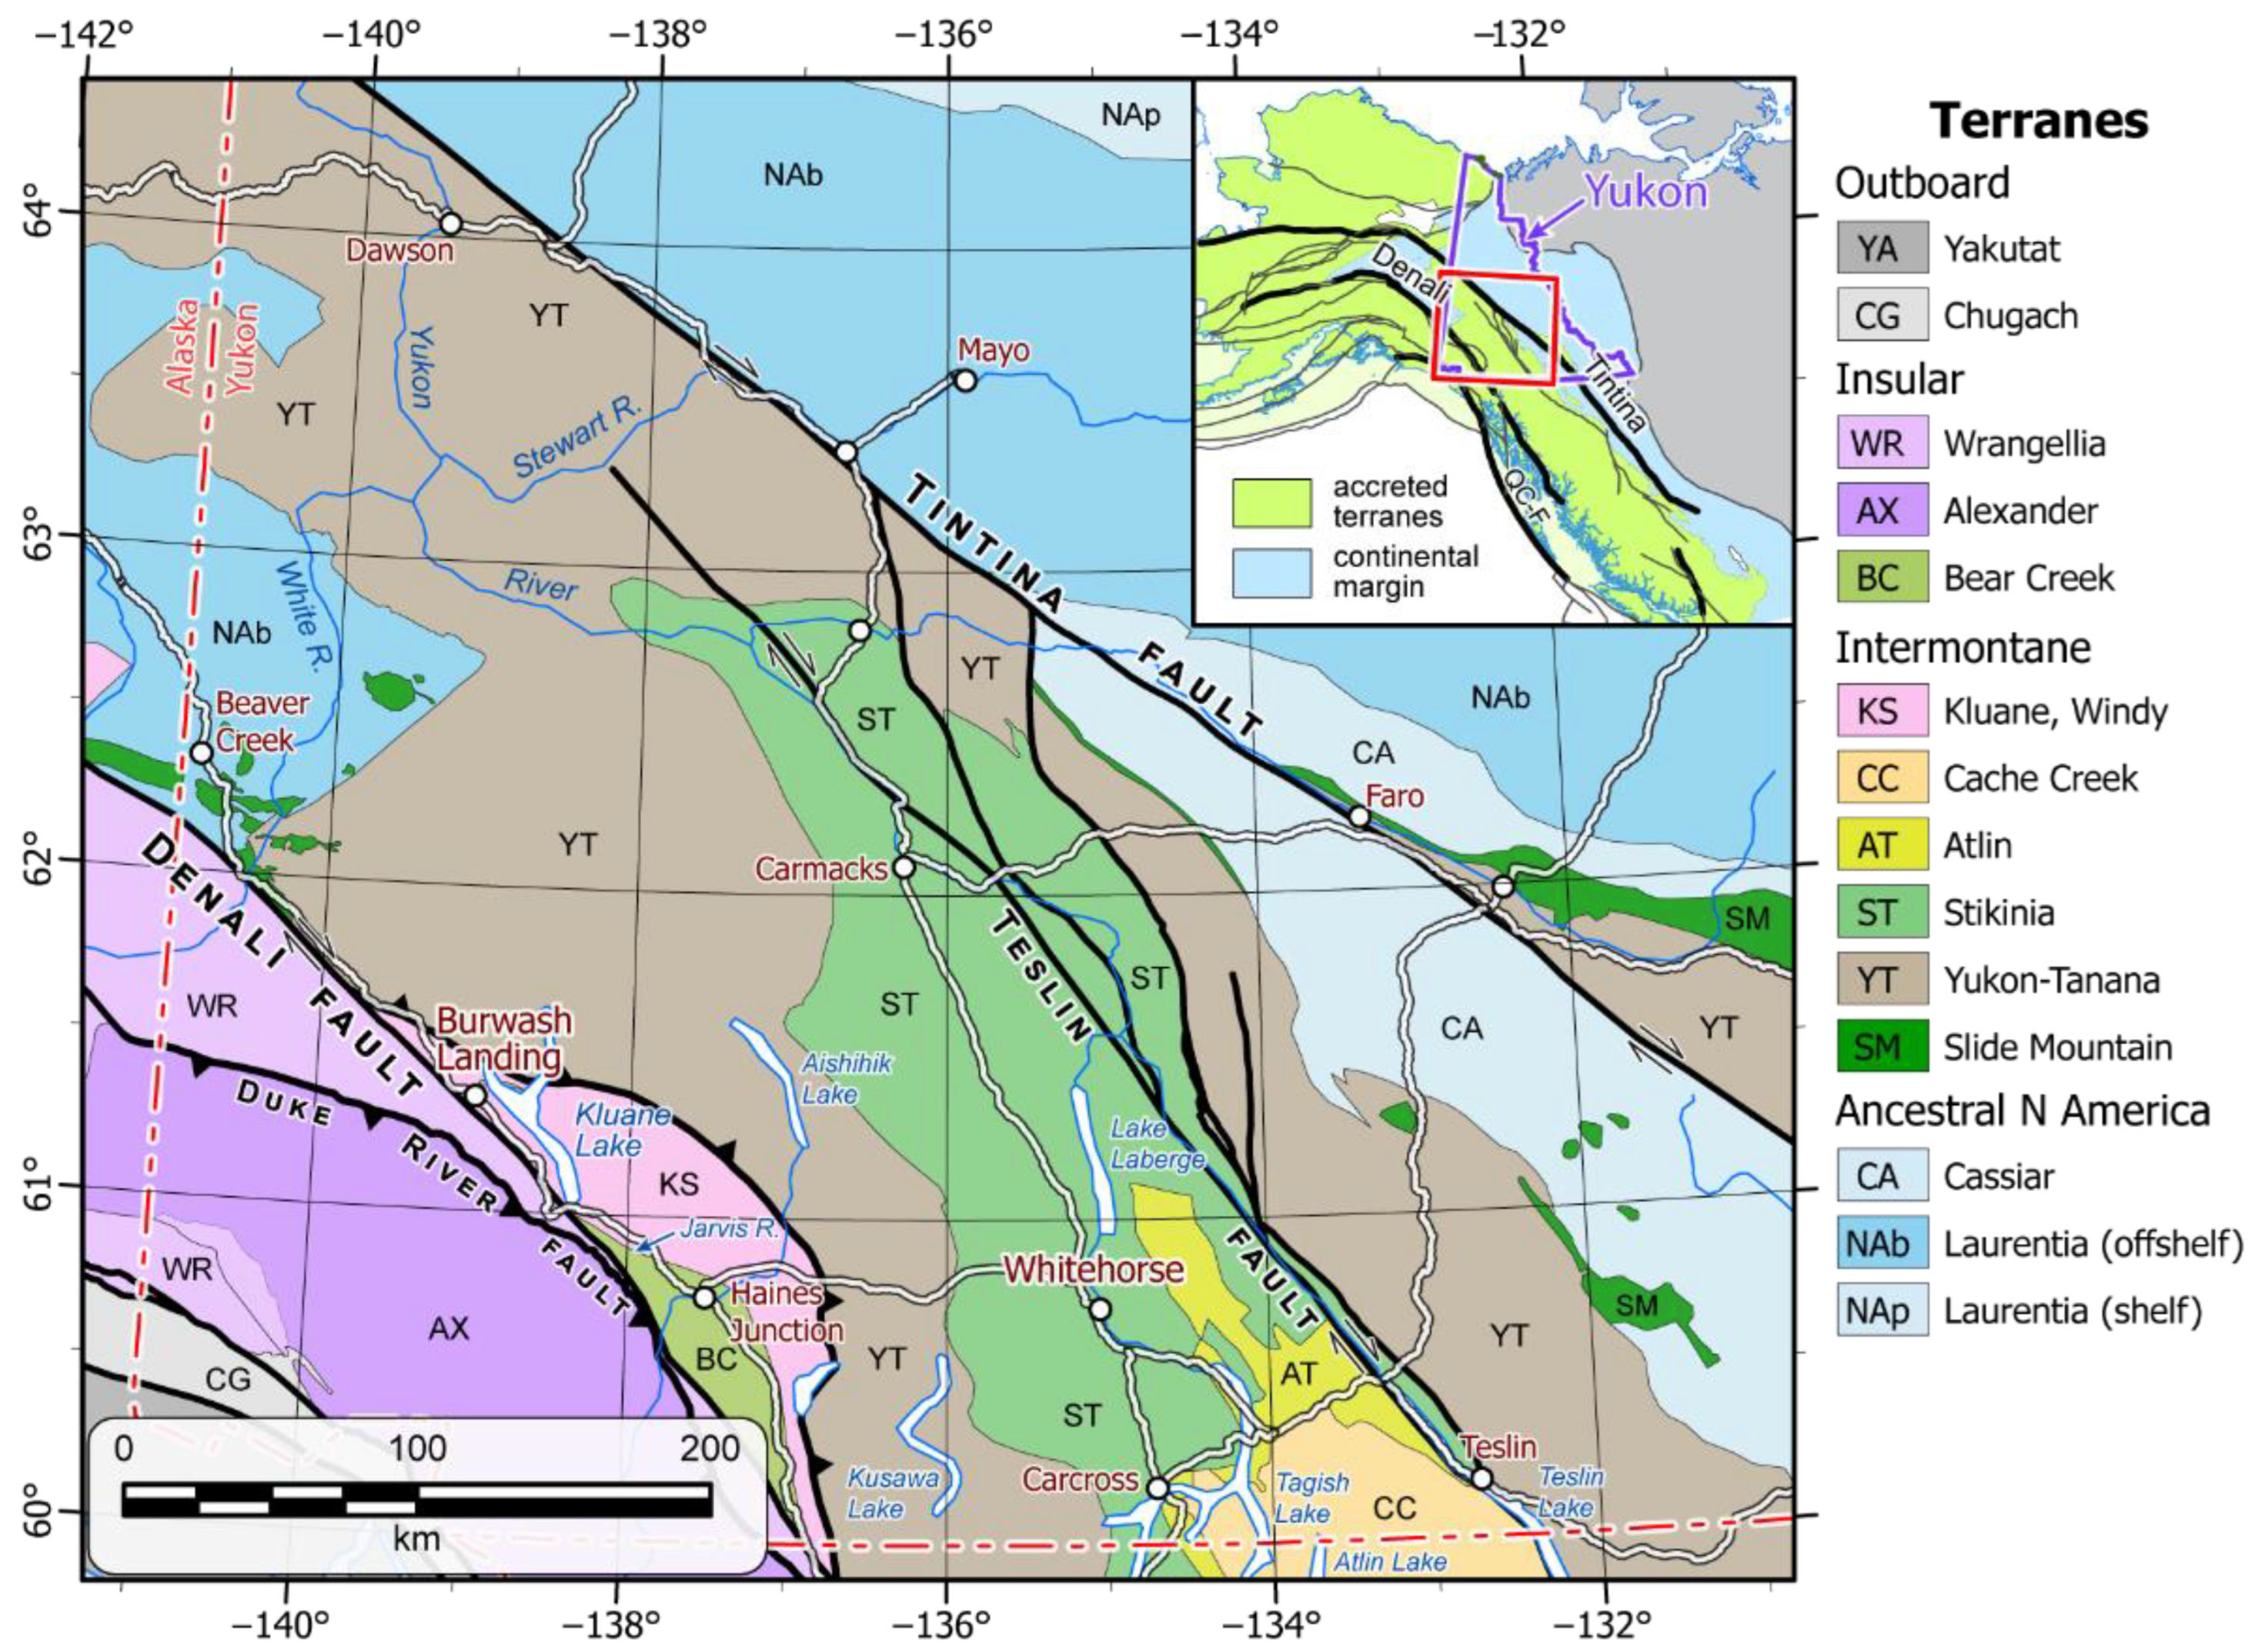
2. The Denali Fault
3. The Magnetotelluric Method
4. Geophysical Datasets
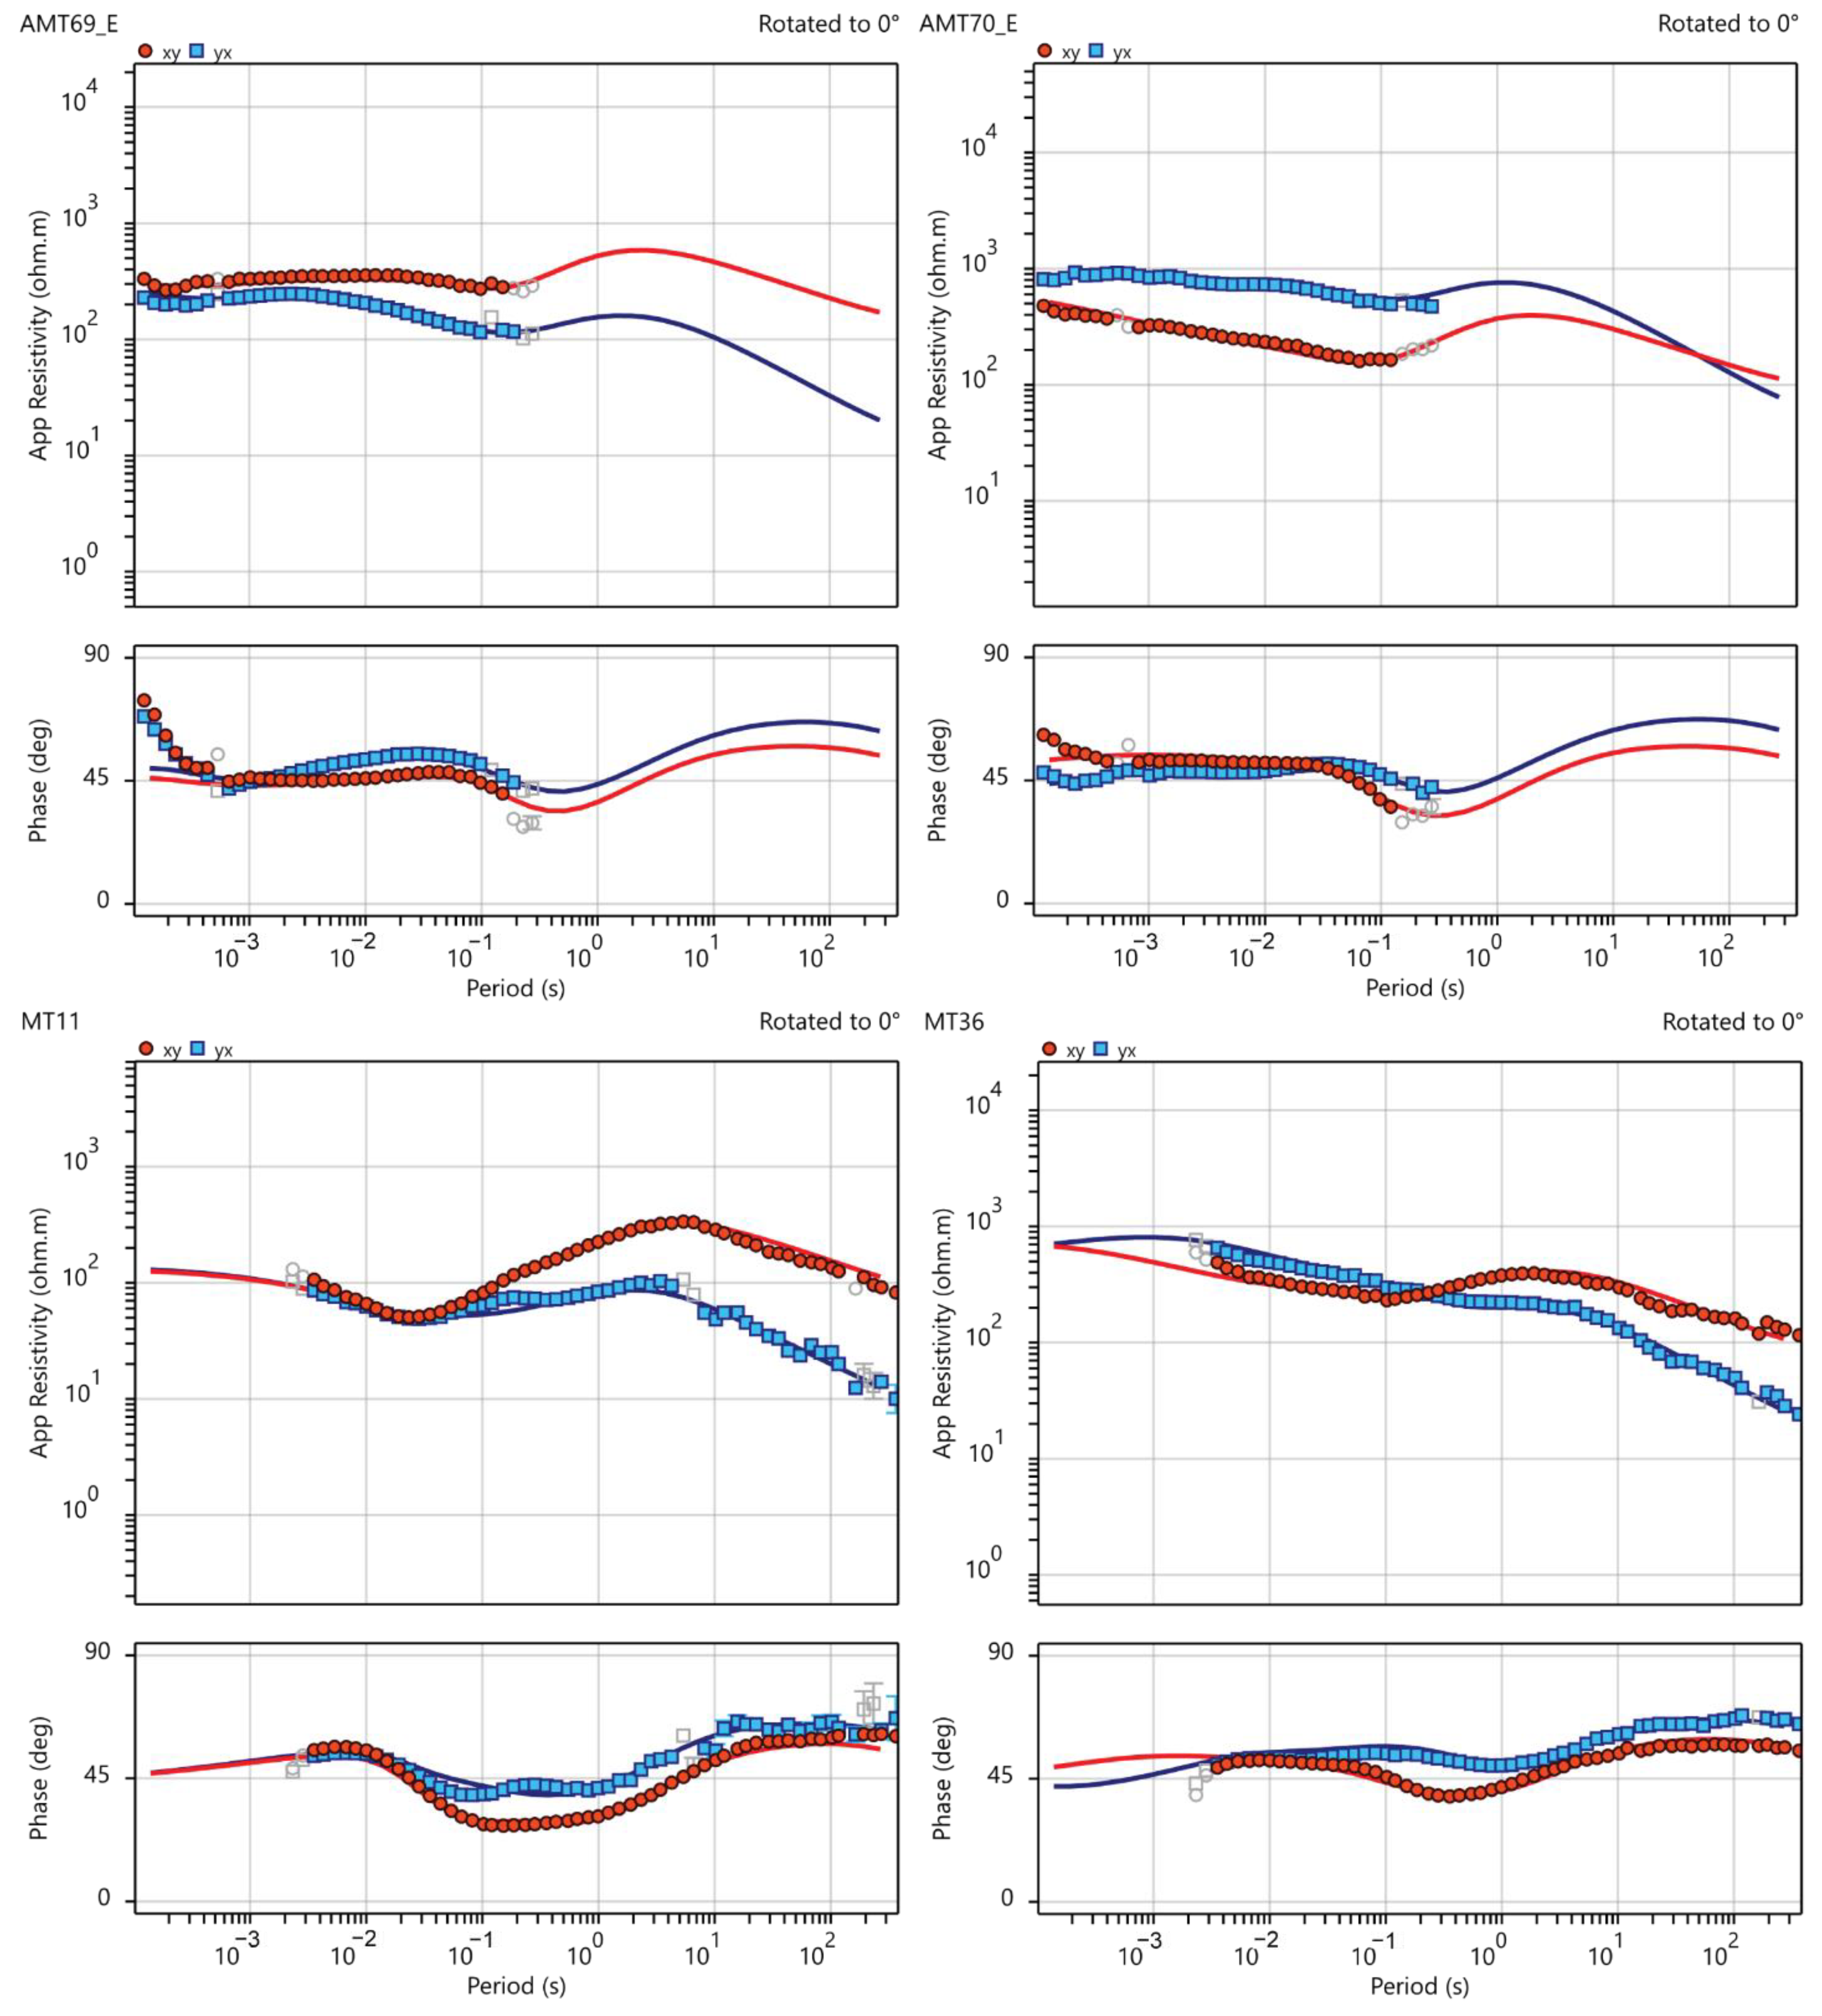
4.1. MT and AMT Data
4.2. ELF-EM Data
5. Methodology
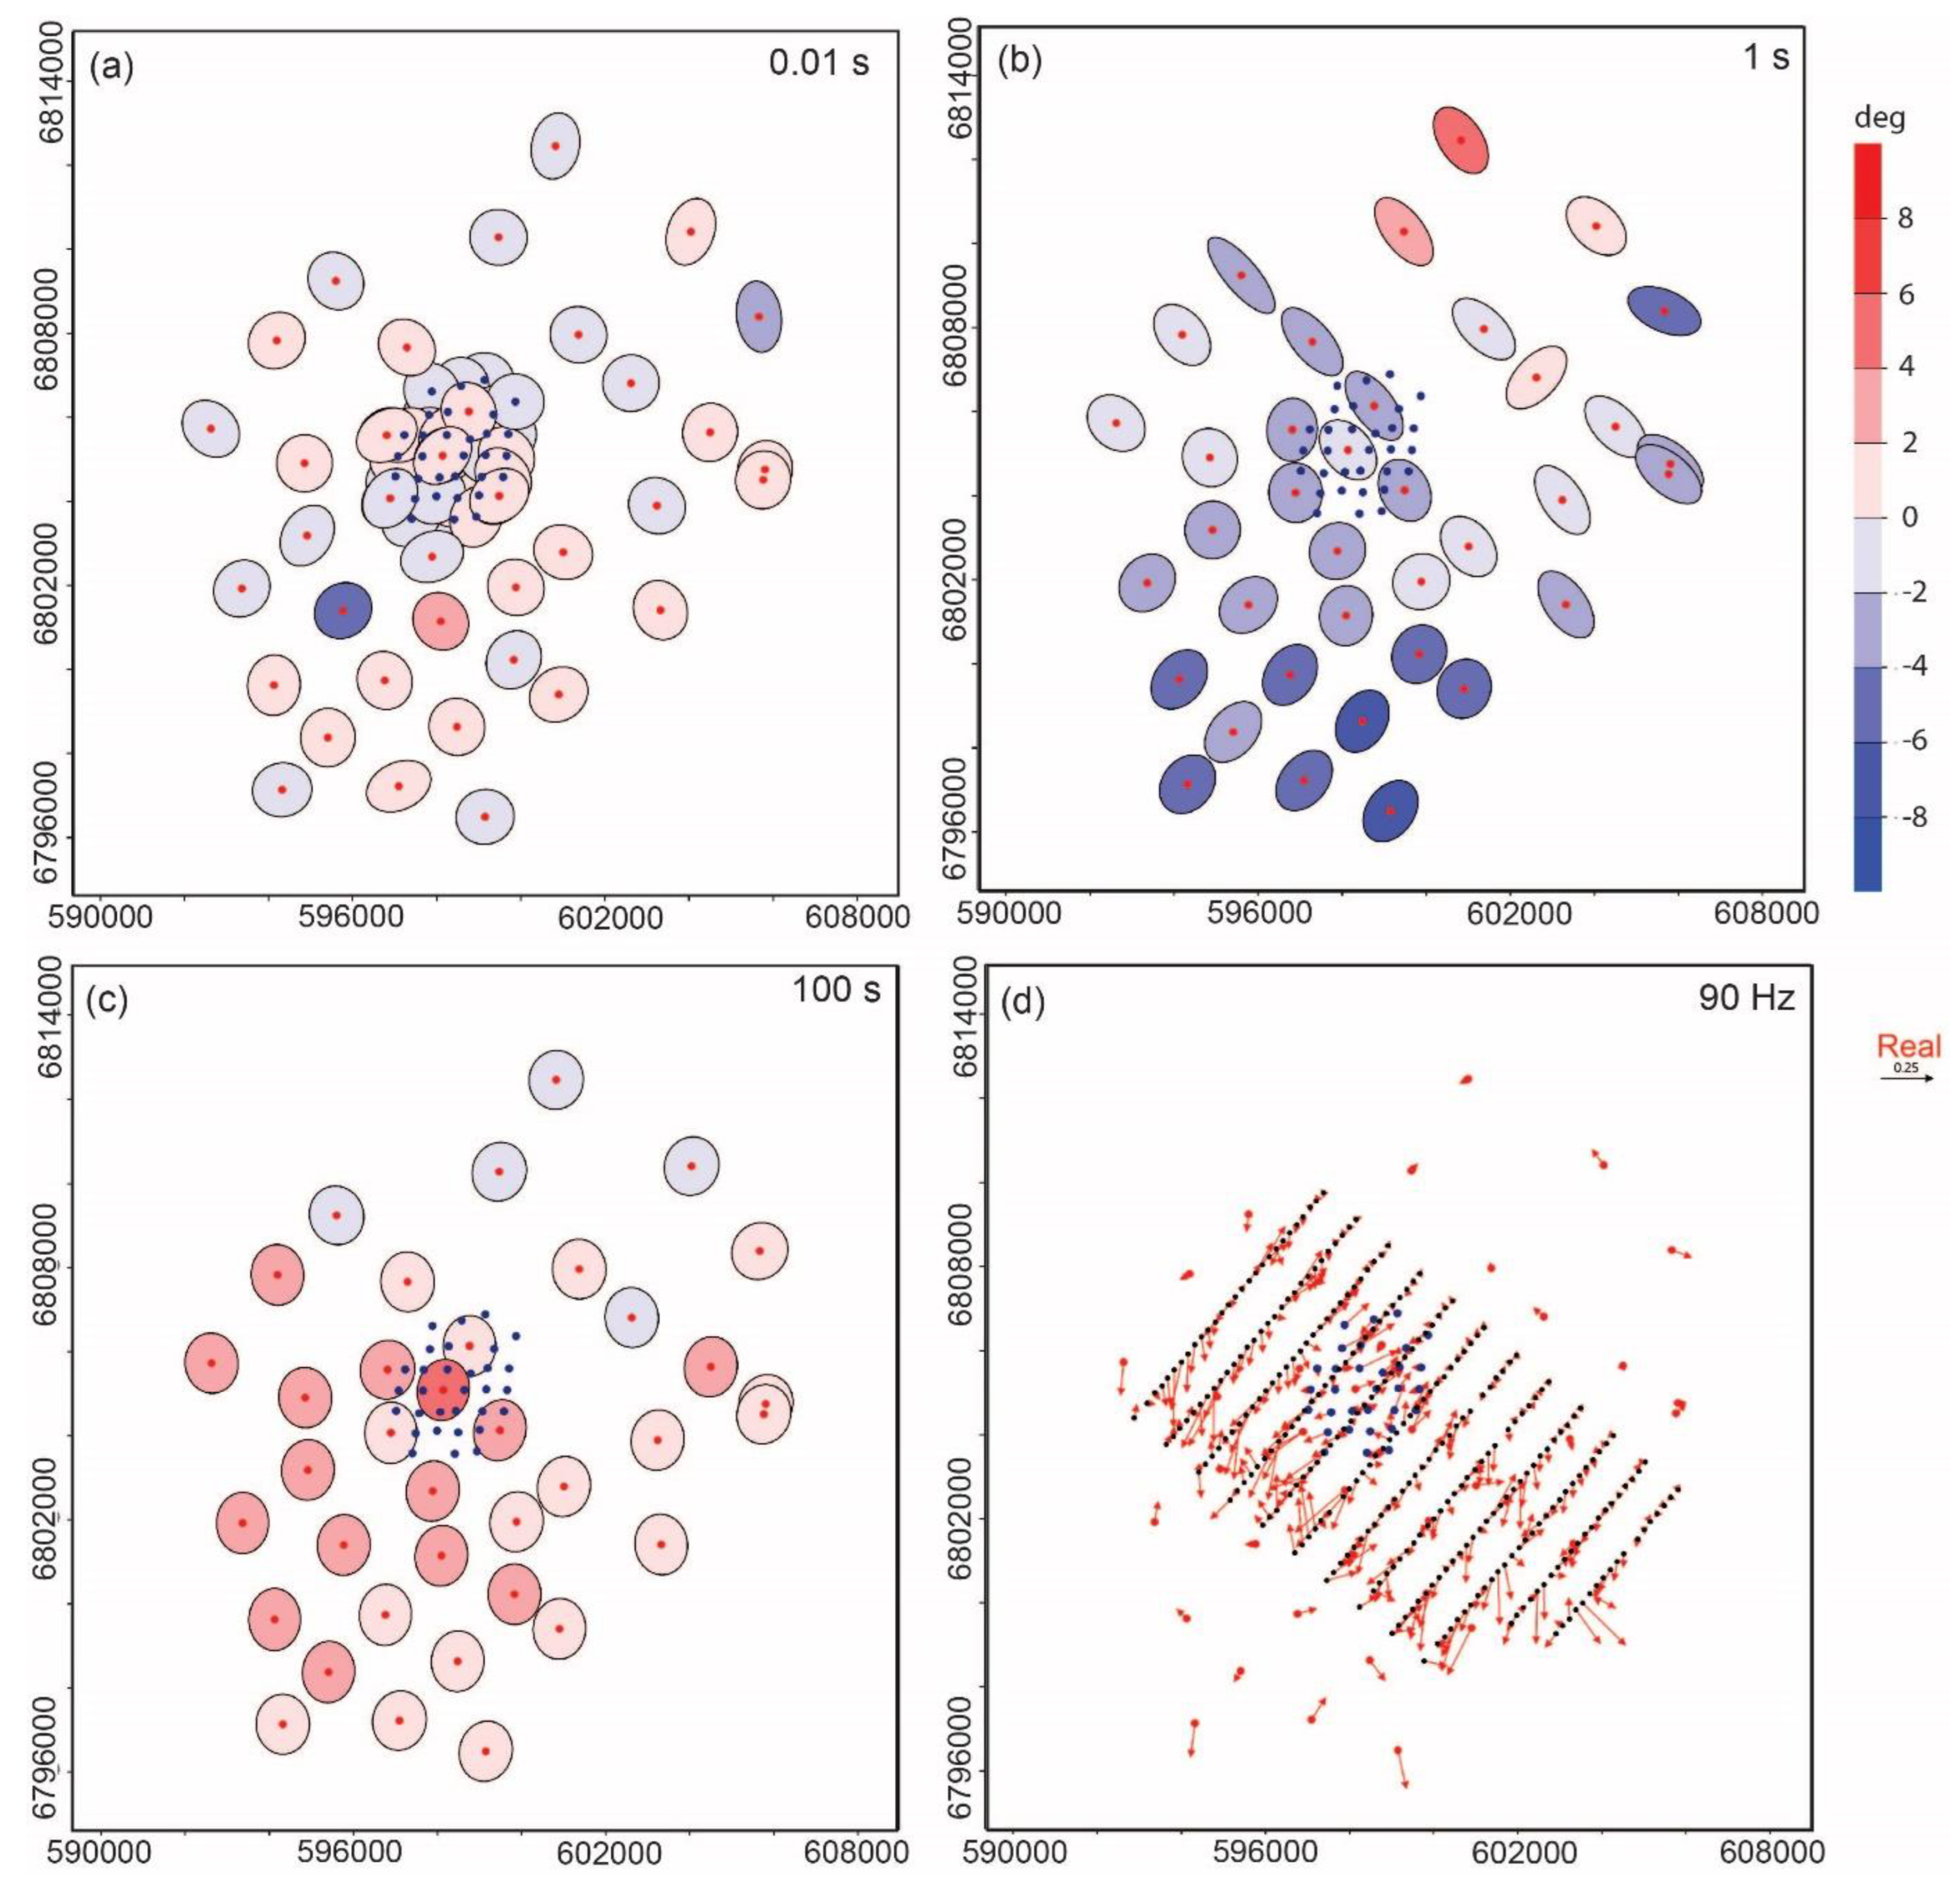
5.1. Dimensionality Analysis
5.2. 3D Inversion of Data
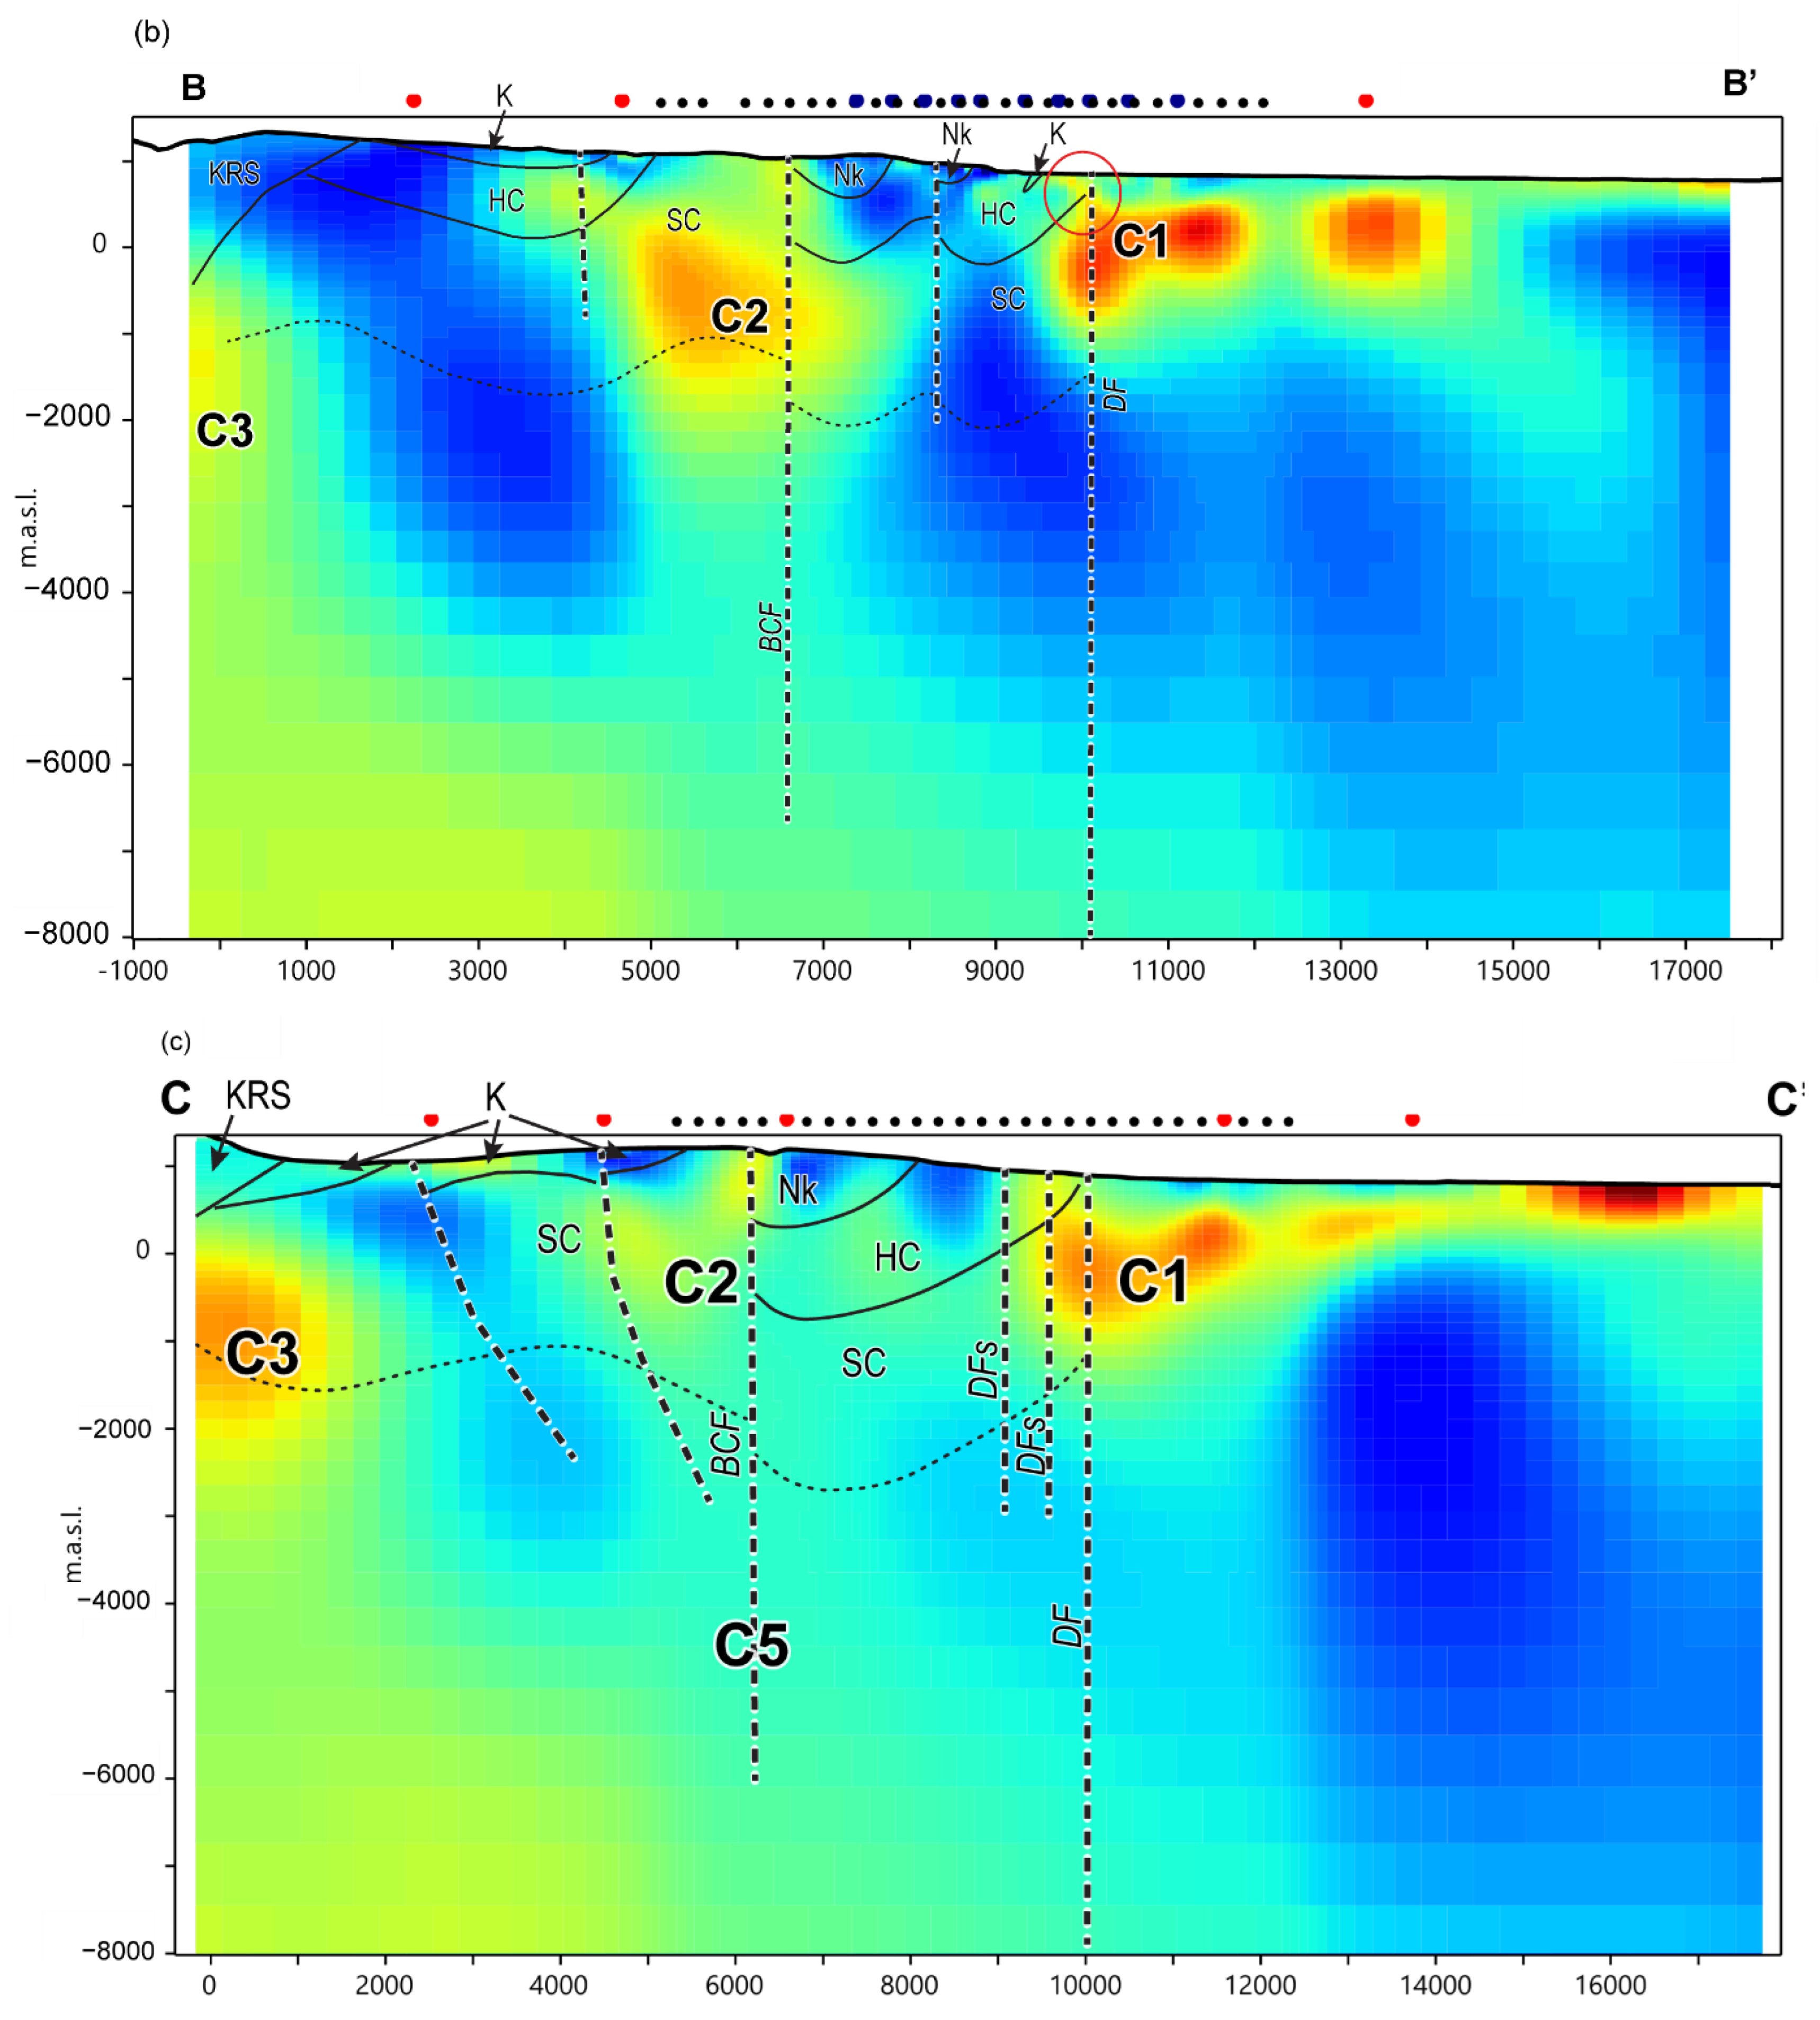
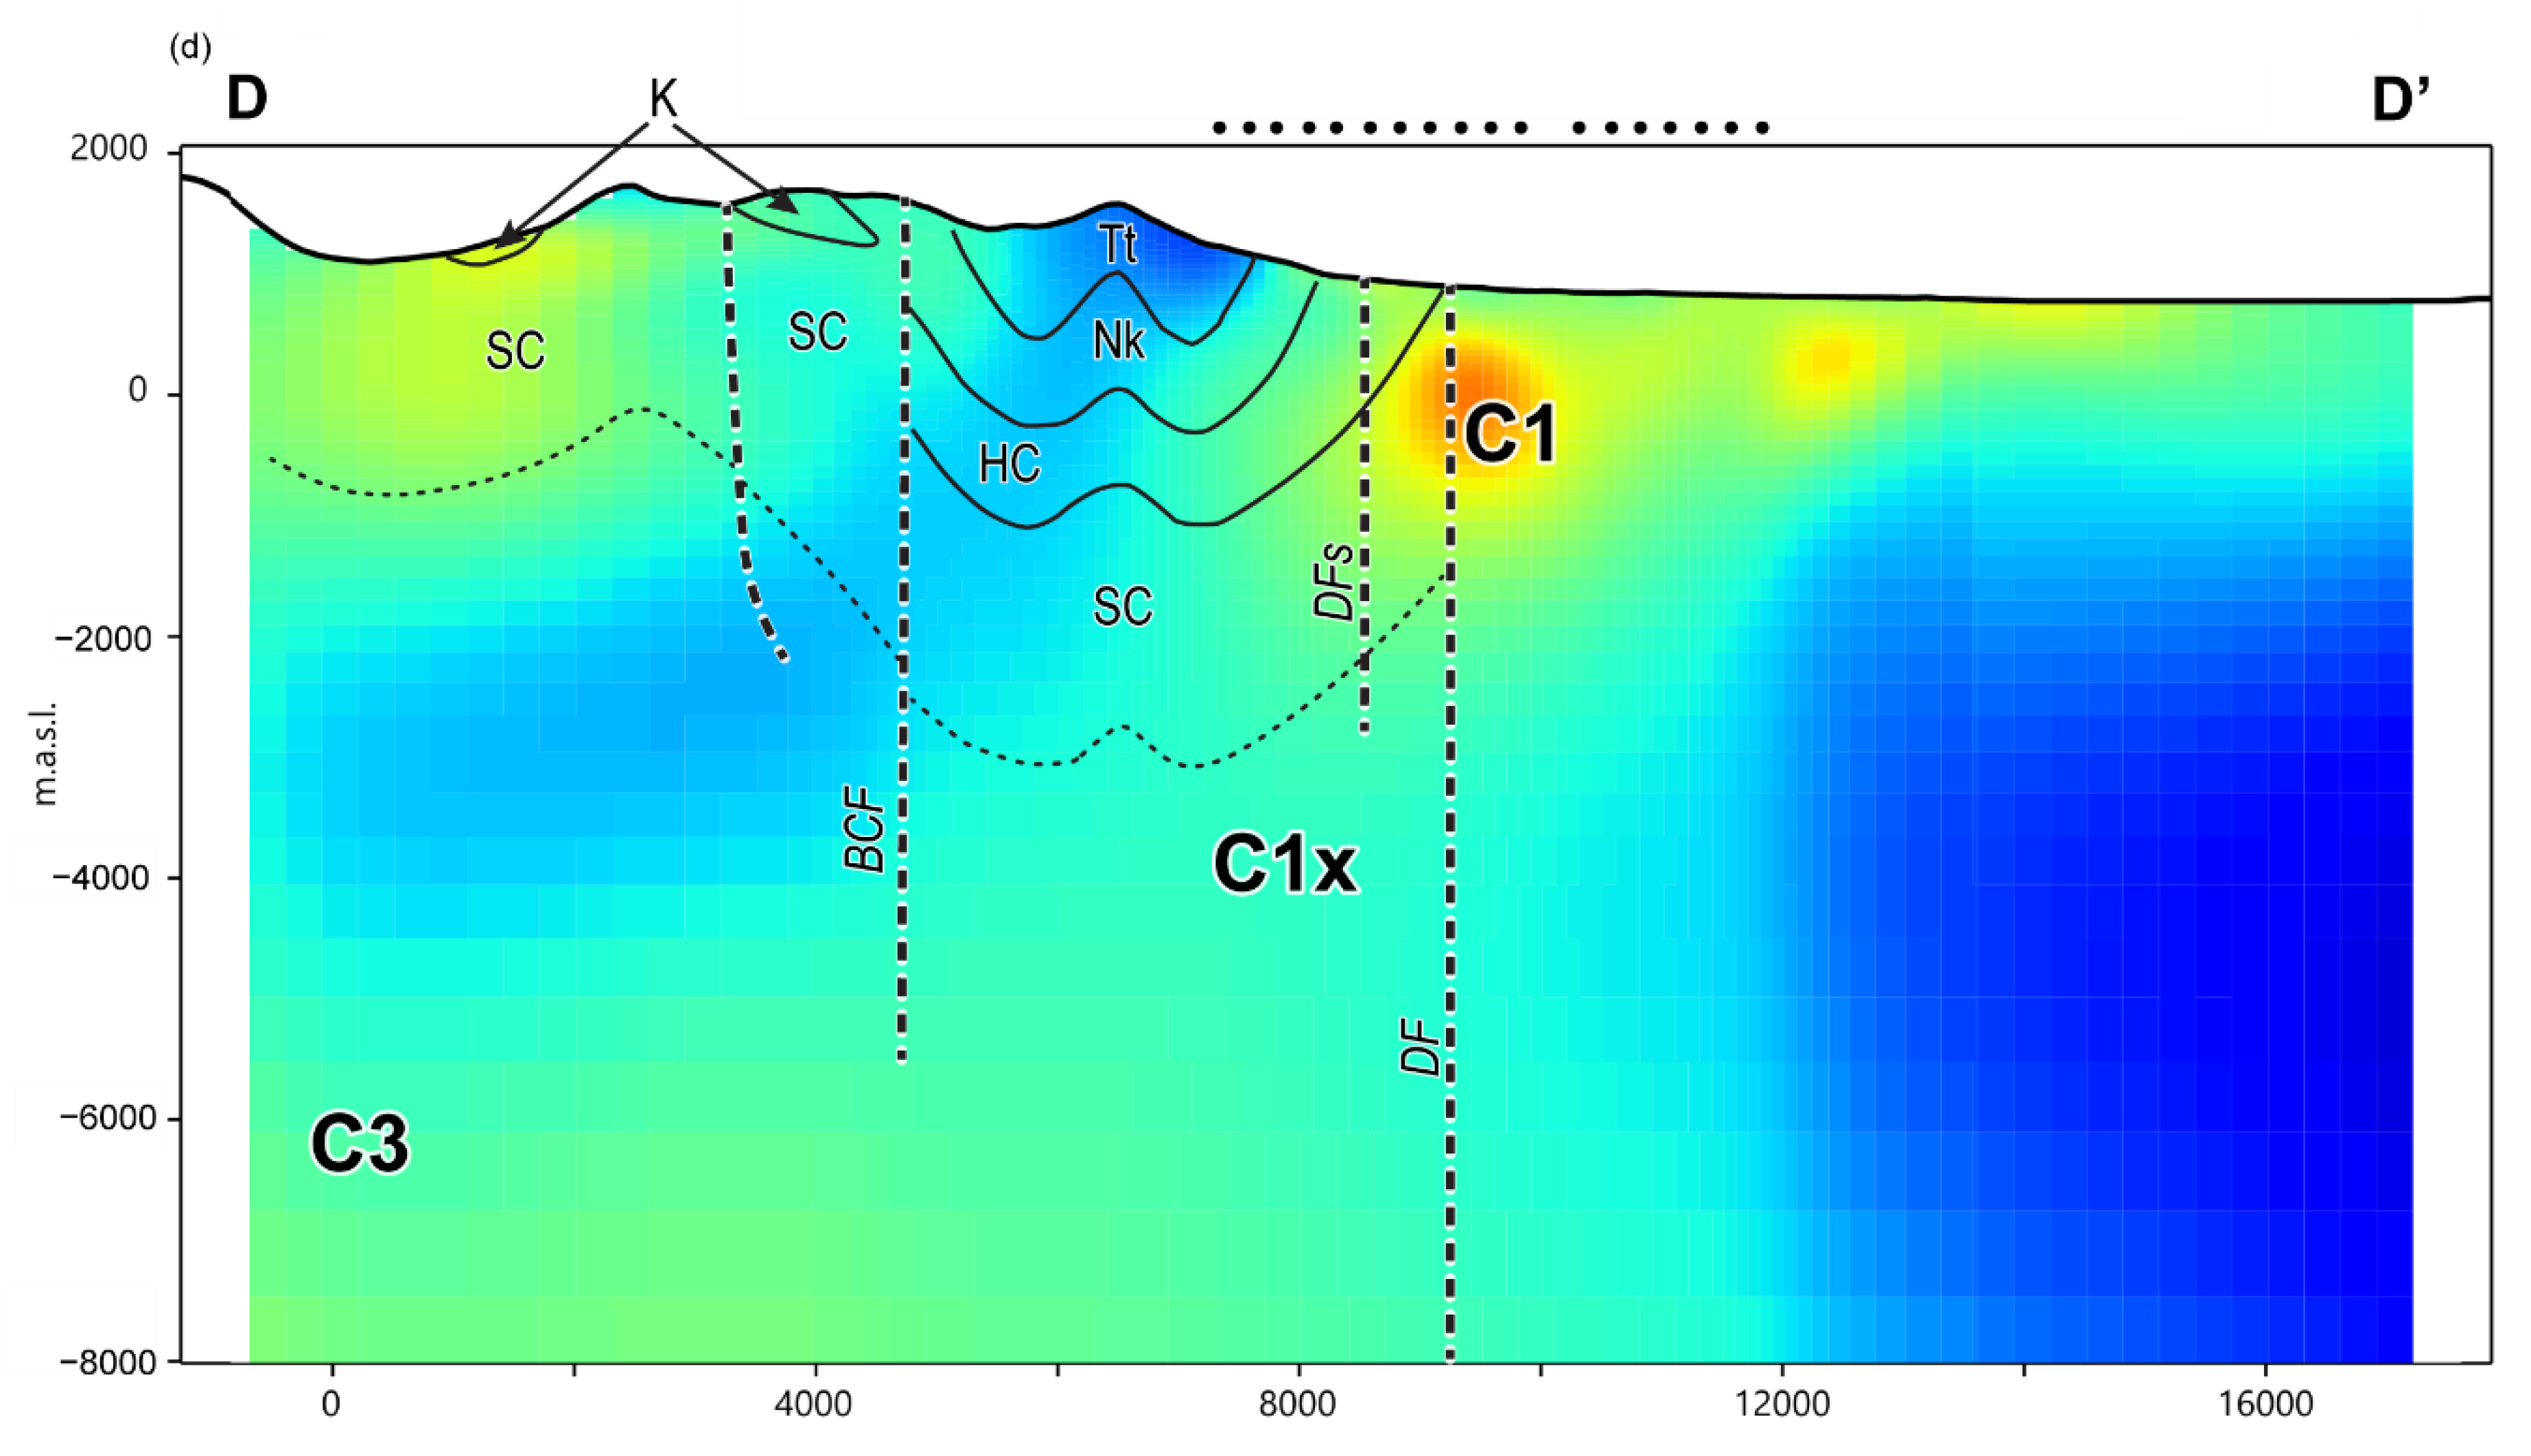
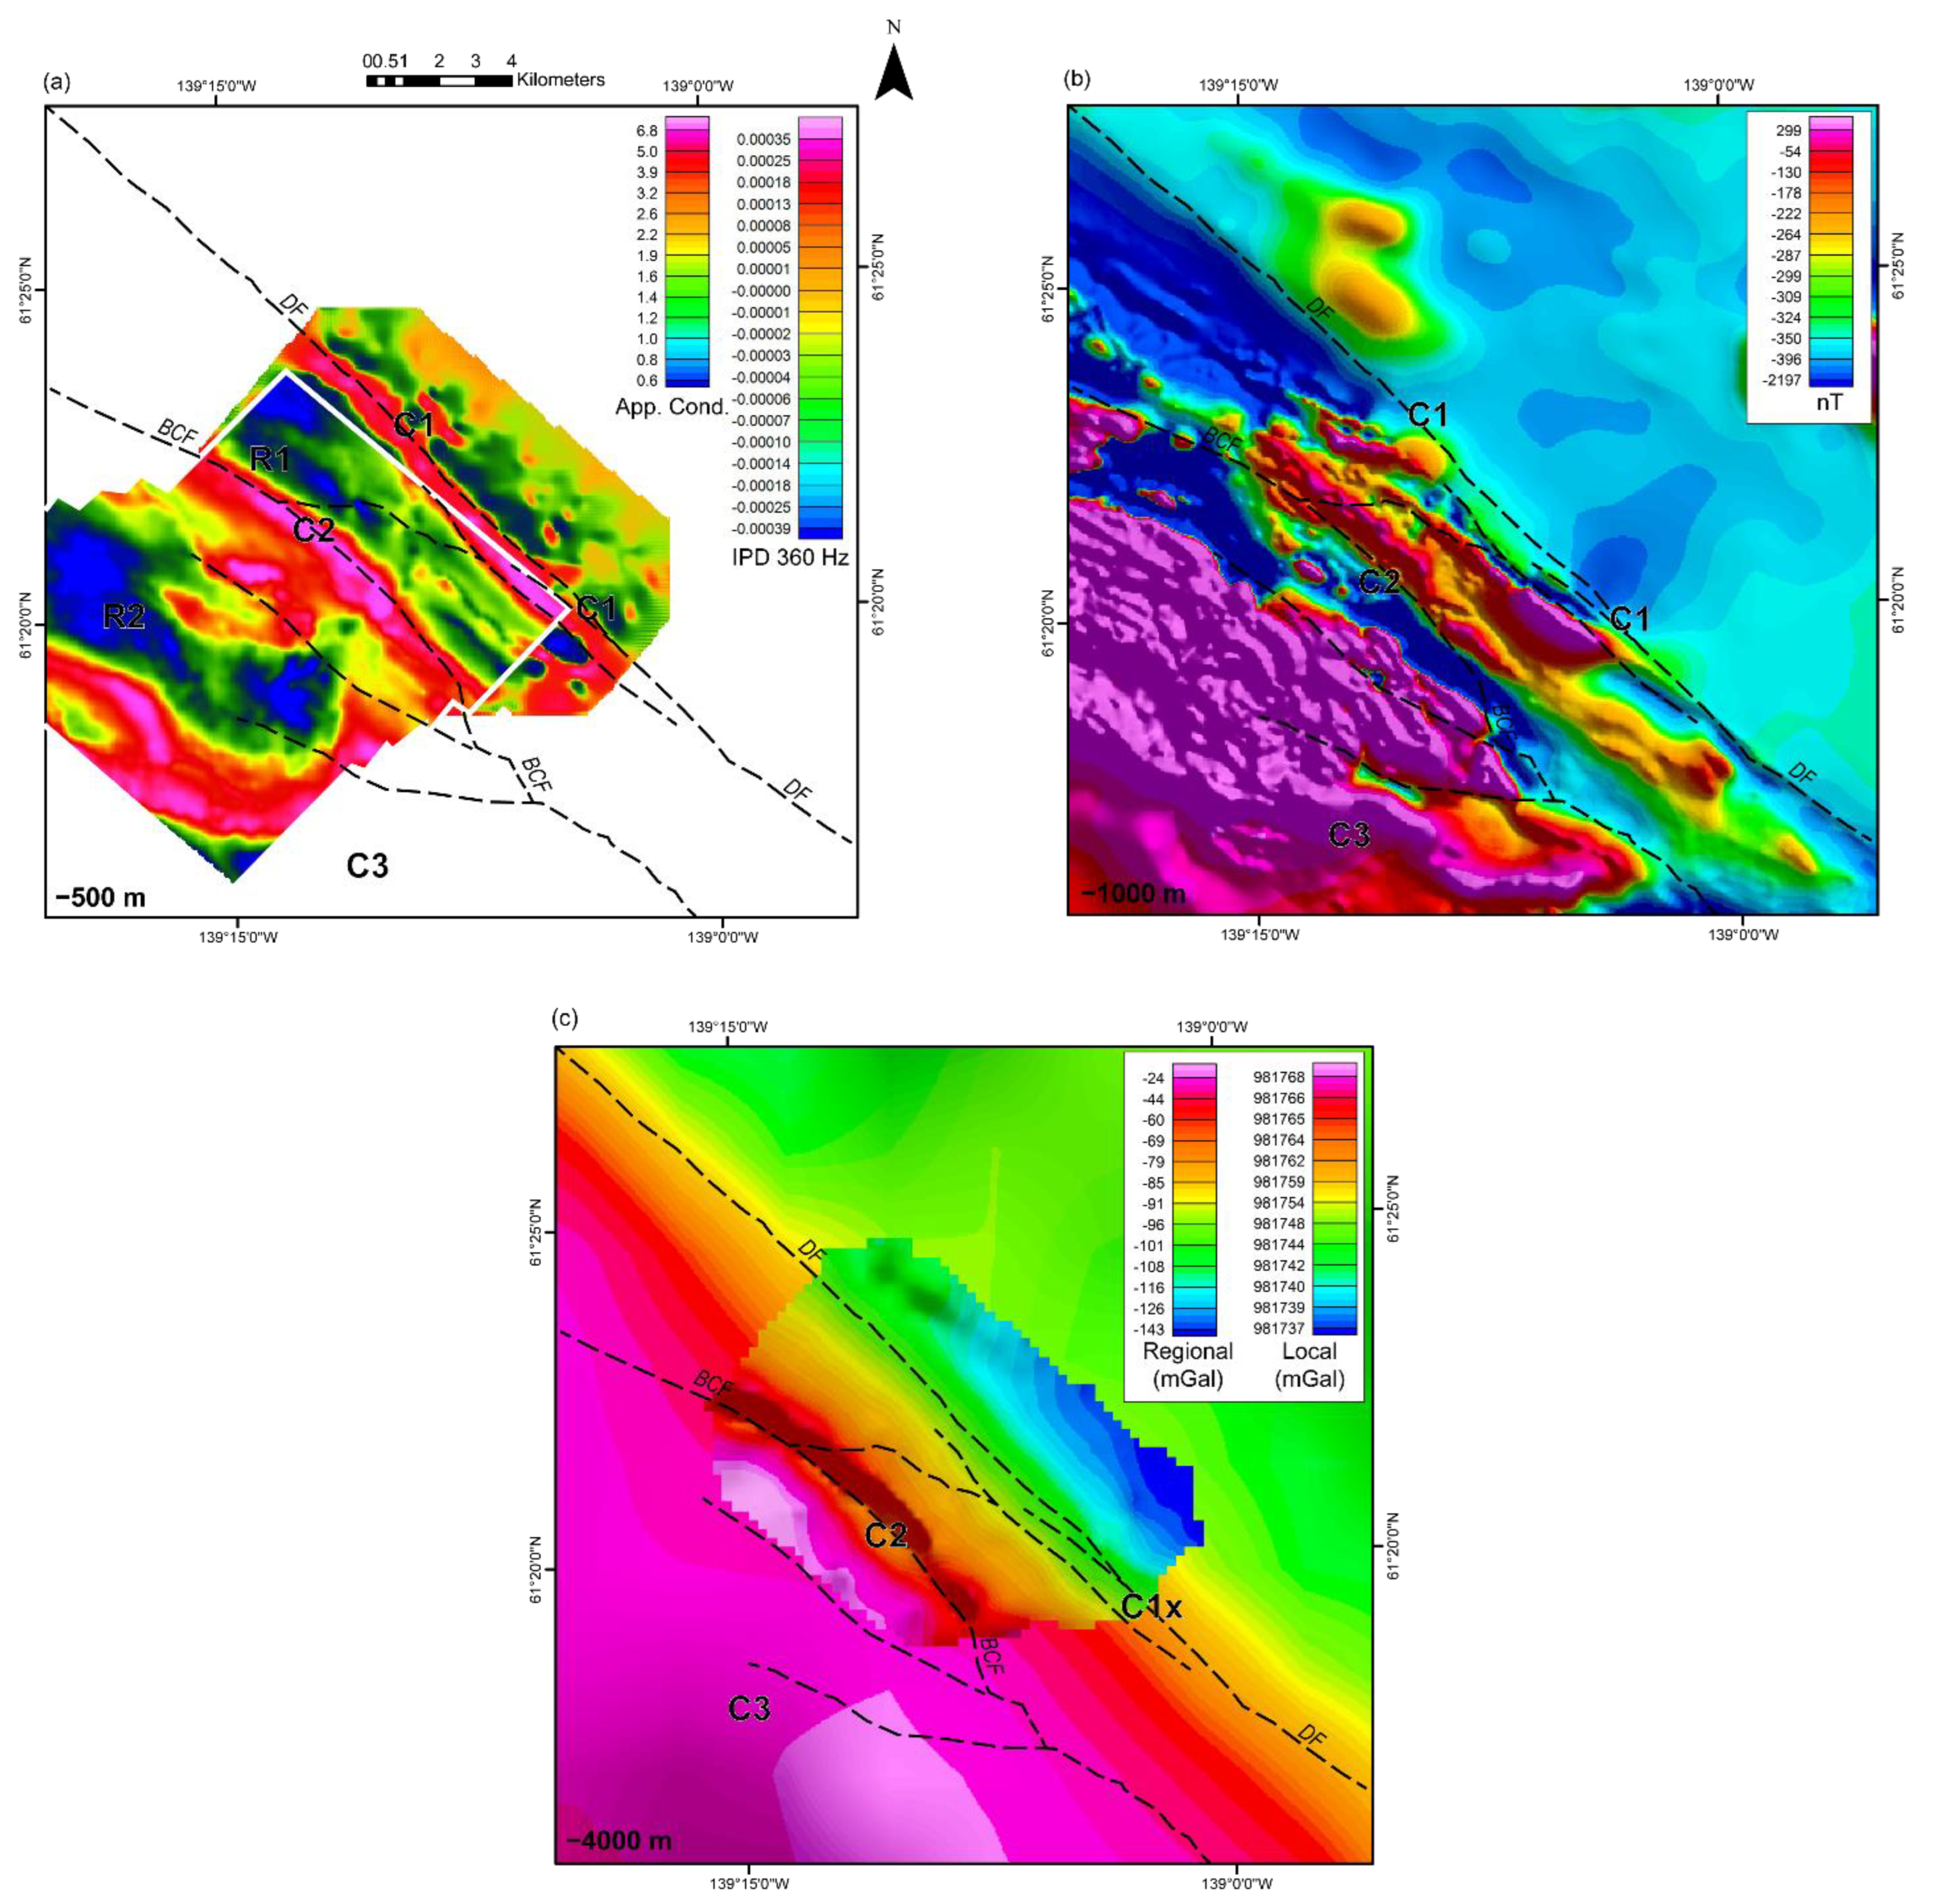
6. Results and Interpretation
7. Discussion
8. Conclusions
Supplementary Materials
Author Contributions
Funding
Data Availability Statement
Acknowledgments
Conflicts of Interest
References
- Majorowicz, J.; Grasby, S.E. Geothermal Energy for Northern Canada: Is it Economical? Nat. Resour. Res. 2014, 23, 159–173. [Google Scholar] [CrossRef]
- Witter, J.B.; Miller, C.A.; Friend, M.; Colpron, M. Curie Point Depths and Heat Production in Yukon, Canada. In Proceedings of the 43rd Workshop on Geothermal Reservoir Engineering, Stanford, CA, USA, 12–14 February 2018; Stanford University: Stanford, CA, USA, 2018. 11p. [Google Scholar]
- Witter, J.B. Early-Stage Exploration for Geothermal Energy Resources along the Denali Fault near Duke River, Yukon. Yukon Geological Survey, Open File; Government of Yukon: Yukon, YT, Canada, 2020; 70p. [Google Scholar]
- Fraser, T.A.; Colpron, M.; Relf, C. Evaluating geothermal potential in Yukon through temperature gradient drilling. In Yukon Exploration and Geology 2018; MacFarlane, K.E., Ed.; Yukon Geological Survey: Yukon, YT, Canada, 2019; pp. 75–90. [Google Scholar]
- Elliott, J.; Freymueller, J.T. A block model of present--day kinematics of Alaska and western Canada. J. Geophys. Res. Solid Earth 2020, 125, e2019JB018378. [Google Scholar] [CrossRef]
- McDermott, R.G.; Ault, A.K.; Caine, J.S. Dating fault damage along the eastern Denali fault zone with hematite (U-Th)/He thermochronometry. Earth Planet. Sci. Lett. 2021, 563, 116872. [Google Scholar] [CrossRef]
- Yukon Geological Survey. A Digital Atlas of Terranes for the Northern Cordillera: Yukon Geological Survey. 2022. Available online: https://data.geology.gov.yk.ca/Compilation/2 (accessed on 5 August 2022).
- Muñoz, G. Exploring for geothermal resources with electromagnetic methods. Surv. Geophys. 2014, 35, 101–122. [Google Scholar] [CrossRef]
- Tetra Tech. Overarching Yukon Source Water Supply and Protection Study—Summary Report. File: WTR.GWTR03022-04. 31 March 2017. Available online: https://open.yukon.ca/sites/default/files/env-overarching-yukon-source-water-supply-protection-study-summary-report.pdf (accessed on 5 August 2022).
- EBA Engineering Consultants Ltd. Resource Assessment for Heat Potential Study, Haines Junction, YT. EBA Project: 1240049; EBA Engineering Consultants Ltd.: Edmonton, AB, USA, 2004. [Google Scholar]
- Crandall, J.T.; Sadlier-Brown, T.L. Data on Geothermal Areas Cordilleran Yukon, Northwest Territories, and Adjacent British Columbia, Canada; Open File 427; Geological Survey of Canada: Ottawa, ON, Canada, 1977; 80p. [Google Scholar] [CrossRef]
- Bender, A.; Haeussler, P. Eastern Denali Fault Surface Trace Map, Eastern Alaska and Yukon, Canada; Open-File Report 2017–1049; U.S. Geological Survey: Reston, VA, USA, 2017; 10p. [CrossRef]
- Finlay, T.; Salomon, G.; Stephen, R.; Nissen, E.; Cassidy, J.; Menounos, B. Preliminary results and structural interpretations from drone LiDAR surveys over the Eastern Denali fault, Yukon. In Yukon Exploration and Geology; MacFarlane, K.E., Ed.; Yukon Geological Survey: Yukon, YT, Canada, 2022; pp. 83–105. [Google Scholar]
- Faulds, J.; Hinz, N. Favorable Tectonic and Structural Settings of Geothermal Systems in the Great Basin Region, Western USA: Proxies for Discovering Blind Geothermal Systems. In Proceedings of the World Geothermal Congress 2015, Melbourne, Australia, 19–25 April 2015. [Google Scholar]
- Craig, J.W.; Faulds, J.E.; Hinz, N.H.; Earney, T.E.; Schermerhorn, W.D.; Siler, D.L.; Glen, J.M.; Peacock, J.; Coolbaugh, M.F.; Deoreo, S.B. Discovery and analysis of a blind geothermal system in southeastern Gabbs Valley, western Nevada, USA. Geothermics 2021, 97, 102177. [Google Scholar] [CrossRef]
- Peacock, J.R.; Siler, D.L. Bottom-up and top-down control on hydrothermal resources in the Great Basin: An example from Gabbs Valley, Nevada. Geophys. Res. Lett. 2021, 48, e2021GL095009. [Google Scholar] [CrossRef]
- Townend, J.; Sutherland, R.; Toy, V.G.; Doan, M.L.; Célérier, B.; Massiot, C.; Coussens, J.; Jeppson, T.; Janku--Capova, L.; Remaud, L.; et al. Petrophysical, geochemical, and hydrological evidence for extensive fracture--mediated fluid and heat transport in the Alpine Fault’s hanging--wall damage zone. Geochem. Geophys. Geosystems 2017, 18, 4709–4732. [Google Scholar] [CrossRef]
- Dobson, P.F. A Review of Exploration Methods for Discovering Hidden Geothermal Systems. GRC Trans. 2016, 40, 695–706. [Google Scholar]
- Relf, C. Yukon Geological Survey 2021 overview. In Yukon Exploration and Geology 2021; McFarlane, K.E., Ed.; Yukon Geological Survey: Yukon, YT, Canada, 2022; pp. 1–15. [Google Scholar]
- Garg, S.K.; Pritchett, J.W.; Combs, J. Exploring for hidden geothermal systems. In Proceedings of the World Geothermal Congress, Bali, Indonesia, 25–30 April 2010; 7p. [Google Scholar]
- Wannamaker, P.E.; Moore, J.N.; Pankow, K.L.; Simmons, S.F.; Nash, G.D.; Maris, V.; Trow, A.; Hardwick, C.L. Phase II of play fairway analysis for the eastern Great Basin extensional regime. Utah Status Indic. Geothermal Res. Council Trans. 2017, 41, 2368–2382. [Google Scholar]
- Bense, V.F.; Gleeson, T.; Loveless, S.E.; Bour, O.; Scibek, J. Fault zone hydrogeology. Earth-Sci. Rev. 2013, 127, 171–192. [Google Scholar] [CrossRef]
- Grasby, S.E.; Hutcheon, I. Controls on the distribution of thermal springs in the southern Canadian Cordillera. Can. J. Earth Sci. 2001, 38, 427–440. [Google Scholar] [CrossRef]
- Grasby, S.E.; Ferguson, G.; Brady, A.; Sharp, C.; Dunfield, P.; McMechan, M. Deep groundwater circulation and associated methane leakage in the northern Canadian Rocky Mountains. Appl. Geochem. 2016, 68, 10–18. [Google Scholar] [CrossRef]
- Coyle, M.; Kiss, F.; Boulanger, O.; Oneschuk, D. Kluane Lake West Electromagnetic Survey, Parts of NTS 115G/5, 6, 11 and 12; Open File 2015-24, also Geological Survey of Canada, Open File 7937, scale 1:50 000; Yukon Geological Survey: Yukon, YT, Canada, 2005. [Google Scholar]
- Gabrielse, H.; Murphy, D.C.; Mortensen, J.K. Cretaceous and Cenozoic dextral orogen-parallel displacements, magmatism and paleogeography, north-central Canadian Cordillera. In Paleogeography of the North American Cordillera: Evidence for and Against Large-Scale Displacements; Haggart, J.W., Monger, J.W.H., Enkin, R.J., Eds.; Special Paper 46, 255-276; Geological Association of Canada: St. John’s, NL, Canada, 2006. [Google Scholar]
- Colpron, M.; Nelson, J.L. Northern Cordillera: Canada and Alaska. In Encyclopedia of Geology, 2nd ed.; Reference Module in Earth Systems and Environmental Sciences; Elias, S.A., Alderton, D., Eds.; Elsevier: Amsterdam, The Netherlands, 2021; pp. 93–106. [Google Scholar]
- Lowey, G.W. A new estimate of the amount of displacement on the Denali fault system based on the occurrence of carbonate megaboulders in the Dezadeash Formation (Jura-Cretaceous), Yukon, and the Nutzotin Mountains sequence (Jura-Cretaceous), Alaska. Bull. Can. Pet. Geol. 1998, 46, 379–386. [Google Scholar]
- Waldien, T.S.; Roeske, S.M.; Benowitz, J.A. Tectonic underplating and dismemberment of the Maclaren-Kluane Schist records Late Cretaceous terrane accretion polarity and ~480 km of post-52 Ma dextral displacement on the Denali fault. Tectonics 2021, 40, e2020TC006677. [Google Scholar] [CrossRef]
- Mezger, J.E.; Chacko, T.; Erdmer, P. Metamorphism at a late Mesozoic accretionary margin: A study from the Coast belt of the North American Cordillera. J. Metamorph. Geol. 2001, 19, 121–137. [Google Scholar] [CrossRef]
- Mezger, J.E.; Creaser, R.A.; Erdmer, P.; Johnston, S.T. A Cretaceous back-arc basin in the Coast belt of the northern Canadian Cordillera: Evidence from geochemical and neodynium isotope characteristics of the Kluane metamorphic assemblage, southwest Yukon. Can. J. Earth Sci. 2001, 38, 91–103. [Google Scholar] [CrossRef]
- Israel, S.; Cobbett, R.; Westberg, E.; Stanley, B.; Hayward, N. Preliminary Bedrock Geology Map of the Ruby Ranges, Southwest Yukon (Parts of 115G and 115H); Open File 2011-2, scale 1:150,000; Yukon Geological Survey: Yukon, YT, Canada, 2011. [Google Scholar]
- Israel, S.; Murphy, D.C.; Bennett, V.; Mortensen, J.K.; Crowley, J.L. New insights into the geology and mineral potential of the Coast Belt in southwestern Yukon. In Yukon Exploration and Geology; MacFarlane, K.E., Weston, L.H., Relf, C., Eds.; Yukon Geological Survey: Yukon, YT, Canada, 2011; pp. 101–123. [Google Scholar]
- Yukon Geological Survey. Yukon Digital Bedrock Geology: Yukon Geological Survey. 2022. Available online: https://datatest.geology.gov.yk.ca/Compilation/3 (accessed on 5 August 2022).
- Dodds, C.J.; Campbell, R.B. Geology of SW Kluane Lake Map Area (115G & F (East 1/2)); Open File 2188, scale 1:250,000; Geological Survey of Canada: Ottawa, ON, Canada, 1992. [Google Scholar]
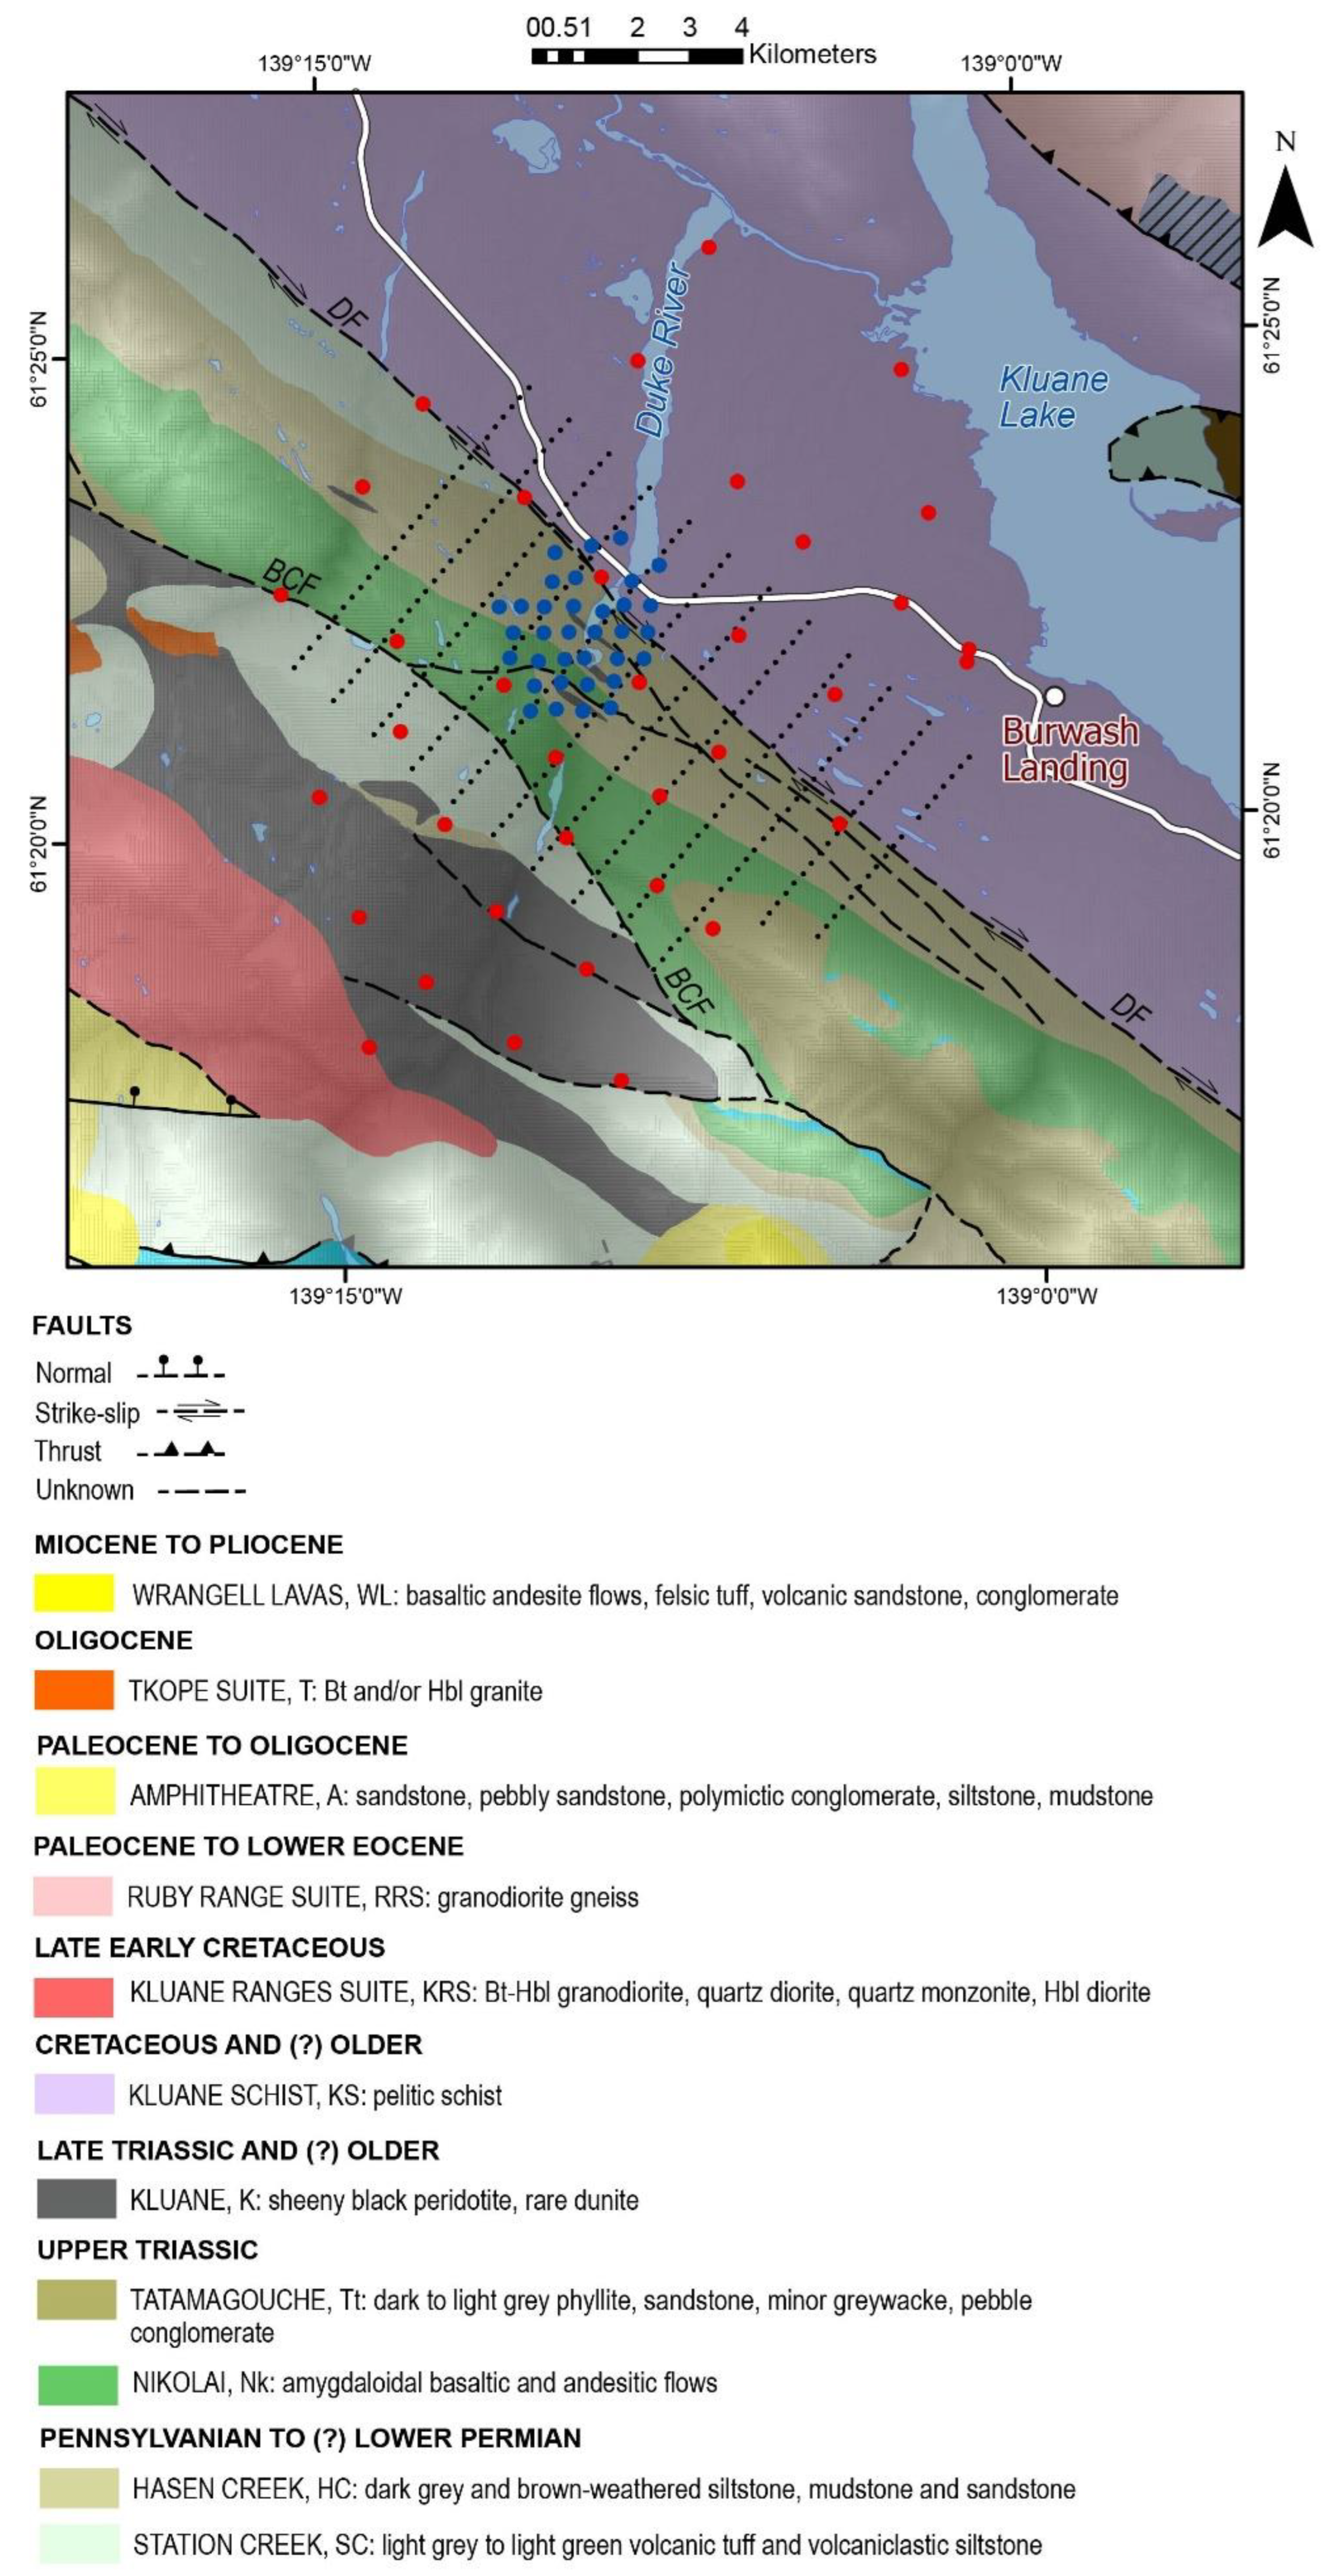
- Israel, S.; Tizzard, A.M.; Major, J. Geological Map of the Duke River Area (Parts of NTS 115G/2, 3, 5, 6, 7); Open File 2005-11, scale 1:50,000; Yukon Geological Survey: Yukon, YT, Canada, 2005. [Google Scholar]
- Israel, S.; Tizzard, A.M.; Major, J. Bedrock geology of the Duke River area, parts of NTS 115G/2, 3, 4, 6 and 7, southwestern Yukon. In Yukon Exploration and Geology; Emond, D.S., Bradshaw, G.D., Lewis, L.L., Weston, L.H., Eds.; Yukon Geological Survey: Yukon, YT, Canada, 2006; pp. 139–154. [Google Scholar]
- Hulbert, L. Geology and metallogeny of the Kluane mafic-ultramafic belt, Yukon Territory, Canada: Eastern Wrangellia—A new Ni-Cu-PGE metallogenic terrane. Geol. Surv. Can. Bull. 1997, 506, 265. [Google Scholar]
- Greene, A.R.; Scoates, J.S.; Weis, D.; Katvala, E.C.; Israel, S.; Nixon, G.T. The architecture of oceanic plateaus revealed by the volcanic stratigraphy of the accreted Wrangellia oceanic plateau. Geosphere 2010, 6, 47–73. [Google Scholar] [CrossRef]
- Blais-Stevens, A.; Clague, J.J.; Brahney, J.; Lipovsky, P.S.; Haeussler, P.J.; Menounos, B. Evidence for Large Holocene Earthquakes along the Denali Fault in Southwest Yukon, Canada. Environ. Eng. Geosci. 2020, 26, 1–18. [Google Scholar] [CrossRef]
- Choi, M.; Eaton, D.W.; Enkelmann, E. Is the Eastern Denali fault still active? Geology 2021, 49, 662–666. [Google Scholar] [CrossRef]
- Archie, G.E. The electrical resistivity log as an aid in determining some reservoir characteristics. Trans. AIME 1942, 146, 54–62. [Google Scholar] [CrossRef]
- Chave, A.D.; Jones, A.G. The Magnetotelluric Method: Theory and Practice; Cambridge University Press: Cambridge, UK, 2002. [Google Scholar]
- Simpson, F.; Bahr, K. Practical Magnetotellurics; Cambridge University Press: Cambridge, UK, 2005. [Google Scholar] [CrossRef]
- Egbert, G.D. Robust multiple station magnetotelluric data processing. Geophys. J. Int. 1997, 130, 475–496. [Google Scholar] [CrossRef]
- Caldwell, T.G.; Bibby, H.M.; Brown, C. The magnetotelluric phase tensor. Geophys. J. Int. 2004, 158, 457–469. [Google Scholar] [CrossRef]
- Booker, J.R. The magnetotelluric phase tensor: A critical review. Surv. Geophys. 2014, 35, 7–40. [Google Scholar] [CrossRef]
- Mackie, R.; Soyer, W.; Miorelli, F.; Schifano, V.; Hallinan, S. 3D Inversion Modeling of Natural and Controlled Source EM in Complex Terrain; KEGS: Toronto, ON, Canada, 2020; pp. 1–5. [Google Scholar]
- Soyer, W.; Mackie, R.L.; Miorelli, F. Optimizing the Estimation of Distortion Parameters in Magnetotelluric 3D Inversion. In Proceedings of the 80th EAGE Conference and Exhibition, Copenhagen, Denmark, 11–14 June 2018. [Google Scholar]
- Mackie, R.; Watts, M.D. Detectability of 3-D sulphide targets with AFMAG. SEG 2012 Expanded Abstracts. In Proceedings of the 2012 SEG Annual Meeting, Las Vegas, NV, USA, 4–9 November 2012; pp. 1–4. [Google Scholar]
- Rodi, W.; Mackie, R.L. Nonlinear conjugate gradients algorithm for 2-D magnetotelluric inversion. Geophysics 2001, 66, 174–187. [Google Scholar] [CrossRef]
- Tschirhart, V.; Craven, J.; Colpron, M.; Quantec Geoscience. Audiomagnetotelluric and Broadband Magnetotelluric Data for Geothermal Exploration in the Burwash Landing Area; Open File 2022-07; Yukon Geological Survey: Yukon, YT, Canada, 2022. [Google Scholar]
- Robertson, K.; Thiel, S.; Meqbel, N. Quality over quantity: On workflow and model space exploration of 3D inversion of MT data. Earth Planets Space 2020, 72, 1–22. [Google Scholar] [CrossRef]
- Enkin, R.J.; Cowan, D.; Tigner, J.; Severide, A.; Gilmour, D.; Tkachyk, A.; Kilduff, M.; Baker, J. Physical property measurements at the GSC Paleomagnetism and Petrophysics Laboratory, including electric impedance spectrum methodology and analysis. Geol. Surv. Can. Open File 2012, 7227, 57. [Google Scholar]
- Yukon Geological Survey. Yukon MINFILE—A Database of Mineral Occurrences: Yukon Geological Survey. Available online: https://datatest.geology.gov.yk.ca/Compilation/24 (accessed on 14 August 2022).
- Ingham, M.; Brown, C. A magnetotelluric study of the Alpine Fault, New Zealand. Geophys. J. Int. 1998, 135, 542–552. [Google Scholar] [CrossRef]
- Wannamaker, P.E.; Jiracek, G.R.; Stodt, J.A.; Caldwell, T.G.; Gonzalez, V.M.; McKnight, J.D.; Porter, A.D. Fluid generation and pathways beneath an active compressional orogen, the New Zealand Southern Alps, inferred from magnetotelluric data. J. Geophys. Res. 2002, 107, ETG 6-1–ETG 6-20. [Google Scholar] [CrossRef]
- Bedrosian, P.A.; Unsworth, M.J.; Egbert, G. Magnetotelluric imaging of the creeping segment of the San Andreas Fault near Hollister. Geophys. Res. Lett. 2002, 29, 1. [Google Scholar] [CrossRef]
- Held, S.; Schill, E.; Pavez, M.; Diaz, D.; Morata, D.; Kohl, T. Effects of major fault zones on geothermal reservoirs—A case study at Villarrica Volcano, southern Chile. In Proceedings of the European Geothermal Congress, Strasbourg, France, 19–24 September 2016; pp. 1–5. [Google Scholar]
- Stanley, W.D.; Labson, V.F.; Nokleberg, W.J.; Csejtey, B.; Fisher, M.A. The Denali fault system and Alaska Range of Alaska: Evidence for underplated Mesozoic flysch from MT surveys. Geol. Soc. Am. Bull. 1990, 102, 160–173. [Google Scholar] [CrossRef]
- Fisher, M.A.; Ratchkovski, N.A.; Nokleberg, W.J.; Pellerin, L.; Glen, J.M.G. Geophysical Data Reveal the Crustal Structure of the Alaska Range Orogen within the Aftershock Zone of the Mw = 7.9 Denali Fault Earthquake. Bull. Seismol. Soc. Am. 2004, 94, S107–S131. [Google Scholar] [CrossRef]
- Fisher, M.A.; Pellerin, L.; Nokleberg, W.J.; Ratchkovski, N.A.; Glen, J.M.G. Crustal structure of the Alaska Range orogen and Denali fault along the Richardson Highway. In Tectonic Growth of a Collisional Continental Margin: Crustal Evolution of Southern Alaska; Ridgway, K.D., Trop, J.M., Glen, J.M.G., O’Neill, J.M., Eds.; Geological Society of America Special Paper 431; Geological Society of America: Boulder, CO, USA, 2007; pp. 43–53. [Google Scholar] [CrossRef]
- Murphy, B.S.; Huizenga, J.M.; Bedrosian, P.A. Graphite as an electrically conductive indicator of ancient crustal-scale fluid flow within mineral systems. Earth Planet. Sci. Lett. 2022, 594, 117700. [Google Scholar] [CrossRef]
- Cunningham, W.D.; Mann, P. Tectonics of strike-slip restraining and releasing bends. Geol. Soc. Lond. Spec. Publ. 2007, 290, 1–12. [Google Scholar] [CrossRef]
- Wannamaker, P.E.; Hasterok, D.P.; Doerner, W.M. Possible magmatic input to the Dixie Val-ley geothermal field, and implications for district-scale resource exploration, inferred from magnetotelluric (MT) resistivity surveying. Geo-Therm. Resour. Counc. Trans. 2006, 30, 471–475. [Google Scholar]
- Wannamaker, P.E.; Doerner, W.M.; Hasterok, D.P. Integrated dense array and transect MT surveying at Dixie Valley geothermal area, Nevada; structural controls, hydrothermal alteration and deep fluid sources. In Proceedings of the 32nd Workshop on Geothermal Reservoir Engineering, Stanford, CA, USA, 22–24 January 2007; 6p. [Google Scholar]
- Christopher, P.A.; White, W.H.; Harakal, J.E. K-Ar dating of the ‘Cork’ (Burwash Creek) Cu-Mo prospect, Burwash Landing area, Yukon Territory, Canada. Can. J. Earth Sci. 1972, 9, 918–921. [Google Scholar] [CrossRef]
- Thybo, H.; Artemieva, I.M. Moho and magmatic underplating in continental lithosphere. Tectonophysics 2013, 609, 605–619. [Google Scholar] [CrossRef]
- Quantec Geoscience. MT electrode comparison: Porous pots vs. steel plates. Unpublished report. 2021. [Google Scholar]


| Unit | Density (g/cm3) | Susceptibility (SI) | Porosity (%) | Resistivity (ohm-m) | Min. Resistivity | Max. Resistivity | n |
|---|---|---|---|---|---|---|---|
| Tkope Suite | 2.50 | 0.00020 | 8.509 | 298 | 1 | ||
| Kluane mafic-ultramafic intrusion | 2.93 | 0.00082 | 1.098 | 912 | 438 | 1900 | 2 |
| Tatamagouche Formation | 2.76 | 0.00051 | 1.500 | 623 | 236 | 1050 | 5 |
| Nikolai Formation | 2.91 | 0.00120 | 1.136 | 3322 | 734 | 192,000 | 10 |
| Hasen Creek Formation | 2.72 | 0.00032 | 0.429 | 3898 | 932 | 141,000 | 14 |
| Station Creek Formation | 2.84 | 0.00060 | 0.578 | 2869 | 262 | 21,600 | 12 |
Publisher’s Note: MDPI stays neutral with regard to jurisdictional claims in published maps and institutional affiliations. |
© 2022 by the authors. Licensee MDPI, Basel, Switzerland. This article is an open access article distributed under the terms and conditions of the Creative Commons Attribution (CC BY) license (https://creativecommons.org/licenses/by/4.0/).
Share and Cite
Tschirhart, V.; Colpron, M.; Craven, J.; Ghalati, F.H.; Enkin, R.J.; Grasby, S.E. Geothermal Exploration in the Burwash Landing Region, Canada, Using Three-Dimensional Inversion of Passive Electromagnetic Data. Remote Sens. 2022, 14, 5963. https://doi.org/10.3390/rs14235963
Tschirhart V, Colpron M, Craven J, Ghalati FH, Enkin RJ, Grasby SE. Geothermal Exploration in the Burwash Landing Region, Canada, Using Three-Dimensional Inversion of Passive Electromagnetic Data. Remote Sensing. 2022; 14(23):5963. https://doi.org/10.3390/rs14235963
Chicago/Turabian StyleTschirhart, Victoria, Maurice Colpron, James Craven, Fateme Hormozzade Ghalati, Randy J. Enkin, and Stephen E. Grasby. 2022. "Geothermal Exploration in the Burwash Landing Region, Canada, Using Three-Dimensional Inversion of Passive Electromagnetic Data" Remote Sensing 14, no. 23: 5963. https://doi.org/10.3390/rs14235963
APA StyleTschirhart, V., Colpron, M., Craven, J., Ghalati, F. H., Enkin, R. J., & Grasby, S. E. (2022). Geothermal Exploration in the Burwash Landing Region, Canada, Using Three-Dimensional Inversion of Passive Electromagnetic Data. Remote Sensing, 14(23), 5963. https://doi.org/10.3390/rs14235963