
Rapid Rice Yield Estimation Using Integrated Remote Sensing and Meteorological Data and Machine Learning

 , , , , , ,
Abstract
1. Introduction
2. Materials and Methods
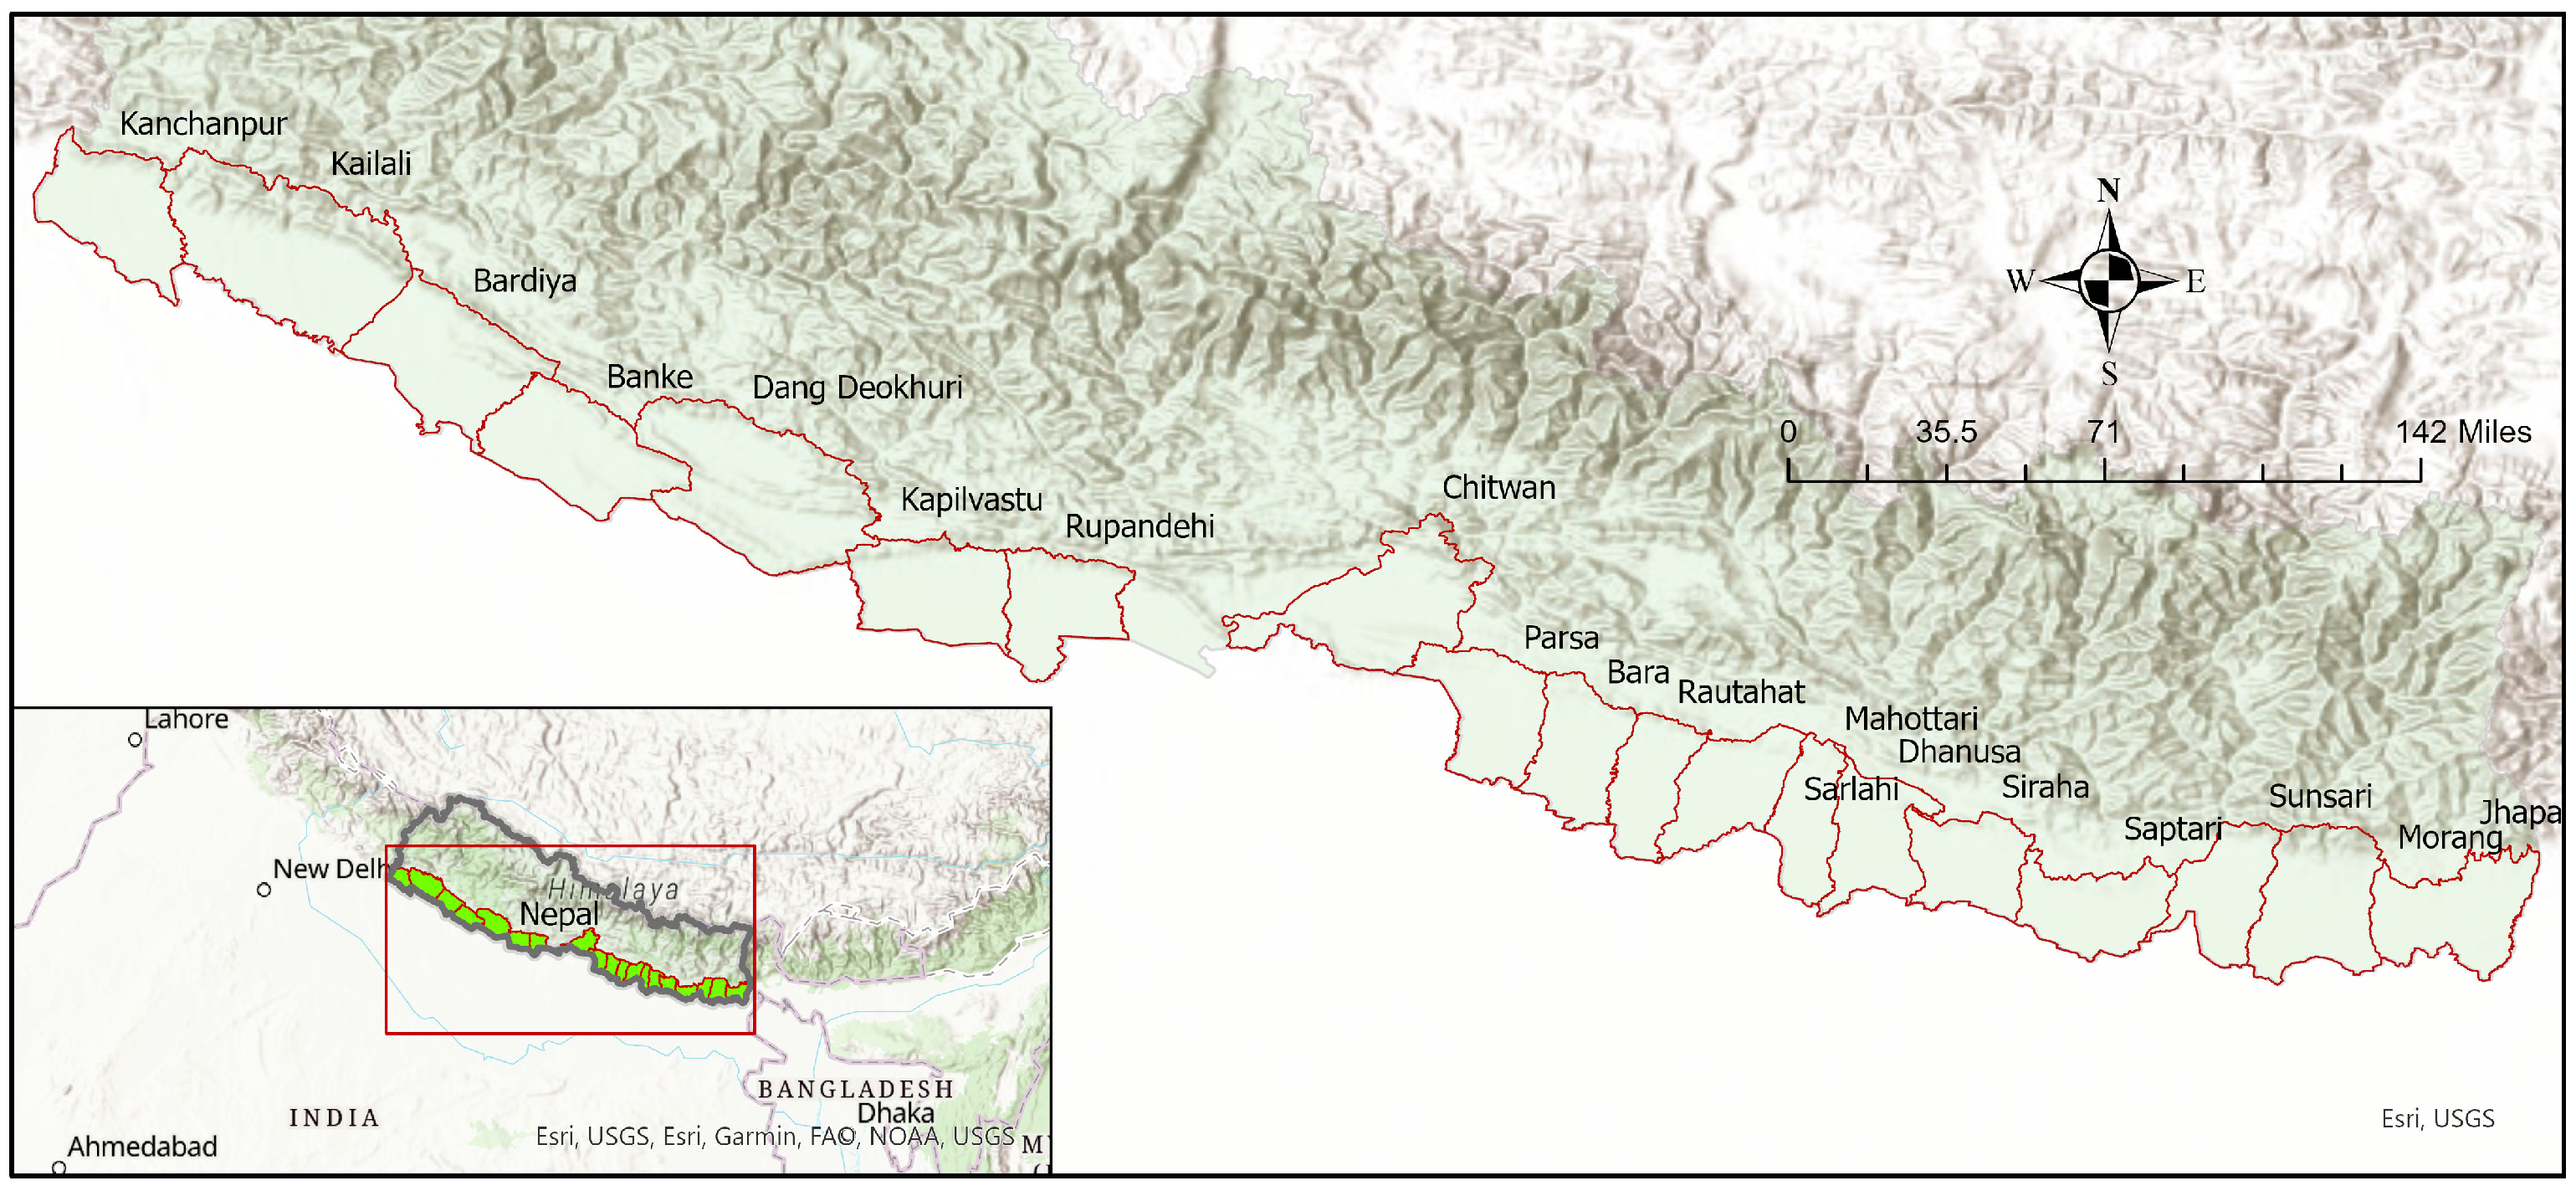
2.1. Study Area
2.2. Data Collection and Processing
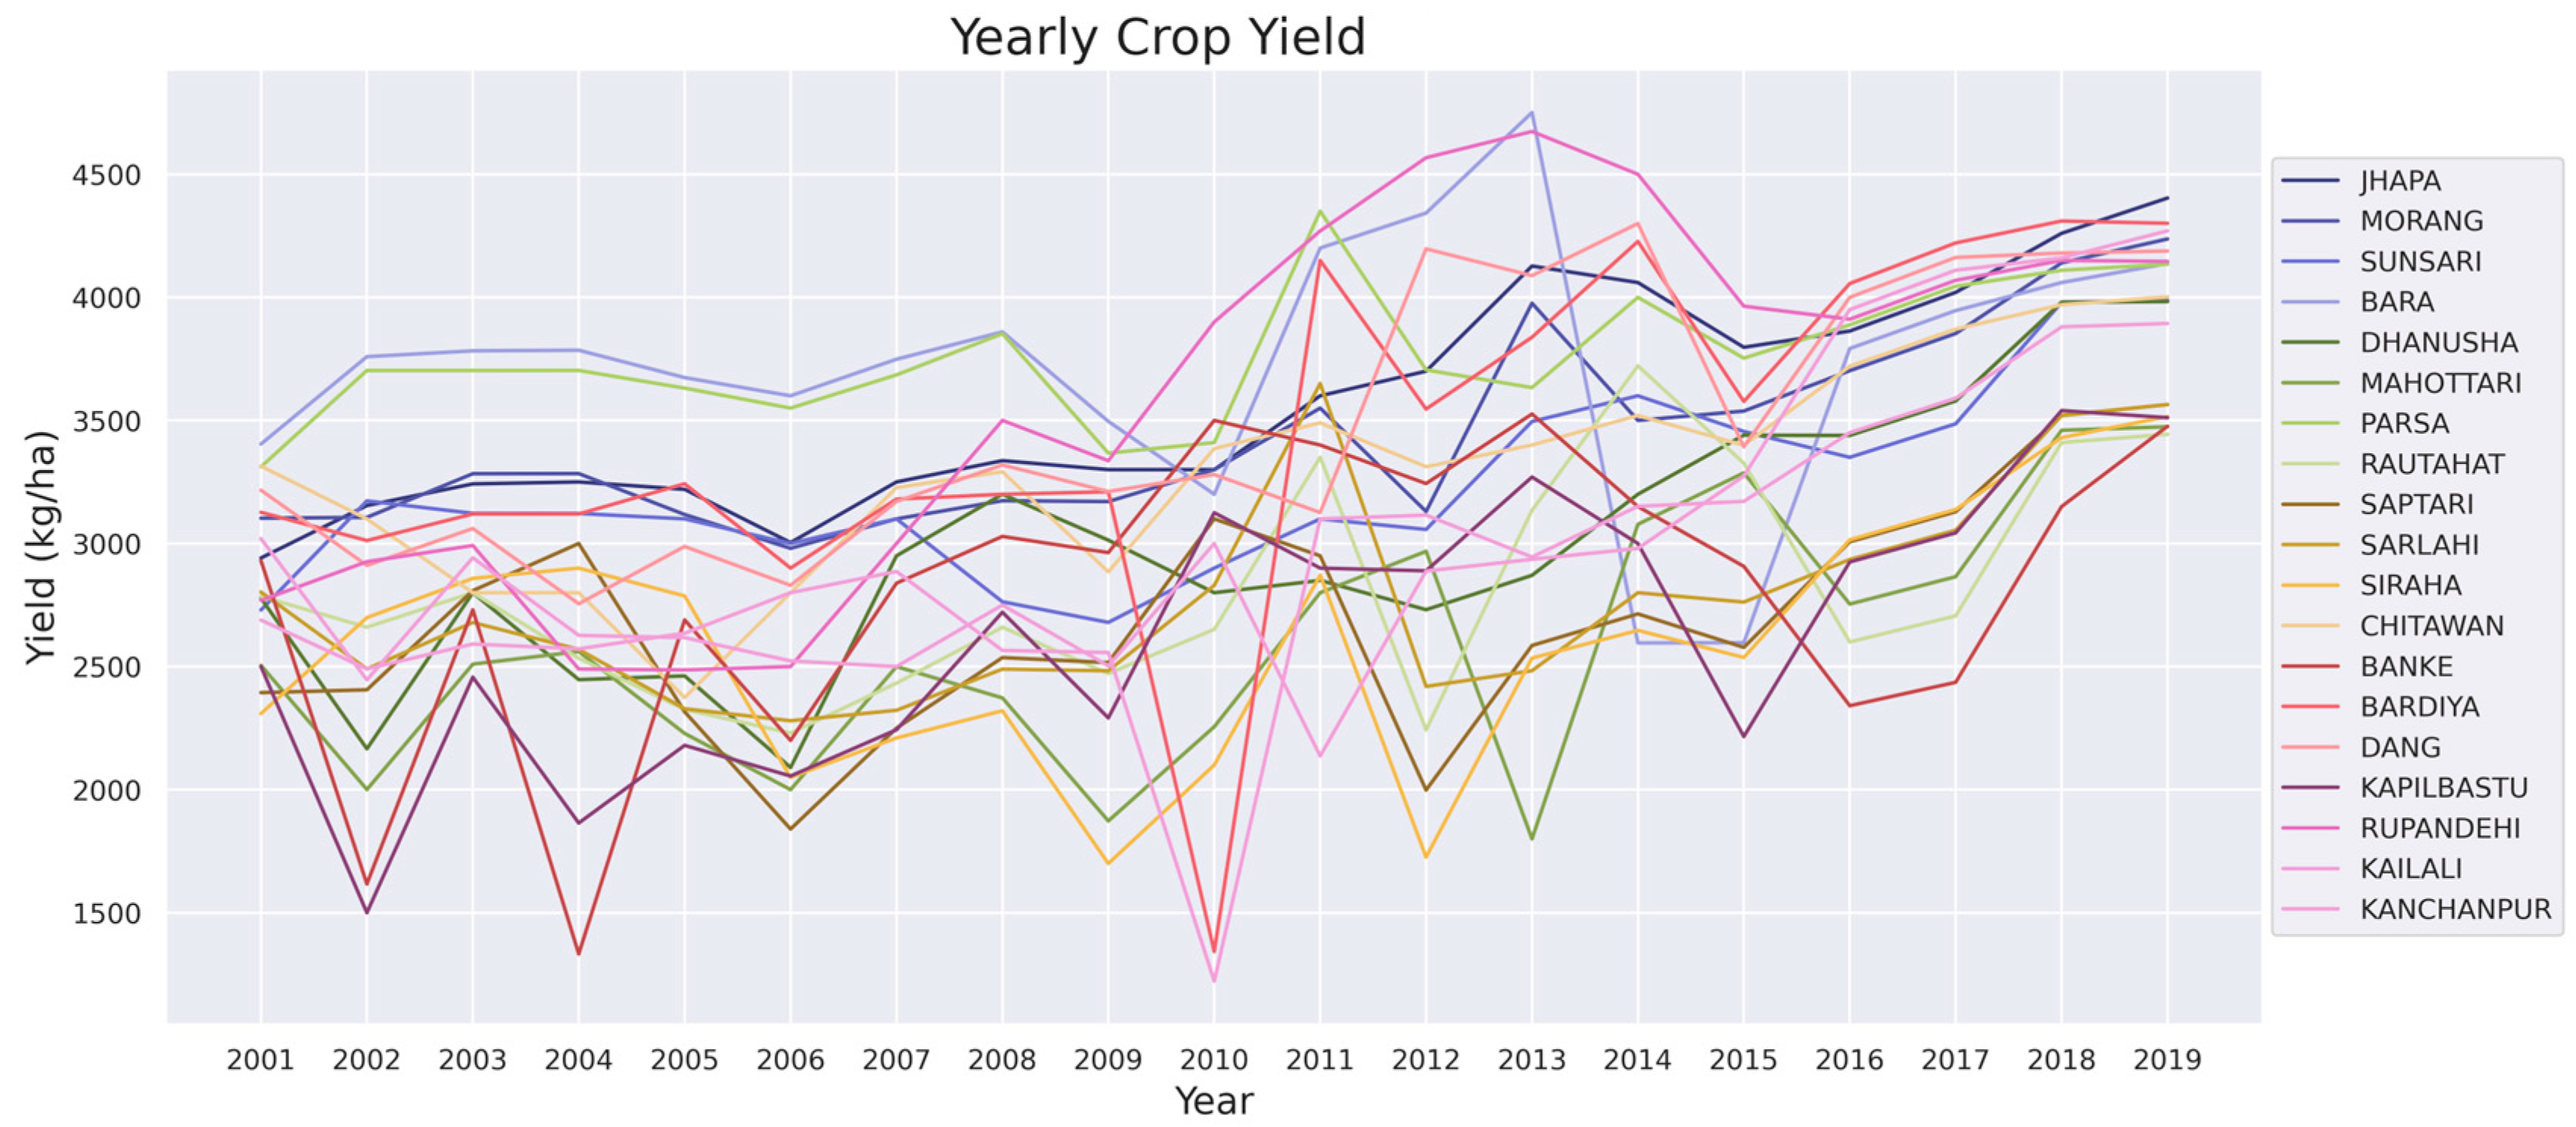
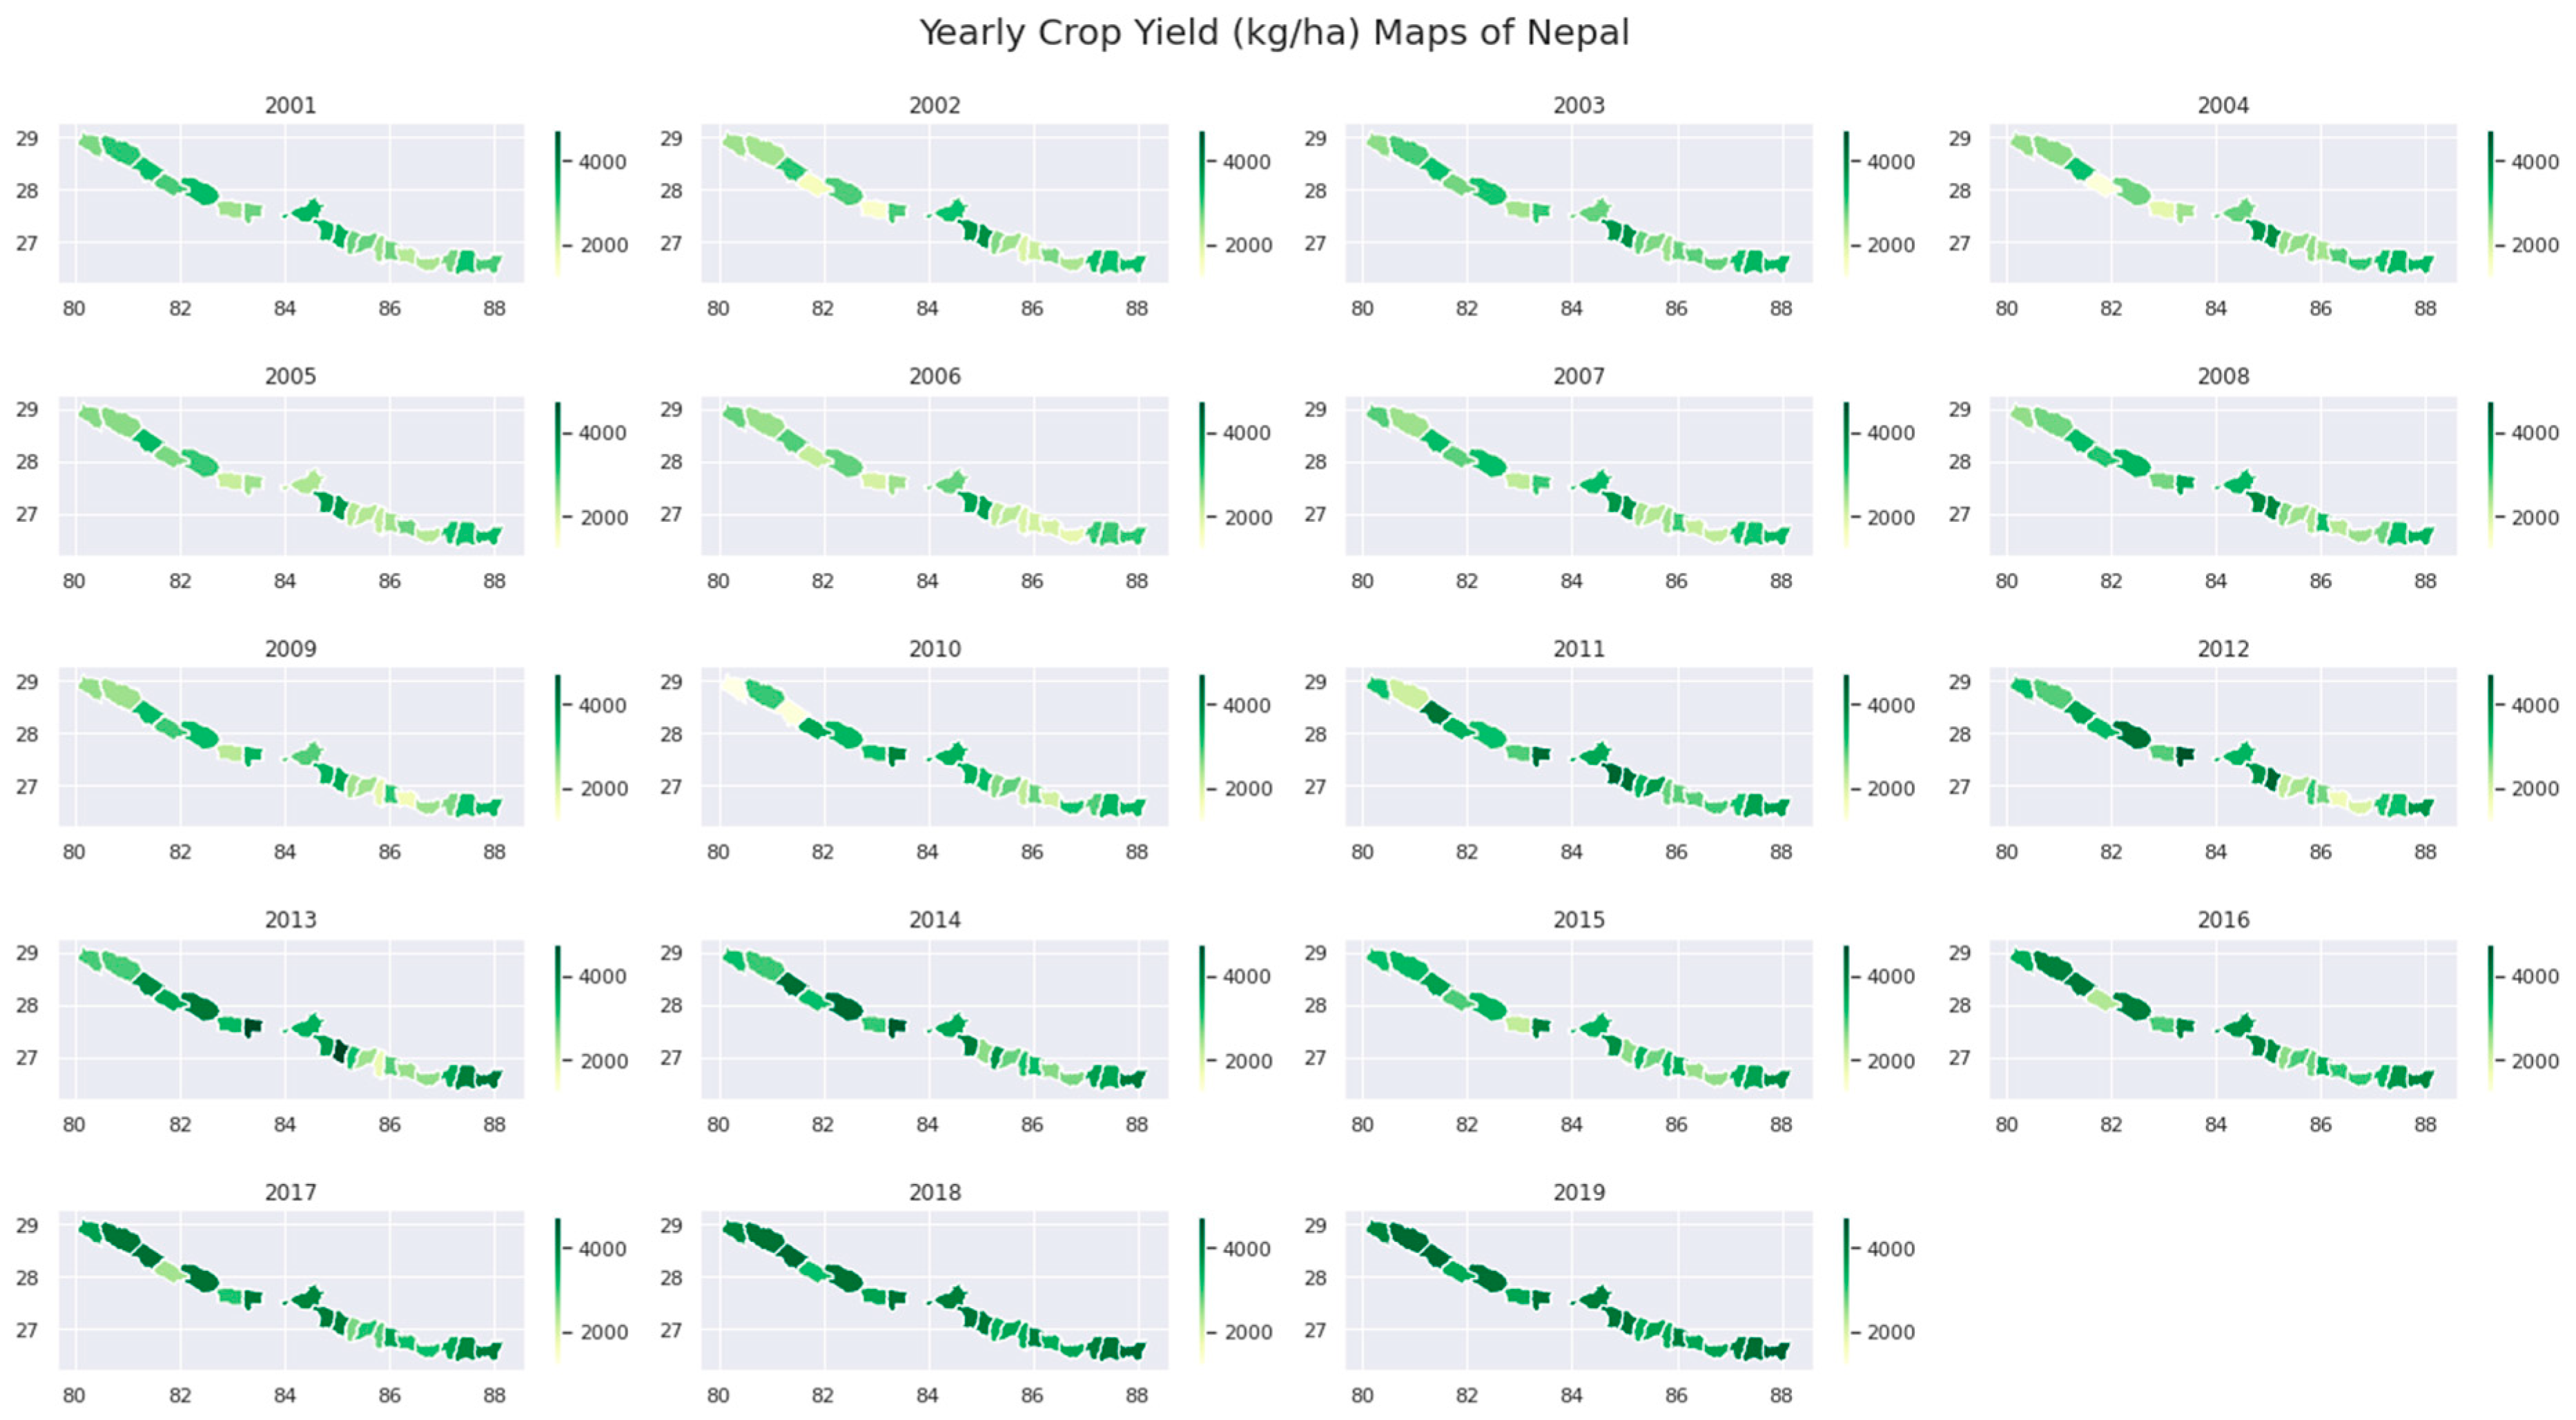
2.2.1. Rice Yield
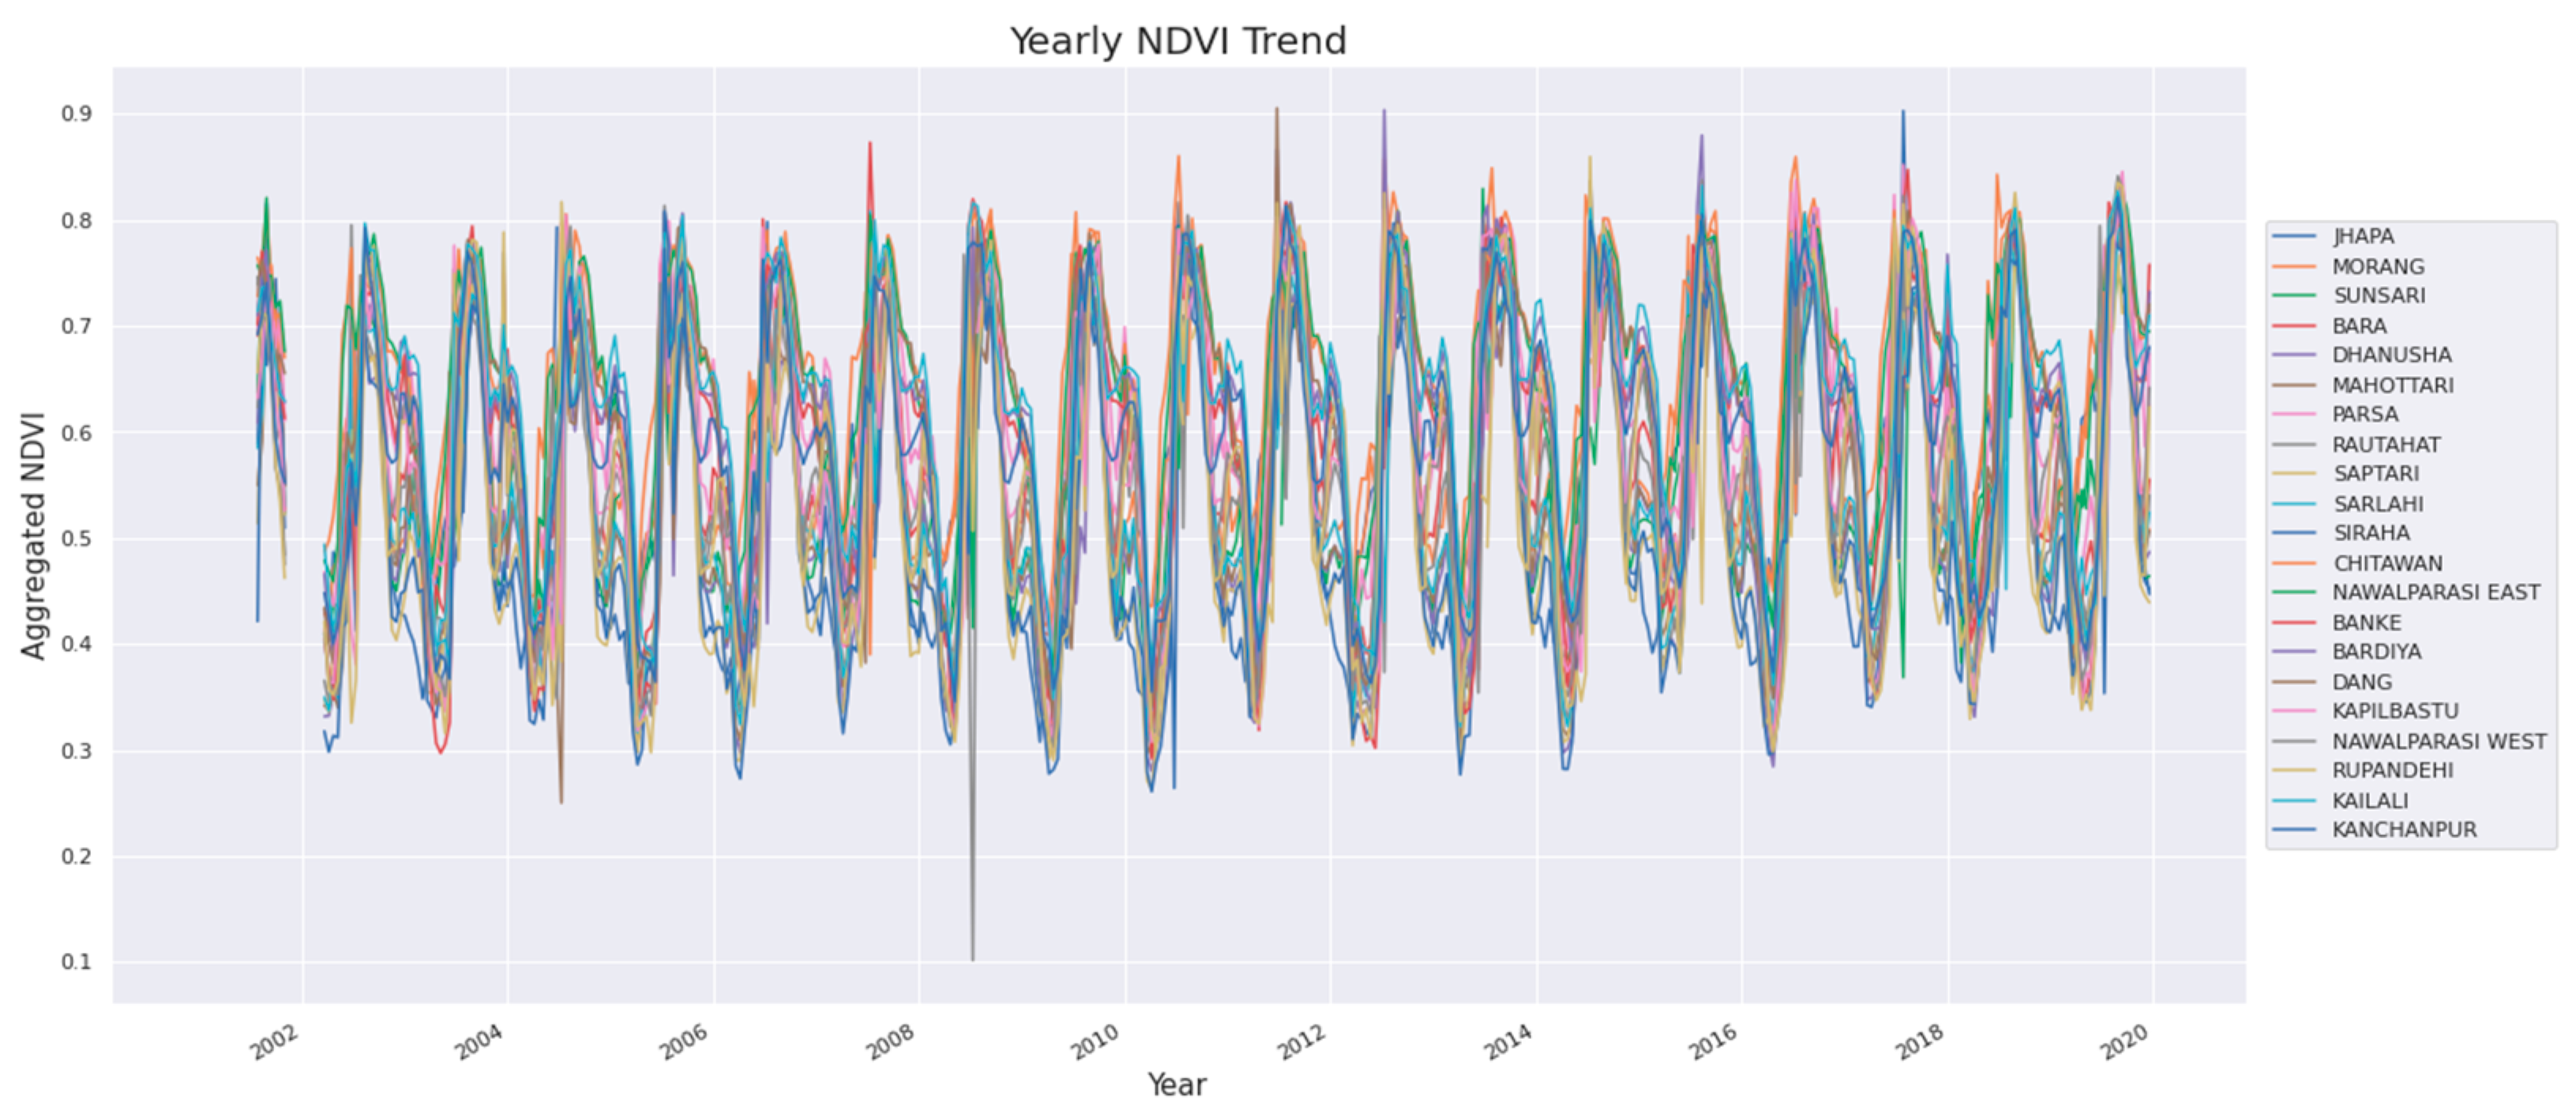
2.2.2. NDVI
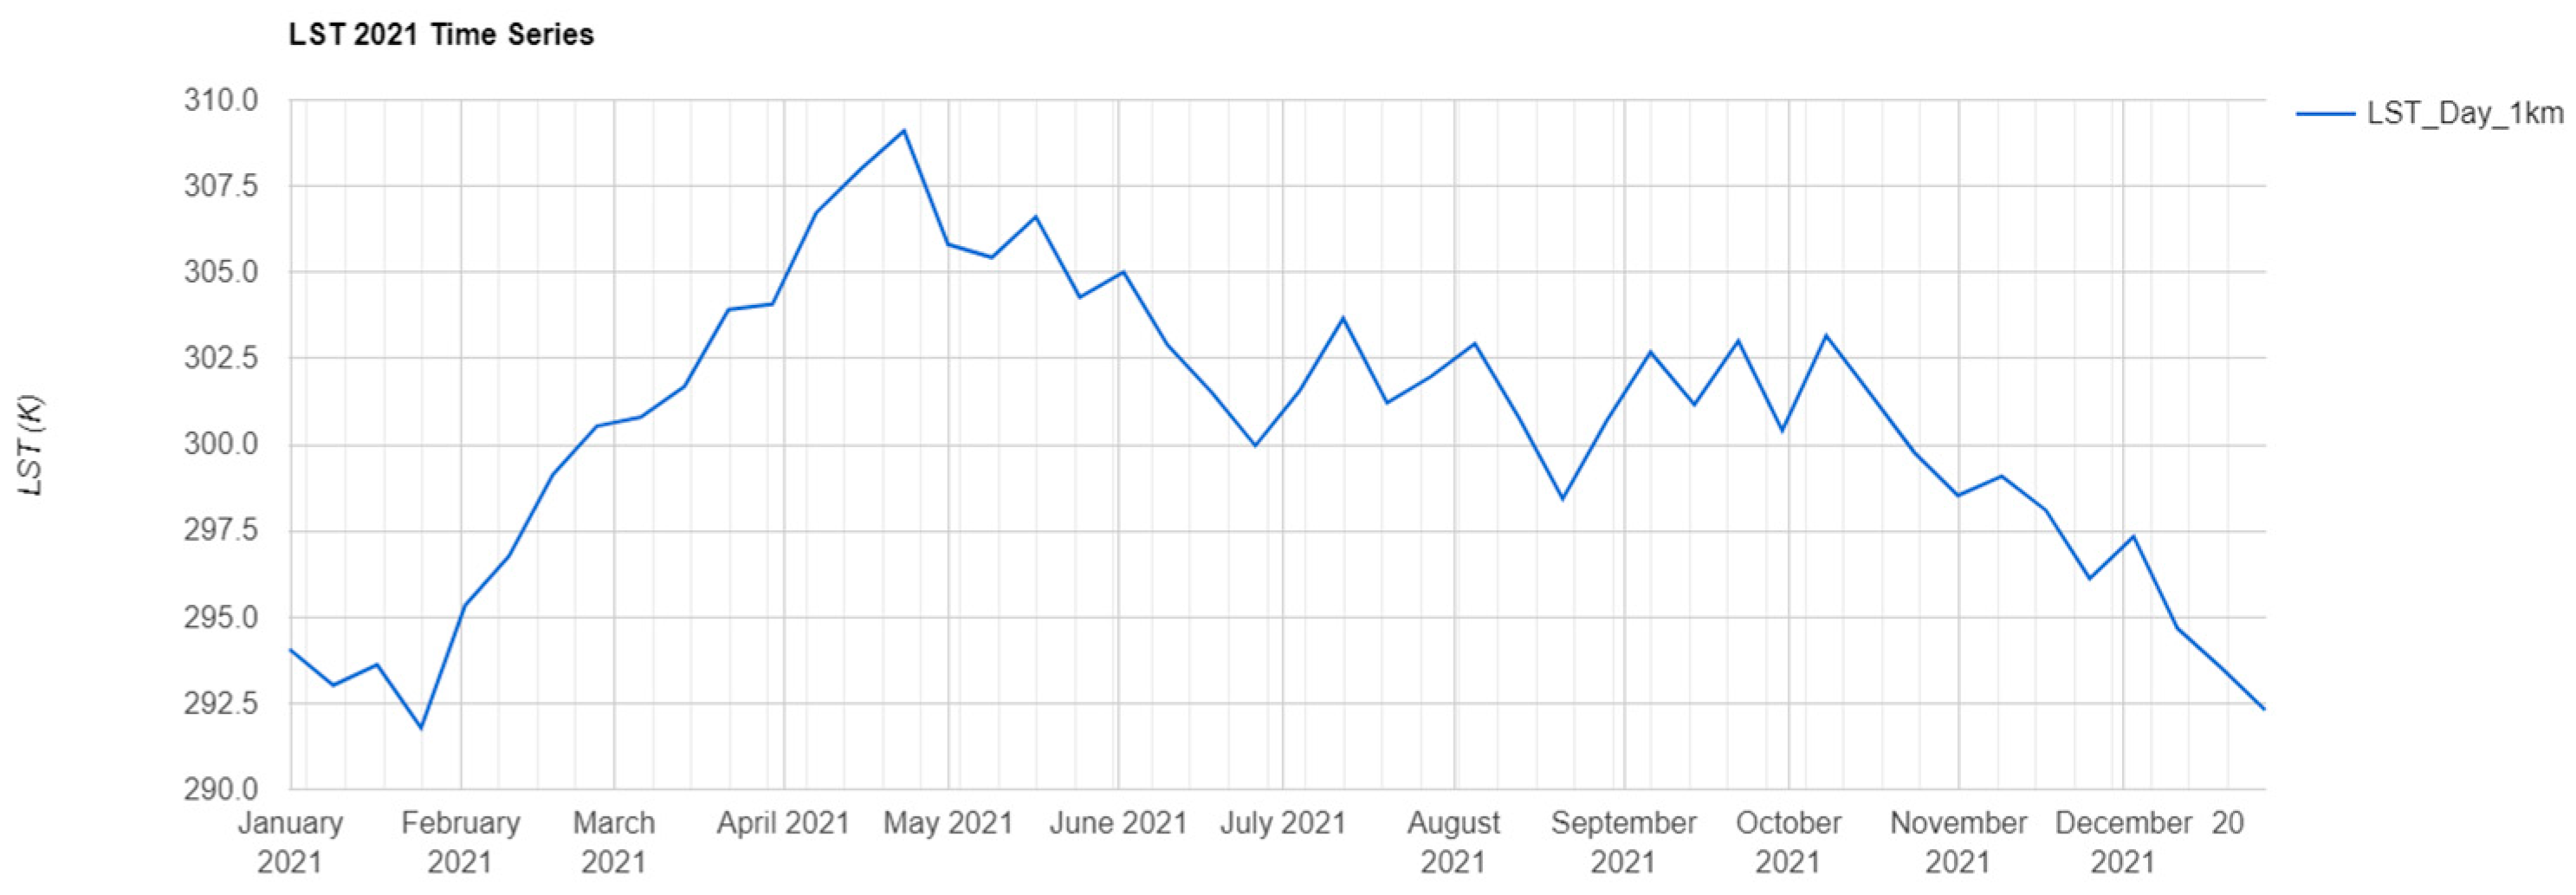
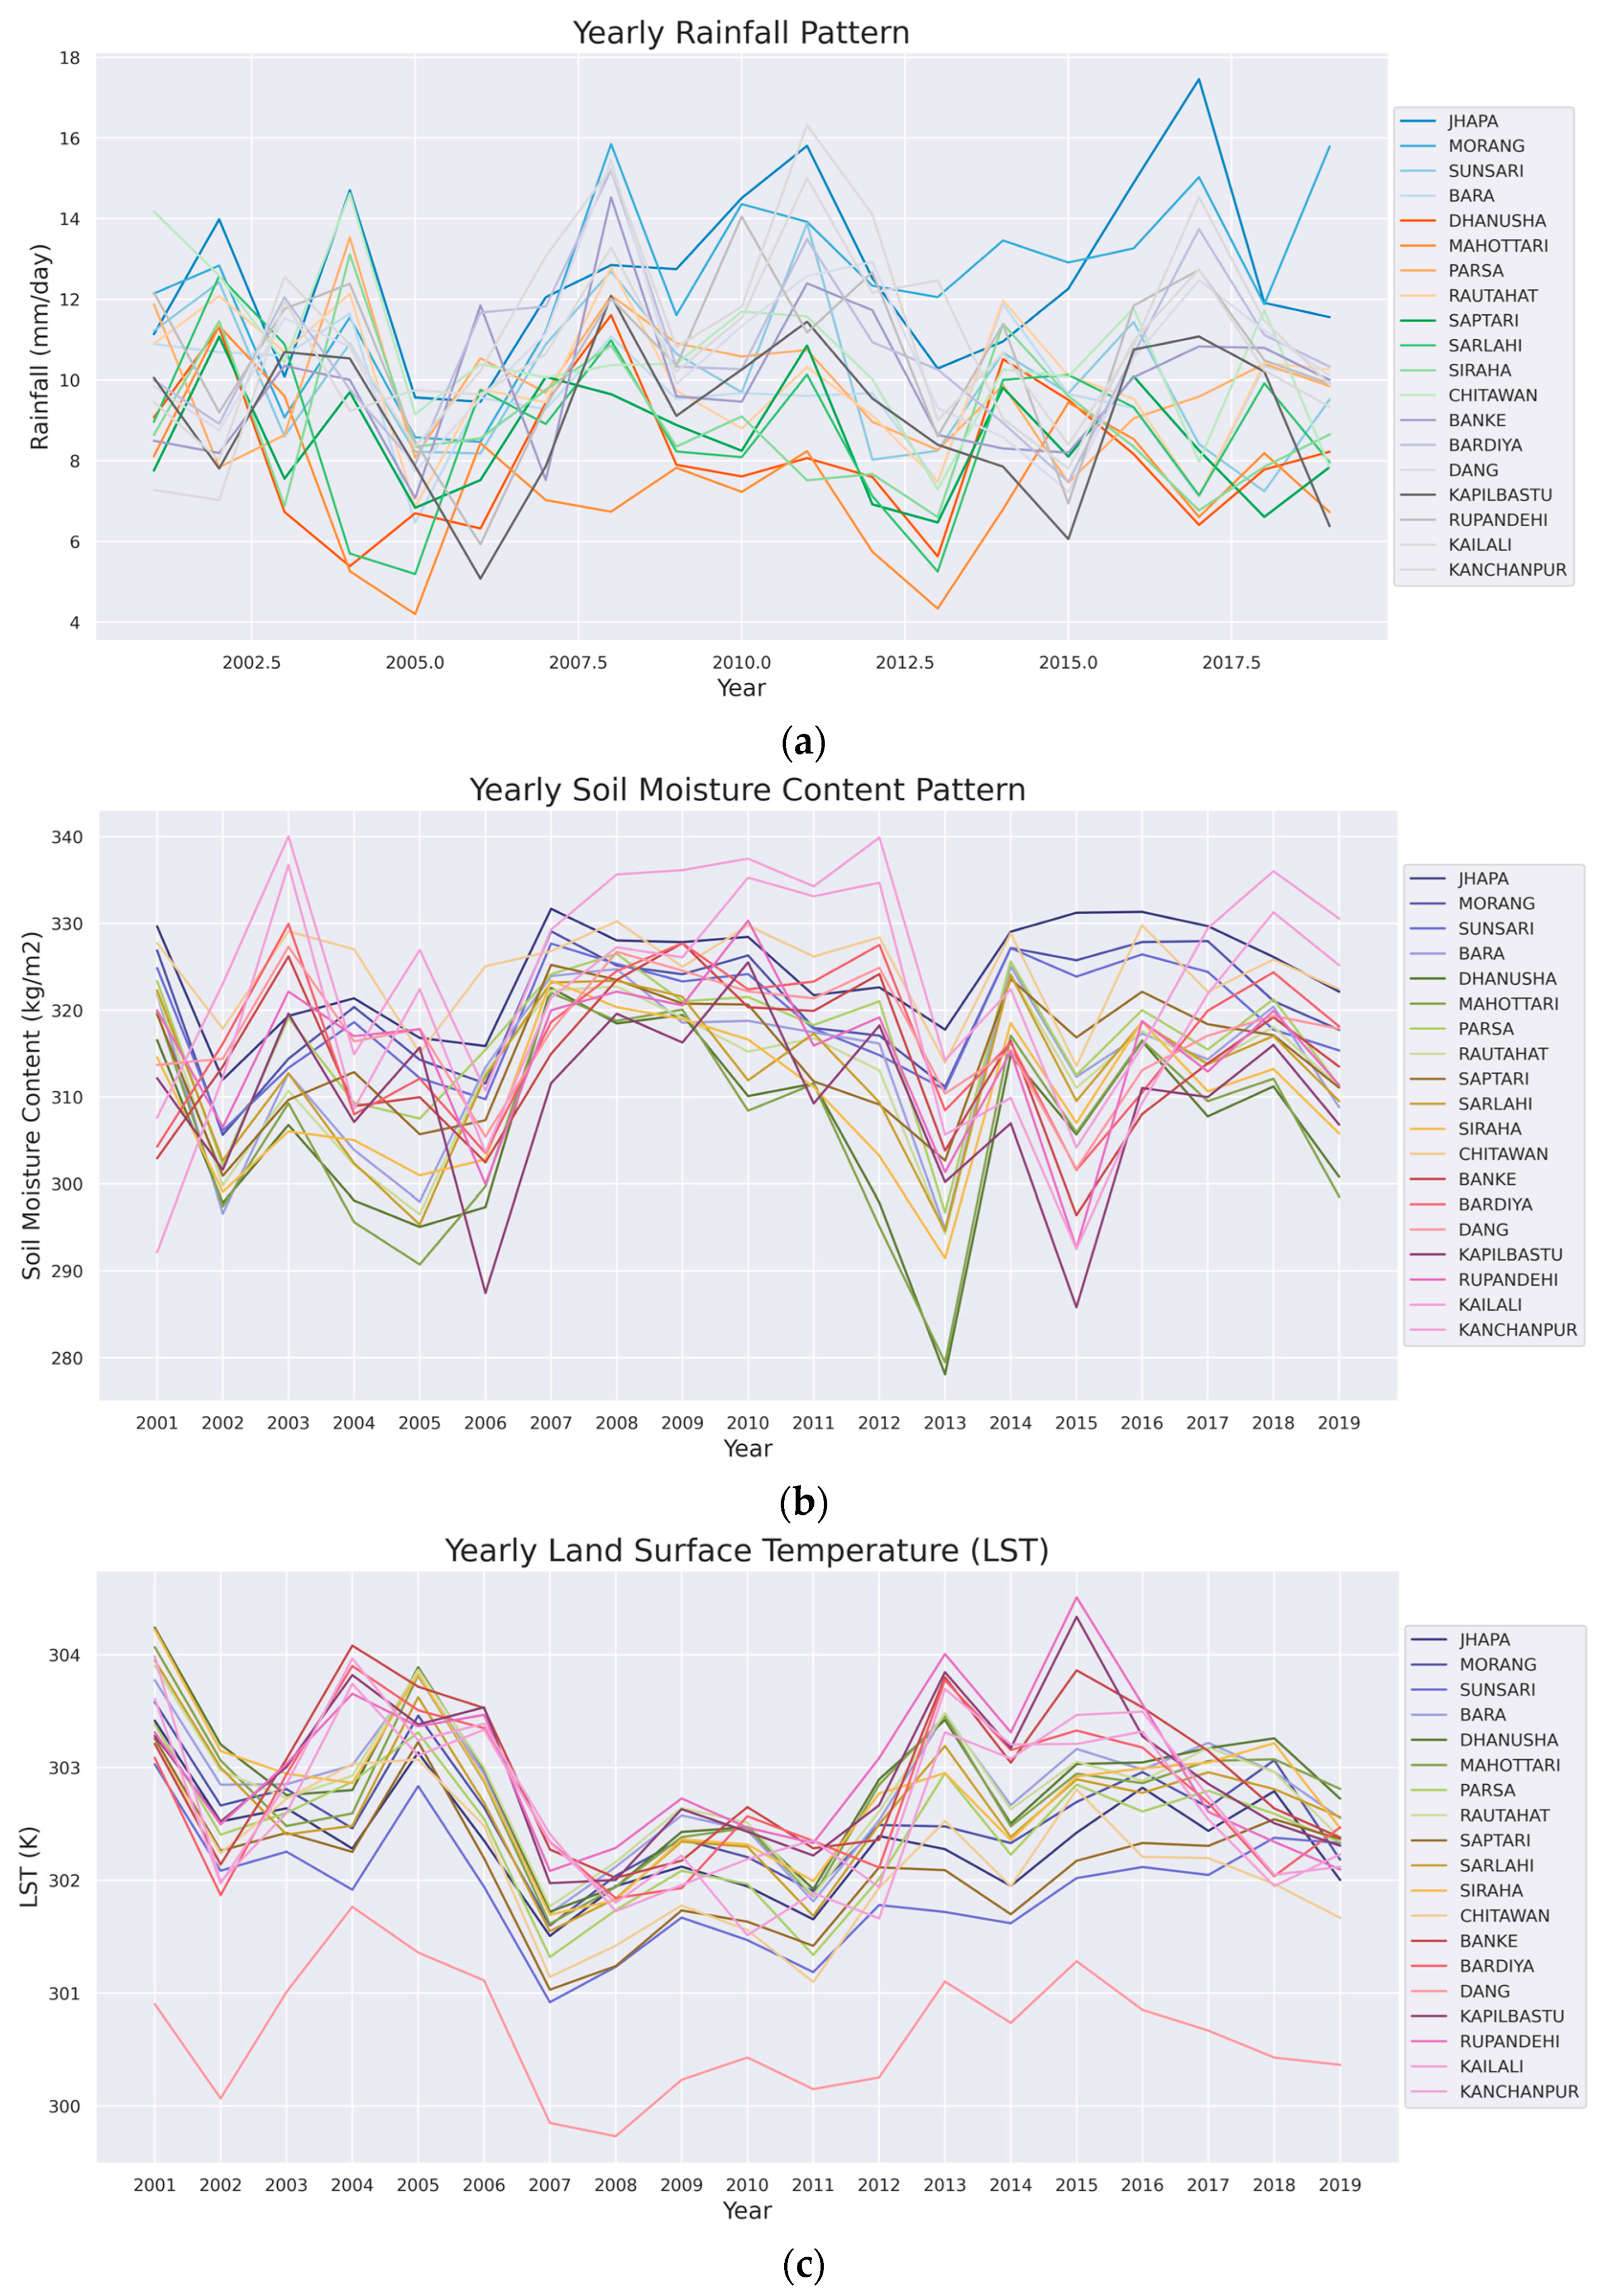
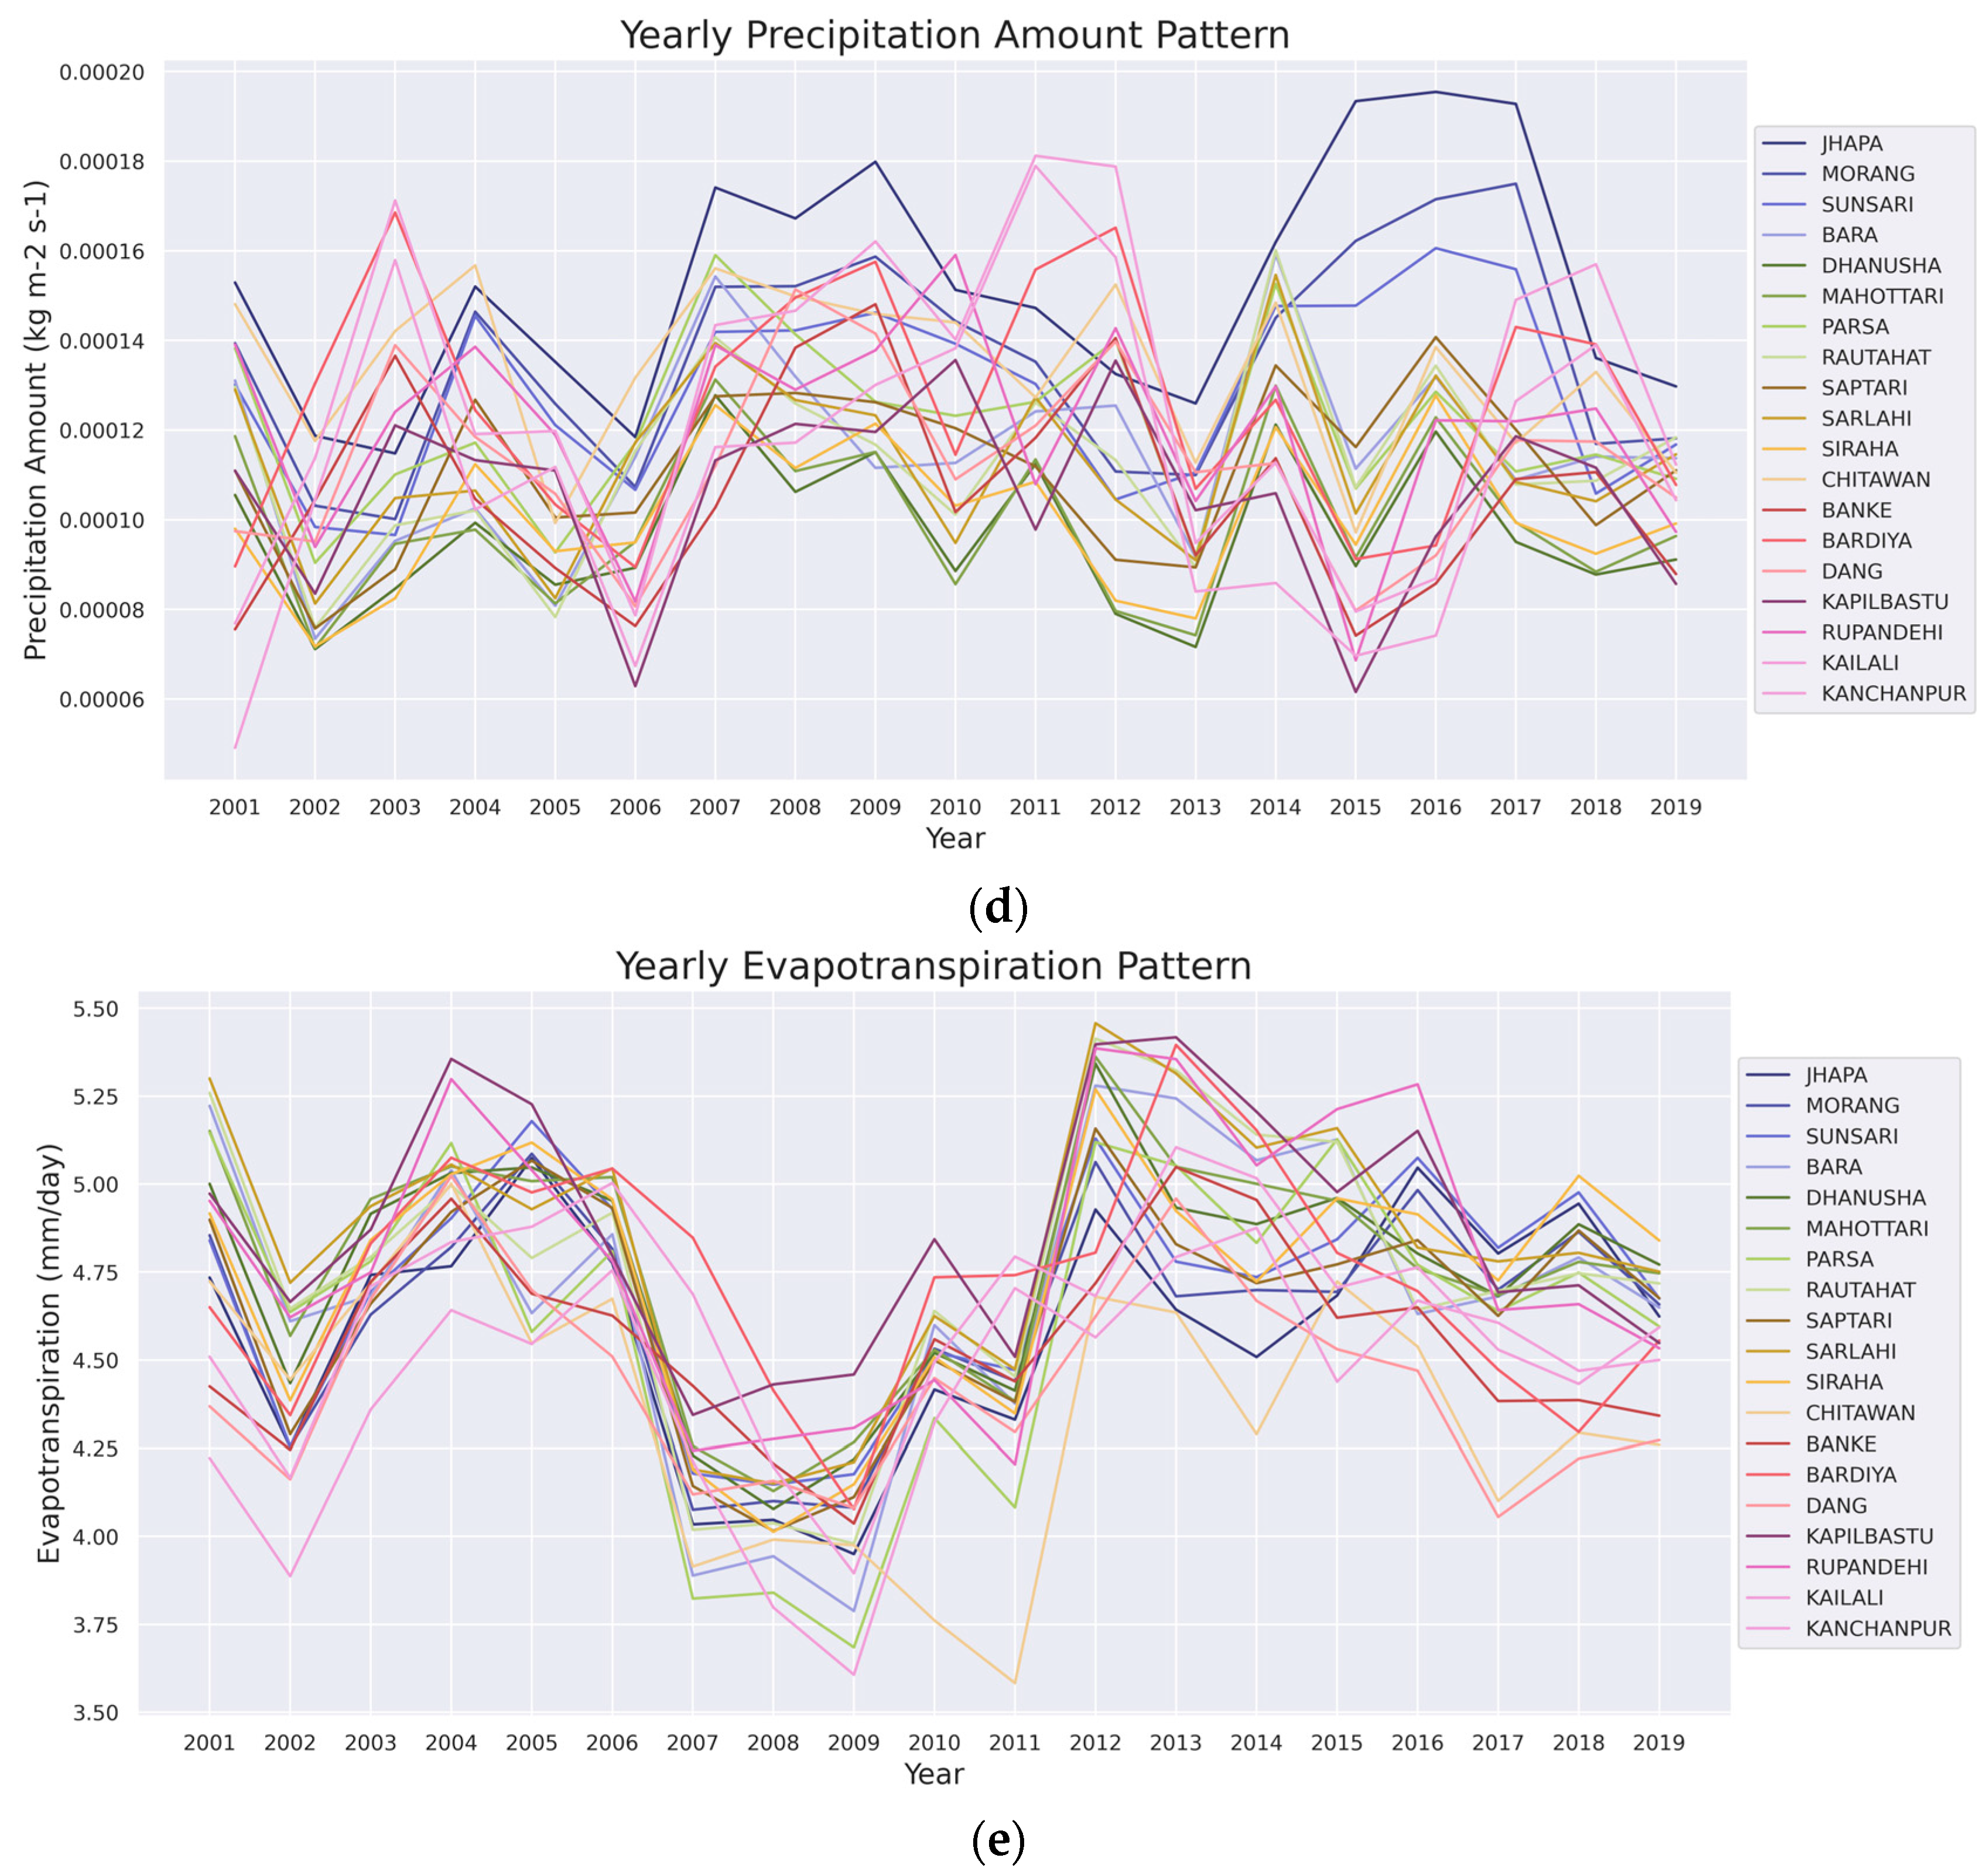
2.2.3. Auxiliary Variables
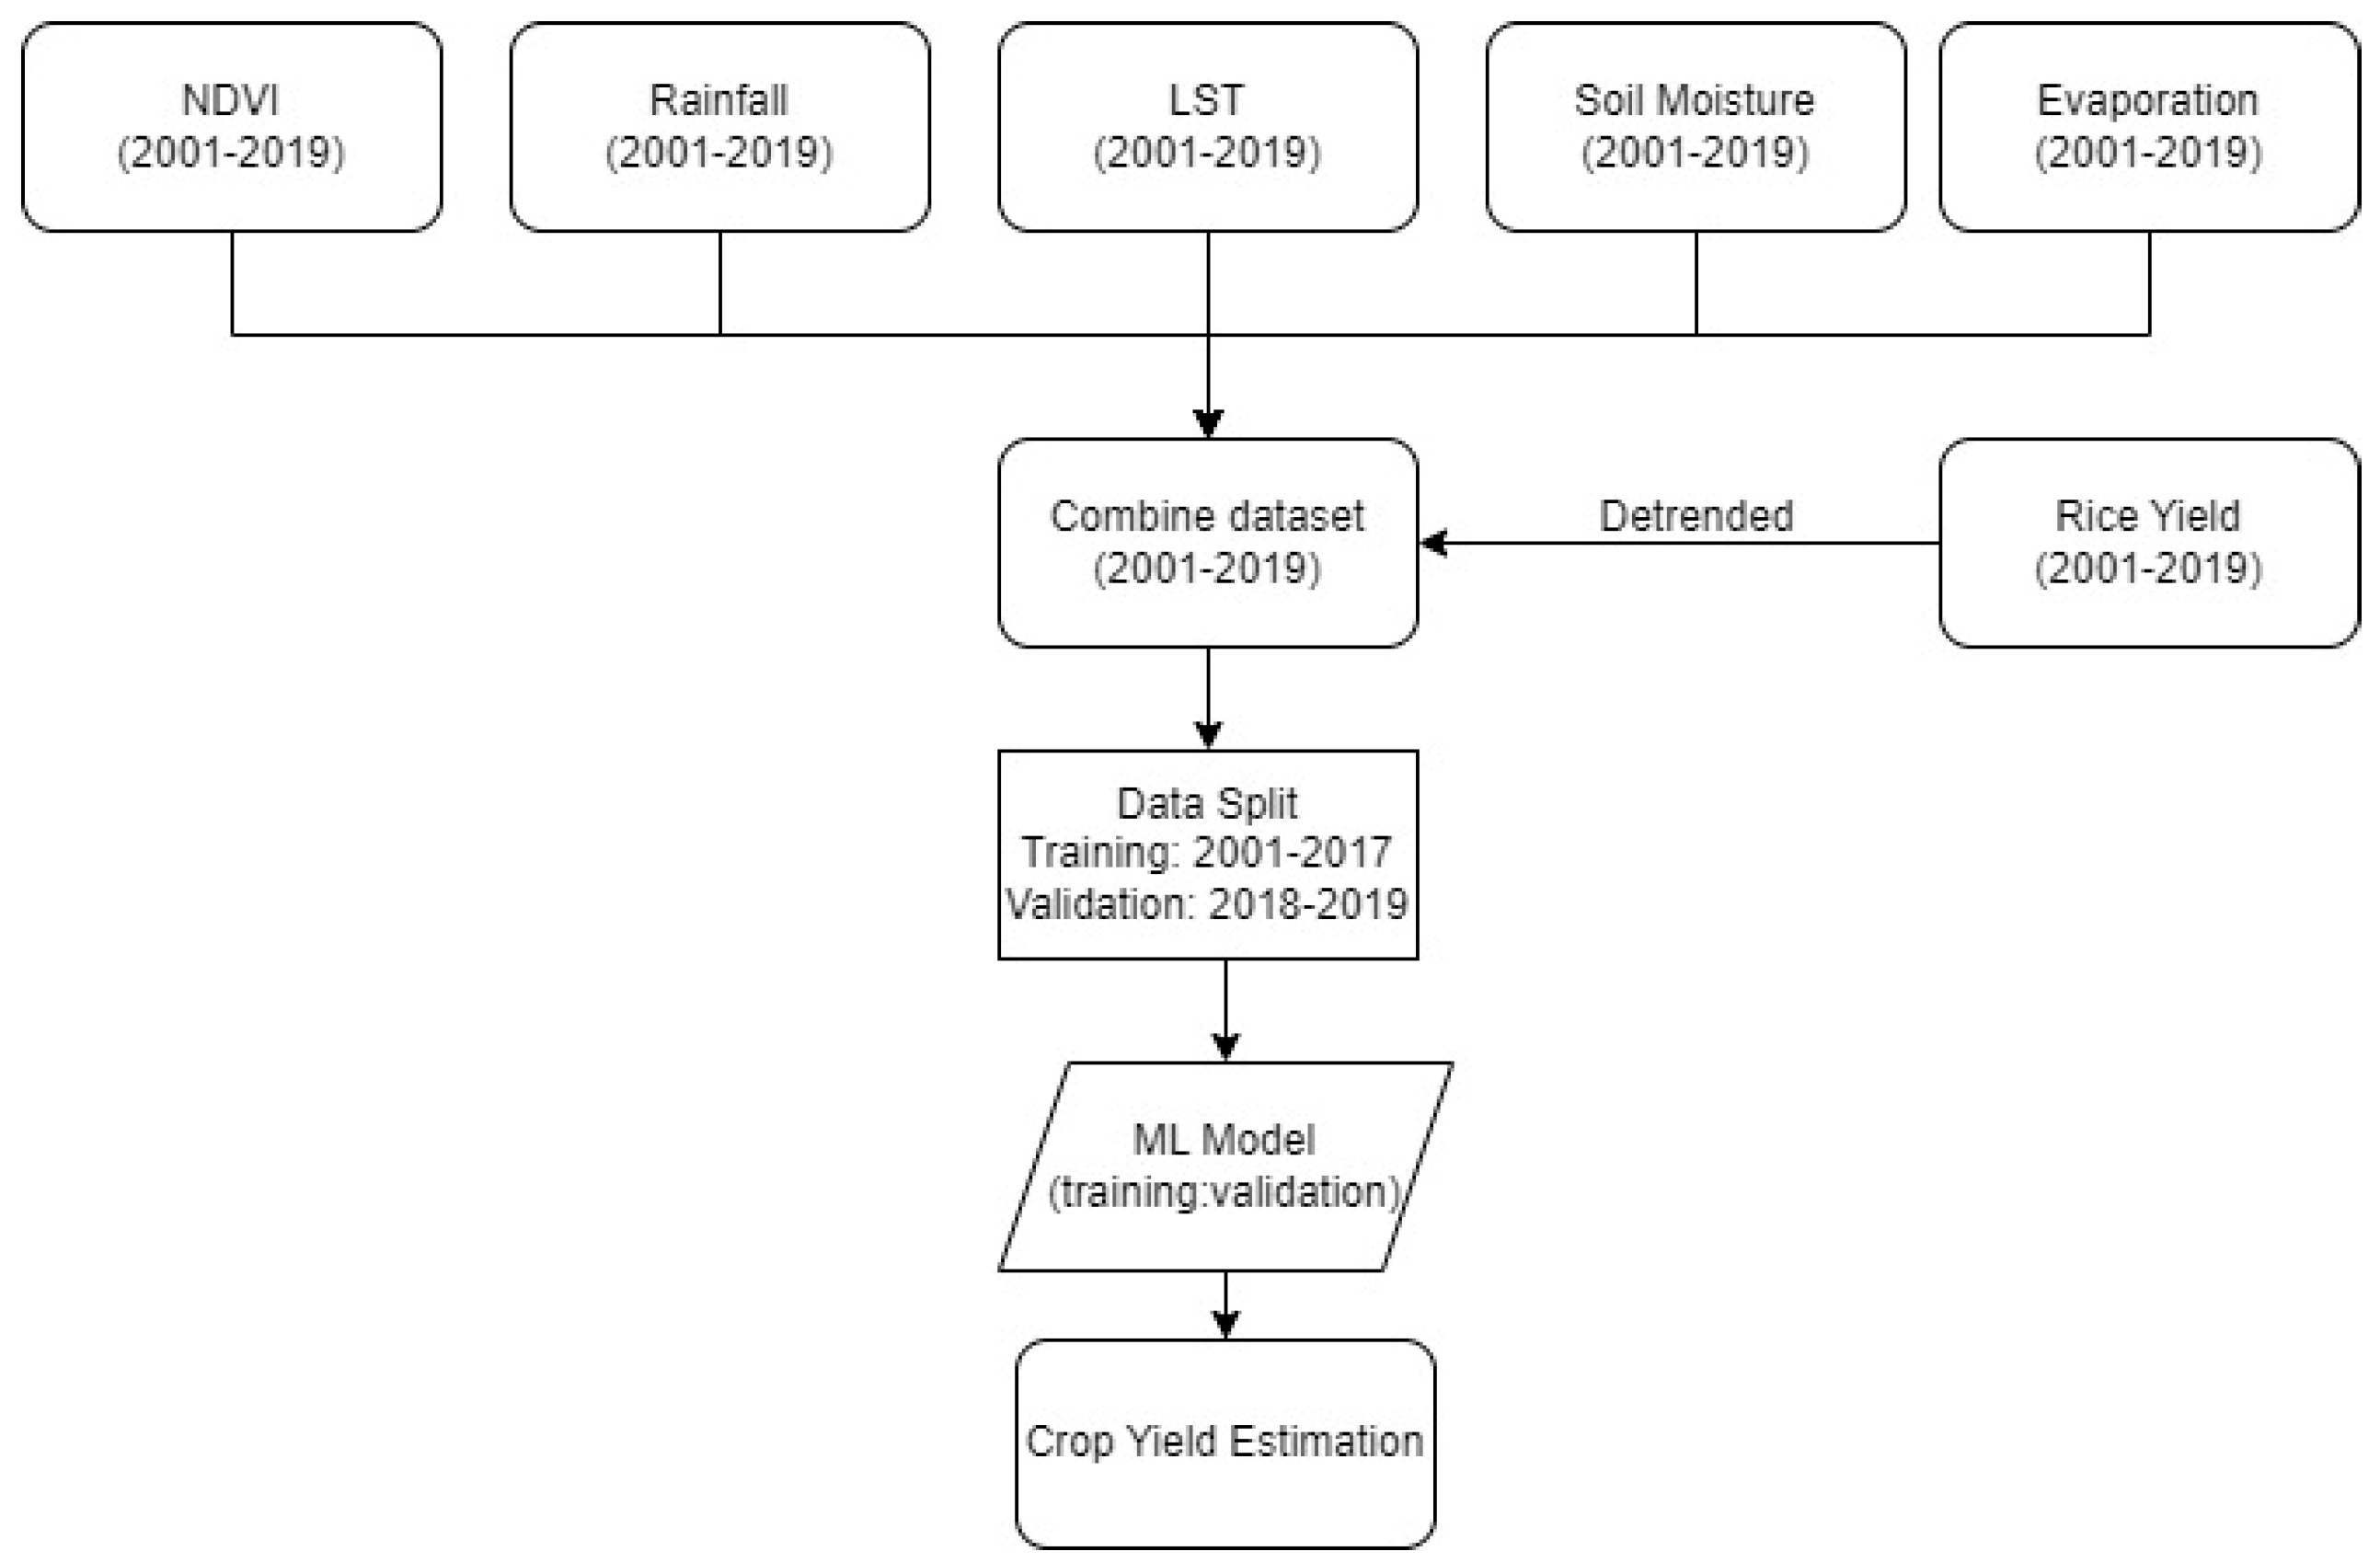
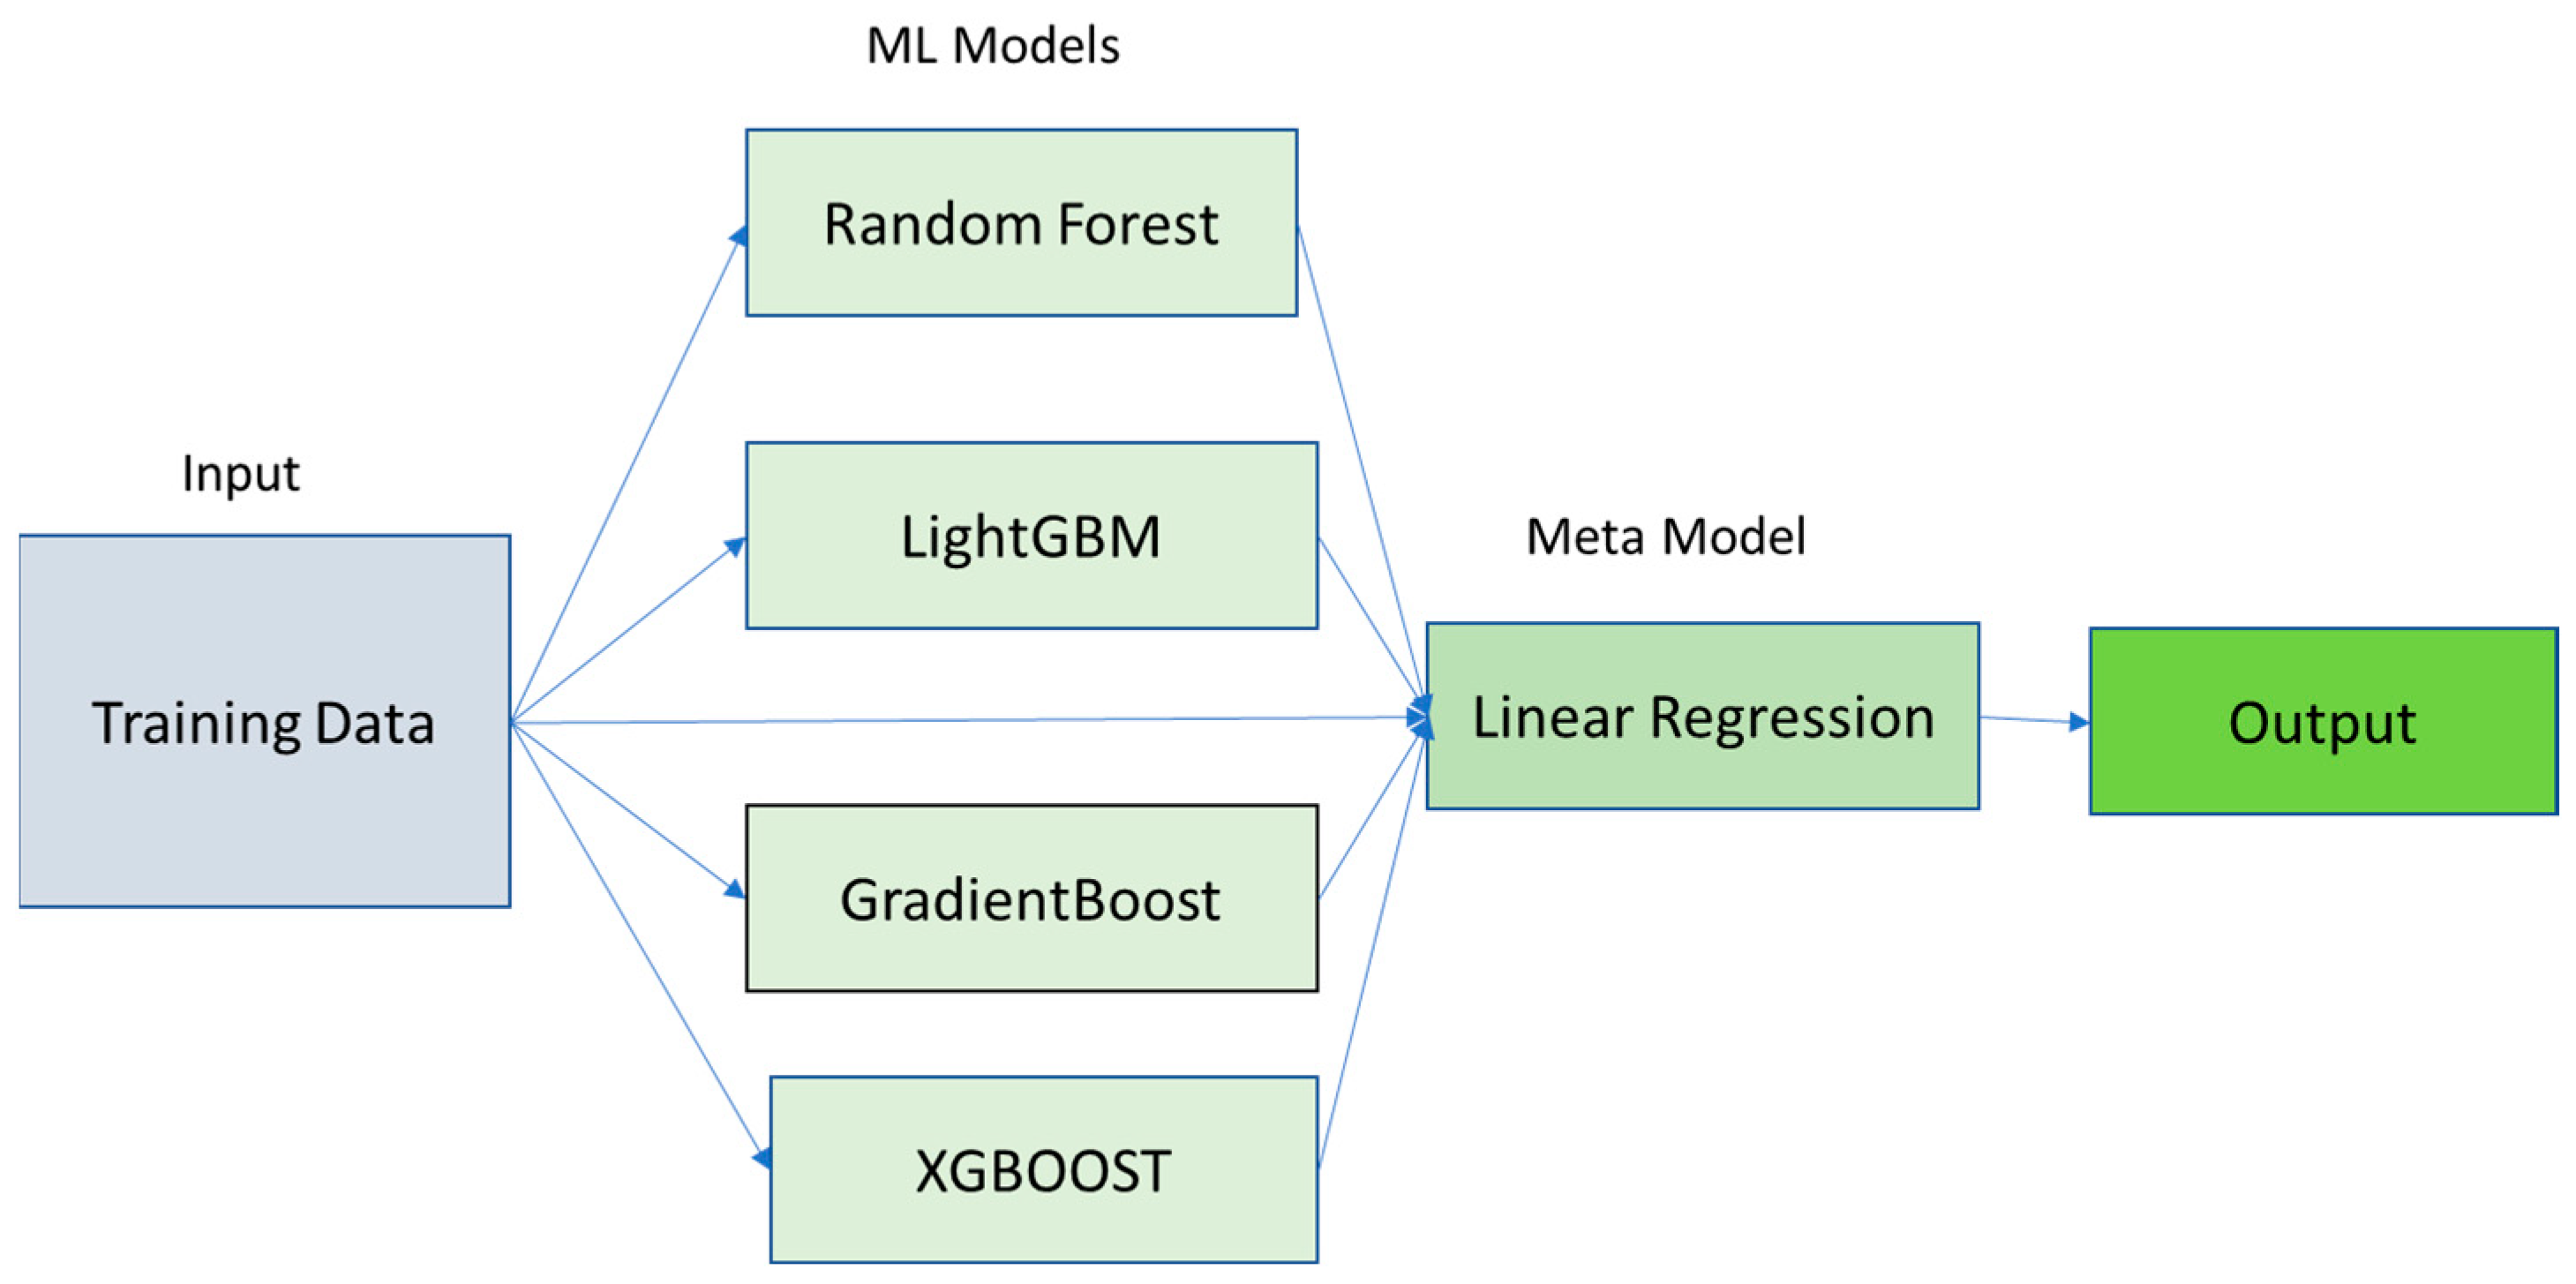
2.3. Stack-Ensemble Model
2.4. Accuracy Assessment Metrics
3. Result
4. Discussion
5. Conclusions
Author Contributions
Funding
Data Availability Statement
Conflicts of Interest
References
- Godfray, H.C.J.; Beddington, J.R.; Crute, I.R.; Haddad, L.; Lawrence, D.; Muir, J.F.; Pretty, J.; Robinson, S.; Thomas, S.M.; Toulmin, C. Food Security: The Challenge of Feeding 9 Billion People. Science 2010, 327, 812–818. [Google Scholar] [CrossRef]
- Guo, L.; Di, L.; Zhang, C.; Lin, L.; Chen, F.; Molla, A. Evaluating contributions of urbanization and global climate change to urban land surface temperature change: A case study in Lagos, Nigeria. Sci. Rep. 2022, 12, 14168. [Google Scholar] [CrossRef]
- Mosleh, M.K.; Hassan, Q.K.; Chowdhury, E.H. Application of Remote Sensors in Mapping Rice Area and Forecasting Its Production: A Review. Sensors 2015, 15, 769–791. [Google Scholar] [CrossRef]
- Tang, J.; Di, L. Past and Future Trajectories of Farmland Loss Due to Rapid Urbanization Using Landsat Imagery and the Markov-CA Model: A Case Study of Delhi, India. Remote Sens. 2019, 11, 180. [Google Scholar] [CrossRef]
- Fernandez-Beltran, R.; Baidar, T.; Kang, J.; Pla, F. Rice-Yield Prediction with Multi-Temporal Sentinel-2 Data and 3D CNN: A Case Study in Nepal. Remote Sens. 2021, 13, 1391. [Google Scholar] [CrossRef]
- Zhang, C.; Yang, Z.; Zhao, H.; Sun, Z.; Di, L.; Bindlish, R.; Liu, P.-W.; Colliander, A.; Mueller, R.; Crow, W.; et al. Crop-CASMA: A web geoprocessing and map service based architecture and implementation for serving soil moisture and crop vegetation condition data over U.S. Cropland. Int. J. Appl. Earth Obs. Geoinf. 2022, 112, 102902. [Google Scholar] [CrossRef]
- Yu, E.; Di, L.; Meyer, D.; Zhao, P.; Lin, L.; Zhang, C.; Cvejovic, S. ICroplandNet: An Open Distributed Training Dataset for Irrigated Cropland Detection. In Proceedings of the 2022 10th International Conference on Agro-Geoinformatics (Agro-Geoinformatics), Quebec City, QC, Canada, 11–14 July 2022; p. 6. [Google Scholar]
- Chalise, S.; Naranpanawa, A. Climate change adaptation in agriculture: A computable general equilibrium analysis of land-use change in Nepal. Land Use Policy 2016, 59, 241–250. [Google Scholar] [CrossRef]
- Islam, M.M.; Matsushita, S.; Noguchi, R.; Ahamed, T. Development of remote sensing-based yield prediction models at the maturity stage of boro rice using parametric and nonparametric approaches. Remote Sens. Appl. Soc. Environ. 2021, 22, 100494. [Google Scholar] [CrossRef]
- Kratoska, P.H. The Impact of the Second World War on Commercial Rice Production in Mainland South-East Asia. In Food Supplies and the Japanese Occupation in South-East Asia; Kratoska, P.H., Ed.; Studies in the Economies of East and South-East Asia; Palgrave Macmillan: London, UK, 1998; pp. 9–31. ISBN 978-1-349-26937-2. [Google Scholar]
- AR5 Synthesis Report: Climate Change 2014—IPCC. Available online: https://www.ipcc.ch/report/ar5/syr/ (accessed on 16 January 2023).
- Rosegrant, M.W.; Cai, X.; Cline, S.A. World Water and Food to 2025 Dealing with Scarcity; International Food Policy Research Institute: Washington, DC, USA, 2022. [Google Scholar]
- Li, H.; Di, L.; Zhang, C.; Lin, L.; Guo, L. Improvement of In-season Crop Mapping for Illinois Cropland Using Multiple Machine Learning Classifiers. In Proceedings of the 2022 10th International Conference on Agro-Geoinformatics (Agro-Geoinformatics), Quebec City, QC, Canada, 11–14 July 2022; pp. 1–6. [Google Scholar]
- Zhang, C.; Di, L.; Lin, L.; Li, H.; Guo, L.; Yang, Z.; Yu, E.G.; Di, Y.; Yang, A. Towards automation of in-season crop type mapping using spatiotemporal crop information and remote sensing data. Agric. Syst. 2022, 201, 103462. [Google Scholar] [CrossRef]
- Zhang, C.; Di, L.; Yang, Z.; Lin, L.; Zhao, H.; Yu, E.G. An Overview of Agriculture Cyberinformatics Tools to Support USDA NASS Decision Making. In Proceedings of the 2021 9th International Conference on Agro-Geoinformatics (Agro-Geoinformatics), Shenzhen, China, 26–29 July 2021; pp. 1–6. [Google Scholar]
- Zhao, H.; Di, L.; Sun, Z.; Hao, P.; Yu, E.; Zhang, C.; Lin, L. Impacts of Soil Moisture on Crop Health: A Remote Sensing Perspective. In Proceedings of the 2021 9th International Conference on Agro-Geoinformatics (Agro-Geoinformatics), Shenzhen, China, 26–29 July 2021; pp. 1–4. [Google Scholar]
- Yu, E.G.; Di, L.; Qamer, F.M.; Zhao, H.; Yu, Z.; Lin, L.; Zhang, C.; Cvejovic, S. Rice Modeling Using Long Time Series of High Temporal Resolution Vegetation Indices in Nepal. In Proceedings of the 2022 10th International Conference on Agro-Geoinformatics (Agro-Geoinformatics), Quebec City, QC, Canada, 11–14 July 2022; pp. 1–6. [Google Scholar]
- Zhao, H.; Di, L.; Sun, Z. WaterSmart-GIS: A Web Application of a Data Assimilation Model to Support Irrigation Research and Decision Making. ISPRS Int. J. Geo-Inf. 2022, 11, 271. [Google Scholar] [CrossRef]
- Estimation of Crop Evapotranspiration from MODIS Data by Combining Random Forest and Trapezoidal Models—ScienceDirect. Available online: https://www.sciencedirect.com/science/article/abs/pii/S0378377421005266?via%3Dihub (accessed on 16 January 2023).
- Yao, A.; Di, L. Machine Learning-based Pre-season Crop Type Mapping: A Comparative Study. In Proceedings of the 2021 9th International Conference on Agro-Geoinformatics (Agro-Geoinformatics), Shenzhen, China, 26–29 July 2021; pp. 1–4. [Google Scholar]
- Rahman, A.; Roytman, L.; Krakauer, N.Y.; Nizamuddin, M.; Goldberg, M. Use of Vegetation Health Data for Estimation of Aus Rice Yield in Bangladesh. Sensors 2009, 9, 2968–2975. [Google Scholar] [CrossRef]
- Liang, L.; Di, L.; Zhang, L.; Deng, M.; Qin, Z.; Zhao, S.; Lin, H. Estimation of crop LAI using hyperspectral vegetation indices and a hybrid inversion method. Remote Sens. Environ. 2015, 165, 123–134. [Google Scholar] [CrossRef]
- Di, L.; Rundquist, D.C.; Han, L. Modelling relationships between NDVI and precipitation during vegetative growth cycles. Int. J. Remote Sens. 1994, 15, 2121–2136. [Google Scholar] [CrossRef]
- Son, N.-T.; Chen, C.-F.; Chen, C.-R.; Guo, H.-Y.; Cheng, Y.-S.; Chen, S.-L.; Lin, H.-S.; Chen, S.-H. Machine learning approaches for rice crop yield predictions using time-series satellite data in Taiwan. Int. J. Remote Sens. 2020, 41, 7868–7888. [Google Scholar] [CrossRef]
- Dubey, S.K.; Gavli, A.S.; Yadav, S.K.; Sehgal, S.; Ray, S.S. Remote Sensing-Based Yield Forecasting for Sugarcane (Saccharum officinarum L.) Crop in India. J. Indian Soc. Remote Sens. 2018, 46, 1823–1833. [Google Scholar] [CrossRef]
- Palakuru, M.; Yarrakula, K. Study on paddy phenomics ecosystem and yield estimation using space-borne multi sensor remote sensing data. J. Agrometeorol. 2019, 21, 171–175. [Google Scholar] [CrossRef]
- Rahman, A.; Khan, K.; Krakauer, N.Y.; Roytman, L.; Kogan, F. Use of Remote Sensing Data for Estimation of Aman Rice Yield. Int. J. Agric. For. 2012, 2, 101–107. [Google Scholar] [CrossRef]
- Sonobe, R.; Miura, Y.; Sano, T.; Horie, H. Estimating leaf carotenoid contents of shade-grown tea using hyperspectral indices and PROSPECT–D inversion. Int. J. Remote Sens. 2018, 39, 1306–1320. [Google Scholar] [CrossRef]
- Gandhi, N.; Petkar, O.; Armstrong, L.J. Rice crop yield prediction using artificial neural networks. In Proceedings of the 2016 IEEE Technological Innovations in ICT for Agriculture and Rural Development (TIAR), Chennai, India, 15–16 July 2016; pp. 105–110. [Google Scholar]
- Chandra, A.; Mitra, P.; Dubey, S.K.; Ray, S.S. Machine Learning Approach for Kharif Rice Yield Prediction Integrating Multi-Temporal Vegetation Indices and Weather and Non-Weather Variables. ISPRS—Int. Arch. Photogramm. Remote Sens. Spat. Inf. Sci. 2019, 423, 187–194. [Google Scholar] [CrossRef]
- Guruprasad, R.B.; Saurav, K.; Randhawa, S. Machine Learning Methodologies for Paddy Yield Estimation in India: A Case Study. In Proceedings of the IGARSS 2019—2019 IEEE International Geoscience and Remote Sensing Symposium, Yokohama, Japan, 28 July–2 August 2019; pp. 7254–7257. [Google Scholar]
- Aghighi, H.; Azadbakht, M.; Ashourloo, D.; Shahrabi, H.S.; Radiom, S. Machine Learning Regression Techniques for the Silage Maize Yield Prediction Using Time-Series Images of Landsat 8 OLI. IEEE J. Sel. Top. Appl. Earth Obs. Remote Sens. 2018, 11, 4563–4577. [Google Scholar] [CrossRef]
- Islam, M.D.; Chakraborty, T.; Alam, M.S.; Islam, K.S. Urban heat island effect analysis using integrated geospatial techniques: A case study on Khulna city, Bangladesh. In Proceedings of the International Conference on Climate Change, Dhaka, Bangladesh, 8–11 January 2019. [Google Scholar]
- Islam, M.D.; Li, B.; Islam, K.S.; Ahasan, R.; Mia, M.R.; Haque, M.E. Airbnb rental price modeling based on Latent Dirichlet Allocation and MESF-XGBoost composite model. Mach. Learn. Appl. 2022, 7, 100208. [Google Scholar] [CrossRef]
- Bappa, S.A.; Malaker, T.; Mia, M.R.; Islam, M.D. Spatio-temporal variation of land use and land cover changes and their impact on land surface temperature: A case of Kutupalong Refugee Camp, Bangladesh. Heliyon 2022, 8, e10449. [Google Scholar] [CrossRef]
- Islam, M.D.; Di, L.; Mia, M.R.; Sithi, M.S. Deforestation Mapping of Sundarbans Using Multi-Temporal Sentinel-2 Data & Transfer Learning. In Proceedings of the 2022 10th International Conference on Agro-geoinformatics (Agro-Geoinformatics), Quebec City, QC, Canada, 11–14 July 2022; pp. 1–4. [Google Scholar]
- O’Shea, K.; LaRoe, J.; Vorster, A.; Young, N.; Evangelista, P.; Mayer, T.; Carver, D.; Simonson, E.; Martin, V.; Radomski, P.; et al. Improved Remote Sensing Methods to Detect Northern Wild Rice (Zizania palustris L.). Remote Sens. 2020, 12, 3023. [Google Scholar] [CrossRef]
- Islam, M.D.; Islam, K.S.; Ahasan, R.; Mia, M.R.; Haque, M.E. A data-driven machine learning-based approach for urban land cover change modeling: A case of Khulna City Corporation area. Remote Sens. Appl. Soc. Environ. 2021, 24, 100634. [Google Scholar] [CrossRef]
- Sun, J.; Di, L.; Sun, Z.; Shen, Y.; Lai, Z. County-Level Soybean Yield Prediction Using Deep CNN-LSTM Model. Sensors 2019, 19, 4363. [Google Scholar] [CrossRef]
- Islam, M.D.; Li, B.; Lee, C.; Wang, X. Incorporating spatial information in machine learning: The Moran eigenvector spatial filter approach. Trans. GIS 2022, 26, 902–922. [Google Scholar] [CrossRef]
- Sun, J.; Lai, Z.; Di, L.; Sun, Z.; Tao, J.; Shen, Y. Multilevel Deep Learning Network for County-Level Corn Yield Estimation in the U.S. Corn Belt. IEEE J. Sel. Top. Appl. Earth Obs. Remote Sens. 2020, 13, 5048–5060. [Google Scholar] [CrossRef]
- Shrestha, R.; Di, L.; Yu, E.G.; Kang, L.; Shao, Y.; Bai, Y. Regression model to estimate flood impact on corn yield using MODIS NDVI and USDA cropland data layer. J. Integr. Agric. 2017, 16, 398–407. [Google Scholar] [CrossRef]
- Jeong, S.; Ko, J.; Shin, T.; Yeom, J. Incorporation of machine learning and deep neural network approaches into a remote sensing-integrated crop model for the simulation of rice growth. Sci. Rep. 2022, 12, 9030. [Google Scholar] [CrossRef]
- Chen, T.; Guestrin, C. XGBoost: A Scalable Tree Boosting System. In Proceedings of the Proceedings of the 22nd ACM SIGKDD International Conference on Knowledge Discovery and Data Mining, San Francisco, CA, USA, 13–17 August 2016; Association for Computing Machinery: New York, NY, USA, 2016; pp. 785–794. [Google Scholar]
- Ke, G.; Meng, Q.; Finley, T.; Wang, T.; Chen, W.; Ma, W.; Ye, Q.; Liu, T.-Y. LightGBM: A Highly Efficient Gradient Boosting Decision Tree. In Advances in Neural Information Processing Systems; Curran Associates, Inc.: Dutchess County, NY, USA, 2017; Volume 30. [Google Scholar]
- Friedman, J.H. Greedy function approximation: A gradient boosting machine. Ann. Stat. 2001, 29, 1189–1232. [Google Scholar] [CrossRef]
- Breiman, L. Classification and Regression Trees; Routledge: New York, NY, USA, 2017; ISBN 978-1-315-13947-0. [Google Scholar]
- Lu, J.; Carbone, G.J.; Gao, P. Detrending crop yield data for spatial visualization of drought impacts in the United States, 1895–2014. Agric. For. Meteorol. 2017, 237–238, 196–208. [Google Scholar] [CrossRef]


| Models | Average RMSE | Average MAE |
|---|---|---|
| NDVI vs. Yield | ||
| LR | 685.17 | 636.83 |
| RF | 556.19 | 507.45 |
| Gradient Boost | 575.03 | 562.04 |
| LightGBM | 545.85 | 502.08 |
| XGBoost | 552.27 | 507.02 |
| Stack Ensemble | 451.05 | 425.35 |
| NDVI + Auxiliary Variables vs. Yield | ||
| LR | 550.94 | 514.50 |
| RF | 361.52 | 337.19 |
| Gradient Boost | 372.03 | 359.04 |
| LightGBM | 356.85 | 334.55 |
| XGBoost | 355.90 | 333.12 |
| Stack Ensemble | 328.06 | 317.21 |
| District | Yield 2018 | Predicted Yield 2018 | Percentage of Error 2018 (%) | Yield 2019 | Predicted Yield 2019 | Percentage of Error 2019 (%) | RMSE | MAE |
|---|---|---|---|---|---|---|---|---|
| JHAPA | 4260 | 4144 | 2.7 | 4403 | 4203 | 4.5 | 163.62 | 158.08 |
| MORANG | 4140 | 3931 | 5.05 | 4237 | 3953 | 6.7 | 248.96 | 246.08 |
| SUNSARI | 3980 | 3574 | 10.20 | 3987 | 3656 | 8.3 | 370.41 | 368.55 |
| BARA | 4060 | 3773 | 7.0 | 4137 | 3928 | 5.1 | 251.22 | 248.20 |
| DHANUSHA | 3980 | 3654 | 8.2 | 3983 | 3501 | 12.1 | 411.30 | 403.83 |
| MAHOTTARI | 3460 | 3179 | 8.1 | 3474 | 2937 | 15.4 | 428.44 | 408.79 |
| PARSA | 4110 | 3994 | 2.8 | 4134 | 3997 | 3.3 | 126.61 | 126.17 |
| RAUTAHAT | 3410 | 3191 | 6.4 | 3443 | 3024 | 12.17 | 334.25 | 318.90 |
| SAPTARI | 3520 | 3073 | 12.7 | 3564 | 3119 | 12.5 | 445.77 | 445.77 |
| SARLAHI | 3520 | 3068 | 12.8 | 3564 | 3104 | 12.9 | 455.45 | 455.43 |
| SIRAHA | 3430 | 3078 | 10.2 | 3515 | 2744 | 21.9 | 599.29 | 561.04 |
| CHITAWAN | 3970 | 3676 | 7.4 | 4002 | 3755 | 6.17 | 270.75 | 269.74 |
| BANKE | 3150 | 2959 | 6.1 | 3476 | 3134 | 9.83 | 276.56 | 266.07 |
| BARDIYA | 4310 | 4204 | 2.5 | 4300 | 3989 | 7.23 | 232.49 | 208.37 |
| DANG | 4180 | 4120 | 1.4 | 4188 | 4281 | 2.2 | 78.40 | 76.45 |
| KAPILBASTU | 3540 | 3517 | 0.6 | 3511 | 3188 | 9.2 | 228.34 | 172.50 |
| RUPANDEHI | 4150 | 4474 | 7.8 | 4145 | 4542 | 9.5 | 362.59 | 360.79 |
| KAILALI | 4160 | 3803 | 8.5 | 4270 | 3671 | 14.0 | 492.81 | 477.64 |
| KANCHANPUR | 3880 | 3388 | 12.68 | 3893 | 3476 | 10.71 | 456.02 | 454.50 |
Disclaimer/Publisher’s Note: The statements, opinions and data contained in all publications are solely those of the individual author(s) and contributor(s) and not of MDPI and/or the editor(s). MDPI and/or the editor(s) disclaim responsibility for any injury to people or property resulting from any ideas, methods, instructions or products referred to in the content. |
© 2023 by the authors. Licensee MDPI, Basel, Switzerland. This article is an open access article distributed under the terms and conditions of the Creative Commons Attribution (CC BY) license (https://creativecommons.org/licenses/by/4.0/).
Share and Cite
Islam, M.D.; Di, L.; Qamer, F.M.; Shrestha, S.; Guo, L.; Lin, L.; Mayer, T.J.; Phalke, A.R. Rapid Rice Yield Estimation Using Integrated Remote Sensing and Meteorological Data and Machine Learning. Remote Sens. 2023, 15, 2374. https://doi.org/10.3390/rs15092374
Islam MD, Di L, Qamer FM, Shrestha S, Guo L, Lin L, Mayer TJ, Phalke AR. Rapid Rice Yield Estimation Using Integrated Remote Sensing and Meteorological Data and Machine Learning. Remote Sensing. 2023; 15(9):2374. https://doi.org/10.3390/rs15092374
Chicago/Turabian StyleIslam, Md Didarul, Liping Di, Faisal Mueen Qamer, Sravan Shrestha, Liying Guo, Li Lin, Timothy J. Mayer, and Aparna R. Phalke. 2023. "Rapid Rice Yield Estimation Using Integrated Remote Sensing and Meteorological Data and Machine Learning" Remote Sensing 15, no. 9: 2374. https://doi.org/10.3390/rs15092374
APA StyleIslam, M. D., Di, L., Qamer, F. M., Shrestha, S., Guo, L., Lin, L., Mayer, T. J., & Phalke, A. R. (2023). Rapid Rice Yield Estimation Using Integrated Remote Sensing and Meteorological Data and Machine Learning. Remote Sensing, 15(9), 2374. https://doi.org/10.3390/rs15092374