


River Bars and Vegetation Dynamics in Response to Upstream Damming: A Case Study of the Middle Yangtze River


Abstract
1. Introduction
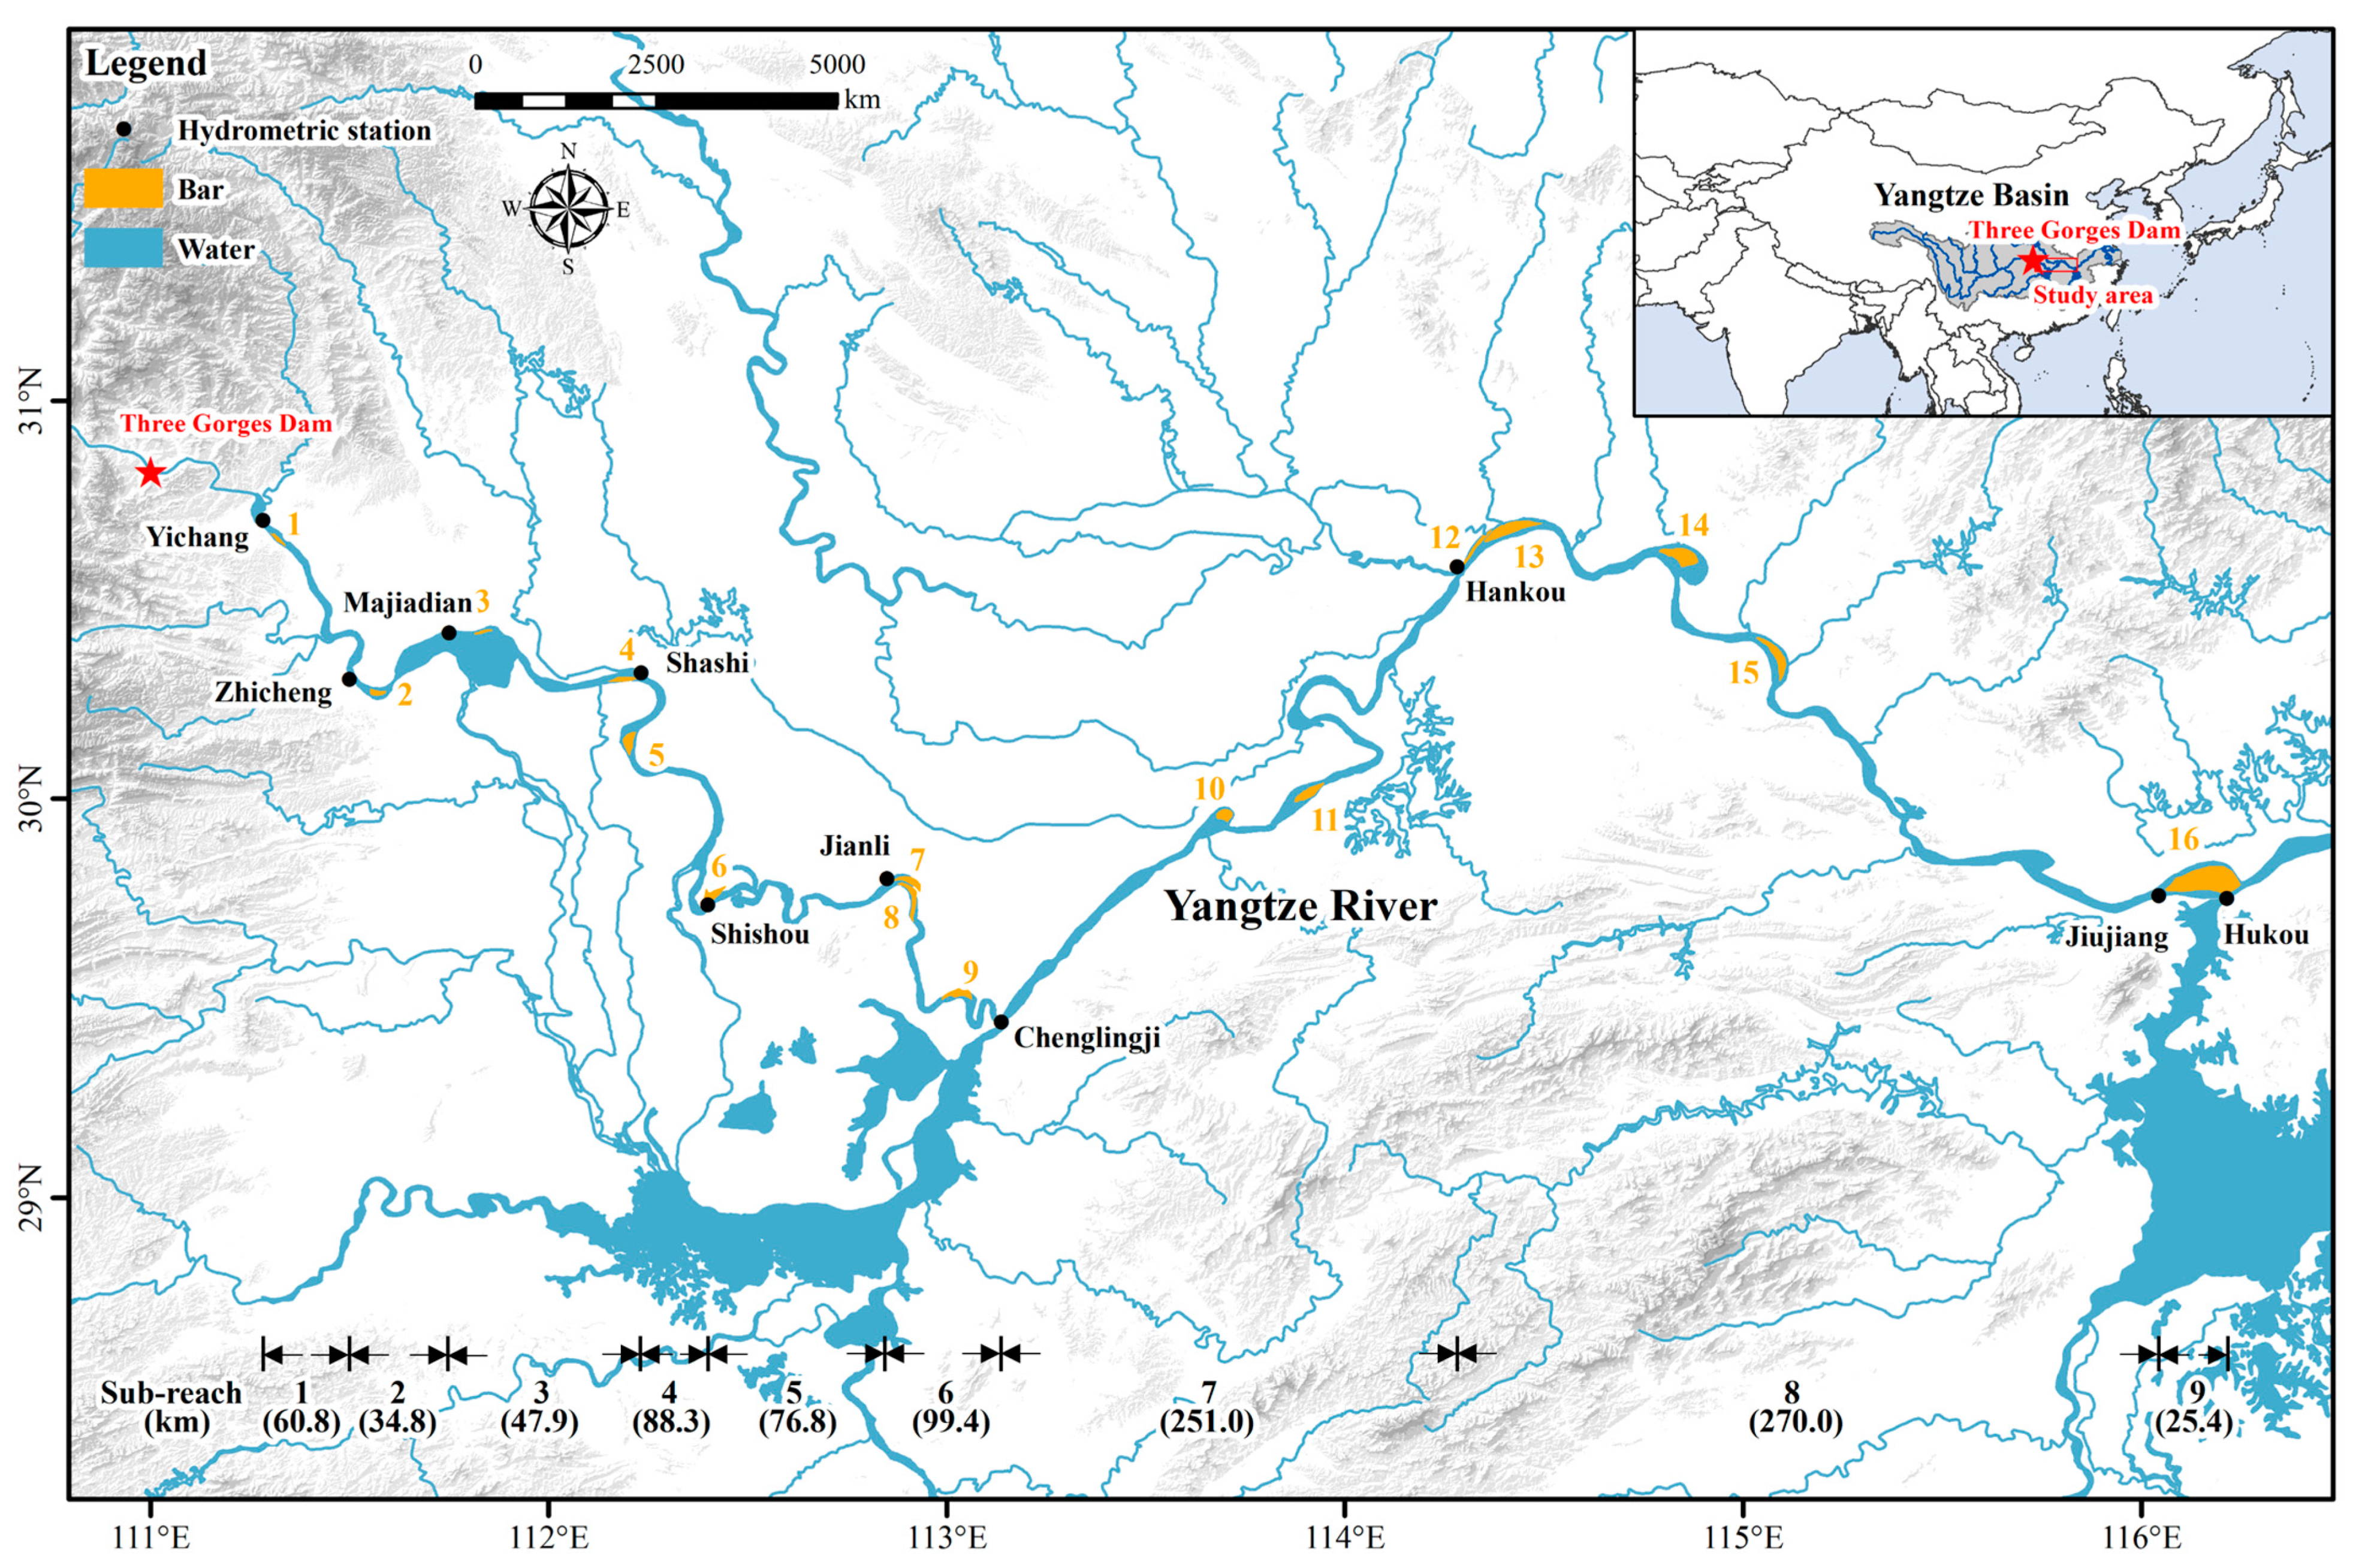
2. Study Area
3. Materials and Methods
3.1. Data Sources
3.2. Machine-Learning-Based Leaf Area Index Inversion Model
3.2.1. Preprocessing of Satellite Imagery
3.2.2. ML-Based LAI Inversion Model
3.3. Sediment Balance Method
4. Results
4.1. Variations in River Bar and Vegetation Areas
4.2. Variations in Vegetation Distribution and Leaf Area Index
5. Discussion
5.1. Hydrodynamic Changes
5.1.1. Alteration in Annual Flow Process
5.1.2. Alteration in Bar Submergence Frequency
5.2. Geomorphic Changes
5.2.1. Adjustment of Bar and Channel Erosion Distribution
5.2.2. Adjustment of Cross-Sectional and Longitudinal Profiles
5.2.3. Adjustment of Hydraulic Geometry
5.3. Broader Implications
6. Conclusions
Author Contributions
Funding
Data Availability Statement
Conflicts of Interest
References
- Wu, Q.; Ke, L.; Wang, J.; Pavelsky, T.M.; Allen, G.H.; Sheng, Y.; Duan, X.; Zhu, Y.; Wu, J.; Wang, L.; et al. Satellites reveal hotspots of global river extent change. Nat. Commun. 2023, 14, 1587. [Google Scholar] [CrossRef]
- Marcarelli, A.M.; Kirk, R.W.V.; Baxter, C.V. Predicting effects of hydrologic alteration and climate change on ecosystem metabolism in a western US river. Ecol. Appl. 2010, 20, 2081–2088. [Google Scholar] [CrossRef] [PubMed]
- Siam, M.S.; Eltahir, E.A. Climate change enhances interannual variability of the Nile river flow. Nat. Clim. Chang. 2017, 7, 350–354. [Google Scholar] [CrossRef]
- Chen, W.; Olden, J.D. Designing flows to resolve human and environmental water needs in a dam-regulated river. Nat. Commun. 2017, 8, 2158. [Google Scholar] [CrossRef] [PubMed]
- Li, D.; Lu, X.; Walling, D.E.; Zhang, T.; Steiner, J.F.; Wasson, R.J.; Harrison, S.; Nepal, S.; Nie, Y.; Immerzeel, W.W.; et al. High Mountain Asia hydropower systems threatened by climate-driven landscape instability. Nat. Geosci. 2022, 15, 520–530. [Google Scholar] [CrossRef]
- Ma, H.; Nittrouer, J.A.; Fu, X.; Parker, G.; Zhang, Y.; Wang, Y.; Wang, Y.; Lamb, M.P.; Cisneros, J.; Best, J.; et al. Amplification of downstream flood stage due to damming of fine-grained rivers. Nat. Commun. 2022, 13, 3054. [Google Scholar] [CrossRef] [PubMed]
- Li, D.; Lu, X.X.; Yang, X.; Chen, L.; Lin, L. Sediment load responses to climate variation and cascade reservoirs in the Yangtze River: A case study of the Jinsha River. Geomorphology 2018, 322, 41–52. [Google Scholar] [CrossRef]
- Zhou, Y.; Li, D.; Lu, J.; Yao, S.; Yan, X.; Jin, Z.; Liu, L.; Lu, X.X. Distinguishing the multiple controls on the decreased sediment flux in the Jialing River basin of the Yangtze River, Southwestern China. Catena 2020, 193, 104593. [Google Scholar] [CrossRef]
- Hu, Y.; Li, D.; Deng, J.; Yue, Y.; Zhou, J.; Chai, Y.; Li, Y. Mechanisms Controlling Water-Level Variations in the Middle Yangtze River Following the Operation of the Three Gorges Dam. Water Resour. Res. 2022, 58, e2022WR032338. [Google Scholar] [CrossRef]
- Best, J. Anthropogenic stresses on the world’s big rivers. Nat. Geosci. 2019, 12, 7–21. [Google Scholar] [CrossRef]
- Syvitski, J.; Ángel, J.R.; Saito, Y.; Overeem, I.; Vörösmarty, C.J.; Wang, H.; Olago, D. Earth’s sediment cycle during the Anthropocene. Nat. Rev. Earth Environ. 2022, 3, 179–196. [Google Scholar] [CrossRef]
- Hu, Y.; Deng, J.; Li, Y.; Liu, C.; He, Z. Flow resistance adjustments of channel and bars in the middle reaches of the Yangtze River in response to the operation of the Three Gorges Dam. J. Geogr. Sci. 2022, 32, 2013–2035. [Google Scholar] [CrossRef]
- Viles, H.A.; Naylor, L.A.; Carter, N.E.A.; Chaput, D. Biogeomorphological disturbance regimes: Progress in linking ecological and geomorphological systems. Earth Sur. Process. Landf. 2008, 33, 1419–1435. [Google Scholar] [CrossRef]
- Chai, Y.; Yang, Y.; Deng, J.; Sun, Z.; Li, Y.; Zhu, L. Evolution characteristics and drivers of the water level at an identical discharge in the Jingjiang reaches of the Yangtze River. J. Geogr. Sci. 2020, 30, 1633–1648. [Google Scholar] [CrossRef]
- Gierszewski, P.J.; Habel, M.; Szmańda, J.; Luc, M. Evaluating effects of dam operation on flow regimes and riverbed adaptation to those changes. Sci. Total Environ. 2020, 710, 136202. [Google Scholar] [CrossRef]
- Long, J.; Li, H.; Wang, Z.; Wang, B.; Xu, Y. Three decadal morphodynamic evolution of a large channel bar in the middle Yangtze River: Influence of natural and anthropogenic interferences. Catena 2021, 199, 105128. [Google Scholar] [CrossRef]
- Wohl, E.; Marshall, A.E.; Scamardo, J.; White, D.; Morrison, R.R. Biogeomorphic influences on river corridor resilience to wildfire disturbances in a mountain stream of the Southern Rockies, USA. Sci. Total Environ. 2022, 820, 153321. [Google Scholar] [CrossRef]
- Zhu, G.; Li, Y.; Sun, Z.; Kanae, S. Response of vegetation to submergence along Jingjiang Reach of the Yangtze River. PLoS ONE 2021, 16, e0251015. [Google Scholar] [CrossRef]
- Lou, Y.; Dai, Z.; Lu, X.; Li, D. Anthropogenic pressures induced hydromorphodynamic changes of riverine islands in the Upper Jingjiang reach along the Changjiang (Yangtze) River. Catena 2022, 217, 106488. [Google Scholar] [CrossRef]
- Phillips, J.D.; Slattery, M.C.; Musselman, Z.A. Channel adjustments of the lower Trinity River, Texas, downstream of Livingston Dam. Earth Sur. Process. Landf. 2005, 30, 1419–1439. [Google Scholar] [CrossRef]
- Casado, A.; Peiry, J.L.; Campo, A.M. Geomorphic and vegetation changes in a meandering dryland river regulated by a large dam, Sauce Grande River, Argentina. Geomorphology 2016, 268, 21–34. [Google Scholar] [CrossRef]
- Assahira, C.; Piedade, M.T.F.; Trumbore, S.E.; Wittmann, F.; Cintra, B.B.L.; Batista, E.S.; Resende, A.F.; Schöngart, J. Tree mortality of a flood-adapted species in response of hydrographic changes caused by an Amazonian river dam. For. Ecol. Manag. 2017, 396, 113–123. [Google Scholar] [CrossRef]
- Lou, Y.; Mei, X.; Dai, Z.; Wang, J.; Wei, W. Evolution of the mid-channel bars in the middle and lower reaches of the Changjiang (Yangtze) River from 1989 to 2014 based on the Landsat satellite images: Impact of the Three Gorges Dam. Environ. Earth Sci. 2018, 77, 1–18. [Google Scholar] [CrossRef]
- Xia, J.; Wang, Y.; Zhou, M.; Deng, S.; Li, Z.; Wang, Z. Variations in channel centerline migration rate and intensity of a braided reach in the Lower Yellow River. Remote Sens. 2021, 13, 1680. [Google Scholar] [CrossRef]
- Wang, J.; Dai, Z.; Mei, X.; Lou, Y.; Wei, W.; Ge, Z. Immediately downstream effects of Three Gorges Dam on channel sandbars morphodynamics between Yichang-Chenglingji Reach of the Changjiang River, China. J. Geogr. Sci. 2018, 28, 629–646. [Google Scholar] [CrossRef]
- Yang, Y.; Zheng, J.; Zhang, M.; Zhu, L.; Zhu, Y.; Wang, J.; Zhao, W. Sandy riverbed shoal under anthropogenic activities: The sandy reach of the Yangtze River, China. J. Hydrol. 2021, 603, 126861. [Google Scholar] [CrossRef]
- Yang, Y.; Zheng, J.; Zhang, H.; Chai, Y.; Zhu, Y.; Wang, C. Impact of the Three Gorges Dam on riverbed scour and siltation of the middle reaches of the Yangtze River. Earth Sur. Process. Landf. 2022, 47, 1514–1531. [Google Scholar] [CrossRef]
- Zhang, Y.; Wang, P.; Cheng, J.; Wang, W.J.; Zeng, L.; Wang, B. Drag coefficient of emergent flexible vegetation in steady nonuniform flow. Water Resour. Res. 2020, 56, e2020WR027613. [Google Scholar] [CrossRef]
- Box, W.; Järvelä, J.; Västilä, K. Flow resistance of floodplain vegetation mixtures for modelling river flows. J. Hydrol. 2021, 601, 126593. [Google Scholar] [CrossRef]
- Chen, J.M.; Black, T.A. Defining leaf area index for non-flat leaves. Plant Cell Environ. 1992, 15, 421–429. [Google Scholar] [CrossRef]
- Jiang, C.; Guan, K.; Wu, G.; Peng, B.; Wang, S. A daily, 250 m and real-time gross primary productivity product (2000–present) covering the contiguous United States. Earth Syst. Sci. Data. 2021, 13, 281–298. [Google Scholar] [CrossRef]
- Yang, P.; Prikaziuk, E.; Verhoef, W.; van Der Tol, C. SCOPE 2.0: A model to simulate vegetated land surface fluxes and satellite signals. Geosci. Model Dev. 2021, 14, 4697–4712. [Google Scholar] [CrossRef]
- Fang, H.; Baret, F.; Plummer, S.; Schaepman-Strub, G. An overview of global leaf area index (LAI): Methods, products, validation, and applications. Rev. Geophys. 2019, 57, 739–799. [Google Scholar] [CrossRef]
- Piao, S.; Yin, G.; Tan, J.; Cheng, L.; Huang, M.; Li, Y.; Liu, R.; Mao, J.; Myneni, R.B.; Peng, S.; et al. Detection and attribution of vegetation greening trend in China over the last 30 years. Glob. Chang. Biol. 2015, 21, 1601–1609. [Google Scholar] [CrossRef] [PubMed]
- Albergel, C.; Munier, S.; Leroux, D.J.; Dewaele, H.; Fairbairn, D.; Barbu, A.L.; Gelati, E.; Dorigo, W.; Faroux, S.; Meurey, C.; et al. Sequential assimilation of satellite-derived vegetation and soil moisture products using SURFEX_v8. 0: LDAS-Monde assessment over the Euro-Mediterranean area. Geosci. Model Dev. 2017, 10, 3889–3912. [Google Scholar] [CrossRef]
- Kang, Y.; Ozdogan, M.; Gao, F.; Anderson, M.C.; White, W.A.; Yang, Y.; Yang, Y.; Erickson, T.A. A data-driven approach to estimate leaf area index for Landsat images over the contiguous US. Remote Sens. Environ. 2021, 258, 112383. [Google Scholar] [CrossRef]
- Delegido, J.; Verrelst, J.; Alonso, L.; Moreno, J. Evaluation of sentinel-2 red-edge bands for empirical estimation of green LAI and chlorophyll content. Sensors 2011, 11, 7063–7081. [Google Scholar] [CrossRef]
- Liu, J.; Pattey, E.; Jégo, G. Assessment of vegetation indices for regional crop green LAI estimation from Landsat images over multiple growing seasons. Remote Sens. Environ. 2012, 123, 347–358. [Google Scholar] [CrossRef]
- Verrelst, J.; Rivera, J.P.; Veroustraete, F.; Muñoz-Marí, J.; Clevers, J.G.; Camps-Valls, G.; Moreno, J. Experimental Sentinel-2 LAI estimation using parametric, non-parametric and physical retrieval methods–A comparison. ISPRS J. Photogramm. Remote Sens. 2015, 108, 260–272. [Google Scholar] [CrossRef]
- Ju, J.; Roy, D.P. The availability of cloud-free Landsat ETM+ data over the conterminous United States and globally. Remote Sens. Environ. 2008, 112, 1196–1211. [Google Scholar] [CrossRef]
- Holben, B.N. Characteristics of maximum-value composite images from temporal AVHRR data. Int. J. Remote Sens. 1986, 7, 1417–1434. [Google Scholar] [CrossRef]
- Weng, Q.; Fu, P. Modeling annual parameters of clear-sky land surface temperature variations and evaluating the impact of cloud cover using time series of Landsat TIR data. Remote Sens. Environ. 2014, 140, 267–278. [Google Scholar] [CrossRef]
- Jin, Z.; Azzari, G.; You, C.; Di Tommaso, S.; Aston, S.; Burke, M.; Lobell, D.B. Smallholder maize area and yield mapping at national scales with Google Earth Engine. Remote Sens. Environ. 2019, 228, 115–128. [Google Scholar] [CrossRef]
- Cao, G.J.; Wang, J. Measurements and Studies of Hydrological and Sediment Data in the Three Gorges Project; Science Press: Beijing, China, 2015. [Google Scholar]
- Yang, Y.; Li, M.; Liu, W.; Chai, Y.; Zhang, J.; Yu, W. Relationship between potential waterway depth improvement and evolution of the Jingjiang Reach of the Yangtze River in China. J. Geogr. Sci. 2023, 33, 547–575. [Google Scholar] [CrossRef]
- Yi, Y.; Hu, X.; Shi, M.; Kang, H.; Wang, B.; Zhang, C.; Liu, C. Vegetation dynamics and its relationship with climate factors in the middle reaches of the Yangtze River based on MODIS NDVI. Sheng Tai Xue Bao 2021, 41, 7796–7807. [Google Scholar]
- Zhang, Z.; Li, M.; Yang, Z.; Liu, Q.; Zou, M.; Yuan, Y. Vegetation distribution on the ecological protection slopes of the Middle and Lower Yangtze River. Shui Sheng Tai Xue Za Zhi 2021, 42, 7–15. [Google Scholar]
- He, Z.; Sun, Z.; Li, Y.; Zhao, Q.; Hu, Y.; Chen, Z. Response of the gravel–sand transition in the Yangtze River to hydrological and sediment regime changes after upstream damming. Earth Sur. Process. Landf. 2022, 47, 383–398. [Google Scholar] [CrossRef]
- Huang, S.; Tang, L.; Hupy, J.P.; Wang, Y.; Shao, G. A commentary review on the use of normalized difference vegetation index (NDVI) in the era of popular remote sensing. J. For. Res. 2021, 32, 1–6. [Google Scholar] [CrossRef]
- Zhou, J.; Chen, J.; Chen, X.; Zhu, X.; Qiu, Y.; Song, H.; Rao, Y.; Zhang, C.; Cao, X.; Cui, X. Sensitivity of six typical spatiotemporal fusion methods to different influential factors: A comparative study for a normalized difference vegetation index time series reconstruction. Remote Sens. Environ. 2021, 252, 112130. [Google Scholar] [CrossRef]
- Fisher, A.; Flood, N.; Danaher, T. Comparing Landsat water index methods for automated water classification in eastern Australia. Remote Sens. Environ. 2016, 175, 167–182. [Google Scholar] [CrossRef]
- Feret, J.B.; François, C.; Asner, G.P.; Gitelson, A.A.; Martin, R.E.; Bidel, L.P.; Ustin, S.L.; Maire, G.; Jacquemoud, S. PROSPECT-4 and 5: Advances in the leaf optical properties model separating photosynthetic pigments. Remote Sens. Environ. 2008, 112, 3030–3043. [Google Scholar] [CrossRef]
- Verhoef, W.; Jia, L.; Xiao, Q.; Su, Z. Unified optical-thermal four-stream radiative transfer theory for homogeneous vegetation canopies. IEEE Trans. Geosci. Remote Sens. 2007, 45, 1808–1822. [Google Scholar] [CrossRef]
- Breiman, L. Random forests. Mach. Learn. 2001, 45, 5–32. [Google Scholar] [CrossRef]
- Belgiu, M.; Drăguţ, L. Random forest in remote sensing: A review of applications and future directions. ISPRS J. Photogramm. Remote Sens. 2016, 114, 24–31. [Google Scholar] [CrossRef]
- Wolanin, A.; Camps-Valls, G.; Gómez-Chova, L.; Mateo-García, G.; van der Tol, C.; Zhang, Y.; Guanter, L. Estimating crop primary productivity with Sentinel-2 and Landsat 8 using machine learning methods trained with radiative transfer simulations. Remote Sens. Environ. 2019, 225, 441–457. [Google Scholar] [CrossRef]
- Weisner, S.E.; Strand, J.A. Rhizome architecture in Phragmites australis in relation to water depth: Implications for within-plant oxygen transport distances. Folia Geobot. 1996, 31, 91–97. [Google Scholar] [CrossRef]
- Xu, X.; Zhang, Q.; Li, Y.; Tan, Z.; Wang, X. Reed population features and relationships between feature indicators and flooding depth, groundwater depth in an islet in Poyang Lake. Wetl. Sci. 2014, 12, 714–722. [Google Scholar]
- Xiong, H.; Sun, Z.; Chen, L.; Yang, X.; Zhou, X.; Li, Z.; Zhou, W. Influence of hydrological and morphological changes on the habitats of Miscanthus lutarioriparius and Phragmites australis in a river flood plain: A case study of Wuhan reach of the Yangtze River. J. Lake Sci. 2022, 34, 1250–1261. [Google Scholar]
- Yang, X.; Xiong, H.; Li, D.; Li, Y.; Hu, Y. Disproportional erosion of the middle-lower Yangtze River following the operation of the Three Gorges Dam. Sci. Total Environ. 2023, 859, 160264. [Google Scholar] [CrossRef]
- Wohl, E.; Knox, R.L. A first-order approximation of floodplain soil organic carbon stocks in a river network: The South Platte River, Colorado, USA as a case study. Sci. Total Environ. 2022, 852, 158507. [Google Scholar] [CrossRef]
- Knox, R.L.; Wohl, E.E.; Morrison, R.R. Levees don’t protect, they disconnect: A critical review of how artificial levees impact floodplain functions. Sci. Total Environ. 2022, 837, 155773. [Google Scholar] [CrossRef] [PubMed]
- Majhi, I.; Yang, D. Streamflow characteristics and changes in Kolyma Basin in Siberia. J. Hydrometeorol. 2008, 9, 267–279. [Google Scholar] [CrossRef]
- Suzuki, K.; Park, H.; Makarieva, O.; Kanamori, H.; Hori, M.; Matsuo, K.; Matsumura, S.; Nesterova, N.; Hiyama, T. Effect of permafrost thawing on discharge of the Kolyma River, northeastern Siberia. Remote Sens. 2021, 13, 4389. [Google Scholar] [CrossRef]
- Yan, K.; Park, T.; Yan, G.; Chen, C.; Yang, B.; Liu, Z.; Nemani, R.R.; Knyazikhin, Y.; Myneni, R.B. Evaluation of MODIS LAI/FPAR product collection 6. Part 1: Consistency and improvements. Remote Sens. 2016, 8, 359. [Google Scholar] [CrossRef]
- Kimm, H.; Guan, K.; Jiang, C.; Peng, B.; Gentry, L.F.; Wilkin, S.C.; Wang, S.; Bernacchi, C.J.; Peng, J.; Luo, Y. Deriving high-spatiotemporal-resolution leaf area index for agroecosystems in the US Corn Belt using Planet Labs CubeSat and STAIR fusion data. Remote Sens. Environ. 2020, 239, 111615. [Google Scholar] [CrossRef]
- Estévez, J.; Vicent, J.; Rivera-Caicedo, J.P.; Morcillo-Pallarés, P.; Vuolo, F.; Sabater, N.; Camps-Valls, G.; Moreno, J.; Verrelst, J. Gaussian processes retrieval of LAI from Sentinel-2 top-of-atmosphere radiance data. ISPRS J. Photogramm. Remote Sens. 2020, 167, 289–304. [Google Scholar] [CrossRef]


| Sub-reach number | 1 | 2 | 3 | 4 | 5 | 6 | 7 | 8 | 9 | |||||||
| Included reaches | Yichang-Zhicheng | Zhicheng-Majiadian | Majiadian-Shashi | Shashi-Shishou | Shishou-Jianli | Jianli-Chenglingji | Chenglingji-Hankou | Hankou-Jiujiang | Jiujiang-Hukou | |||||||
| Hydrometric station number | 1 | 2 | 3 | 4 | 5 | 6 | 7 | 8 | 9 | 10 | ||||||
| Hydrometric station name | Yichang | Zhicheng | Majiadian | Shashi | Shishou | Jianli | Chenglingji | Hankou | Jiujiang | Hukou | ||||||
| Bar number | 1 | 2 | 3 | 4 | 5 | 6 | 7 | 8 | 9 | 10 | 11 | 12 | 13 | 14 | 15 | 16 |
| Bar name | Yanzhi | Guan | Liutiao | Lalin | Tuqi | Ouchikou | Wugui | Dama | Xiongjia | Zhong | Fuxing | Hankou | Tianxing | Dongcao | Daijia | Zhangjia |
| Period Number | Impounded Water Level | Included Years |
|---|---|---|
| 1 | - | -2002 |
| 2 | 135.0–139.0 m 144.0–156.0 m 145.0–172.8 m | 2003–2005 2006–2007 2008 |
| 3 | 145.0–171.4 m 145.0–175.0 m | 2009 2010–present |
| Data Type | Spatial Resolution | Temporal Resolution | Period | Source |
|---|---|---|---|---|
| Imagery | 30 m | 16 days | 2003–2012 | Landsat-5, USGS |
| 2014–2021 | Landsat-8, USGS | |||
| Discharge | - | 1 day | 1991–2020 | CWRC |
| Water level | - | 1 day | 1991–2020 | CWRC |
| Cross-section profile | 2 km | 1 year | 2003–2020 | CWRC |
| Parameter | Unit | Min | Max |
|---|---|---|---|
| Chlorophyll content | ug·cm−2 | 0 | 60 |
| Carotenoid content | ug·cm−2 | 0 | 40 |
| Leaf area index | m2·m−2 | 0 | 6 |
| Leaf inclination | - | −1 | 1 |
| Solar zenith angle | ° | 25, 30, 35, 40, 45, 50 | |
| Soil brightness | - | 0.1, 0.2, 0.3, 0.4, 0.5, 0.6, 0.7, 0.8, 0.9, 1.0 | |
| Sub-Reach Number | Bar Area | Vegetation Area | Vegetation Coverage |
|---|---|---|---|
| 1 | −14% | 309% | 376% |
| 2 | −37% | 194% | 364% |
| 3 | −6% | 2% | 9% |
| 4 | −3% | 49% | 55% |
| 5 | −1% | 16% | 17% |
| 6 | −5% | 2% | 8% |
| 7 | −13% | 2% | 17% |
| 8 | −6% | 22% | 30% |
| 9 | −4% | −3% | 2% |
Disclaimer/Publisher’s Note: The statements, opinions and data contained in all publications are solely those of the individual author(s) and contributor(s) and not of MDPI and/or the editor(s). MDPI and/or the editor(s) disclaim responsibility for any injury to people or property resulting from any ideas, methods, instructions or products referred to in the content. |
© 2023 by the authors. Licensee MDPI, Basel, Switzerland. This article is an open access article distributed under the terms and conditions of the Creative Commons Attribution (CC BY) license (https://creativecommons.org/licenses/by/4.0/).
Share and Cite
Hu, Y.; Zhou, J.; Deng, J.; Li, Y.; Yang, C.; Li, D. River Bars and Vegetation Dynamics in Response to Upstream Damming: A Case Study of the Middle Yangtze River. Remote Sens. 2023, 15, 2324. https://doi.org/10.3390/rs15092324
Hu Y, Zhou J, Deng J, Li Y, Yang C, Li D. River Bars and Vegetation Dynamics in Response to Upstream Damming: A Case Study of the Middle Yangtze River. Remote Sensing. 2023; 15(9):2324. https://doi.org/10.3390/rs15092324
Chicago/Turabian StyleHu, Yong, Junxiong Zhou, Jinyun Deng, Yitian Li, Chunrui Yang, and Dongfeng Li. 2023. "River Bars and Vegetation Dynamics in Response to Upstream Damming: A Case Study of the Middle Yangtze River" Remote Sensing 15, no. 9: 2324. https://doi.org/10.3390/rs15092324
APA StyleHu, Y., Zhou, J., Deng, J., Li, Y., Yang, C., & Li, D. (2023). River Bars and Vegetation Dynamics in Response to Upstream Damming: A Case Study of the Middle Yangtze River. Remote Sensing, 15(9), 2324. https://doi.org/10.3390/rs15092324