Article

Understanding the Spatial–Temporal Patterns of Floating Islands Impacting the Major Dams of the White Nile

1
School of Earth and Planetary, Spatial Science Discipline, Curtin University, Perth 6102, Australia
2
School of Design and the Built Environment, Curtin University, Perth 6102, Australia
3
Strategy, Research and Business Development Unit, Uganda Electricity Generation Company Limited, Kampala P.O. Box 75831, Uganda
*
Author to whom correspondence should be addressed.
Remote Sens. 2023, 15(9), 2304; https://doi.org/10.3390/rs15092304
Submission received: 11 January 2023 / Revised: 20 April 2023 / Accepted: 23 April 2023 / Published: 27 April 2023

Abstract

:
Floating islands in Lake Victoria, the world’s second-largest fresh water lake, disrupt transportation, fisheries, irrigation, and water quality. Despite their impact, the dynamics of these islands remain unexplored. This study investigates island dynamics within the Nalubaale, Kiira, and Bujagali dams in Uganda, exploring the causes of their formation and the subsequent impact on hydropower production. The study collects data of Landsat imagery from 2000 to 2020, CHIRPS precipitation, and Lake Victoria’s water level datasets from 2004, 2010, 2013, 2017, and 2020. The results reveal a strong correlation between precipitation, fluctuating water levels, and floating island formation, with nutrient-rich runoff from municipal waste and agriculture promoting island growth. In addition, rising water levels lead to the dislodging of rocks and soil, contributing to floating island formation, which may manifest with a lag time of up to one month. The analysis shows higher correlations between precipitation, water levels, and floating islands during the long (March–May) and short (September–November) rainy seasons as opposed to drier periods (June–August, December–February). The findings indicate that southeast monsoon winds, which transport floating vegetation, also are essential in influencing island dynamics. Consequently, the major drivers of floating islands in Lake Victoria are identified as precipitation, water level fluctuations and wind variations. Finally, a negative correlation between floating island eutrophication and power production at Kiira and Nalubaale stations suggests that the increased eutrophication caused by the presence of floating islands leads to reduced power output at both Kiira and Nalubaale power stations.

Graphical Abstract

1. Introduction

Lake Victoria, the largest freshwater lake in Africa and the second largest globally, has a mean surface area of 69,295 km 2 [1]. It is a vital resource for Kenya, Uganda, Tanzania, Rwanda, and Burundi [1,2,3,4]. The lake provides several benefits to its riparian inhabitants, such as water for domestic and industrial purposes, fisheries maintenance, food security, and movement of economic goods and services [1,3,4,5]. Additionally, Lake Victoria is a major power source, generating hydroelectricity required for economic development [6]. Due to the vast size of its basin, Lake Victoria contains a significant volume of water, which is instrumental in facilitating hydroelectric power production.
Like most countries, Uganda heavily relies on hydropower for 84% of the total Megawatts provided by hydropower plants and power stations [7]. Increasing demand for hydropower has led to the evolvement of the White Nile over time through the construction of hydroelectric power production plants (see, e.g., [1]). According to [2], Lake Victoria facilitates Uganda’s power production through its only outlet, the Victoria Nile River also known as the White Nile that feeds the Nalubaale hydropower plant and other power production plants downstream (see Figure 1). Reliance on the lake for developing hydropower production plants places Uganda as the most developed hydropower industry compared to other nations within its basin [6]. However, the dams’ significance, day-to-day operations, and hydroelectric power production tasks are threatened by the invasion of floating islands, as pointed out, e.g., in [8,9]. In 2020, for example, due to heavy rainfall and extreme flood events, floating islands accumulated at the intake points and cooling systems of Kiira and Nalubaale power stations, leading to a nationwide blackout [9,10].
Across tropical wetlands globally, small or large free-floating heaps of organic matter that sustain the development of various plants above them are rather common [11]. Floating masses that are composed of a variety of materials and held together by a web of stems and roots have been referred to as floating islands [12,13,14]. A floating island comprises mineral sediments, live biomass, dead organic matter, hippo grass, suds of papyrus, water hyacinth, fishing gears such as gillnets, heavy masses of soil and rock particles gathered from the banks of lakes, grass, and small trees collected from the surrounding flood plains of lakes and rivers that are all held together by a web of stems and roots [15,16,17].
The composition of a floating island can vary depending on location; for example, in the White Nile, they are predominantly composed of mineral sediments, live and dead organic matter, and plants [17]. However, a floating island may also contain plastic or Sargassum, among other materials [12]. Several factors lead to the formation of floating islands. On the one hand, according to [12], the intensity of eutrophication of an area by floating islands varies due to the seasonal fluctuations that play a role in the level of a lake or river. In Lake Victoria, for example, ref. [16] concluded that the appearance and disappearance of floating islands are largely shaped by seasonal variations such as the strong southeasterly winds of May–August experienced in the region. On the other hand, according to [18], heavy precipitation and high water margins lead to the infringement of a floating island. Additionally, the island can be formed when rising water levels in the lake lead to the disturbance of surrounding banks, collecting heaps of debris that entangle with floating vegetation such as water hyacinth and Cyperus papyrus [18]. Aside from seasonal fluctuations, varying water levels, and wavering precipitation margins, reservoirs can also play a huge role in the formation of floating islands as they are prone to soil erosion that results in the collapsing of their surrounding land masses, especially with no safety measures set in place [8]. As such, the assortment of these loose particles and rock portions can lead to their dislodgement into the lake and the consequent formation of floating islands around reservoirs. The appearance of a floating island in the lake can lead to the pollution of drinking water, blockage of beaches, obstruction of irrigation canals, impedance of transport lines, suffocation of macrophyte beds, and disruption of fishing grounds and waterways [15,17].
Undeniably, there is a need to control the spread of floating islands, as pointed out by [16,17]. As such, several studies have been undertaken to analyse them. Refs. [13,14] explored the rudimentary characteristics of floating islands, elaborating on their disadvantages in ecological and socio-economic well-being in India and Kenya, respectively. Those studies were followed up by [11,12], who reported the types of floating islands that can be formed in tropical wetlands based on development, origin, structure and composition while analysing the factors leading to their formation and outspread. However, these studies do not investigate floating islands’ spatial and temporal dynamics. Subsequently, refs. [8,9,10] highlight the significant impact of floating islands on hydropower production in Uganda. According to those studies, the islands clog at the dams’ intake points and turbines, significantly affecting power production and causing blackouts. However, these studies do not examine the spatial–temporal variations of these islands. Nonetheless, other studies have enlightened the spatial–temporal dynamics of the floating islands across water bodies in Asia, e.g., [19,20]. Likewise, refs. [15] uses remote sensing to investigate the land use/land cover changes that lead to the formation of floating islands along Loktak lake in India. The study prompted [21] to examine the spatial–temporal invasion of floating islands along water bodies in Rwanda, Africa. Although these studies provide a good background on the spatial and temporal behaviour of the islands in tropical areas, wetland areas, and water bodies, they still do not inform on the floating mats’ impact in and around hydropower production centres.
Despite awareness of the severe impact floating islands can have, the influence of the islands’ spatial–temporal dynamics and the subsequent effect on power stations and hydropower production plants within Lake Victoria has not been explored. This study, therefore, utilises 20 years (2000–2020) of available Landsat data over Lake Victoria in the Uganda region to (i) assess the spatial–temporal dynamics of the floating Islands in the Kiira, Nalubaale and Bujagali dams, (ii) explore the reasons for these patterns across the White Nile, and (iii), assess the impact of these dynamics on hydropower production to aid in developing a broader understanding of the subtleties, developments, trends, and processes causing the rapid spread and growth of the islands, especially around hydropower stations.
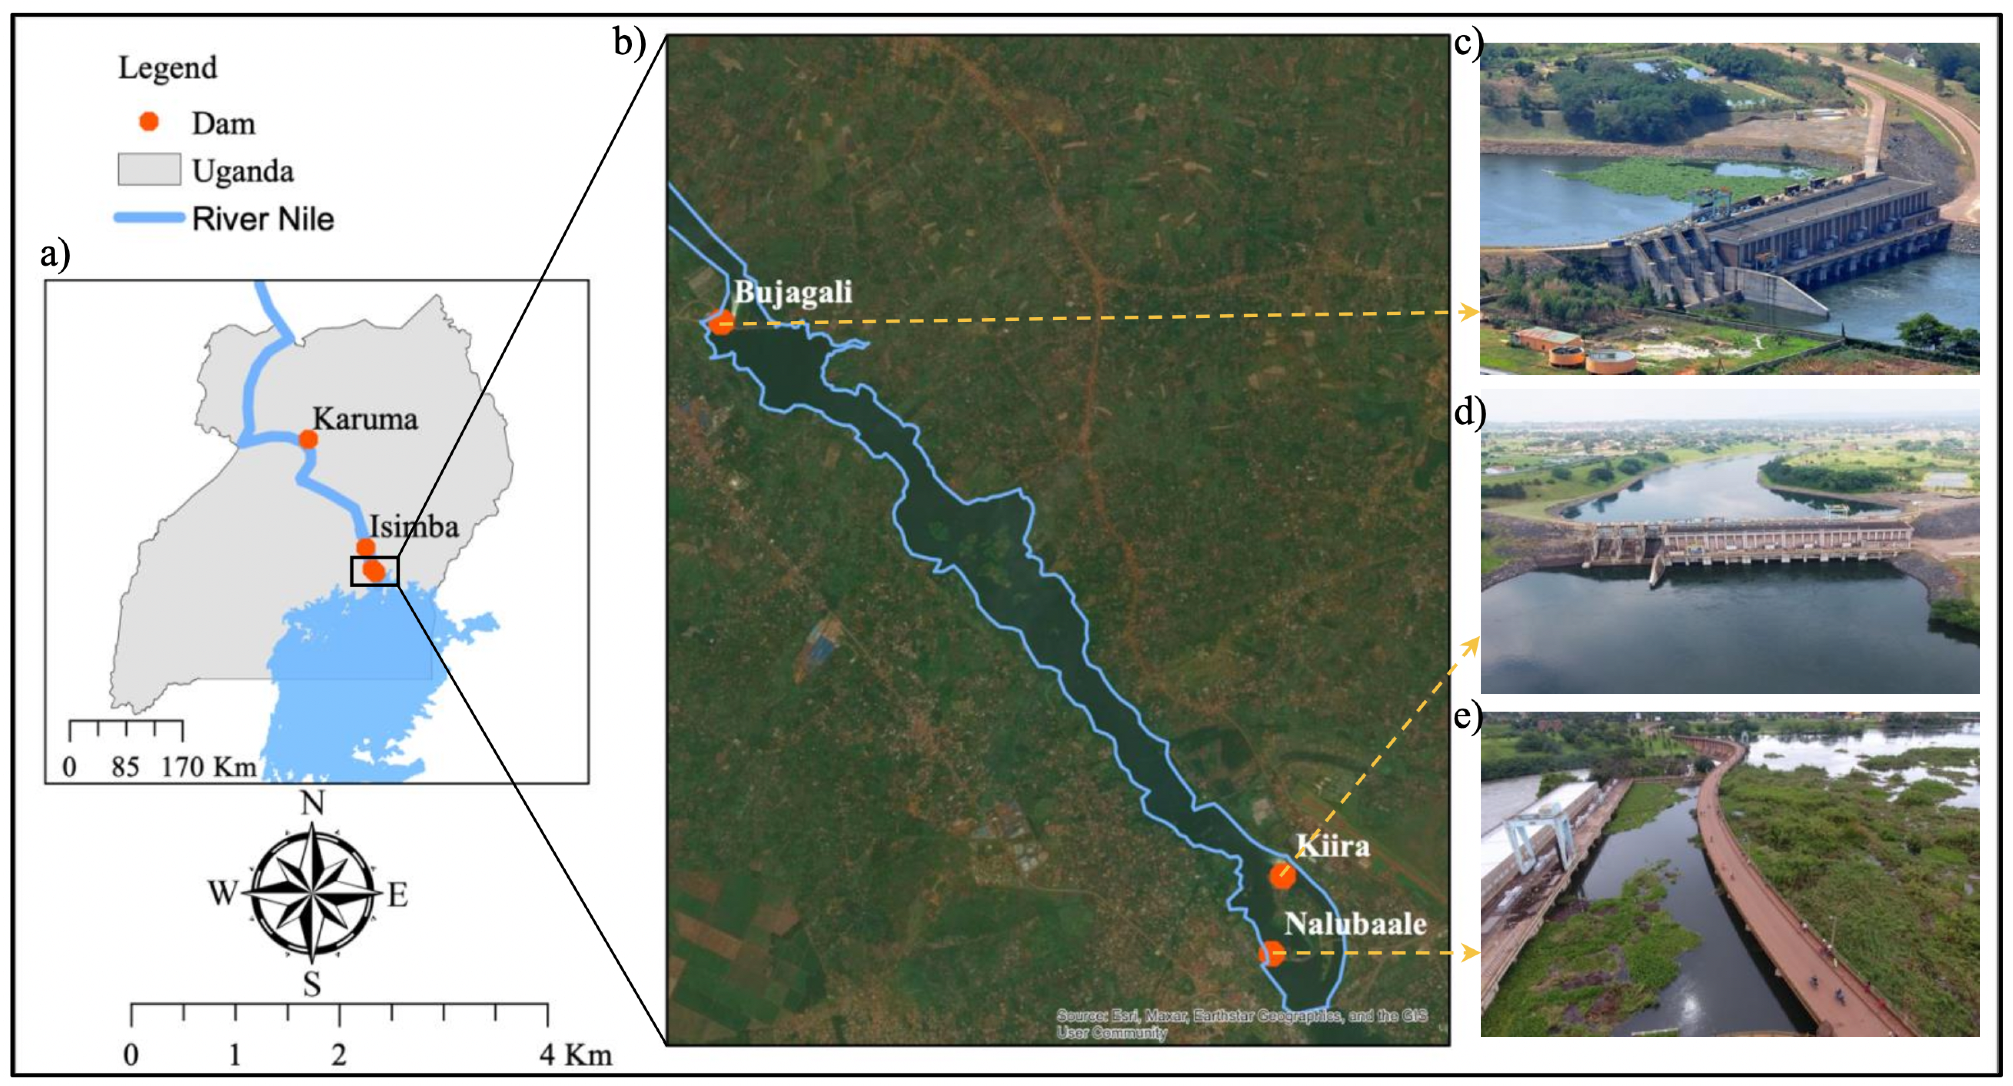
Figure 1. (a) The hydropower production plants along River Nile (White Nile) flowing from Lake Victoria in Uganda, (b) The main power stations that form the Owen Falls complex along the White Nile, (c) Floating Island at Bujagali hydropower plant [22], (d) Kiira power station [23], and (e), Floating Island at Nalubaale hydropower plant [24].
Remotesensing 15 02304 g001

2. Major Dams and Floating Islands along the White Nile: Background

The White Nile comprises five dams, the Nalubaale hydropower plant (HPP), also known as Owen falls, Kiira power station, Bujagali HPP, Isimba HPP, and Karuma HPP, as shown in Figure 1a, whose characteristics are summarised in Table 1. Despite housing several dams, Uganda’s main hydroelectric power production plants are the Bujagali, Nalubaale and Kiira power stations, with Karuma poised to be a major production plant once commissioned [25]. The Owen Falls Complex comprises three power plants (i.e., Bujagali, Nalubaale and Kiira power stations) that serve as major regulators of the discharge flux of Lake Victoria. These power plants were constructed on the White Nile [8,26]. Nalubaale power station (Figure 1b,e) is located at the source of the White Nile [27]. Since its construction and authorisation in 1954, the power station has played a significant role in Uganda’s hydropower, with a small fraction of the power generated also serving Rwanda and Burundi [28]. After its implementation, the White Nile’s hydrology experienced a sudden change between 1961 and 1964 due to an unpredicted 2.5 m rise in Lake Victoria’s water levels [29]. The unforeseen upsurge was caused by increased precipitation, climate change, and human settlement around the banks of Lake Victoria [30,31]. To mitigate the rising water levels, the discharge flow of the dam was increased to 1910 m 3 /s, leading to an even greater imbalance in the water levels [8,31]. Subsequently, the outflows of the White Nile increased by 60% from an average of 1725 to 2865 mm 3 /yr [32]. This flood condition and the rising demand for electricity in Uganda led to the establishment of the Kiira power station (Figure 1b,d in 1999 as an extension to the Nalubaale power plant [33]. It is located on the east bank, about 800 m downstream of the Nalubaale power station. Bujagali hydropower plant was commissioned in 2012 and is located in the eastern parts of Uganda, 16 km downstream of the Nalubaale hydropower plant [25,31]. It was commissioned and authorised to support the Nalubaale and Kiira power stations, providing a long-term solution to the energy crisis and power deficiency problems faced by the country at that time [34]. The Isimba hydropower plant was commissioned in 2019 and is located 50 km downstream of Lake Victoria in the southern parts of Uganda [35]. The dam mainly receives inflow from the upstream Bujalagi hydroelectric power station. The commissioning of the fifth and the largest dam, the Karuma hydroelectric power station, is expected mid-2023. The project was conceptualised in 2013, and its construction is yet to be completed [30].
Floating islands were first noticed in Lake Victoria in March 2001 when a floating mass of hippo grass, papyrus, and water hyacinth appeared at the White Nile, blocking the river [16]. This heap had, however, disappeared by March 2002, exhibiting a spatial–temporal behaviour. As soon as it arrived, ref. [16] claimed that electricity production at the Nalubaale hydropower plant had been significantly affected as the island choked the turbines and water filters at the power plant. The appearance, disappearance and subsequent re-appearance behaviour of the islands around the dam impacted all major industries in Uganda that depended on electricity from the power station. In dams and power stations, ref. [8] states that extreme flooding events result in the formation of floating islands around reservoirs. The floating mass then proceeds to assemble at the intake points and garbage frames of dams essential for hydroelectric production, necessitating the need to frequently clean the garbage frames [8]. The major impacts caused by the floating islands’ existence, encroachment, and infiltration are especially significant within the White Nile, as tremendous flooding forces hydroelectric production plants to discharge excessive water flow through backup gates and generation units [9]. The discharge process, in conjunction with elevated water levels, promotes the presence of a floating mass in and around the power stations (Figure 1).

3. Data and Methods

3.1. Data

This study used atmospherically corrected multispectral satellite images and hydrological and wind data to understand the spatial–temporal dynamics of floating islands in Lake Victoria. The datasets are described in Section 3.1.1Section 3.1.4 and summarised in Table 2.

3.1.1. Landsat

Level-1 Landsat satellite imagery (path 171 and row 60) used in this study are acquired from the United States Geological Survey (USGS) (https://earthexplorer.usgs.gov/, accessed on 1 December 2022). Landsat data are used to understand the spatial–temporal dynamics of floating islands over two decades (2000–2020). The year 2020 is selected as a cut-off year as comprehensive manual removal initiatives were conducted around the dams later in the year to mitigate and eventually eliminate the spread of the islands [37]. Landsat 7 Enhanced Thematic Mapper Plus (ETM+) is employed to obtain imagery from 2000 to 2014, while Landsat 8 OLI (Operational Land Imager) provides data from 2015 to 2020. Both platforms, with 30 m spatial resolution and 16-day temporal resolution, provide monthly data to assess the movement dynamics of the islands.

3.1.2. Sentinel-2

Sentinel-2, specifically Sentinel-2A, which was utilized in this study, is a satellite mission developed by the European Space Agency with the primary goal of monitoring land cover, natural hazards, vegetation, and the environment. The imagery data from Sentinel-2 are acquired from the United States Geological Survey (USGS) (https://earthexplorer.usgs.gov/) [3,38]. In this study, the Sentinel-2 product was used to validate the results obtained from the Landsat image analysis discussed in Section 3.1.1. The Sentinel-2 satellite captures 13 multispectral bands with spatial resolutions of 10, 20, and 60 m. Four of these bands, specifically the blue, green, red, and infrared bands, provide 10 m spatial resolution, which is particularly effective for observing and monitoring water bodies [38,39]. The study, however, covers the past two decades (2000–2020), and as Sentinel-2 only provides data from 2015, Landsat is used throughout the study to understand the dynamics of the floating islands before 2015. Moreover, when performing change detection, it is crucial to acquire images from the same sensor to avoid external effects such as sun angles as well as seasonal and phenological dissimilarities [40]. As such, Landsat is used consistently throughout the analysis to avoid the collection of imagery from different sensors in separate years. Sentinel 2 with a higher spatial–temporal resolution compared to Landsat is thus only used for validation purposes as discussed in Section 3.2.5.

3.1.3. CHIRPS

The Climate Hazard Group Infrared Precipitation with Station (CHIRPS) was acquired from USGS (https://earlywarning.usgs.gov/fews/datadownloads/Global/CHIRPS (accessed on 1 December 2022)). CHIRPS is a collective product of remotely sensed and in situ observations established for watching droughts and extreme climatic events [41]. The product offers a spatial resolution of 0.05 × 0.05 combining precipitation climatology from the National Oceanic and Atmospheric Administration, Climate Hazard Group (CHPClim), Climate Prediction Center (NOAA-CPC), NOAA Climate Forecast System version 2 (CFSv2), quasi global geostationary thermal infrared observations, the National Climatic Data Center (NCDC), TRMM 3B42, and gauge products as focal input data sources [41,42]. According to [42], the product has offered impartial and gridded data with frequent updates since 1981. CHIRPS data for the period 2004, 2010, 2013, 2017, and 2020 acquired from USGS (https://earlywarning.usgs.gov/fews/datadownloads/Global/CHIRPS) are used in this study to acquire precipitation values within the study area.

3.1.4. TRMM

The Tropical Rainfall Measuring Mission (TRMM) is a combined effort by the National Aeronautics and Space Agency (NASA) and the Japanese Aerospace Exploration Agency (JAXA) that has provided precipitation estimates since the beginning of 1998 [43]. The platform provides monthly precipitation data (mm/hr) at a spatial resolution of 0.25 × 0.25 through its main sensors: the TRMM Microwave Imager (TMI) and the TRMM precipitation radar (PR) [44]. The TRMM 3B43 product acquired from https://www.earthdata.nasa.gov/ (accessed on 1 December 2022) and created by merging microwave infrared precipitation rate and root-mean-square (RMS) precipitation-error rain-gauge data estimates are used to acquire precipitation data for 2004, 2010, 2013, 2017, and 2020 [45]. TRMM was employed in the study for consistency check with the results of CHIRPS in Section 3.1.3.

3.1.5. Altimetry Data

Lake Victoria’s monthly water level data are acquired from the THEIA https://hydroweb.theia-land.fr/hydroweb/view/L_victoria?lang=en&basin=Nile&lake=victoria (accessed on 1 December 2022) data and services centre comprising 10 French public institutions created to provide earth observation data for environmental studies [46].

3.2. Methods

Pre-processing and Normalized Difference Vegetation Index (NDVI) computations are performed, which is followed by a correlation analysis on rainfall and water level datasets to assess their relationship with the emergence and disappearance of floating islands. Due to the study area’s proximity to Lake Victoria, heavy rainfall results in a higher percentage of cloud cover, which limits the monthly analysis of Landsat imagery [47]. To identify the annual and seasonal patterns of the floating islands, monthly Landsat imagery is obtained from 2000 to 2020, and years with excessive cloud cover (greater than 20%) that could potentially affect the analysis are excluded, leaving 2004, 2010, 2013, 2017, and 2020 as the years with minimal to no cloud cover from January to December. Consequently, seasonal variation NDVI change and directional change time-series maps are generated for 2004, 2010, 2013, 2017, and 2020 to determine the periods during which floating islands predominantly occur around the Kiira, Nalubaale, and Bujagali dams. A structure chart illustrating the methodology is presented in Figure 2.

3.2.1. Image Pre-Processing

Satellite image distortion commonly results from factors such as sensor noise, climatic conditions and changes, and variations in sensor illumination [21]. Pre-processing is employed to improve image quality, reduce noise, eliminate distortions, and generate analysis-ready images for all acquired imagery in the study, including both Sentinel-2 and Landsat images. The imagery is clipped to the extent of the three dams (Kiira, Nalubaale, and Bujagali) before further processing. Atmospheric corrections using the COST method, as described by [48], are performed on the imagery to account for atmospheric effects. Cloudy pixels are eliminated by developing a Landsat Collection 1 Level-1 Quality Assessment cloud mask based on precipitation values derived from USGS https://www.usgs.gov/landsat-missions/landsat-collection-1-level-1-quality-assessment-band?qtscience_support_page_related_con=0#qtscience_support_page_related_con (accessed on 1 December 2022).

3.2.2. Normalized Difference Vegetation Index

The NDVI is an essential indicator derived from remotely sensed imagery for monitoring vegetation cover [49]. In this study, NDVI is used to identify floating islands within the three dams (Kiira, Nalubaale, and Bujagali). NDVI is computed for Landsat 8 (OLI) and Landsat 7 (ETM+) using Equations (1) and (2), respectively. Equation (3) is utilized to compute NDVI using Sentinel-2 imagery. As outlined in Section 1, floating islands comprise healthy and non-healthy vegetation as well as debris from rocks and soil; therefore, an NDVI threshold of >0.1 is employed to distinguish islands from water within the power production stations. Images are classified based on NDVI as water (<0.1), soil or rock fragments (>0.1), less dense (<0.3), and dense floating vegetation (>0.3), following the scale provided by [50].
N D V I ( L a n d s a t 8 ) = Near - Infrared ( Band 5 ) Red ( Band 4 ) Near - Infrared ( Band 5 ) + Red ( Band 4 ) ;
N D V I ( L a n d s a t 7 ) = Near - Infrared ( Band 4 ) Red ( Band 3 ) Near - Infrared ( Band 4 ) + Red ( Band 3 ) .
N D V I ( S e n t i n e l 2 ) = Near - Infrared ( Band 8 ) Red ( Band 4 ) Near - Infrared ( Band 8 ) + Red ( Band 4 ) .

3.2.3. Directional Flow of the Floating Islands

The directional path and motion of floating islands as they move from one point to another are calculated using Equations (4) and (5). First, water pixels are eliminated, and the NDVI-weighted central coordinates of the islands are recorded based on the pixels covered by the islands at specific spatial points in time with monthly NDVI values also recorded alongside the identified coordinate values. The X coordinate of the island’s central point is computed using Equation (4), and the Y central coordinate is determined through Equation (5):
X = N D V I × X i N D V I i
Y = N D V I × Y i N D V I i
In Equation (4), N D V I X i represents the value obtained after multiplying the X coordinate of the centroid location of a pixel ( X i ) by its corresponding NDVI value ( N D V I i ). Similarly, in Equation (5), N D V I Y i is the value obtained after multiplying the Y coordinate of the centroid location of a pixel ( Y i ) by its corresponding NDVI value ( N D V I i ). Finally, the size of the floating island is calculated by multiplying the number of pixels covered by the island by the spatial resolution of a Landsat-acquired pixel ( number of pixels × 900 m 2 ), leading to the creation of flow-change maps based on the spatial–temporal dynamics of the islands. The computation of the above two equations is performed using the R programming language.

3.2.4. Correlation Analysis

The Pearson correlation coefficient is used in the study to explore and subsequently understand the relationship between changes in wind and rainfall and the NDVI values registered by the floating islands (see, e.g., [51]). The Pearson correlation coefficient is derived using Equation (6), where r is the correlation coefficient, r > 0 signifies a positive correlation, and r < 0 signals a negative correlation. The higher the value of r, the stronger the relationship. x i and y i are the wind and rainfall variables, while x ¯ and y ¯ are the average values. First, the relationship between rainfall, water level and NDVI is explored to investigate the years and seasons exhibiting the most impacts of the floating islands. Then, the correlations between wind and NDVI are explored to understand the directional movement exhibited by the islands.
The Pearson correlation coefficient is used to examine the relationship between wind and rainfall changes and the NDVI values of the floating islands (see, e.g., [51]). The Pearson correlation coefficient is derived using Equation (6):
r = i = 1 n ( x i x ¯ ) ( y i y ¯ ) i = 1 n ( x i x ¯ ) 2 i = 1 n ( y i y ¯ ) 2
where r represents the correlation coefficient; a positive correlation is indicated by r > 0 , while a negative correlation is signified by r < 0 . The strength of the relationship increases with the value of r. In the equation, x i and y i represent the wind and rainfall variables, while x ¯ and y ¯ denote the average values. The study first investigates the relationship between rainfall, water level, and NDVI to identify the years and seasons with the most significant impacts of floating islands. Then, the correlations between wind and NDVI are examined to comprehend the directional movement exhibited by the islands.
For comparison of data with different units of measurement, standardisation is performed using Equation (7) where Z is the standardised value, X i is the recorded value, X ¯ is the mean, and σ is the standard deviation. The standardised values are then plotted as anomalies.
Z = X i X ¯ σ

3.2.5. Validation

Traditionally, remotely sensed products are validated using in situ ground truth data. In the absence of ground truth data, as is the case in this study, validation of lower spatio-temporal resolution images can be undertaken using higher spatio-temporal images, as completed in [52]. A comparative analysis is conducted between Sentinel-2 (10 m) and Landsat 8 OLI in the study area. Sentinel-2’s higher spatial–temporal resolution allows for more detailed and accurate imagery, making it an ideal choice for validating Landsat data in observing and monitoring floating islands [38,39]. The high spatial resolution of Sentinel-2 (10 m for blue, green, red, and infrared bands) enables a precise comparison and validation of Landsat data, ensuring the analysis is reliable. Available from 2015, Sentinel-2 data can complement and validate Landsat analysis for 2015–2020, maintaining consistent results across the study period (2000–2020). The validation process entails comparing Landsat and Sentinel-2 images from overlapping timeframes, focusing on floating island dynamics and evaluating the consistency between the datasets. Comparing Landsat-derived results with Sentinel-2 data allows the study to identify potential discrepancies, validate Landsat-based analyses, and confirm the findings’ robustness and reliability.
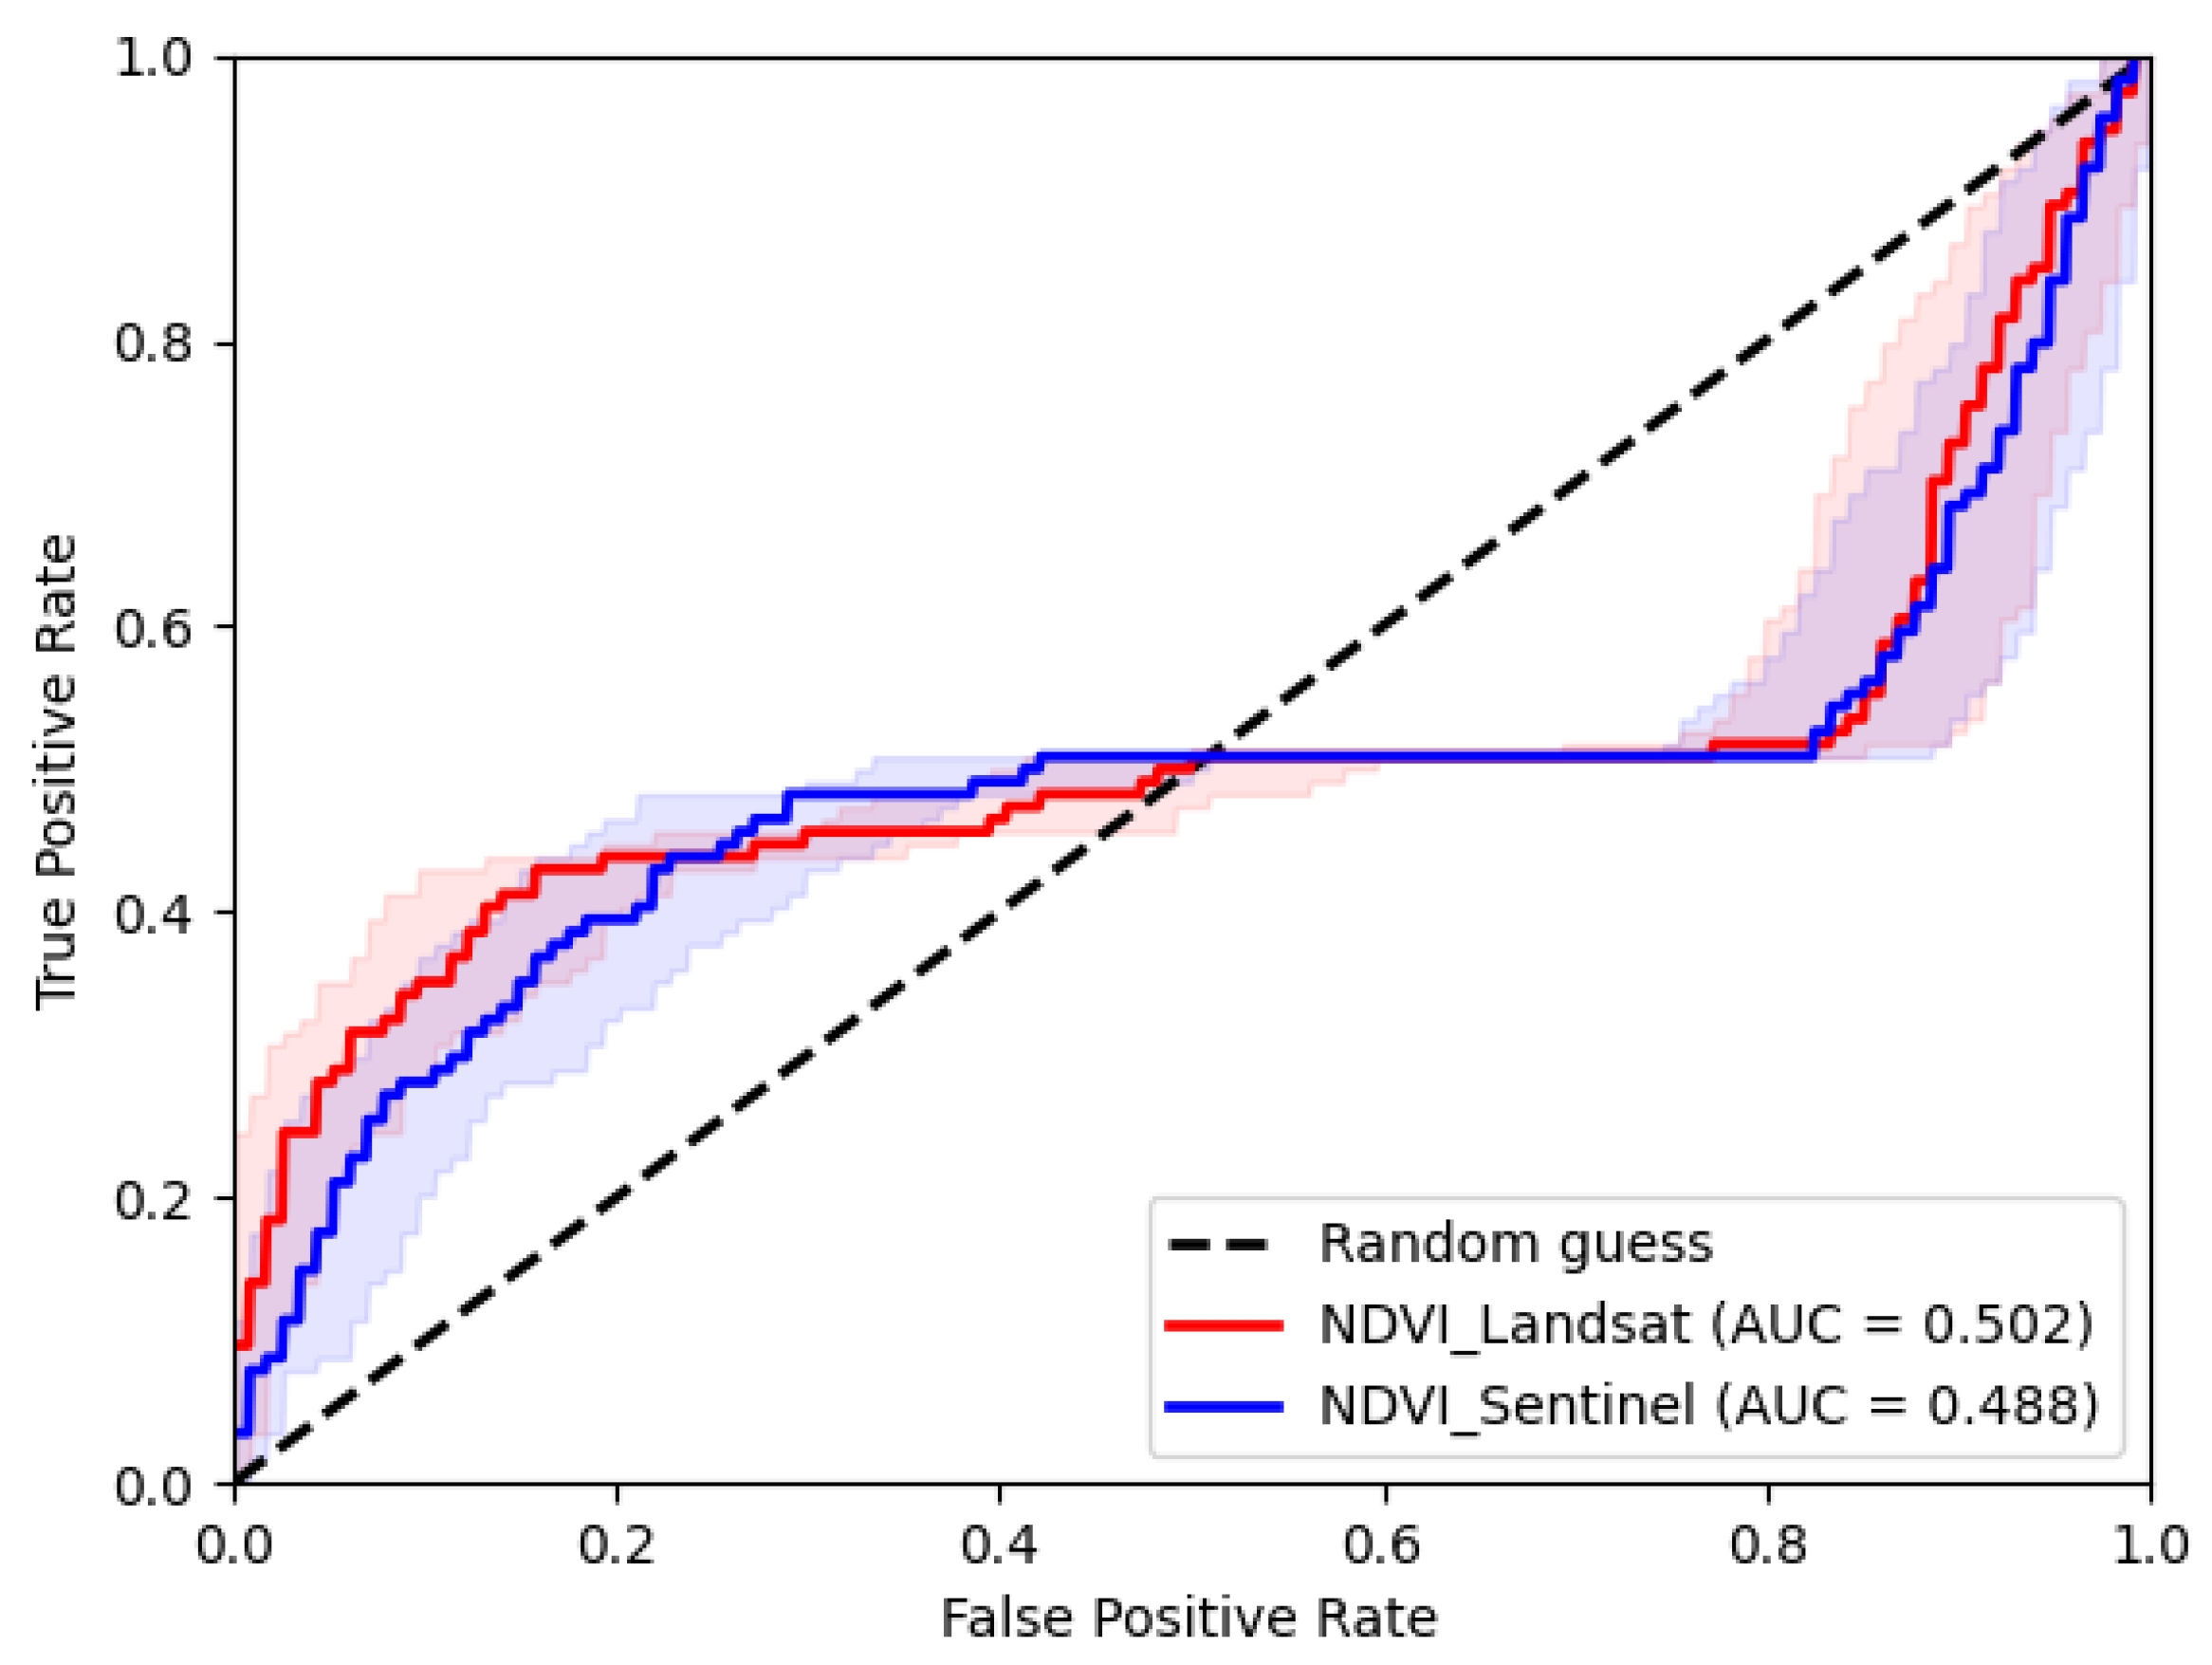
In this study, the receiver operating characteristic (ROC) curve is employed for validation purposes, as it is suitable for conducting univariate logistic analysis [53]. ROC is a powerful tool for evaluating model performance, and it is widely used in environmental sciences [54,55]. The area under the curve (AUC) serves as a quantitative measure for assessing predictive performance with higher values indicating better model performance [56]. This study uses the ROC curve to validate Landsat performance against Sentinel-2 by selecting 200 random points from Sentinel-2 imagery and classifying them as vegetative or water points, computing NDVI for both images, and examining the outputs using the ROC tool. ROC tool plots true positive values against false positive rates, and comparisons are made based on AUC values and flow patterns between the resultant curves.
To ensure homogeneity between Sentinel-2 and Landsat results, a comparative study was conducted as previously mentioned. Figure 3 illustrates the ROC curve performance when using Sentinel-2 to validate Landsat imagery, showing similar curve trends for both images, indicating homogeneity in model performance based on NDVI computation. The AUC values for Sentinel-2 and Landsat are nearly identical, although Sentinel-2 performs slightly better due to its higher spatial resolution, signifying consistency between the two products. Therefore, the remainder of the analysis focuses on Landsat images, as the validation results demonstrate their reliability.

4. Results

4.1. Annual Dynamics and Factors Infuencing Floating Islands

To enhance efficiency and improve analysis accuracy, the study focuses on the years 2004, 2010, 2013, 2017, and 2020, as they provide clear, cloud-free images for both annual and seasonal assessments of floating islands (Section 3.2). This study reveals a concerning presence of floating islands in the Kiira power station and Nalubaale hydropower plant every year in contrast to the Bujagali hydropower plant (see Figure 4). The Bujagali dam shows no significant impact from the islands, as indicated by the absence of mean NDVI values above 0.1. As shown in Figure 4, no NDVI values were identified by the Bujagali power plant in 2004 and 2010 since the dam was authorised and commissioned later in 2012 (Table 1). Therefore, unlike the Kiira and Nalubaale plants, the Bujagali dam is minimally affected by the floating islands.
A portion of the White Nile originates from Lake Victoria, passing through Jinja in Uganda, where the Kiira and Nalubaale dams are located, and continuing downstream through the Bujagali hydropower plant toward Lake Kyoga [57]. The Bujagali dam is located 16 km downstream of the Kiira and Nalubaale power stations, which are the primary controllers of Lake Victoria’s outflow to the White Nile [1,25,31,58]. Due to their upstream position and role as major regulators, the Kiira and Nalubaale dams attract more floating islands than the downstream Bujagali dam, acting as the initial intake points for water from Lake Victoria. Floating island constituents tend to accumulate around dam turbines and intake points [8], which explains the low mean NDVI values registered by Bujagali and the high NDVI values at Kiira and Nalubaale, indicating island infiltration. As floating islands are mostly trapped at the upriver Kiira and Nalubaale stations, the Bujagali dam is primarily impacted by water hyacinth rather than floating islands. Only the Kiira and Nalubaale power stations are further analysed, as they meet the threshold value for floating islands (0.1) and have been operational for the past 20 years.
The Kiira power station ( 726 m × 380 m ) suffered more impact from floating islands in previous years compared to Nalubaale, despite their parallel existence [8,59] (Figure 4). The Nalubaale dam has a larger coverage than the Kiira power station and diverts water to Kiira through a narrow 1.6 km canal [1,8,33] (Table 1). The high concentration of floating islands at Kiira is due to their tendency to accumulate in concentrated areas such as canal entrances rather than open areas, as noted by [16]. Floating islands from Nalubaale are mainly diverted to the Kiira dam, which has proper control mechanisms installed. In 2020, the mean NDVI value of Nalubaale surpassed Kiira (see Figure 4) reflecting Eskom Uganda Limited’s (EUL) report that larger island masses were docked at Nalubaale due to rising water levels, forcing a shift in power generation to Kiira station to reduce damage risks [60].
Figure 5a,b show the correlation between rainfall variations and the solidity of floating islands at Nalubaale and Kiira dams, respectively. Due to their close spatial locations and parallel operation, both dams receive the same annual rainfall [31] and experience similar infestation rates. As seen in Figure 5a, the rate of island infestation at Nalubaale hydropower station decreased from 2010 to 2013 and increased again up to 2020.
The Kiira power station exhibits a similar pattern to Nalubaale, but despite increased precipitation between 2017 and 2020, a decline in mean NDVI values is observed, which is possibly due to the manual removal initiatives of floating islands in Lake Victoria [37]. Excluding 2020 from the correlation analysis, due to island removal, results in a higher correlation of 0.7, as shown in Figure 5b. Overall, the rise and fall behavioral pattern of floating islands in the power stations aligns with precipitation margins, resulting in high correlations for both dams.
Due to the significant impact of precipitation on the islands, as evidenced by high correlations of 0.8 and 0.7 for the Nalubaale and Kiira dams, respectively, it was important to investigate the dynamics of precipitation changes. A decrease in annual precipitation margins is observed between 2010 and 2013, leading to reduced island contamination (see Figure 4). This drop is attributed to climate variability in Lake Victoria, specifically the 2012–2013 La Niña event, as noted by [61,62]. The sharp increase in precipitation values from 2013 is due to the 2015–2016 El Niño events experienced within the region [63,64]. In addition, Figure 5c,d demonstrate a high correlation between Lake Victoria’s water level and the infestation of floating islands.

4.2. Seasonal Dynamics and Factors Influencing Floating Islands

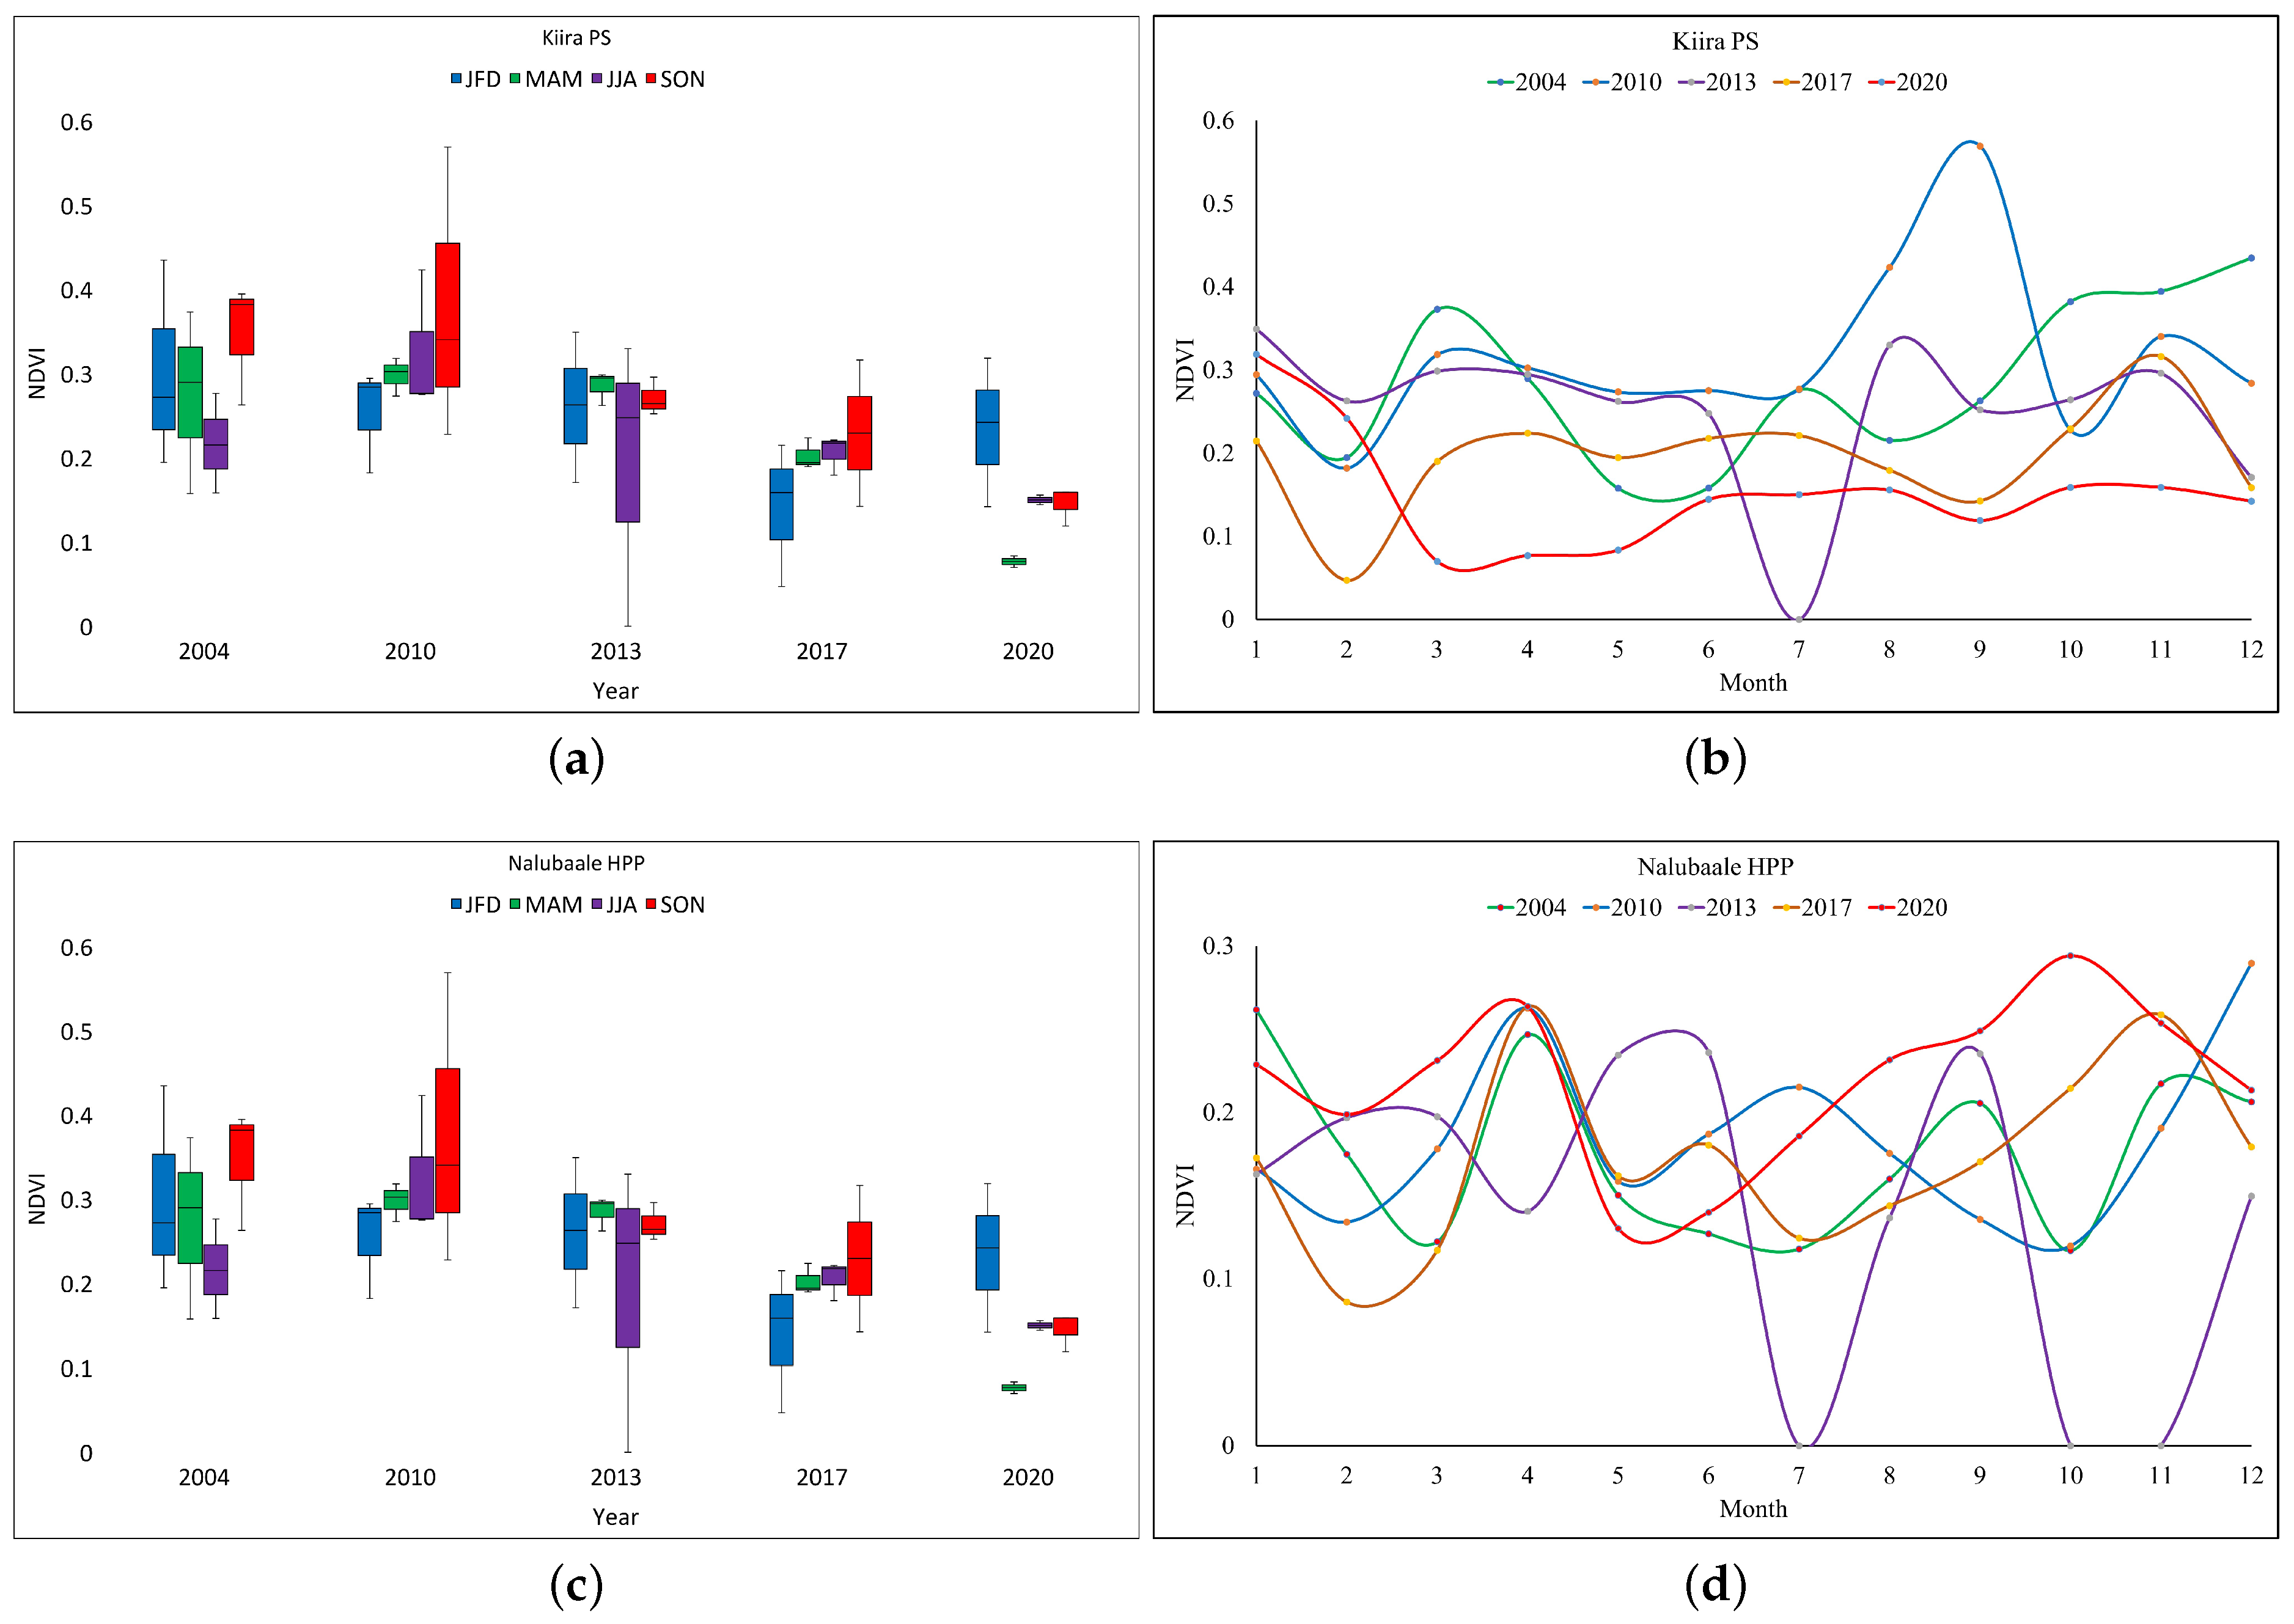
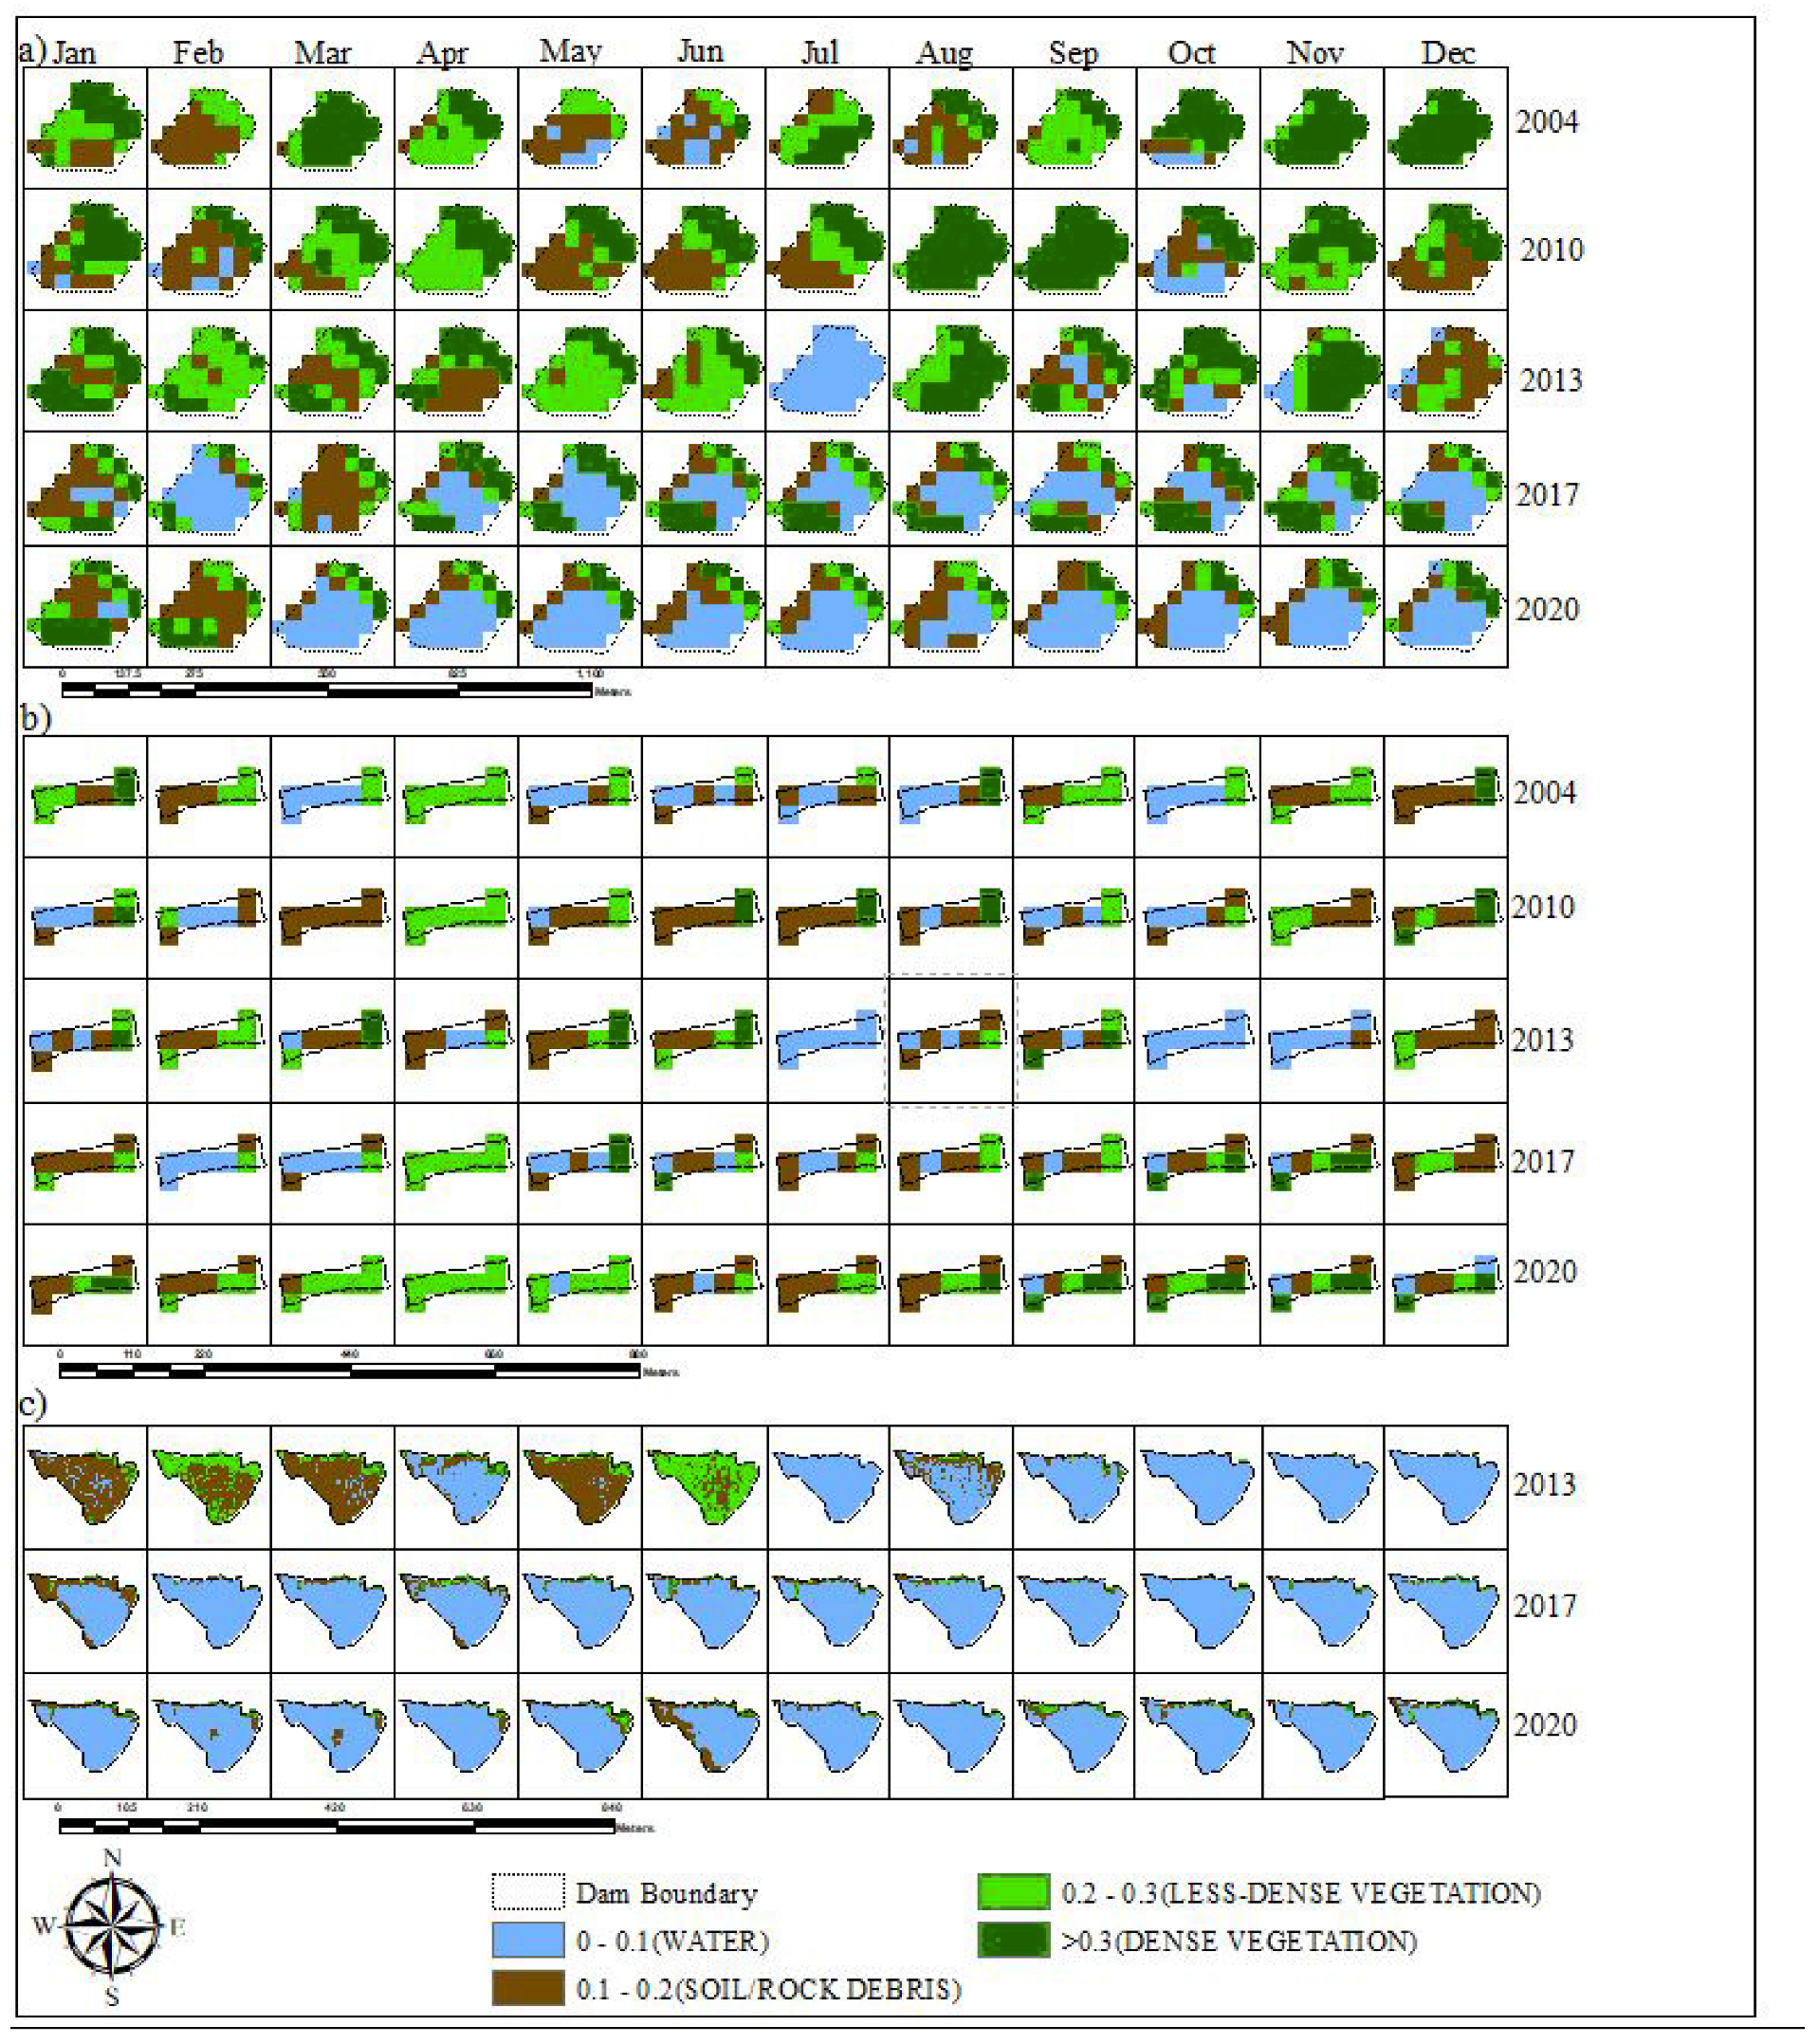
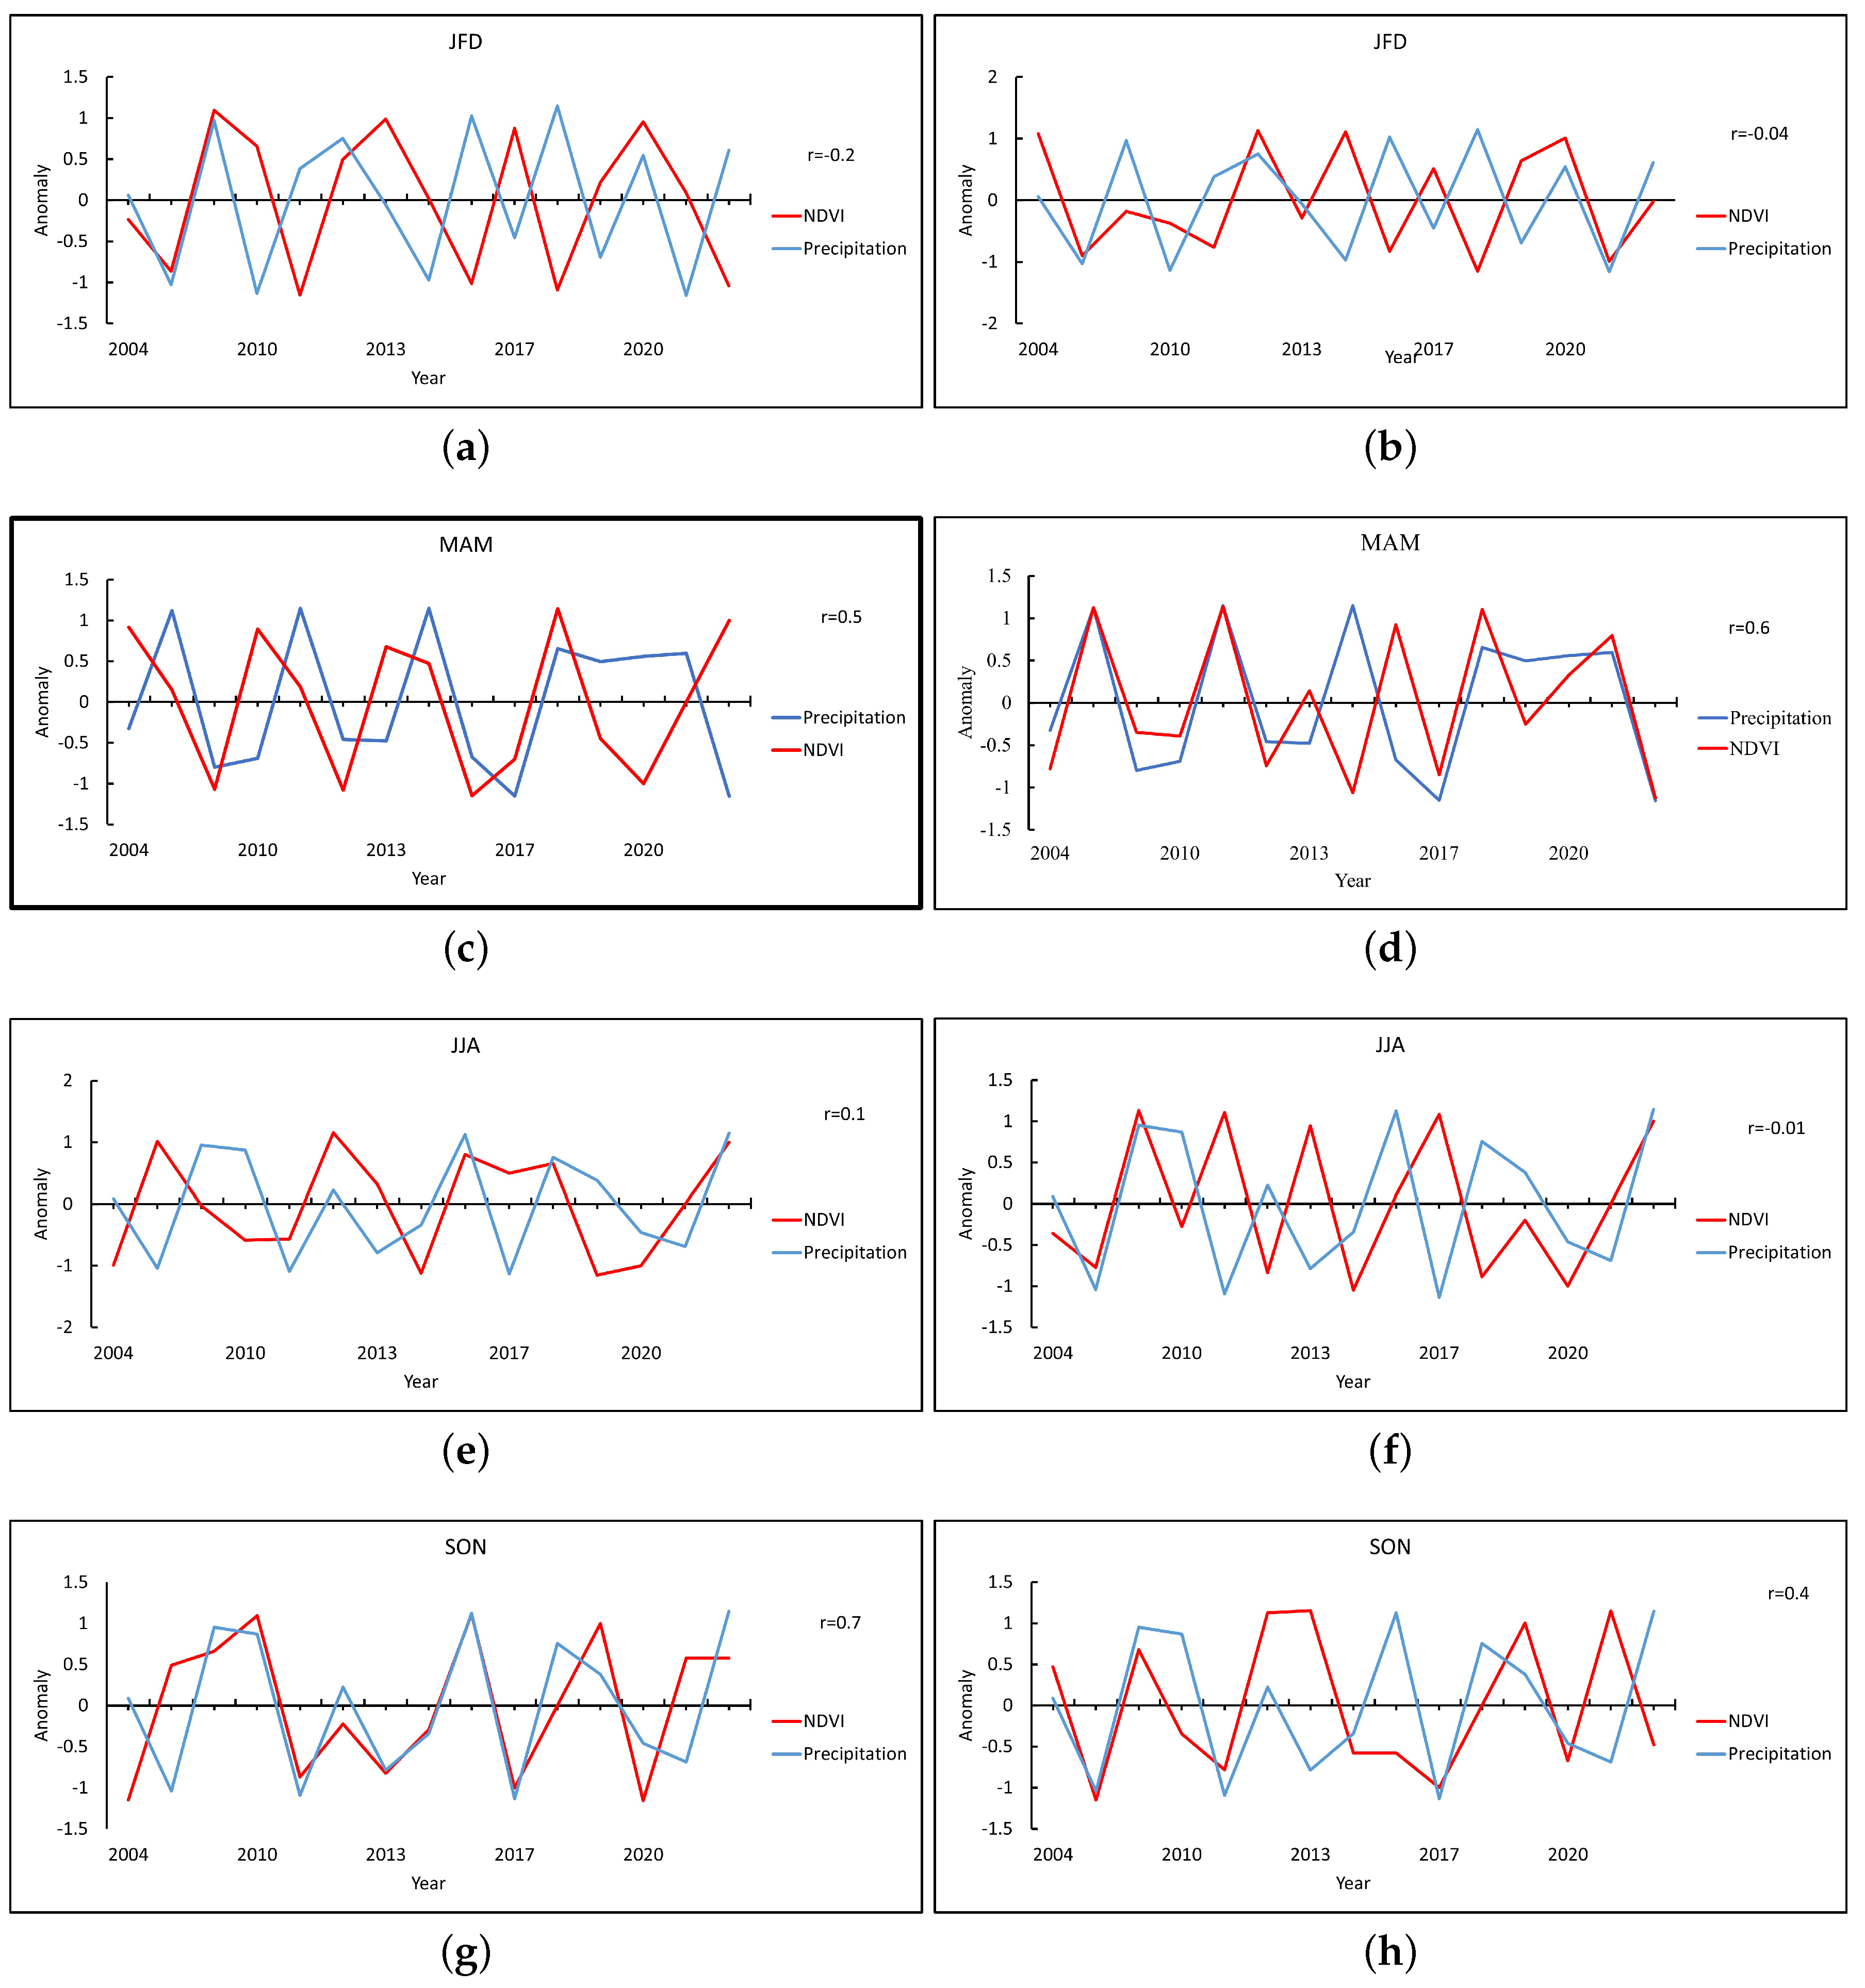
To better comprehend the temporal dynamics of floating islands, this study examines their behaviour in relation to the seasonal climate within the Lake Victoria basin. The distribution of islands across the region’s seasons can be observed in Figure 6 and Figure 7. Generally, the islands are present throughout the year in both power stations, as most months register a mean NDVI value of 0.1, which is the threshold set for floating islands as outlined in Section 3.2.2. As such, completely clear water is rarely observed.
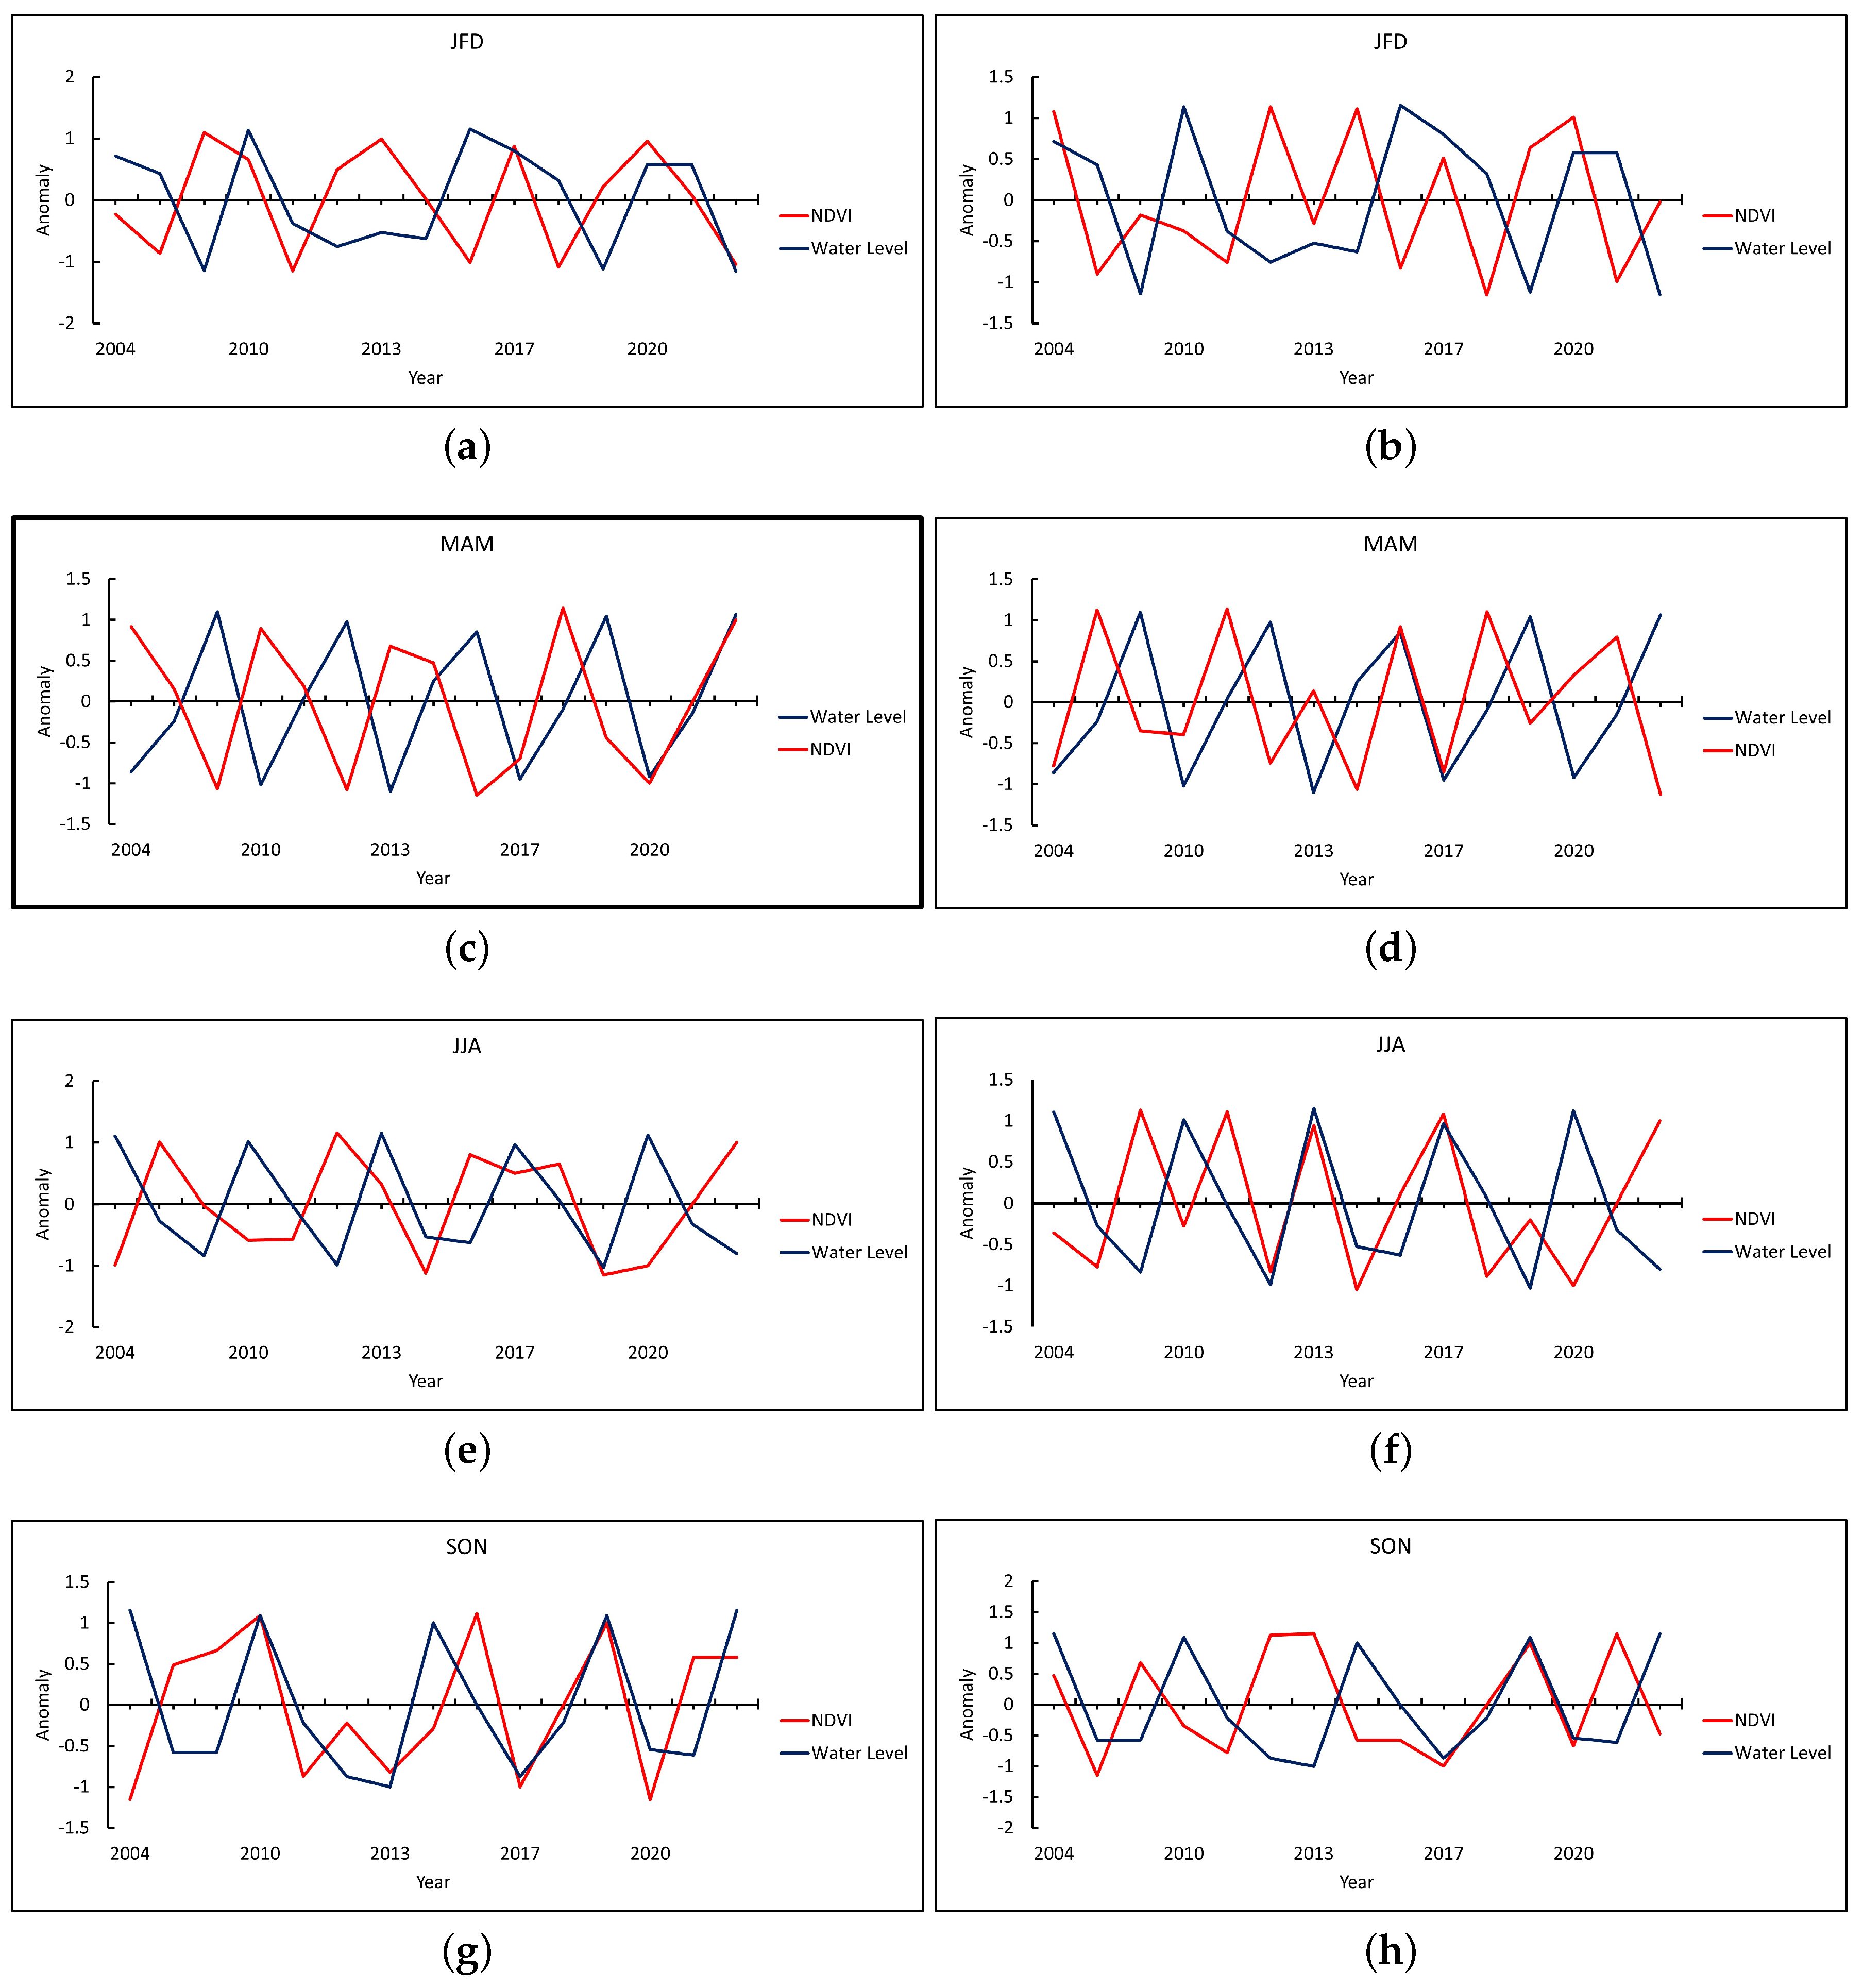
Floating islands exhibit a strong correlation with precipitation and Lake Victoria’s water level, as shown in Figure 5. The Lake Victoria basin experiences complex and obscure rainfall patterns, with no month considered dry [31,65]. As discussed in Section 2, and highlighted by [15,66], only large islands can significantly impact hydropower production by obstructing turbines and garbage frames at power stations. Small or isolated floating islands typically do not have a substantial effect on hydropower output [8]. In this study, the impact of floating islands on hydropower production is primarily determined by the islands’ eutrophication density, as indicated by mean NDVI values close to, equal to, or greater than 0.2, which predominantly occur between March–May and September–November (Figure 6 and Figure 7). These periods coincide with the long and short rainy seasons, while lower mean NDVI values in other months indicate less significant impacts. To examine the differences in island dynamics between wet and relatively dry seasons (June–August and December–January), monthly data were collected and analyzed throughout the year. The threshold value of 0.1, as discussed in Section 3.2.2, was used as a basis for comparison. In 2020, lower values were observed during the wet seasons at both Kiira and Nalubaale power stations due to manual removal efforts implemented that year [60].

4.2.1. Seasonal Precipitation and Impact on Floating Islands

Figure 8 presents the correlation between precipitation and floating islands for the four seasons in the study area. As mentioned in Section 5.1, there is a significant correlation between floating islands and precipitation, as increased surface runoff supplies phosphorus and nitrogen necessary for vegetation growth on the islands. This correlation is stronger during the short rain (SON) (Figure 8g) and long rain seasons (MAM) (Figure 8c,d). The inter-tropical convergence zone (ITCZ) primarily drives Lake Victoria’s seasonal climate, passing over the lake twice a year and resulting in bimodal rainfall patterns consisting of long rains (March–May) and short rains (September–November) [3,67]. High precipitation during these seasons leads to a significant presence of floating islands (Figure 6 and Figure 7). Conversely, low correlation values are observed between precipitation and floating islands during JFD (Figure 8a,b) and JJA (Figure 8e,f). Several studies identify these months as typically dry within the basin (e.g., [47,59,68,69,70]). The dry seasons are characterized by reduced rainfall [69]. Due to decreased precipitation during these seasons, floating islands are less prevalent compared to wetter seasons.

4.2.2. Seasonal Water Level and Its Impact on the Floating Islands

Similar to precipitation, the water level also shows a strong correlation with floating islands during MAM (Figure 9c,d) and SON (Figure 9g,h). However, a one-month lag exists between the water level and NDVI during these seasons. This indicates that the effect of water level on floating islands occurs before their formation, and the impact becomes evident a month later. Consequently, a high correlation between water level and floating islands is observed, particularly with a one-month lag (Table 3).

4.2.3. Wind and Its Impacts on the Floating Islands

Figure 10 presents the directional motion of the floating islands within the power stations across distinct selected periods. The centroids are the central points of the floating islands and are symbolised based on the size of the mats at different months within the selected years inside the boundaries of the power stations. Identified patterns are based on observed floating islands’ changes throughout the year in Figure 7, selecting perceptible and clear behavioural transformations. In this study, the behavioural patterns shown in Figure 10 are attributed to the wind variations in the Lake Victoria region [71].

4.3. Impact of Floating Islands on Power Production

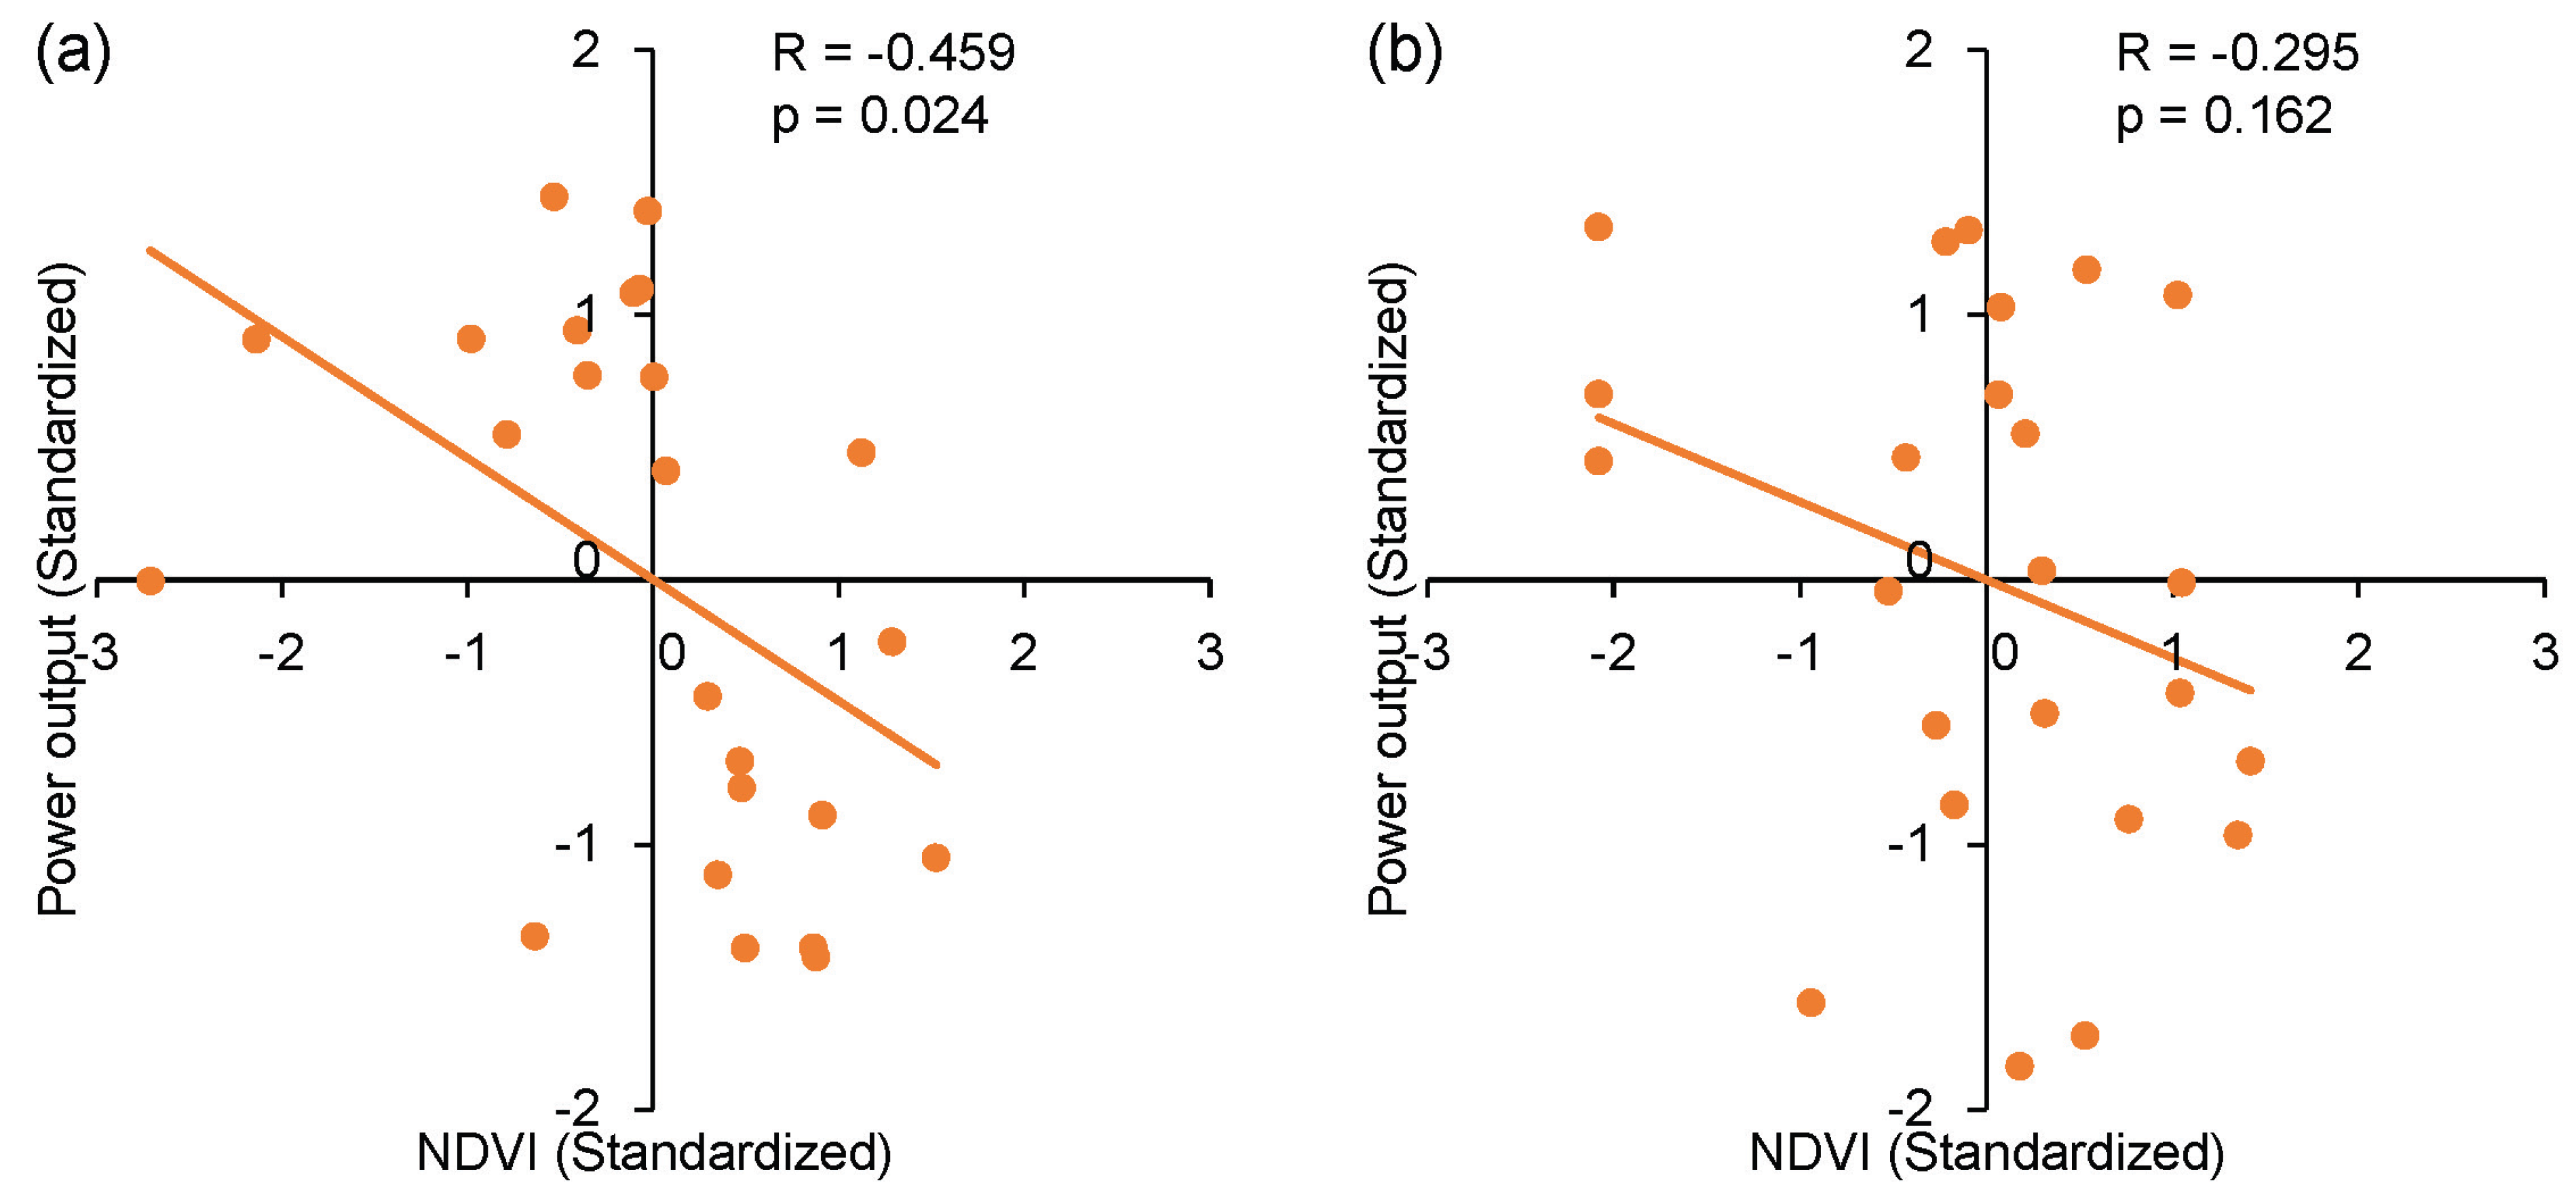
Figure 11 shows the relationships between floating island presence and power production at the Kiira power station and Nalubaale hydropower plant in 2013 and 2017. A significant negative correlation is observed between NDVI and power production at the Kiira power station, with a correlation coefficient of 0.459 ( p < 0.05 ). Conversely, a negative yet moderately low correlation is found at the Nalubaale hydropower plant, with a coefficient of 0.295 (p = 0.162). The negative associations between NDVI and power production suggest that floating islands may contribute to reduced power output at both power stations.

5. Discussion

5.1. Precipitation’s Impact on the Dynamics of the Floating Islands

The results of the study reveal significant variability in floating islands between years of high and low precipitation. During low precipitation years, floating islands are less prominent, while high precipitation leads to increased infestations in dams, which aligns with findings from [12,16]. As discussed in Section 1, floating islands consist of various floating vegetation and debris from rocks and soil. Floating vegetation growth can be affected by two primary factors: the first is precipitation and nutrient availability, and the second is urbanisation’s contribution to water pollution.
First, water availability is less significant in analysing eutrophication, as floating vegetation growth is primarily influenced by the availability of nutrients such as phosphorus and nitrogen [72,73]. High precipitation impacts vegetation growth on the islands, which is likely due to increased nutrient supply from nearby agricultural areas through higher runoff and river flow during wetter periods [74]. Conversely, reduced precipitation results in shrinking floating island vegetation, as there are fewer nutrients and lower surface runoff and river flow to support vegetation growth and transport debris into the water surrounding the dams.
In addition, urbanisation trends contribute to water pollution and floating vegetation blooms in reservoirs by providing nutrients for vegetation growth [75,76]. In this study, high rainfall periods result in an excess drainage of municipal waste and industrial discharges from the surrounding Jinja town, Uganda, into Lake Victoria and the White Nile, promoting vegetation growth within floating islands, as highlighted by [77,78,79]. Refs. [80,81] found high concentrations of floating vegetation in freshwaters due to rapid growth caused by nutrient deposits, particularly during wet periods. The combination of thriving floating vegetation and debris from surrounding banks leads to the accumulation of floating islands around power stations during high surface runoff and increased river flow [8].

5.2. Lake Victoria’s Water Level and Its Impacts on the Dynamics of the Floating Islands

The significant correlation between fluctuations in water levels and floating islands supports the findings of [82], which show a strong positive correlation between floating vegetation and water level fluctuations. Water level intake by reservoirs determines water level fluctuations, as exemplified by the Kiira and Nalubaale power stations [31]. Rising water levels can increase wave action and strong water currents, leading to the propagation and inflow of vegetation from the banks of the lake [5,82]. Floating vegetation, such as water hyacinth within the islands, responds to seasonal and annual water level fluctuations [5,82]. Water levels may affect floating islands through the following two stages.
First, rising water levels result in increased force of water flow, causing soil erosion around the banks of lakes and rivers [83]. Several studies have investigated riverbank stability concerning water level fluctuations [84,85,86,87,88,89]. Ref. [8] mentions that both the Kiira and Nalubaale power stations face dam safety issues, including inadequate rock cover near the banks, insufficient flood protection works, and lack of proper soil erosion mitigation mechanisms. Rising water levels can increase floods or wave action, leading to more soil erosion, slope collapse, and beaching effects.
Next, slope collapses and excessive soil erosion along the banks, caused by rising water levels, result in the deposit of debris into the lake region surrounding the power stations. Water level changes lead to the accumulation of loose soil, rock cover, and vegetation, primarily gathered from riverbanks, resulting in heavy influxes of floating island masses around reservoirs [8]. A rise in water level contributes to a substantial influx of vegetation and loose soil and rock into free-flowing water, combining to form floating islands.

5.3. Seasonal Dynamics and Factors Influencing Floating Islands

The impact of rising water levels on floating island dynamics exhibits a one-month lagged effect, with changes occurring gradually rather than immediately after water level fluctuations. Low correlations are observed during June, July, and August (JJA), which are typically the dry months of the basin (refer to Section 4.2.1). The dry patch becomes more pronounced after a lag period, indicating a reduced impact on the islands following a drop in water levels. According to [31,59], Lake Victoria’s water levels tend to rise more during the long rainy season (March, April, and May) and the short rainy season (September, October, and November) compared to other periods, as these seasons account for 80% of the lake’s recharge [31,79]. The increased rainfall during these periods leads to higher infestations of floating islands in wet seasons compared to relatively dry ones. The formation of islands due to rising or dropping water levels is discussed in Section 5.2. The finding that floating island infestations are preceded by a month’s increase in water levels can be used by hydropower policymakers in developing adaptation or management preparedness plans.

5.4. Wind’s Impact on the Dynamics of the Floating Islands

Lake Victoria’s climatology is governed by two major wind systems: the northeast and southeast trade winds [71]. The southeast winds, which gather moisture as they traverse the lake, are particularly significant, as they lead to rainfall on the western and northern shores, especially in Uganda [90]. These winds contribute to the formation and widespread distribution of floating vegetation in the lake [17]. The dynamics of the floating mats are largely influenced by the direction and strength of the regional wind [91]. Floating vegetation can be dispersed by wind across the surfaces of rivers, lakes, and reservoirs [92]. Prevailing southeast winds within Lake Victoria transport floating mats toward the northeastern parts of the lake [31,59,91,93] (see Figure 10). The movement, intensity, and pathways of the mats are strongly affected by these winds, particularly between May and August [16].
In addition, seasonal wind variations can affect the size and movement of floating islands. Figure 10 shows that the centroids were relatively larger from October to December. Similarly, in the Kiira power station, Figure 7 indicates that the islands’ vegetation covered more pixels in September, November, and December in 2004, September and November in 2010, and November 2013. Seasonal wind discrepancies impact the accumulation and ultimate confinement of biomass constituting the floating islands [93,94]. Strong southeast trade winds between September and November result in convectional storms, leading to larger islands around the Kiira power station and an increase in the lake’s water level due to higher precipitation [31,71]. Conversely, between March and May, the southeast winds carry moisture that results in heavy rainfall, which also increases the lake’s water level and attracts floating islands [1,59] (see Figure 7 and Figure 10).
Finally, wind erosion has an impact on the formation of floating islands. The dislodgement and propagation of soil and rock particles by wind contribute to the formation of floating islands around dams [95,96]. Wind erosion occurs when the wind is strong, the soil surface is vulnerable, and there is minimal protection. A study by [8] revealed alarming risks associated with inadequate soil erosion protection mechanisms around the Kiira and Nalubaale power stations. The exposure of subsiding land surfaces to strong southeast trade winds leads to the dislodgement of debris, which can combine with floating vegetation to form large floating islands, particularly in March–May and October–December, as presented in Figure 7, Figure 8 and Figure 10.

5.5. Impact of Floating Islands on Power Production

The impact of floating islands on power production in hydropower stations is discussed in Section 2. Previous studies have examined the consequences of floating islands on power stations, resulting in nationwide blackouts in Uganda [8,9,10]. For instance, at the Nalubaale station, floating islands have caused damage to generators and water coolers, necessitating shutdowns for maintenance and leading to power generation disruptions [9]. Furthermore, ref. [10] reported that a floating island obstructed water flow for power production in 2020, causing a nationwide blackout.

5.6. Future Recommendations

The frequent spatial and temporal changes of floating islands make it challenging to identify specific weeks or days when their masses increase or decrease, particularly during the onset and offset of extreme events. The low revisit frequency of LANDSAT data contributes to the difficulty in tracking these seasonal changes [97]. Future research could benefit from acquiring data with higher temporal resolution to precisely determine periods of significant changes. This can be achieved through multisource remote sensing data fusion, which combines high spatial and temporal resolution for more accurate spatiotemporal data [98].

6. Conclusions

This study investigated the spatial and temporal dynamics of floating islands impacting major dams on the White Nile from 2000 to 2020 using Landsat imagery, validated by Sentinel-2 imagery, Climate Hazard Group Infrared Precipitation with Station (CHIRPS) and Tropical Rainfall Measuring Mission (TRMM) precipitation data, and altimetry water level data. A correlation analysis was conducted to examine the influence of precipitation and water level fluctuations on floating islands, and the movement dynamics of the islands were investigated in relation to southeasterly winds. The study has the following essential findings. First, the dynamics of floating islands have impacts on power stations. Floating islands primarily affected the Kiira and Nalubaale stations, with Kiira being the most impacted. The Kiira station’s narrow canal (150 m) and human intervention to divert floating islands from Nalubaale to Kiira contributed to its increased vulnerability. Second, a set of factors have influence on the dynamics of floating islands. Annual and seasonal variations of floating islands are influenced by precipitation, water level fluctuations, and wind currents. Seasonal dominance occurs during March–May (long rains) and September–November (short rains). Increased precipitation and rising water levels contribute to the formation and propagation of floating islands. The southeasterly winds in the region play a significant role in the movement dynamics and size of the floating islands. Finally, the dynamics of floating islands have essential impacts on power production. Floating islands negatively impact power production levels at Kiira and Nalubaale power stations. A negative correlation exists between power production and the size of floating islands (Kiira: 0.5 , Nalubaale: 0.3 ). Larger islands can cause damage to generators and water coolers, leading to disruptions in power production and potential nationwide blackouts in Uganda.

Author Contributions

Conceptualization, O.O., J.A., Y.S. and A.K.; methodology, O.O., J.A. and Y.S.; software, O.O. and Y.S.; validation, O.O. and J.A.; formal analysis, O.O. and Y.S.; investigation, O.O.; resources, A.K.; data curation, O.O., J.A., Y.S. and A.K.; writing—original draft preparation, O.O., J.A. and Y.S.; writing—review and editing, O.O., J.A., Y.S. and A.K.; visualization, O.O. and Y.S.; supervision, J.A. and Y.S. All authors have read and agreed to the published version of the manuscript.

Funding

This research received no external funding.

Data Availability Statement

Data in this study are available upon request.

Conflicts of Interest

The authors declare no conflict of interest.

References

  1. Awange, J. The Nile Waters: Weighed from Space; Springer: Berlin/Heidelberg, Germany, 2021. [Google Scholar]
  2. Kayombo, S.; Jorgensen, S.; Lake Victoria. Experience and Lessons Learned Brief; International Lake Environment Committee, Lake Basin Management Initiative: Kusatsu, Japan, 2006; pp. 431–446. [Google Scholar]
  3. Awange, J.; Saleem, A.; Sukhadiya, R.; Ouma, Y.; Kexiang, H. Physical dynamics of Lake Victoria over the past 34 years (1984–2018): Is the lake dying? Sci. Total Environ. 2019, 658, 199–218. [Google Scholar] [CrossRef]
  4. Khaki, M.; Awange, J. The 2019–2020 Rise in Lake Victoria Monitored from Space: Exploiting the State-of-the-Art GRACE-FO and the Newly Released ERA-5 Reanalysis Products. Sensors 2021, 21, 4304. [Google Scholar] [CrossRef] [PubMed]
  5. Albright, T.; Moorhouse, T.; McNabb, T. The rise and fall of water hyacinth in Lake Victoria and the Kagera River Basin, 1989–2001. J. Aquat. Plant Manag. 2004, 42, 73–84. [Google Scholar]
  6. Lubovich, K. Cooperation and Competition: Managing Transboundary Water Resources in the Lake Victoria Region; Foundation for Environmental Security and Sustainability: Falls Church, Virginia, 2009. [Google Scholar]
  7. Ministry of Energy and Minerals Development. Uganda’s Sustainable Energy For All (SE4All) Initiative Action Agenda; Ministry of Energy and Minerals Development: Kampala, Uganda, 2015. [Google Scholar]
  8. Manirakiza, W.; Tumwesigye, E.; Otim, K.; Akurut, M.; Mutikanga, H. Lessons learned from dealing with climatic extreme Events-A case of L. Victoria and the White Nile Cascade. In Proceedings of the E3S Web of Conferences, Binus, Indonesia, 22–23 June 2022; Volume 346, p. 04003. [Google Scholar]
  9. Nuwagira, U.; Yasin, I. Review of the Past, Current, and the Future Trend of the Climate Change and its Impact in Uganda. East Afr. J. Environ. Nat. Resour. 2022, 5, 115–126. [Google Scholar] [CrossRef]
  10. Revocatus, T.; Arthur, M.; Adam, M. The Energy and Climate Change Nexus in Uganda: Policy Challenges and Opportunities for Climate Compatible Development. In The Nature, Causes, Effects and Mitigation of Climate Change on the Environment; Stuart, A., Ed.; IntechOpen: London, UK, 2021; pp. 339–343. [Google Scholar] [CrossRef]
  11. John, C.; Sylas, V.; Paul, J.; Unni, K. Floating islands in a tropical wetland of peninsular India. Wetl. Ecol. Manag. 2009, 17, 641–653. [Google Scholar] [CrossRef]
  12. Azza, N.; Denny, P.; van de Koppel, J.; Kansiime, F. Floating mats: Their occurrence and influence on shoreline distribution of emergent vegetation. Freshw. Biol. 2006, 51, 1286–1297. [Google Scholar] [CrossRef]
  13. Gopal, B.; Zutshi, D.; Duzer, C. Floating islands in India: Control or conserve? Int. J. Ecol. Environ. Sci. 2003, 29, 157–169. [Google Scholar]
  14. Adams, C.; Boar, R.; Hubble, D.; Gikungu, M.; Harper, D.; Hickley, P.; Tarras-Wahlberg, N. The dynamics and ecology of exotic tropical species in floating plant mats: Lake Naivasha, Kenya. In Lake Naivasha, Kenya; Harper, D., Boar, R., Everard, M., Hickley, P., Eds.; Springer: Dordrecht, The Netherlands, 2002; pp. 115–122. [Google Scholar] [CrossRef]
  15. Kangabam, R.D.; Selvaraj, M.; Govindaraju, M. Spatio-temporal analysis of floating islands and their behavioral changes in Loktak Lake with respect to biodiversity using remote sensing and GIS techniques. Environ. Monit. Assess. 2018, 190, 118. [Google Scholar] [CrossRef] [PubMed]
  16. Odongkara, K.; Kyangwa, M.; Kulyanyingi, V. Knowledge, Perceptions, Impacts and Roles of Lakeside Communities and Institutions in the Sustainable Control of Water Hyacinth; Fisheries Resources Research Institute: Murchison Bay, Uganda, 2002. [Google Scholar]
  17. Twongo, T.; Wanda, F. Management of Water Hyacinth, Eichhornia Crassipes, in Lake Victoria Basin. 2004. Available online: http://hdl.handle.net/1834/35195 (accessed on 1 December 2022).
  18. Nsubuga, F.; Botai, J.; Olwoch, J.; Rautenbach, C.; Kalumba, A.; Tsela, P.; Adeola, A.; Sentongo, A.; Mearns, K. Detecting changes in surface water area of Lake Kyoga sub-basin using remotely sensed imagery in a changing climate. Theor. Appl. Climatol. 2017, 127, 327–337. [Google Scholar] [CrossRef]
  19. Bareuther, M.; Klinge, M.; Buerkert, A. Spatio-Temporal Dynamics of Algae and Macrophyte Cover in Urban Lakes: A Remote Sensing Analysis of Bellandur and Varthur Wetlands in Bengaluru, India. Remote Sens. 2020, 12, 3843. [Google Scholar] [CrossRef]
  20. Htwe, T.N.; Brinkmann, K.; Buerkert, A. Spatio-temporal assessment of soil erosion risk in different agricultural zones of the Inle Lake region, southern Shan State, Myanmar. Environ. Monit. Assess. 2015, 187, 617. [Google Scholar] [CrossRef] [PubMed]
  21. Mukarugwiro, J.A.; Newete, S.W.; Adam, E.; Nsanganwimana, F.; Abutaleb, K.; Byrne, M.J. Mapping spatio-temporal variations in water hyacinth (Eichhornia crassipes) coverage on Rwandan water bodies using multispectral imageries. Int. J. Environ. Sci. Technol. 2021, 18, 275–286. [Google Scholar] [CrossRef]
  22. Mdone, E. Bujagali: How Not to Build a Dam through a Public-Private Partnership. 2013. Available online: https://www.nape.or.ug/news-events/latest-news/116-bujagali-how-not-to-build-a-dam-through-a-public-private-partnership (accessed on 1 December 2022).
  23. Uganda Electricity Generation Company Ltd. Kiira Power Station. 2021. Available online: https://www.uegcl.com/power-plants/kiira-power-station/ (accessed on 1 December 2022).
  24. Muhammad Lubogo, M. Knock Knock! It’s the Floating Island at Nalubaale Dam. 2020. Available online: https://www.linkedin.com/pulse/knock-its-floating-island-nalubaale-dam-muhammad-lubogo (accessed on 1 December 2022).
  25. Nduhura, A. Public Private Partnerships and Competitiveness of the Hydroelectricity Sub-Sector in Uganda: Case of Bujagali and Karuma Dam Projects. Ph.D. Thesis, North-West University, Potchefstroom, South Africa, 2019. [Google Scholar]
  26. WorldWater Assessment Programme (WWAP). Water, a Shared Responsibility: The United Nations World Water Development Report 2; United Nations Educational, Scientific and Cultural Organization (UNESCO), UN-Water: New York, NY, USA, 2006. [Google Scholar]
  27. Wardlaw, R.; Sharif, M.; Kimaite, F. Real-time hydro-power forecasting on the Victoria Nile. Proc. Inst. Civ. Eng. Water Manag. 2005, 158, 45–54. [Google Scholar] [CrossRef]
  28. Getirana, A.; Jung, H.C.; Van Den Hoek, J.; Ndehedehe, C.E. Hydropower dam operation strongly controls Lake Victoria’s freshwater storage variability. Scie. Total Environ. 2020, 726, 138343. [Google Scholar] [CrossRef] [PubMed]
  29. Riebeek, H. Lake Victoria’s Falling Waters, Earth Observatory Features. NASA, 2006. Available online: http://earthobservatory.nasa.gov/Study/Victoria/victoria.html (accessed on 1 December 2022).
  30. Mukwanason, D.E.; Kajubi, E.; Mwase, C.; Akurut, M.; Kayondo, M.; Mutikanga, H.E. Assessment of reservoir response to flood conditions to optimise hydropower operations–Isimba HPP Uganda. In Proceedings of the E3S Web of Conferences, Binus, Indonesia, 22–23 June 2022; Volume 346, p. 03016. [Google Scholar]
  31. Awange, J. Lake Victoria Monitored from Space; Springer: Berlin/Heidelberg, Germany, 2020. [Google Scholar]
  32. Donnelly, C.; Eng, P. Canadian dam association canadienne des barrages the design and construction of the Owen Falls embankments. In Proceedings of the Canadian Dam Association Annual Conference, Winnipeg, MB, Canada, 27 September–2 October 2008. [Google Scholar] [CrossRef]
  33. Kull, D. Connections Between Recent Water Level Drops in Lake Victoria, Dam Operations and Drought. 2006. Available online: http://hdl.handle.net/1834/7032 (accessed on 1 December 2022).
  34. World Bank Group. Ending Poverty and Sharing Prosperity; Global Monitoring Report; World Bank Group: Washington, DC, USA, 2013. [Google Scholar]
  35. Nanteza, J. Construction of the Visitors Centre at the Isimba Hydropower Plant. Ph.D. Thesis, Makerere University, Kampala, Uganda, 2022. [Google Scholar]
  36. Olanya, D. Dams, water and accountability in Uganda. In Land and Hydropolitics in the Nile River Basin; Routledge: London, UK, 2016; pp. 166–181. [Google Scholar]
  37. Ministry of Agriculture, Animal Industry and Fisheries. More Floating Islands Sighted by Surveillance on Lake Victoria and under Control. 2020. Available online: https://www.agriculture.go.ug/2020/04/21/more-floating-islands-sighted-by-surveillance-on-lake-victoria-and-under-control/ (accessed on 1 December 2022).
  38. Du, Y.; Zhang, Y.; Ling, F.; Wang, Q.; Li, W.; Li, X. Water Bodies’ Mapping from Sentinel-2 Imagery with Modified Normalized Difference Water Index at 10-m Spatial Resolution Produced by Sharpening the SWIR Band. Remote Sens. 2016, 8, 354. [Google Scholar] [CrossRef]
  39. Drusch, M.; Del Bello, U.; Carlier, S.; Colin, O.; Fernandez, V.; Gascon, F.; Hoersch, B.; Isola, C.; Laberinti, P.; Martimort, P.; et al. Sentinel-2: ESA’s Optical High-Resolution Mission for GMES Operational Services. Remote Sens. Environ. 2012, 120, 25–36. [Google Scholar] [CrossRef]
  40. Lu, D.; Mausel, P.; Moran, E.F. Change detection techniques. Int. J. Remote Sens. 2004, 25, 2365–2401. [Google Scholar] [CrossRef]
  41. Ullah, W.; Wang, G.; Ali, G.; Hagan, D.; Bhatti, A.; Lou, D. Comparing Multiple Precipitation Products against In-Situ Observations over Different Climate Regions of Pakistan. Remote Sens. 2019, 11, 628. [Google Scholar] [CrossRef]
  42. Funk, C.; Peterson, P.L.; Landsfeld, M.; Pedreros, D.; Verdin, J.; Shukla, S.; Husak, G.; Rowland, J.; Harrison, L.; Hoell, A.; et al. The climate hazards infrared precipitation with stations-a new environmental record for monitoring extremes. Sci. Data 2015, 2, 150066. [Google Scholar] [CrossRef]
  43. Kummerow, C.; Barnes, W.; Kozu, T.; Shiue, J.; Simpson, J. The tropical rainfall measuring mission (TRMM) sensor package. J. Atmos. Ocean. Technol. 1998, 15, 809–817. [Google Scholar] [CrossRef]
  44. Liu, Z.; Ostrenga, D.; Teng, W.; Kempler, S. Tropical Rainfall Measuring Mission (TRMM) Precipitation Data and Services for Research and Applications. Bull. Am. Meteorol. Soc. 2012, 93, 1317–1325. [Google Scholar] [CrossRef]
  45. Huffman, G.J.; Bolvin, D.T.; Nelkin, E.J.; Wolff, D.B.; Adler, R.F.; Gu, G.; Hong, Y.; Bowman, K.P.; Stocker, E.F. The TRMM multisatellite precipitation analysis (TMPA): Quasi-global, multiyear, combined-sensor precipitation estimates at fine scales. J. Hydrometeorol. 2007, 8, 38–55. [Google Scholar] [CrossRef]
  46. Puissant, A.; Catry, T.; Cresson, R.; Dessay, N.; Demagistri, L.; Gadal, S.; Le Bris, A.; Ose, K.; Pillot, B. Products and services of the urban THEIA Scientific Expertise Centre. In Proceedings of the Proceedings of the ESA Living Planet Symposium 2022, Bonn, Germany, 23–27 May 2022. [Google Scholar]
  47. Nicholson, S.; Klotter, D. Assessing the Reliability of Satellite and Reanalysis Estimates of Rainfall in Equatorial Africa. Remote Sens. 2021, 13, 3609. [Google Scholar] [CrossRef]
  48. Chavez, P. Image-Based Atmospheric Corrections-Revisited and Improved. Photogramm. Eng. Remote Sens. 1996, 62, 1025–1036. [Google Scholar]
  49. Hashim, H.; Abd, L.Z.; Adnan, N.A. Urban vegetation classification with NDVI threshold value method with very high resolution (VHR) Pleiades imagery. Int. Arch. Photogramm. Remote Sens. Spat. Inf. Sc. 2019, 42, 237–240. [Google Scholar] [CrossRef]
  50. Nguyen, H.; Hardy, G.; Le, T.; Nguyen, H.; Nguyen, H.; Nguyen, T.; Dell, B. Mangrove Forest Landcover Changes in Coastal Vietnam: A Case Study from 1973 to 2020 in Thanh Hoa and Nghe An Provinces. Forests 2021, 12, 637. [Google Scholar] [CrossRef]
  51. Zhao, Q.; Ma, X.; Liang, L.; Yao, W. Spatial-Temporal Variation Characteristics of Multiple Meteorological Variables and Vegetation over the Loess Plateau Region. Appl. Sci. 2020, 10, 1000. [Google Scholar] [CrossRef]
  52. Saleem, A.; Awange, J. Coastline shift analysis in data deficient regions: Exploiting the high spatio-temporal resolution Sentinel-2 products. Catena 2019, 179, 6–19. [Google Scholar] [CrossRef]
  53. Salvianti, F.; Pinzani, P.; Verderio, P.; Ciniselli, C.; Massi, D.; De Giorgi, V.; Grazzini, M.; Pazzagli, M.; Orlando, C. Multiparametric Analysis of Cell-Free DNA in Melanoma Patients. PLoS ONE 2012, 7, e49843. [Google Scholar] [CrossRef] [PubMed]
  54. Alatorre, L.; Beguería, S. Identification of eroded areas using remote sensing in a badlands landscape on marls in the central Spanish Pyrenees. CATENA 2009, 76, 182–190. [Google Scholar] [CrossRef]
  55. Beguería, S. Validation and Evaluation of Predictive Models in Hazard Assessment and Risk Management. Nat. Hazards 2006, 37, 315–329. [Google Scholar] [CrossRef]
  56. Pradhan, B.; Seeni, M.; Kalantar, B. Performance Evaluation and Sensitivity Analysis of Expert-Based, Statistical, Machine Learning, and Hybrid Models for Producing Landslide Susceptibility Maps. In Laser Scanning Applications in Landslide Assessment; Pradhan, B., Ed.; Springer International Publishing: Cham, Switzerland, 2017; pp. 193–232. [Google Scholar]
  57. Hurst, H.; Edwin, S.; Charles, G.; El-Kammash, M.M.; Nile River. Encyclopedia Britannica. 2022. Available online: https://www.britannica.com/place/Nile-River (accessed on 1 December 2022).
  58. CWE. 183MW Isimba HPP Basic Design Report-Hydrology and Hydraulic Energy; China International Water & Electricity Corporation (CWE): Kampala, Uganda, 2014. [Google Scholar]
  59. Vanderkelen, I.; van Lipzig, N.; Thiery, W. Modelling the water balance of Lake Victoria (East Africa)—Part 1: An Observational analysis. Hydrol. Earth Syst. Sci. 2018, 22, 5509–5525. [Google Scholar] [CrossRef]
  60. Eskom Uganda Limited. Floating Island at Nalubaale Power Station. 2020. Available online: https://www.eskom.co.ug/sites/default/files/2020-07/Press%20Statement%20-16th%20April%202020.%20Rev.pdf (accessed on 12 September 2020).
  61. Johnson, N. How many ENSO flavours can we distinguish? J. Clim. 2013, 26, 4816–4827. [Google Scholar] [CrossRef]
  62. Hoell, A.; Funk, C.; Zinke, J.; Harrison, L. Modulation of the Southern Africa precipitation response to the El Niño Southern Oscillation by the subtropical Indian Ocean Dipole. Clim. Dyn. 2017, 48, 2529–2540. [Google Scholar] [CrossRef]
  63. Morgan, B.; Awange, J.L.; Saleem, A.; Kexiang, H. Understanding vegetation variability and their “hotspots” within Lake Victoria Basin (LVB: 2003–2018). Appl. Geogr. 2020, 122, 102238. [Google Scholar] [CrossRef]
  64. Setimela, P.; Gasura, E.; Thierfelder, C.; Zaman-Allah, M.; Cairns, J.; Boddupalli, P. When the going gets tough: Performance of stress tolerant maize during the 2015/16 (El Niño) and 2016/17 (La Niña) season in southern Africa. Agric. Ecosyst. Environ. 2018, 268, 79–89. [Google Scholar] [CrossRef]
  65. Ntale, H.; Gan, T. East African rainfall anomaly patterns in association with El Nino/Southern Oscillation. J. Hydrol. Eng. 2004, 9, 257–268. [Google Scholar] [CrossRef]
  66. Van der Zaag, P.; Van Dam, A.; Meganck, R. Looking in the Mirror: How Societies Learn from Their Dependence on Large Lakes; Stockholm World Water Week: Stockholm, Sweden, 2006. [Google Scholar]
  67. Nicholson, S. Climate and climatic variability of rainfall over eastern Africa. Rev. Geophys. 2017, 55, 590–635. [Google Scholar] [CrossRef]
  68. Roegner, A.; Sitoki, L.; Weirich, C.; Corman, J.; Owage, D.; Umami, M.; Odada, E.; Miruka, J.; Ogari, Z.; Smith, W.; et al. Harmful Algal Blooms Threaten the Health of Peri-Urban Fisher Communities: A Case Study in Kisumu Bay, Lake Victoria, Kenya. Expo. Health 2020, 12, 835–848. [Google Scholar] [CrossRef]
  69. Onyutha, C.; Tabari, H.; Rutkowska, A.; Nyeko-Ogiramoi, P.; Willems, P. Comparison of different statistical downscaling methods for climate change rainfall projections over the Lake Victoria basin considering CMIP3 and CMIP5. J.-Hydro-Environ. Res. 2016, 12, 31–45. [Google Scholar] [CrossRef]
  70. Awange, J.; Aluoch, J.; Ogalo, L.; Omulo, M.; Omondi, P. Frequency and severity of drought in the Lake Victoria region (Kenya) and its effects on food security. Clim. Res. 2007, 33, 135–142. [Google Scholar] [CrossRef]
  71. Bugenyi, F.; Magumba, K. The present physicochemical ecology of Lake Victoria, Uganda. In The Limnology, Climatology and Paleoclimatology of the East African Lakes; Routledge: London, UK, 2019; pp. 141–154. [Google Scholar]
  72. You, W.; Yu, D.; Xie, D.; Yu, L.; Xiong, W.; Han, C. Responses of the invasive aquatic plant water hyacinth to altered nutrient levels under experimental warming in China. Aquat. Bot. 2014, 119, 51–56. [Google Scholar] [CrossRef]
  73. Wilson, J.; Holst, N.; Rees, M. Determinants and patterns of population growth in water hyacinth. Aquat. Bot. 2005, 81, 51–67. [Google Scholar] [CrossRef]
  74. Thamaga, K.; Dube, T. Understanding seasonal dynamics of invasive water hyacinth (Eichhornia crassipes) in the Greater Letaba river system using Sentinel-2 satellite data. GIScience Remote Sens. 2019, 56, 1355–1377. [Google Scholar] [CrossRef]
  75. Kleinschroth, F.; Winton, R.S.; Calamita, E.; Niggemann, F.; Botter, M.; Wehrli, B.; Ghazoul, J. Living with floating vegetation invasions. Ambio 2021, 50, 125–137. [Google Scholar] [CrossRef]
  76. Janssens, N.; Schreyers, L.; Biermann, L.; van der Ploeg, M.; Bui, T.K.L.; van Emmerik, T. Rivers running green: Water hyacinth invasion monitored from space. Environ. Res. Lett. 2022, 17, 044069. [Google Scholar] [CrossRef]
  77. Oguttu, H.; Bugenyi, F.; Leuenberger, H.; Wolf, M.; Bachofen, R. Pollution menacing Lake Victoria: Quantification of point sources around Jinja Town, Uganda. Water SA 2008, 34, 89–98. [Google Scholar] [CrossRef]
  78. Naigaga, I.; Kaiser, H.; Muller, W.J.; Ojok, L.; Mbabazi, D.; Magezi, G.; Muhumuza, E. Fish as bioindicators in aquatic environmental pollution assessment: A case study in Lake Victoria wetlands, Uganda. Phys. Chem. Earth 2011, 36, 918–928. [Google Scholar] [CrossRef]
  79. Awange, J.; Ong’ang’a, O. Lake Victoria: Ecology, Resources, Environment; Springer: Berlin/Heidelberg, Germany, 2006. [Google Scholar]
  80. Ruiz, T.; López, E.; Granado, G.; Pérez, E.; Morán-López, R.; Guzman, J. The Water Hyacinth, Eichhornia crassipes: An invasive plant in the Guadiana River Basin (Spain). Aquat. Invasions 2008, 3, 42–53. [Google Scholar]
  81. Waltham, N.; Fixler, S. Aerial Herbicide Spray to Control Invasive Water Hyacinth (Eichhornia crassipes): Water Quality Concerns Fronting Fish Occupying a Tropical Floodplain Wetland. Trop. Conserv. Sci. 2017, 10, 1–10. [Google Scholar] [CrossRef]
  82. Dersseh, M.; Tilahun, S.; Worqlul, A.; Moges, M.; Abebe, W.; Mhiret, D.; Melesse, A. Spatial and Temporal Dynamics of Water Hyacinth and Its Linkage with Lake-Level Fluctuation: Lake Tana, a Sub-Humid Region of the Ethiopian Highlands. Water 2020, 12, 1435. [Google Scholar] [CrossRef]
  83. Duong Thi, T.; Do Minh, D. Riverbank Stability Assessment under River Water Level Changes and Hydraulic Erosion. Water 2019, 11, 2598. [Google Scholar] [CrossRef]
  84. Samadi, A.; Davoudi, M.; Amiri-Tokaldany, E. Experimental Study of Cantilever Failure in the Upper Part of Cohesive Riverbanks. Res. J. Environ. Sci. 2011, 5, 444–460. [Google Scholar] [CrossRef]
  85. Samadi, A.; Amiri-Tokaldany, E.; Davoudi, M.; Darby, S. Experimental and numerical investigation of the stability of overhanging riverbanks. Geomorphology 2013, 184, 1–19. [Google Scholar] [CrossRef]
  86. Lai, Y.G.; Thomas, R.E.; Ozeren, Y.; Simon, A.; Greimann, B.P.; Wu, K. Modeling of multilayer cohesive bank erosion with a coupled bank stability and mobile-bed model. Geomorphology 2015, 243, 116–129. [Google Scholar] [CrossRef]
  87. Yu, M.H.; Wei, H.Y.; Wu, S.B. Experimental study on the bank erosion and interaction with near-bank bed evolution due to fluvial hydraulic force. Int. J. Sediment Res. 2015, 30, 81–89. [Google Scholar] [CrossRef]
  88. Patsinghasanee, S.; Kimura, I.; Shmizu, Y. Experimental and numerical study on overhanging failure of river bank. J. Jpn. Soc. Civ. Eng. Ser. (Hydraulic Eng.) 2015, 71, I127–I132. [Google Scholar] [CrossRef]
  89. Patsinghasanee, S.; Kimura, I.; Shmizu, Y.; Nabi, M.; Chub-uppakarn, T. Coupled studies of fluvial erosion and cantilever failure for cohesive riverbanks: Case studies in the experimental flumes and U-Tapao River. J.-Hydro-Environ. Res. 2017, 16, 13–26. [Google Scholar] [CrossRef]
  90. Awange, J.; Sharifi, M.; Ogonda, G.; Wickert, J.; Grafarend, E.; Omulo, M. The Falling Lake Victoria Water Level: GRACE, TRIMM and CHAMP Satellite Analysis of the Lake Basin. Water Resour. Manag. 2008, 22, 775–796. [Google Scholar] [CrossRef]
  91. Kulyanyingi, V. Economic Losses/Gains Attributed to the Water Hyacinth. 2002. Available online: http://hdl.handle.net/1834/32957 (accessed on 1 December 2022).
  92. Yan, S.; Song, W.; Guo, J. Advances in management and utilization of invasive water hyacinth (Eichhornia crassipes) in aquatic ecosystems—A review. Crit. Rev. Biotechnol. 2017, 37, 218–228. [Google Scholar] [CrossRef]
  93. Twongo, T.; Bugenyi, F. Current Status of the Water Hyacinth Problem in Uganda. 1998. Available online: http://hdl.handle.net/1834/34479 (accessed on 1 December 2022).
  94. Nyawacha, S.; Meta, V.; Osio, A. Spatial temporal mapping of spread of water hyacinth in Winum Gulf, Lake Victoria. Int. Arch. Photogramm. Remote Sens. Spat. Inf. Sci. 2021, 43, 341–346. [Google Scholar] [CrossRef]
  95. Fenta, A.A.; Tsunekawa, A.; Haregeweyn, N.; Poesen, J.; Tsubo, M.; Borrelli, P.; Panagos, P.; Vanmaercke, M.; Broeckx, J.; Yasuda, H.; et al. Land susceptibility to water and wind erosion risks in the East Africa region. Sci. Total Environ. 2020, 703, 135016. [Google Scholar] [CrossRef] [PubMed]
  96. Kebede, Y.S.; Endalamaw, N.T.; Sinshaw, B.G.; Atinkut, H.B. Modeling soil erosion using RUSLE and GIS at watershed level in the upper beles, Ethiopia. Environ. Chall. 2021, 2, 100009. [Google Scholar] [CrossRef]
  97. Jeong, S.J.; Ho, C.H.; Gim, H.J.; Brown, M.E. Phenology shifts at start vs. end of growing season in temperate vegetation over the Northern Hemisphere for the period 1982–2008. Glob. Chang. Biol. 2011, 17, 2385–2399. [Google Scholar] [CrossRef]
  98. Gao, F.; Masek, J.; Schwaller, M.; Hall, F. On the blending of the Landsat and MODIS surface reflectance: Predicting daily Landsat surface reflectance. IEEE Trans. Geosci. Remote Sens. 2006, 44, 2207–2218. [Google Scholar]
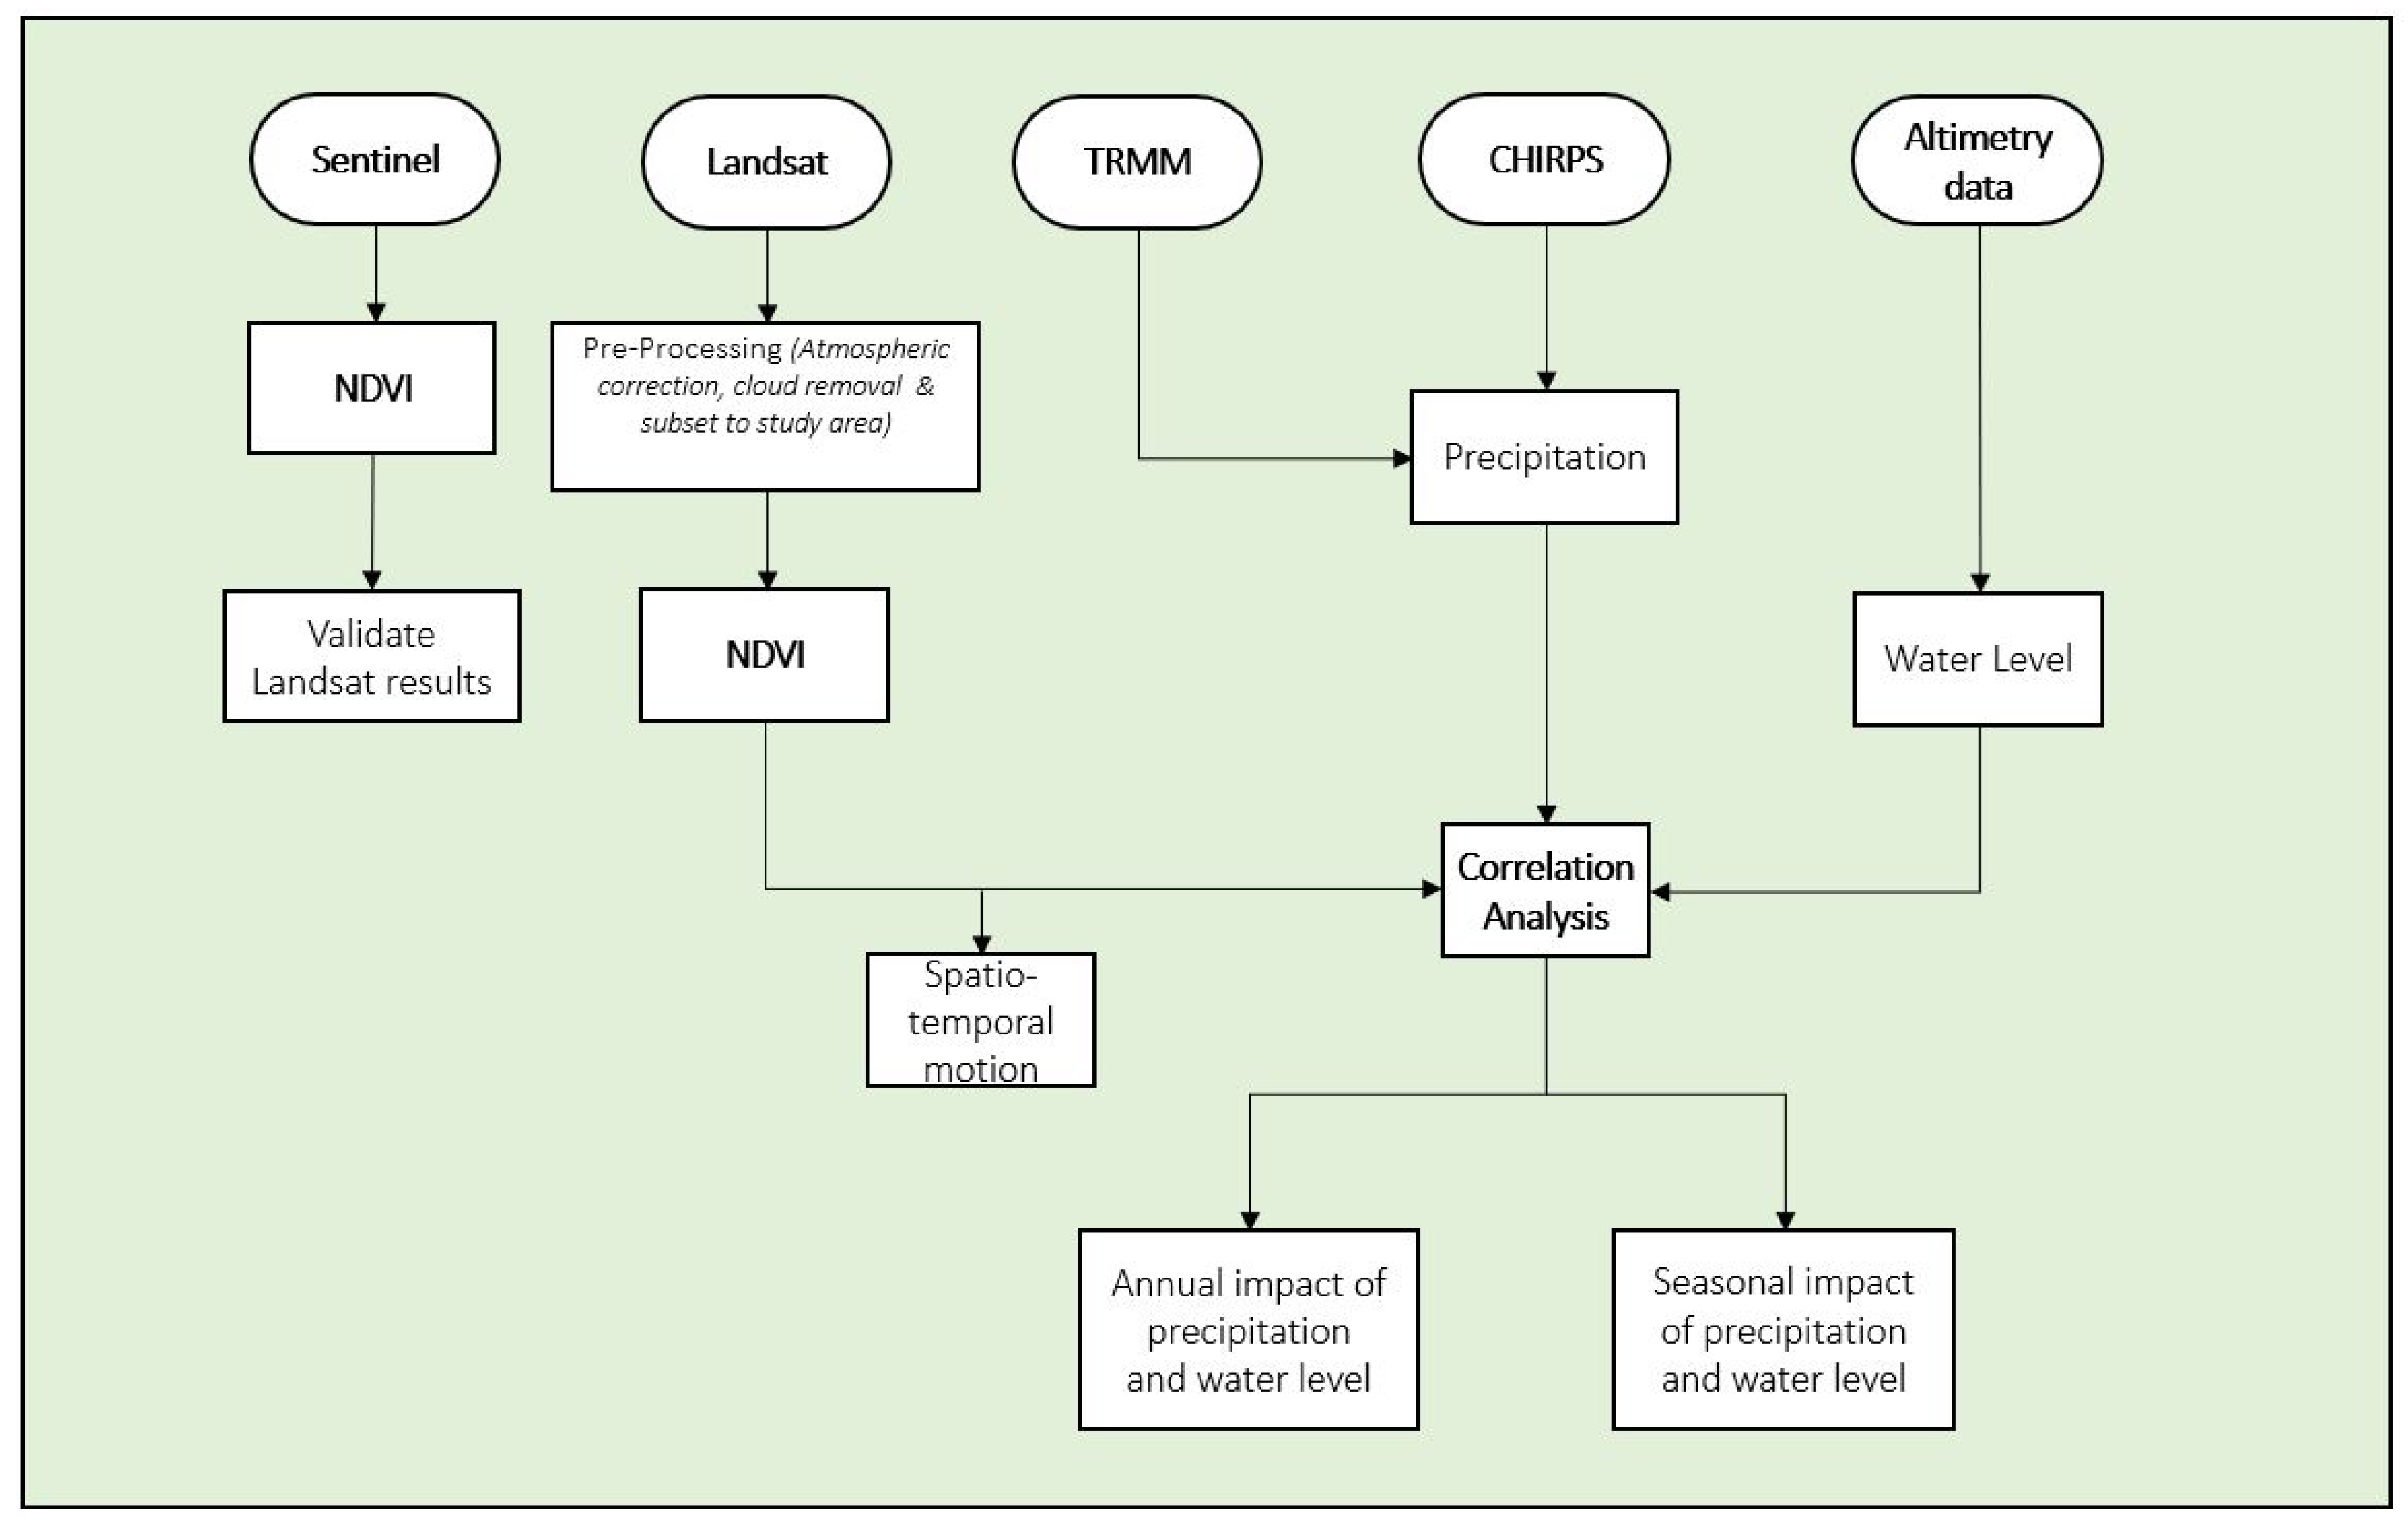
Figure 2. An illustration of the workflow of the study.
Remotesensing 15 02304 g002
Figure 3. Validation of Landsat images using Sentinel-2 data with ROC plot. The curves display comparable dynamics in feature detection. ROC plots the false positive rate (x-axis) against the true positive rate (y-axis) and calculates AUC values. Landsat images demonstrate consistent performance compared to Sentinel-2, justifying their use in the study.
Remotesensing 15 02304 g003
Figure 4. Annual average variation of floating islands at Kiira and Nalubaale power stations, with Bujagali showing values below 0.1, which is the threshold for identifying floating islands. The observed vegetation in Bujagali could be water hyacinth rather than floating islands.
Remotesensing 15 02304 g004
Figure 5. Relationship between precipitation and floating islands in (a,b), and correlation between water level and floating islands in (c,d) at Kiira and Nalubaale power stations. The y-axis anomaly is the standardized value that enables the correlation of precipitation and NDVI with different units of measurement, as described in Section 3.2.4. The correlations are statistically significant (p < 0.05) and are computed at a 95% confidence level, except for Figure 5b (bolded).
Remotesensing 15 02304 g005
Figure 6. (a) Distribution of floating islands at Kiira power station during December–January–February (DJF), March–April–May (MAM), June–July–August (JJA), and September–October–November (SON); (b) Seasonal variation of floating islands at Kiira power station over the year; (c) Distribution of floating islands at Nalubaale HPP in DJF, MAM, JJA, and SON; and (d) Seasonal variation of floating islands at Nalubaale HPP over the year.
Remotesensing 15 02304 g006
Figure 7. Seasonal distribution of floating islands across (a) Kiira power station, (b) Nalubaale power station, and (c) Bujalagi hydropower plant.
Remotesensing 15 02304 g007
Figure 8. Relationship between floating islands and precipitation at Kiira power station (a,c,e,g) and Nalubaale HPP (b,d,f,h) for January, February, December (JFD); March, April, May (MAM); June, July, August (JJA) and September, October, November (SON). The correlations are computed at a 95% confidence level apart from Figure 8c (Bolded) where the confidence level was at 80%.
Remotesensing 15 02304 g008
Figure 9. Relationship between floating islands and Lake Victoria’s water level at Kiira power station (a,c,e,g) and Nalubaale HPP (b,d,f,h) for January, February, December (JFD); March, April, May (MAM); June, July, August (JJA) and September, October, November (SON). The correlations are computed at a 95% confidence level apart from Figure 9c (Bolded) where the confidence level was at 80%.
Remotesensing 15 02304 g009
Figure 10. Directional movement of floating islands within Kiira and Nalubaale power stations within several seasons in 2010, 2013, and 2020. The unit of area is m 2 .
Remotesensing 15 02304 g010
Figure 11. Correlations between floating islands (standardized NDVI) and power production (standardized) at Kiira (a) and Nalubaale (b) power stations using data in 2013 and 2017.
Remotesensing 15 02304 g011
Table 1. Characteristics of power stations (PS) and hydropower plant (HPP) in the White Nile [36]. A power station is an installation where electrical power is generated for distribution, while a hydroelectric power plant is located inside dams that imbound lakes or rivers, raising the water levels behind dams. Composite in this context means a dam where a part of the water head is made up of concrete and and other parts by soil.
DescriptionNalubaale PSKiira PSBujagali HPPIsimba HPPKaruma HPP
Project completion1968200320122019End of 2022
Dam typeConcreteCompositeCompositeCompositeConcrete
Plant discharge (m 3 /s)11401260137513751224
Spillway (m 3 /s)12721740450052304800
Height (m)30323026.514
Length (m)7263808501599314
Power Capacity (MW)180200250183.2600
Max flood level (m.a.s.l)11351135111210551030
Table 2. Summary datasets used covering January 2000–December 2020 with 2004, 2010, 2013, 2017, and 2020 used in the study.
DescriptionSensorSpatial ResolutionTemporal ResolutionPurpose
ImageryLandsat3016 daysSpatial–temporal changes of floating islands
Sentinel-2105 daysValidation of Landsat products
PrecipitationTRMM0.25 × 0 . 25 MonthlyRainfall statistics
CHIRPS 0 . 05 × 0 . 05 MonthlyRainfall statistics
THEIA MonthlyLake Victoria’s water level statistics
Table 3. Correlation coefficient between NDVI and water level based on 0 and 1 lag. The bolded values are statistically significant at 95% confidence level.
Long RainShort Rain
DamLag0Lag1Lag0Lag1
Nalubaale 0.1 0.50.10.5
Kiira 0.3 0.70.30.1
Disclaimer/Publisher’s Note: The statements, opinions and data contained in all publications are solely those of the individual author(s) and contributor(s) and not of MDPI and/or the editor(s). MDPI and/or the editor(s) disclaim responsibility for any injury to people or property resulting from any ideas, methods, instructions or products referred to in the content.