Article

Exploring the Spatial Relationship between Urban Vitality and Urban Carbon Emissions

1
School of Resources and Geosciences, China University of Mining and Technology, Xuzhou 221116, China
2
Key Laboratory of Coalbed Methane Resources and Reservoir Formation Process of the Ministry of Education, China University of Mining and Technology, Xuzhou 221116, China
3
Artificial Intelligence Research Institute, China University of Mining and Technology, Xuzhou 221116, China
*
Author to whom correspondence should be addressed.
Remote Sens. 2023, 15(8), 2173; https://doi.org/10.3390/rs15082173
Submission received: 21 February 2023 / Revised: 3 April 2023 / Accepted: 12 April 2023 / Published: 20 April 2023
(This article belongs to the Special Issue Geospatial Big Data and AI/Deep Learning for the Sustainable Planet)

Abstract

:
Urbanization profoundly impacts the global carbon cycle and climate change. Many studies have shown that both urban vitality and urban carbon emissions are deeply affected by spatial planning and city structure. However, the specific relationship between urban vitality and urban carbon emissions is rarely studied. An index system of urban vitality was established from four aspects: social, economic, cultural, and environmental. After analyzing the spatial distribution characteristics of urban vitality combined with spatial syntax and the TOPSIS model, this paper further investigated the influence of urban vitality-building factors on the distribution of urban carbon emissions based on the Geodetector method. The research results show that: (1) Xuzhou shows obvious spatial differences in urban vitality, mainly decreasing from the center to the surrounding areas, with a small vitality center in the northeast. (2) The impact of different dimensions of vitality on urban carbon emissions is apparently different. (3) Facilities’ aggregation has the weakest explanatory power for urban carbon emissions, while the NDVI has the highest explanatory power. This study helps to clarify the spatial correlation and influence mechanism between urban vitality and urban carbon emissions. Finally, some suggestions are proposed to construct low-carbon and high-vitality cities.

Graphical Abstract

1. Introduction

The urbanization process has important and far-reaching significance for the transformation and development of China [1]. With the increasing scale and complexity of Chinese cities, various negative effects and “urban diseases” emerge in large numbers [2]. China’s extensive growth pattern of high consumption and high emissions not only intensifies the urban greenhouse effect but also causes an uneven quality of urbanization. Some regions attach importance to economic growth instead of the quality of development, resulting in cities lacking in necessary vitality [3]. Facing the problems of economic decline, scale contraction, and environmental protection in the process of urbanization, deepening the understanding of urban vitality, while exploring the contact between urban vitality and urban carbon emissions, is crucial to building a vibrant and sustainable city.
The concept of urban vitality that evolved from the term street life was first proposed by Jacobs, which includes human activities and urban space as well as the interactions between them [4]. To some extent, urban vitality represents the potential of a city’s internal survival, growth, and development, which is stimulated by good urban form [5]. Wu et al. demonstrated the correlation between urban form and neighborhood vitality through a series of urban form measures (circulation system, external transportation system, density, land use mix, and accessibility) [6]. Long et al. quantitatively analyzed the impact of urban design variables such as intersection density, mixed utilization rate, facilities, and transportation accessibility on economic vitality [7]. Jiang et al. constructed the evaluation system of urban vitality from five different dimensions and further analyzed the correlation between urban shrinkage and urban vitality in three provinces of Northeast China [8]. Lan et al. argued that urban form is not only the geometry of urban space, but also a complex social and economic phenomenon, and further investigated the intrinsic laws of population inflow and social infrastructure affecting urban dynamics [9]. There are two broad categories of existing research, whether from the perspective of constructing systems or influencing mechanisms: spatial and non-spatial factors. In terms of non-spatial factors, urban vitality is often influenced by population activities and economic factors, such as population inflow [9], GDP, labor force ratio [10], and consumption level [11]. Studies involving spatial factors mostly focus on urban structure and scale, such as density, diversity, mix, accessibility, urban landscape, environmental quality, and architectural form [12,13,14,15]. The influence of urban form on urban vitality has been widely recognized, with most studies focusing on the physical form of cities, such as urban scale, infrastructure, public green spaces, land use, and urban streets.
Good urban form, as a source of urban vitality, plays an equally pivotal role in reducing urban carbon emissions [5,16]. Whether the city, as the largest emission source, can achieve the sustainable development goal of low carbon is of paramount importance in order for the entire society to achieve the sustainable development goal of low carbon [17]. A full understanding of the relationship between urban carbon emissions and urban form is the basis for achieving low-carbon city construction. Current studies on urban form and urban carbon emissions broadly include land use, built environment, transportation networks, and development patterns, all of which have direct or indirect effects on urban carbon emissions [18]. Li et al. evaluated the coupling relationship between carbon emissions and land use at county and regional scales in Chongqing and explored the scale effect of urban land on carbon emissions [19]. Dan et al. assessed the effectiveness and potential of public transport energy conservation and emission reduction by comparing the carbon emissions of public transport in Shenzhen and other cities [20]. Due to the diversity of indicators, the different stages and types of urban development, and the lack of micro-analysis, the quantitative study on the mechanism between urban form and carbon emissions still requires a lot of research and specific cities should be analyzed for a targeted understanding [21].
A large number of studies have shown that urban vitality is closely related to both urban carbon emissions and urban form. For example, land, as a carrier of urban activity space, can effectively reduce carbon emissions by optimizing the land structure and strengthening land management [22], while orderly, aggregated, and abundant land use plays an equally positive role in urban vitality [23]. The connectivity, accessibility, and density of roads change the way urban residents travel by affecting a city’s transportation environment, which directly or indirectly affects carbon emissions [18], while the higher road network density only has a positive effect on the vitality of the city in the stage of urban expansion [24], which requires a specific analysis based on the development situation of specific regions. There is a qualitative link between urban vitality—as a specific quantitative representation of the physical environment and population activity [25]—and urban carbon emissions, which are also influenced by the physical environment and population activity. However, few studies directly investigate the specific relationship and impact mechanism between urban vitality and urban carbon emissions. At present, China’s urbanization has not been completed and is still in a rapid development stage. How to reduce carbon emissions, improve the urban environment, and enhance urban vitality through urban form and spatial structure planning is an urgent problem to be solved. It is necessary to directly explore the relationship between urban vitality and urban carbon emissions for specific cities.
To address the above deficiencies, this paper innovatively proposed a measurement method of the dependence between the building index of urban vitality and the spatial distribution characteristics of urban carbon emissions, aiming at studying the spatial correlation and causality between urban vitality and urban carbon emissions. It compensated for the deficiency of existing urban vitality research from the angle of carbon emission reduction. This paper analyzed the urban pattern and basic status of Xuzhou and constructed an urban vitality evaluation system from four perspectives: social, economic, cultural, and environmental. Second, to reveal the correlation between carbon emissions and vitality, we assessed the influence of different indicators on urban carbon emissions. Third, this paper provided a basis for future planning practice in Xuzhou and a research idea for urban planning in other regions.

2. Study Area and Datasets

2.1. Study Area

As the core city of the Huaihai Economic Zone, Xuzhou (33°43′–34°58′N, 116°22°–118°40′E) is an interprovincial border city of Jiangsu, Shandong, Henan, and Anhui provinces. Xuzhou is the only national-level resource-based city in Jiangsu, with a total land area of 11,765 km2 and a resident population of 902.85 million [26]. With a history of more than 130 years of coal mining, Xuzhou is an industrial city with the highest carbon emission intensity in northern Jiangsu. As a result of long-term energy exploitation, Xuzhou City faces urgent tasks such as energy conversation and emission reduction, ecological restoration and environmental protection, and is now entering a period of resource depletion. In recent years, Xuzhou has experienced rapid economic development, accompanied by the rapid expansion of urban space. Its current urbanization level is higher than that of the country but lower than that of the province. However, due to its unreasonable urban pattern, the quality of urbanization in Xuzhou is generally not high, while the development of urbanization is uneven, with large spatial differences in urbanization levels between urban areas and counties, and between individual counties and districts.
As an important coal producer and transportation hub, Xuzhou is in the stage of accelerating urbanization, which leads to the fact that it is facing the dual pressure of urban development and environmental protection at the same time. With the implementation of the central city construction strategy of the Huaihai Economic Zone, Xuzhou, as the spatial strategic fulcrum of the “One Belt, One Road” Initiative and the key development area of the National Land Plan, should coordinate the relationship between economic development and urban space, which has become a strategic issue to promote the high-quality development of Xuzhou. The municipal government is committed to achieving low-carbon development with effective spatial planning and by building a national sustainable development agenda innovation demonstration area with the theme of innovation leading the high-level development of resource-based cities. As a representative of the transformation of resource-exhausted cities, the research on Xuzhou is typical and universal [27]. This paper selects the main urban area of Xuzhou as the research area, covering Quanshan, Yunlong, Gulou, Jiawang, and Tongshan administrative districts (Figure 1), to investigate the impact of urban vitality on carbon emissions distribution, provide analysis support for urban planning and management to achieve urban emission reduction and urban vitality building through optimizing the built environment, and provide a reference for similar cities to carry out low-carbon transformation.

2.2. Datasets

2.2.1. Geographic Data

The administrative division vector in this study was obtained from LocaSpace Viewer (available from http://www.tuxingis.com/, accessed on 9 October 2022). Road data and land use data were extracted from the vector dataset of the Open Street Map (available from https://www.openstreetmap.org/, accessed on 15 September 2022). Then, primary roads, secondary roads, tertiary roads, and highways were extracted for the study. The normalized difference vegetation index (NDVI) data in 2019 (spatial resolution 500 m × 500 m, temporal resolution 16d) were downloaded from the National Earth System Science Data Center (available from http://www.geodata.cn/, accessed on 14 September 2022).

2.2.2. Point of Interest

In this research, point of interest (POI) datasets were collected from Amap (available from https://lbs.amap.com/, accessed on 30 June 2022). The obtained POI datasets included attributes such as name, address, latitude, longitude, etc. Then, the POI dataset was further reclassified into seven categories (Table 1). After cleaning and classification, 39,969 POIs were finally obtained.

2.2.3. Open-Source Data Inventory for Anthropogenic CO2

The carbon emissions data were mainly obtained from the 2019 raster data published by the Open-source Data Inventory for Anthropogenic CO2 (ODIAC, available from https://db.cger.nies.go.jp/dataset/ODIAC/, accessed on 19 June 2022) with a spatial resolution of 1 km × 1 km. ODIAC is a global high-resolution anthropogenic carbon emission dataset developed by the Greenhouse Gas Observation Satellite Project Team (GOSAT) of the National Institute for Environmental Studies (NIES). The data were estimated by combining regional power plant data and satellite observation nighttime light data, mainly based on fossil fuel consumption [28].
The ODIAC carbon emissions data, with an accuracy of more than 80%, have been widely used in international studies of carbon emission pattern exploration, carbon emission simulation, and prediction [29,30]. After processing the monthly average ODIAC data in 2019, we obtained the annual average carbon emissions spatial distribution map of Xuzhou (Figure 2), which showed a distribution pattern of a high center decreasing in all directions. Compared with the remote sensing image, it was found that the regions with abnormally high values were the locations of thermal power plants.

3. Methods

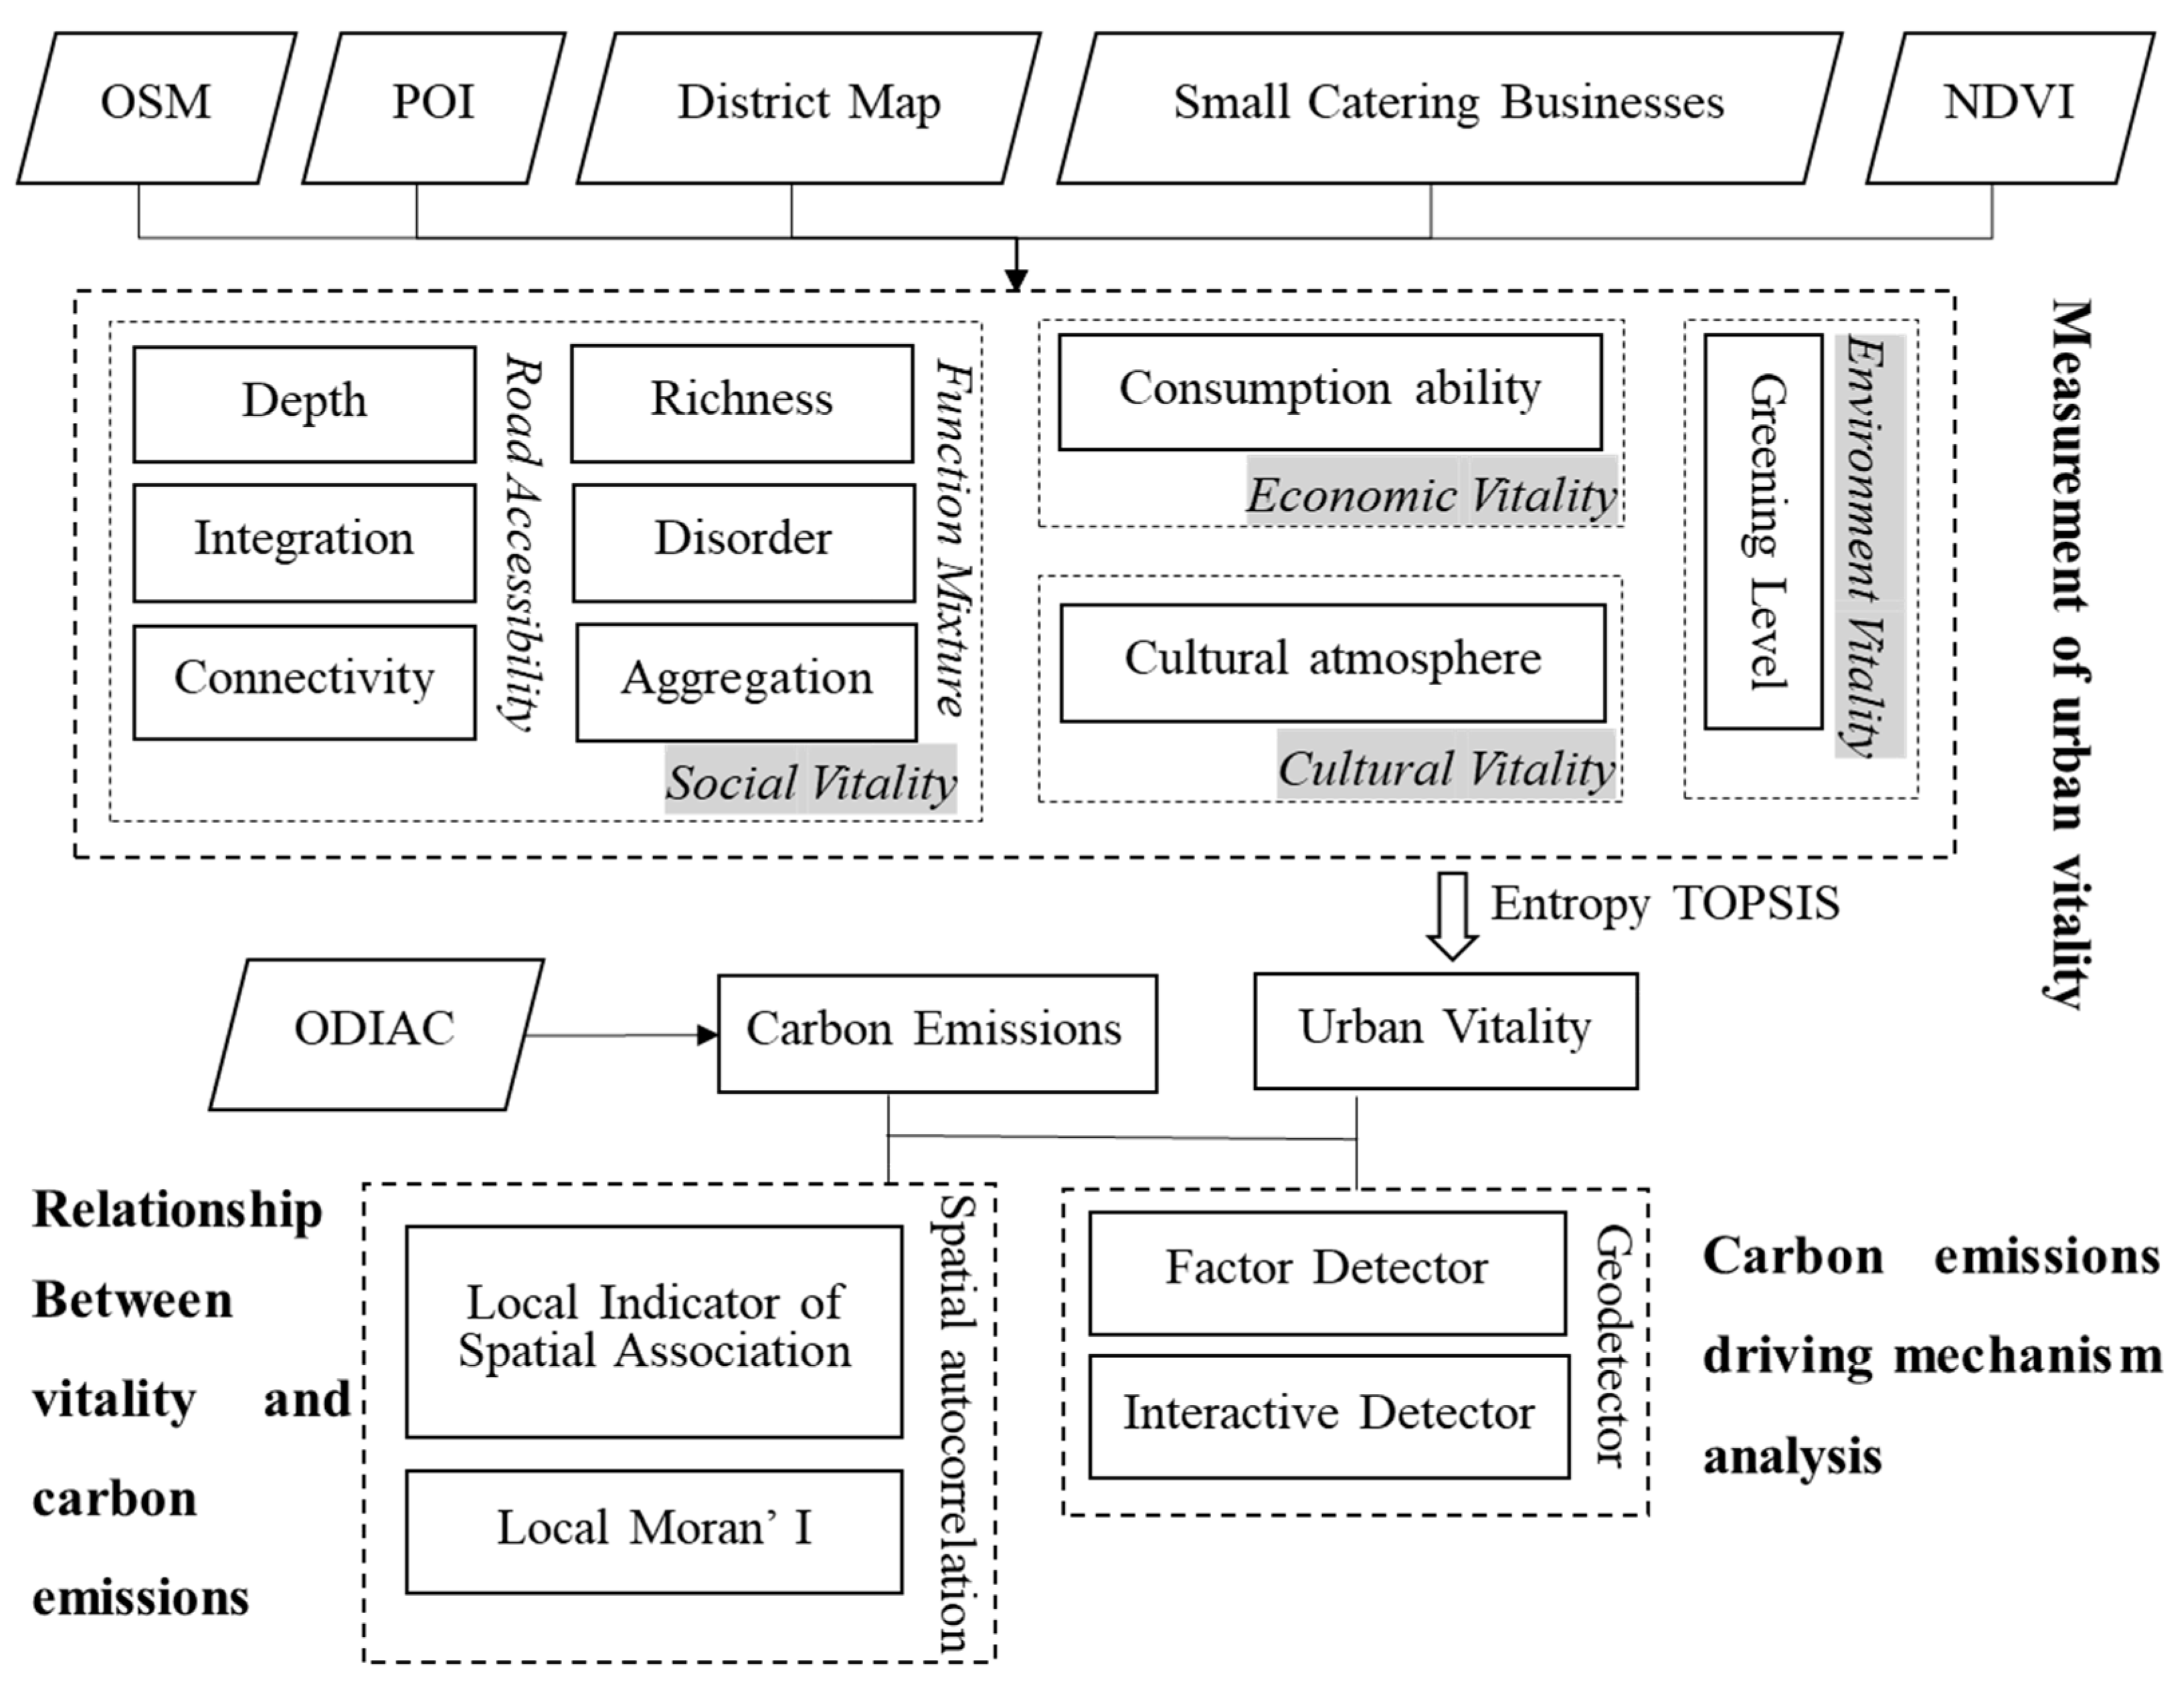
Integrating the research on the reasonable spacing of urban roads from different viewpoints at home and abroad, this paper created a 1 km × 1 km grid, eliminated the missing data values, and finally obtained 4502 research units. We selected four dimensions to evaluate the vitality of the city, namely, social, economic, cultural, and environmental (Table 2). We then quantified urban vitality based on Hill number, space syntax, entropy weight TOPSIS, and other models, and analyzed the spatial distribution characteristics of urban vitality in the main city of Xuzhou. The relationship between the spatial distribution characteristics of carbon emissions and vitality was investigated. Finally, the effects of different vitality-building elements on the carbon emissions spatial distribution characteristics were analyzed using Geodetector (Figure 3).

3.1. Evaluation Index of Urban Vitality

Although scholars have different definitions and concerns regarding the research on urban vitality, there is a consensus that cities have social, economic, cultural, and environmental attributes [8]. Therefore, high-vitality cities need to meet the requirements of being habitable, achieving sustained economic growth, providing sufficient public space for social activities, creating a rich cultural atmosphere, and providing green space for leisure [10]. Combining the existing studies [9,31], this paper selected indicators from four aspects: social, economic, cultural, and environmental.

3.1.1. Social Vitality

Social vitality is an important component of urban vitality. Since urban vitality is generated by human activities, we gave primary consideration to factors that can stimulate human activities in the process of selecting indicators. According to Jacobs and Montgomery’s theory, old buildings, small blocks, density, diversity, and accessibility can best trigger the gathering of crowds, thus stimulating the urban vitality of a region [4,32]. Influenced by these theories, a steady stream of papers adopted these metrics, especially regarding density, diversity, and accessibility to construct vitality [13], and this paper is no exception. Therefore, considering the balance of indicators and data availability, we chose to construct social vitality from two aspects: road accessibility and function mixture.
The functional mixture is usually measured as the composition of urban functions within a single study area. There are many methods to quantify functional mixtures, among which Shannon entropy is the most frequently used index to measure the degree of mixing/uniformity of POI distribution [33]; however, Shannon entropy reflects uncertainty rather than diversity. A quantitative framework model called the Hill number was proposed by ecologists in 1973 to measure diversity and has since been widely used to calculate the functional mix of cities [34]. The Hill number model can reflect the functional mixture in many aspects and dimensions, and the specific formula is as follows [34]:
D q = ( i = 1 n P i q ) 1 / ( 1 q ) ,
where n represents the number of POI types. P i indicates the frequency of POI type i. The Hill number model incorporates the three most widely used diversity measures: richness (q = 0), Shannon entropy (q = 1), and Simpson index (q = 2) [35], which represent the richness, disorder, and aggregation of POI, respectively. In this study, the functional mixture was measured in terms of richness, disorder, and aggregation.
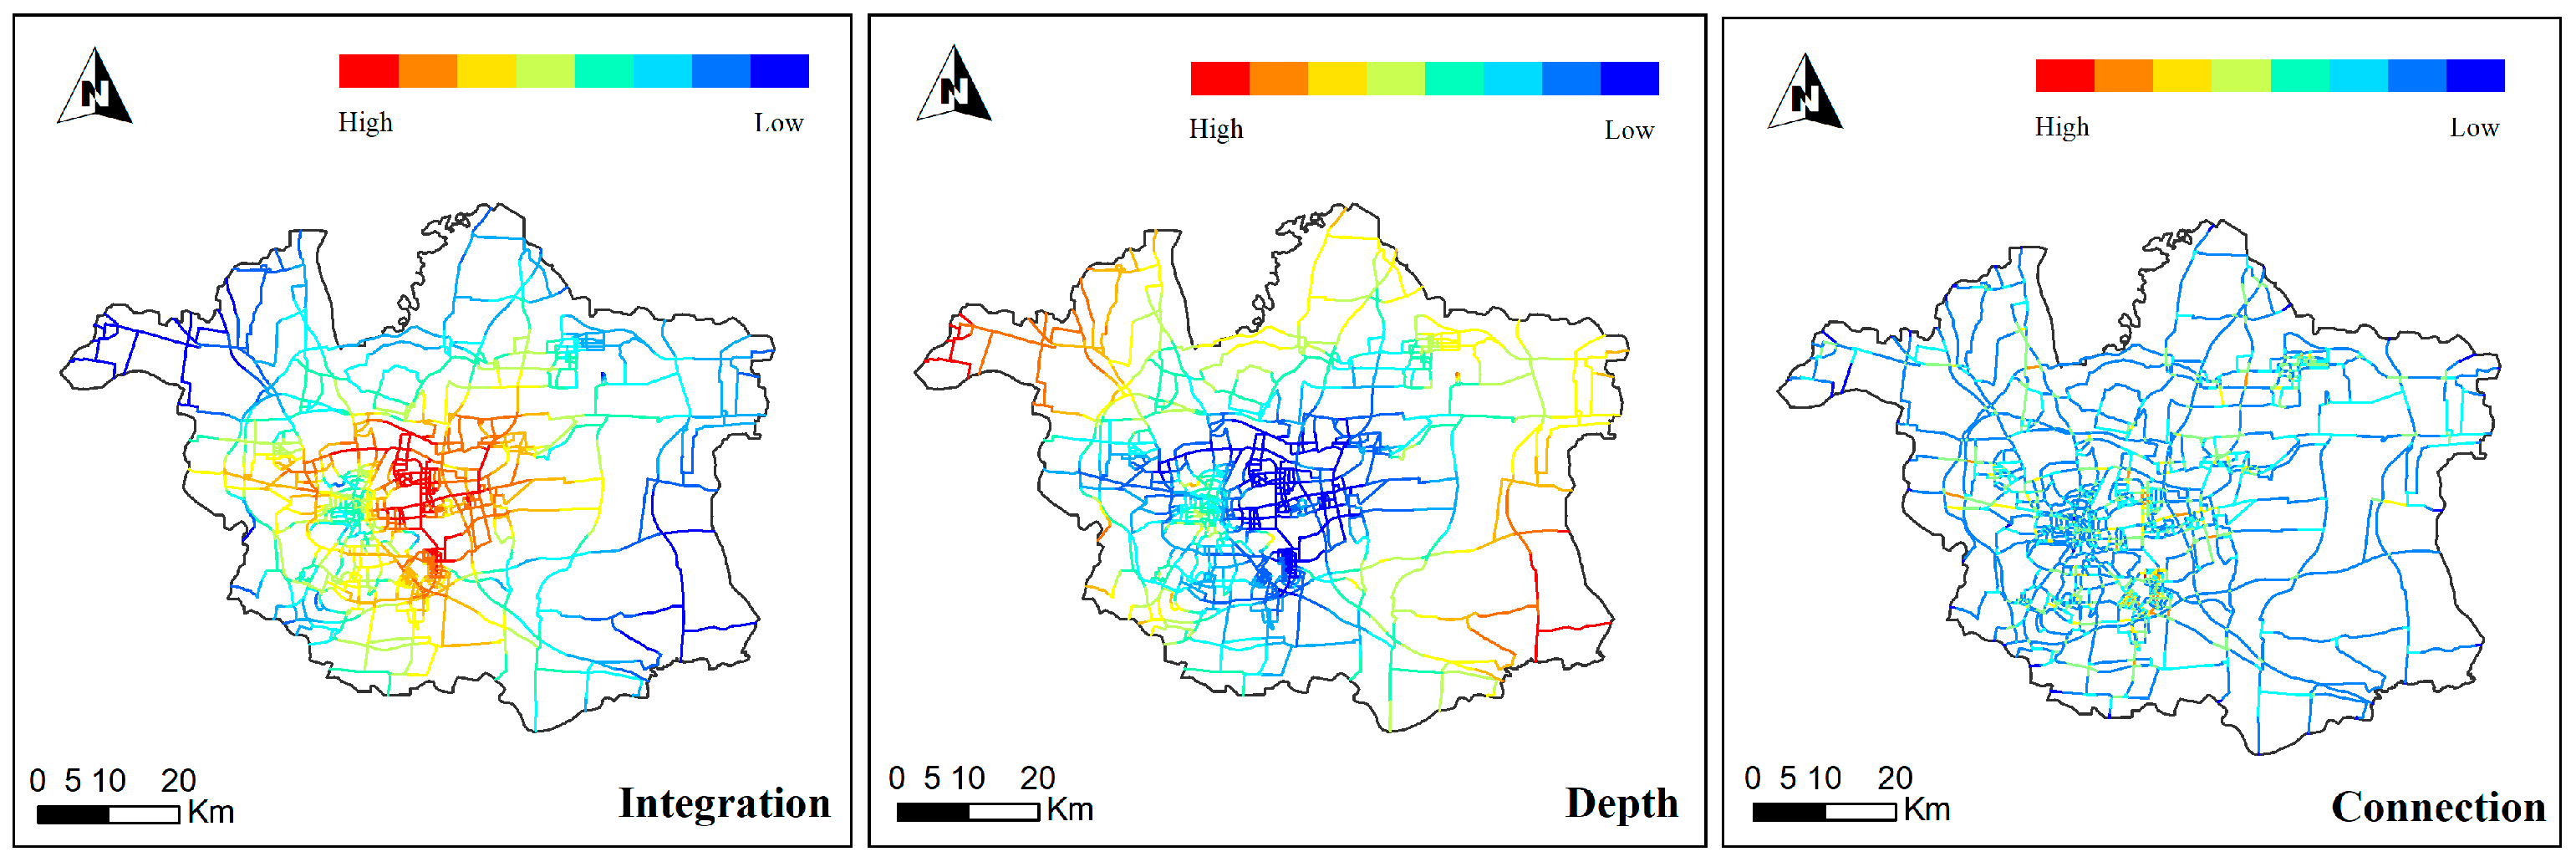
A good road network can strengthen the internal links of cities, reduce traffic costs, encourage people to participate in social activities, and thus promote economic development. Therefore, road accessibility is a common indicator for evaluating urban vitality [36]. Compared with other models, the space syntax provides a quantitative method for the street road network system configuration through spatial segmentation from the perspective of topology [37,38,39] and explains the impact mechanism of the spatial configuration of the road network on population mobility and economic activities [40]. In this study, integration, depth, and connection values were selected to quantify traffic accessibility (Figure 4).

3.1.2. Economic Vitality

Small catering services have better spatial flexibility and, although they cannot represent the development of a city, they can be an important indicator of urban vitality [41]. On the one hand, studies have confirmed that the clustering degree of catering facilities is highly affected by regional economy and population density. Based on the geographically weighted regression model, Wang et al. preliminarily found that the regional economic level had the most significant impact on the clustering of catering facilities [42]. On the other hand, compared with other economically relevant facilities, small catering facilities have higher turnover rates. In other words, the distribution of small catering can better reflect the urban economic pattern, as it is entirely motivated by the actions of business owners and the market (public) spontaneously [43]. Small catering services are mostly located in places with dense human flow, convenient transportation, and diversified functions, and the districts that meet these needs are mostly the centers of social and economic activities [43]. Because urban areas with thriving small catering businesses tend to be more dynamic, some studies have even taken it directly as an “indicator business” of urban vitality [43,44]. Therefore, the distribution of small catering services can be regarded as the embodiment of economic vitality. This study adopted the density of catering facilities to measure economic vitality.

3.1.3. Cultural Vitality

Cultural vitality is a complex and multi-dimensional concept, which is closely related to the social, economic, and residential life of a city, including both cultural places and cultural participation [45]. Due to the difficulty in obtaining the population flow of cultural places in the city, considering the availability of existing studies and data, the POI density of cultural facilities was adopted as the measurement index. Finally, we obtained a total of 106 pieces of data, including museums, archives, libraries, exhibition halls, martyrs’ cemeteries, memorials, and theme parks.

3.1.4. Environmental Vitality

Environmental vitality plays an important role in creating urban vitality. High environmental vitality can also promote the economic, social, and cultural vitality of urban areas [46]. As long as people live in a city, environmental quality will definitely affect people’s willingness to travel, and sufficient green space can make people feel relaxed and comfortable, thus attracting more people to participate in social activities. Therefore, there have been numerous papers using green space to represent the environmental quality of a city as a measure of environmental vitality [9,12,31]. As a common indicator to assess environmental vitality, urban green space plays an important role in improving residents’ health, providing recreational places, maintaining social relations, and improving quality of life [47]. In this paper, NDVI was used as an indicator to measure environmental vitality.

3.2. Calculation of Comprehensive Urban Vitality

Because the research on urban vitality evaluation involves multiple factors and samples, it is a typical multi-criteria decision analysis problem. Since conventional MCDM models are considered insufficient to deal with uncertainty in language, combining MCDM with fuzzy sets has been proposed to solve the problem of fuzziness in the decision-making process [48]. Therefore, the existing MCDM can be divided into two categories: conventional and fuzzy. However, since the indicators in this study are explicit gainful variables, fuzzy MCDM methods that deal with imprecise or vague information are not considered. Compared with other MCDM models, the TOPSIS method can effectively avoid subjectivity while making full use of the information from the raw data. The advantage of TOPSIS lies in that it has no strict restrictions on the number of indicators, sample size, and data distribution, and can provide reliable evaluation results through simple calculation, with minimal data loss in the process [49]. TOPSIS can provide the basic ranking of each alternative with intuitive geometric meaning and does not require independent attribute preference, allowing for a good portrayal of the combined impact of multiple metrics [50]. Experienced decision makers usually prefer a simpler and more transparent approach [51]. In this respect, TOPSIS is unique among the most cited MCDMs. Due to its intuitive features that are easy-to-implement and understand, TOPSIS [52,53] has been used abroad in business and other fields [54], transportation planning [55], and air quality [56]. It has also been frequently applied to urban vitality evaluation studies in recent years [54,57]. The disadvantage is that the model has the same weight for each index by default, so the entropy weight method is introduced in this paper. The subjective assignment method is susceptible to the researcher’s perceptions, while the entropy weighting method is dependent entirely on the information value of the original data, which can provide more correct and objective weights [54]. Therefore, the entropy weight -TOPSIS model is chosen as the comprehensive evaluation method of urban vitality.
Construct the weighted normalization matrix Y using Equation (2) [53]:
Y i j = W j X i j ,
where xij is the value of the jth indicator of the ith basic spatial unit.
Obtain optimal and inferior solutions [53]:
Y + = ( Y 1 + , Y 2 + , , Y 8 + ) ,
Y = ( Y 1 , Y 2 , , Y 8 ) ,
Calculate the distance of the evaluation object from the optimal and inferior solutions using Equations (5) and (6) [53]:
D i + = j = 1 n w j ( Y j + Y i j ) 2 ; i = 1 , 2 , 3 , m ,
D i = j = 1 n w j ( Y j Y i j ) 2 ; i = 1 , 2 , 3 , m ,
where wj represents the weight of the jth indicator.
Calculate the closeness of each study unit to the optimal solution, Ci [54]:
C i = D i D i + + D i ; i = 1 , 2 , 3 , m ,
The final evaluation results are ranked according to the size of Ci.

3.3. Analyzing the Spatial Relationship between Urban Vitality and Carbon Emissions

The first law of geography states that geographical phenomena are spatially correlated. Spatial autocorrelation is often used to reflect the degree of correlation between the adjacent spatial units of the same attribute, which can be expressed by the global Moran’ I index and Local’ I index, respectively [58]. For further in-depth study, the bivariate spatial autocorrelation method was proposed to study the spatial relationship of the same variable at different times [59]. Later, the method was extended to describe the spatial correlation and dependence characteristics of two different geographical elements [60]. Therefore, this paper adopted GeoDa software to carry out bivariate local autocorrelation Moran’ I analysis to reveal the spatial distribution characteristics between different dimensions of vitality and urban carbon emissions. The formula is as follows [60]:
I a b = x a i x a ¯ σ a × j = 1 n W i j x b j x b ¯ σ b ,
where x a   i is the attribute value of a in cell i. x b j is the attribute value of b in cell j. x a ¯ and x b ¯ are the means of the attribute a and b values, respectively. σ a and σ b are the variances of the attribute a and b values, respectively. W i j is the weight coefficient matrix.

3.4. Analyzing the Factors Influencing Urban Carbon Emissions

Geodetector captures the correlation between variables by studying the spatial distribution coupling between elements [61], including four types of risk detector, factor detector, ecological detector, and interaction detector. Geodetector does not require linear assumption, so it is immune to multivariate collinearity and can avoid the endogeneity of causality between independent and dependent variables [61]. Compared with other traditional models, Geodetector has the advantage of being unconstrained and is not predetermined, effectively overcoming the limitations of traditional analysis methods in dealing with categorical variables. The model has been widely used in various fields such as risk assessment, ecological evaluation, and social sciences [62,63,64]. In this paper, the urban carbon emissions value was taken as attribute Y, and the contribution of different evaluation factors to urban carbon emissions was quantitatively calculated by using Geodetector. Then, the relative importance of each element of urban vitality was analyzed. The formula is as follows [61]:
q = 1 h = 1 L N h σ h 2 N σ 2 = 1 S S W S S T ,
where h is the variable stratification. N h and N are the numbers of cells in stratum h and the whole region, respectively. σ e 2 and σ 2 are the variances of the Y values of carbon emissions in stratum h and the whole region, respectively. The q value represents the explanatory power of the factor to the dependent variable. The Geodetector software is available for free from http://www.GeoDetector.org (accessed on 8 October 2022).

4. Results

4.1. Spatial Distribution Pattern of Multi-Dimensional Vitality

We calculated the comprehensive vitality based on the Entropy-TOPSIS method. The results show that the comprehensive vitality of Xuzhou presents a spatial differentiation characteristic decreasing from the center to the periphery, and the spatial distribution is unbalanced (Figure 5). The areas with high comprehensive vitality were mainly clustered in the intersection of Quanshan, Yunlong, and Gulou districts. The highest intensity areas were respectively in Pengcheng Square of Gulou District, Hubu Mountain of Yunlong District, and Yunlong Park of Quanshan District. Suti Road, Qingfeng Road, and Jinlong Lake Scenic Area along the east–west extension of Metro Line 1, and Xuzhou Normal University’s Yunlong Campus, Science and Technology Plaza, and China University of Mining and Technology’s Wenchang Campus along the north–south extension of Metro Lines 2 and 3 are part of a central belt with the highest vitality. In addition, there exists a developing low-vitality center in Jawang District along Quancheng Road in the direction of the Century Square and Xiaqiao Park extension. From the perspective of overall space, areas with high comprehensive vitality usually develop along main roads and around tracks, with the highest vitality value in the center of the tracks and gradually decreasing along the periphery. From the functional point of view, the areas with high value of comprehensive vitality in the city are mainly concentrated in the commercial centers or the surrounding areas of residential houses and universities. This proves the credibility of the evaluation results of this study to a certain extent.
There are two main high-value gathering centers for social vitality: (1) the junction of Yunlong District, Gulou District, and Quanshan District and (2) the area around Dalong Lake Scenic Area in Yunlong District. The road network around Dalong Lake Scenic Area is well developed, with Track Line No. 2 to the north, Hanyuan Avenue to the west, and Yingbin Expressway leading to Lianhuo Expressway to the south, which is the administrative center of Xuzhou City. The high economic vitality value is widely distributed, mainly appearing in the intersection of Quanshan District, Yunlong District, and Gulou District; Wanda Plaza, Xuzhou City Government in Yunlong District; China University of Mining and Technology, Science and Technology Park, in Quanshan District; and Jiangsu Normal University and Wanda Plaza in Tongshan District. Cultural vitality has the most uneven distribution due to limited access to data, with high values clustered mainly on the west side of Yunlong Park and Kui Shan Park, while low values are distributed in all other areas. The overall distribution of environmental vitality showed a decreasing trend from the periphery to the center, and the low-value area showed a northeast-to-southwest band, which was distributed in Yunlong District, Quanshan District, Gulou District, northeast Jiawang District, and southwest Tongshan District, while the northwest and southeast edge of the urban area showed a high vitality.
By comprehensive comparison, it can be found that the comprehensive, social, and economic vitality all show a similar spatial structure, with high values clustered in the center of Xuzhou and rapidly decreasing in the surrounding areas. All kinds of vitality values in the surrounding areas are low, far behind the urban core area, and there is a sub-vitality center in the northeast, but the environmental vitality is the opposite. Xuzhou shows a “monocentric-multi-node” pattern of comprehensive vitality distribution and the same northeast–southwest development trend as the built-up area. This is probably due to the monocentric development pattern, which concentrates economic and social resources on the development of the core land while ignoring most marginal land, and the areas outside the core are mainly agriculture, forestry, and fragmented built-up areas [65]. From the spatial equilibrium, compared with the other vitality dimensions, the distribution of economic vitality is the most even, followed by social vitality, and cultural vitality is the least evenly distributed.

4.2. Spatial Relationship of Multidimensional Vitality and Urban Carbon Emissions

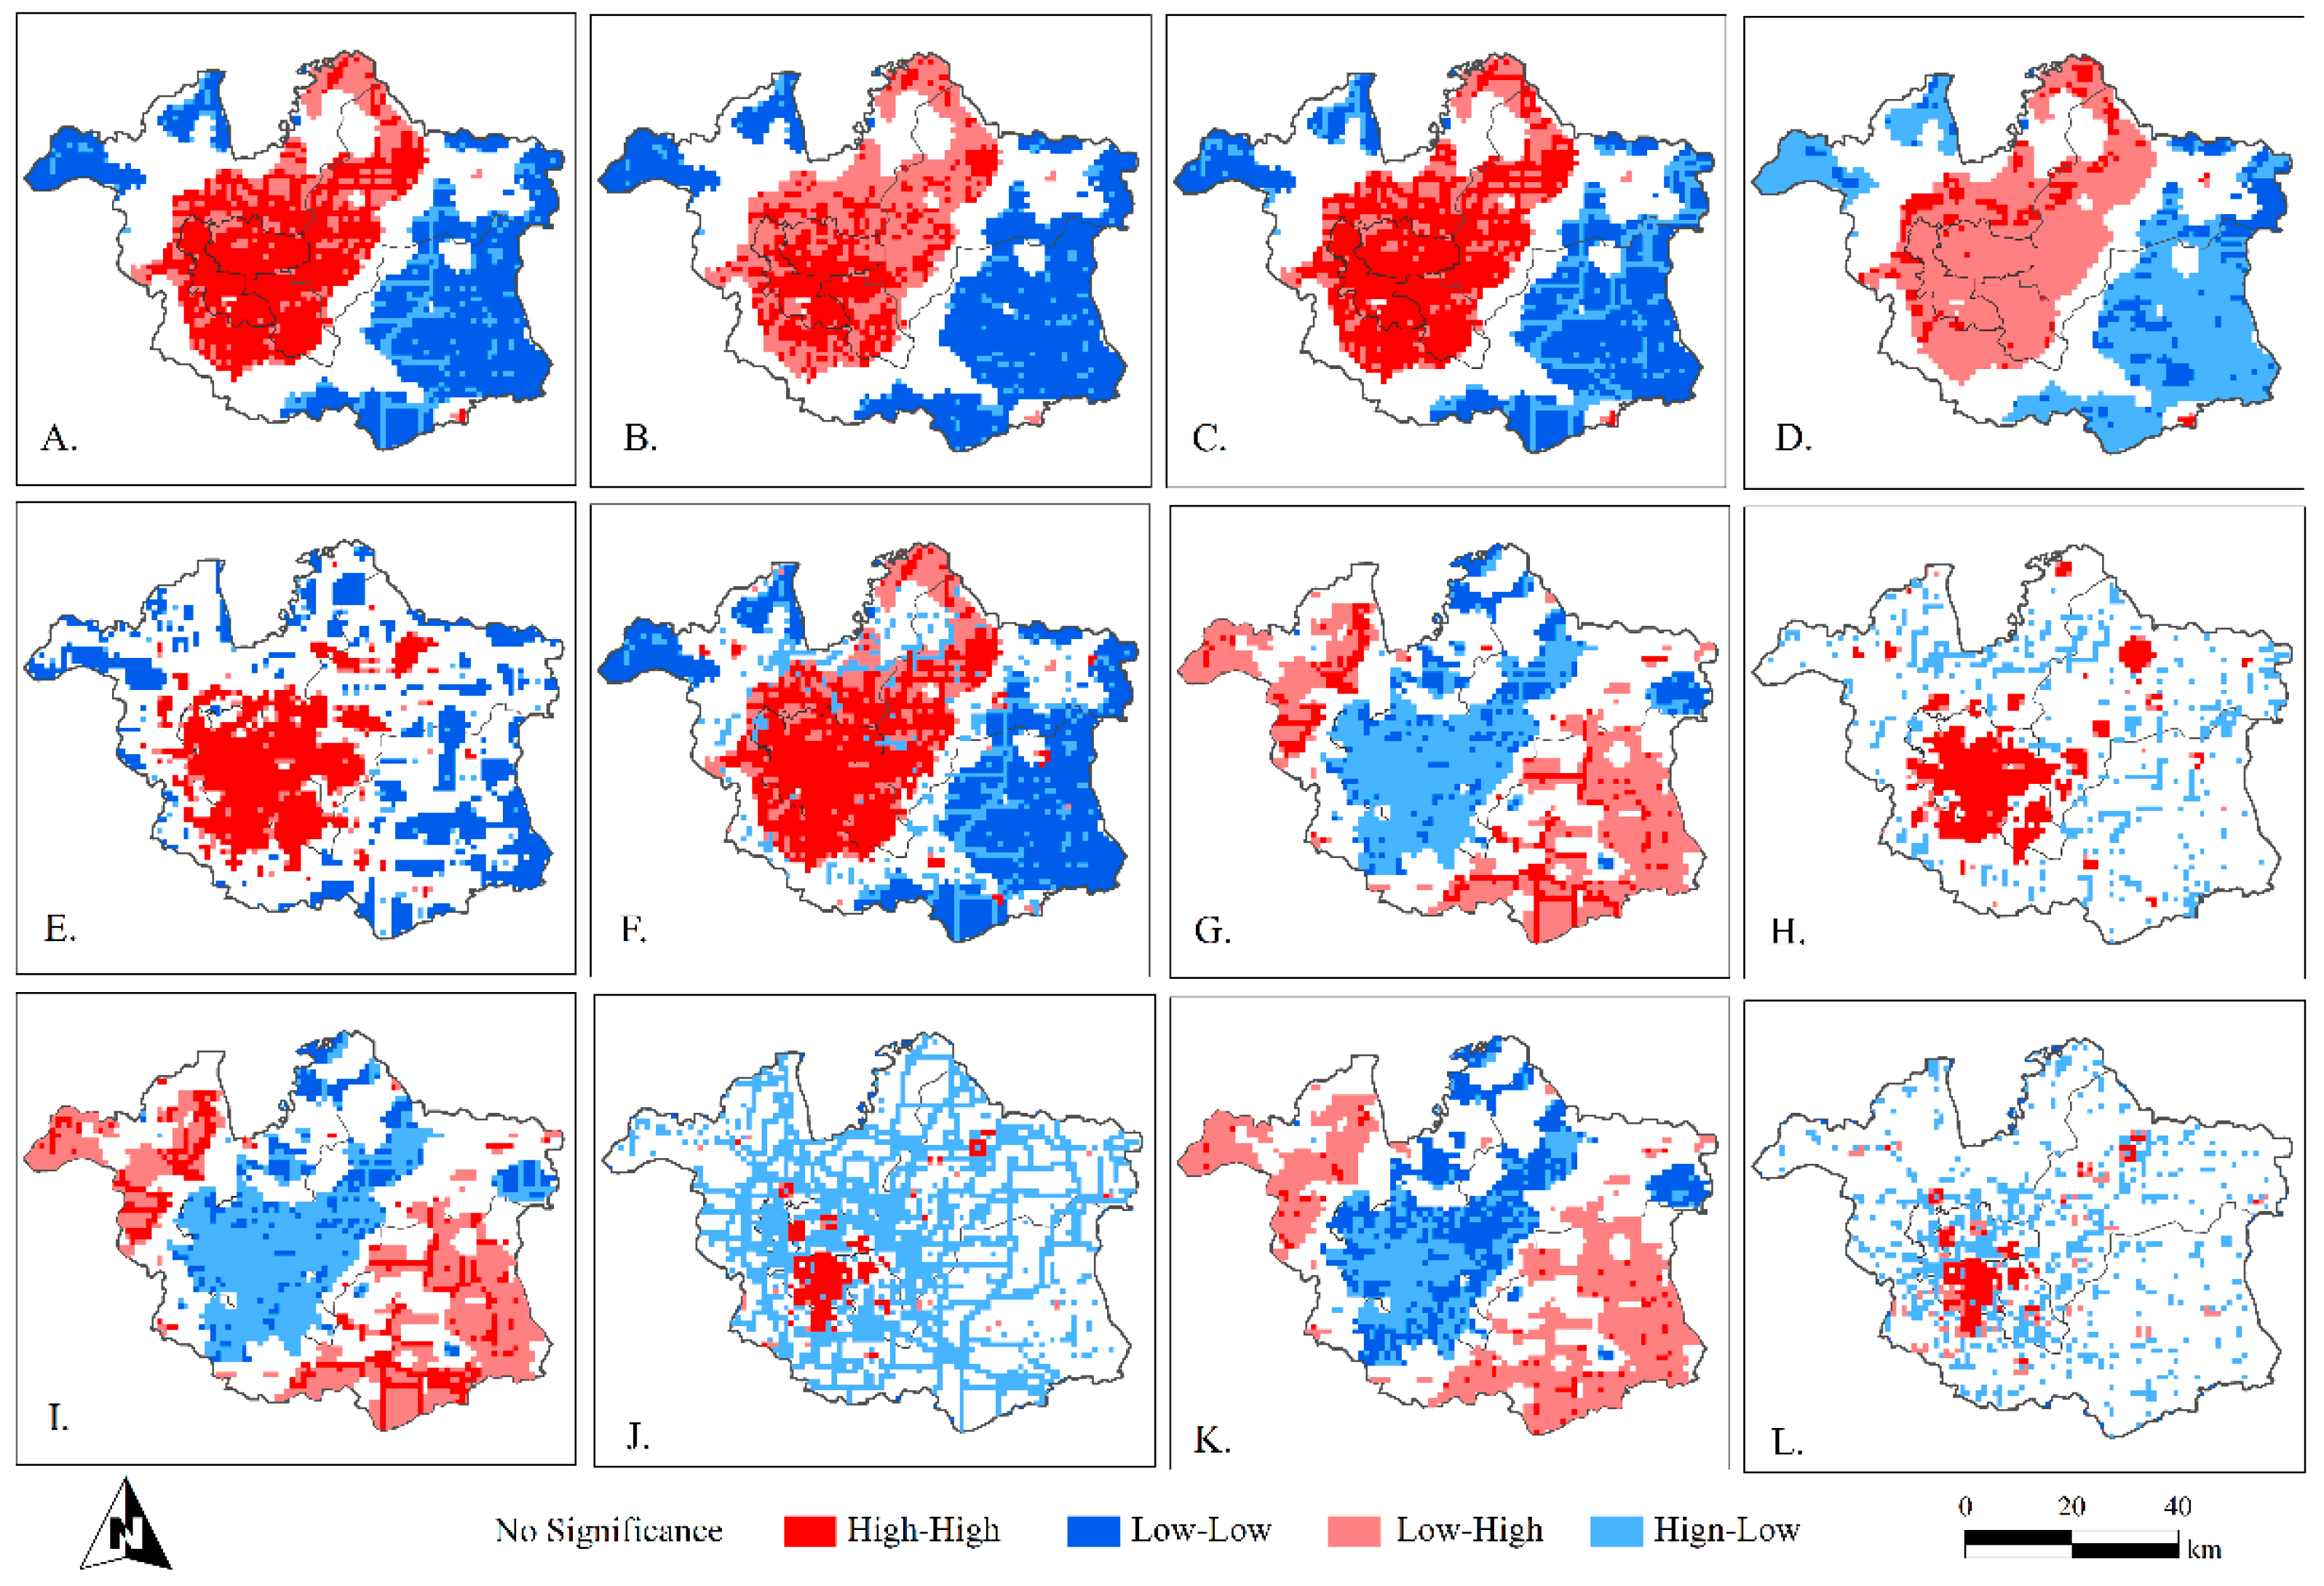
  • The spatial autocorrelation analysis was used to calculate the degree of association between carbon emissions and the spatial distribution of comprehensive, social, economic, environmental, and cultural vitality, and the results are as follows (Table 3). The autocorrelation between vitality and carbon emissions was also visualized in GeoDA (Figure 6).
  • By comparing the spatial distribution and divergence characteristics between carbon emissions and different dimensions of vitality in cities, it is found that carbon emissions have the highest spatial autocorrelation with social vitality (Moran’ I = 0.5), followed by comprehensive vitality (Moran’ I = 0.44), economic vitality (Moran’ I = 0.375), and cultural vitality (Moran’ I = 0.133), with a high negative correlation with environmental vitality (Moran’ I = −0.626). Meanwhile, comprehensive, social, and economic vitality are all associated with urban carbon emissions showing high–high aggregation in the central area of Xuzhou urban area and low–low aggregation in the northwest and southeast fringe zones (Figure 6A–C). The difference is that economic activity and carbon emissions present a low–high aggregation in the edge zone of the central region, mainly because there are many residential communities and few consumption places in this region, the population agglomeration leads to relatively high carbon emissions, and the lack of economic activities leads to relatively low economic activity (Figure 6B). There is a significant negative correlation between environmental vitality and the carbon emissions intensity pattern. The center of Xuzhou is a built-up area with low-high aggregation. The northwest is far away from the built-up area and sparsely populated, while the east, especially the southeast, is mountainous and densely wooded, showing high-low aggregation (Figure 6D).
  • From the perspective of spatial correlation degree between different dimensions of vitality, the spatial correlation between comprehensive vitality and social vitality is the highest (Moran’ I = 0.491), followed by economic vitality (Moran’ I = 0.381), indicating that comprehensive vitality is mainly reflected by social vitality. The most relevant link is between economic vitality and social vitality (Moran’ I = 0.407), reflecting that high economic vitality can lead to social vitality, while good social vitality will further stimulate the development of social vitality, and the two are complementary to each other. Due to limited access to data, the correlation between cultural vitality and all other vitalities is low, and in comparison, the correlation with economic vitality is the highest, indicating that the planning layout of cultural infrastructure is influenced by economic activities. Environmental vitality has the highest negative correlation with social vitality (Moran’ I = −0.41), followed by economic vitality, indicating that the environment is most affected by human activities. According to the LISA cluster map, five categories of high–high, high–low, low–low, low–high, and non-significant are analyzed.
  • (1) As a whole, there is a remarkable spatial similarity among various types of vitality (except environmental vitality), which are significantly influenced by urban centers, with high–high types concentrated in built-up areas and low–low types clustered mainly in the northwest and southeast fringe areas of the city (Figure 6E,F,H). Social and economic vitality and environmental vitality are high–low clusters in the urban center, and low–high clusters in the northwest and southeast fringe zones of the city (Figure 6I,K). (2) There is a circular clustering distribution of insignificant values between the built-up area and the marginal area. (3) Social vitality and economic vitality show a high–high aggregation in the center of the built-up area, and a discrete high–low aggregation in the area around the center, which is because scattered villages are closely connected with the city but are relatively backward economically (Figure 6H). (4) Economic vitality and environmental vitality show a discrete low–high aggregation around the city center, which is because the surrounding area is still in the built-up area but mostly consists of residential neighborhoods that lack economic activity sites, resulting in low economic vitality (Figure 6K).

4.3. The Influence of Vitality-Building Factors on the Distribution of Carbon Emissions

The explanatory degree of each building factor of urban vitality on carbon emissions was calculated by using Geodetector. Figure 7 shows that all factors pass the hypothesis test at the 5% level except for the density of cultural facilities. The q value represents the explanatory degree of each factor to urban carbon emissions. As can be seen from the factor detection results, the explanatory power of urban vitality building factors on the spatial distribution of carbon emissions in Xuzhou is x9(NDVI) > x5(depth) > x4(integration) > x6(connection) > x1(disorder) > x2(richness) > x7(catering facilities density) > x3(aggregation) > x8(cultural facilities density). Among them, NDVI shows a strong influence with a q value as high as 0.4526. In the evaluation indexes of social vitality, the explanatory power of road accessibility indexes on carbon emissions is greater than that of POI functional mixture indexes, indicating that the influence of road patterns on carbon emissions distribution is much greater than that of facilities. Among the road accessibility indicators, road depth (q = 0.2925) has the largest explanatory value for carbon emissions, while road connection (q = 0.2119) has the smallest, indicating that road convenience has a greater impact on the spatial distribution of urban carbon emissions. Among the functional mixture indicators, disorder (q = 0.1821) is the largest, and aggregation (q = 0.1483) is the smallest, which indicates that the carbon emissions space is mainly influenced by functional disorder rather than aggregation.
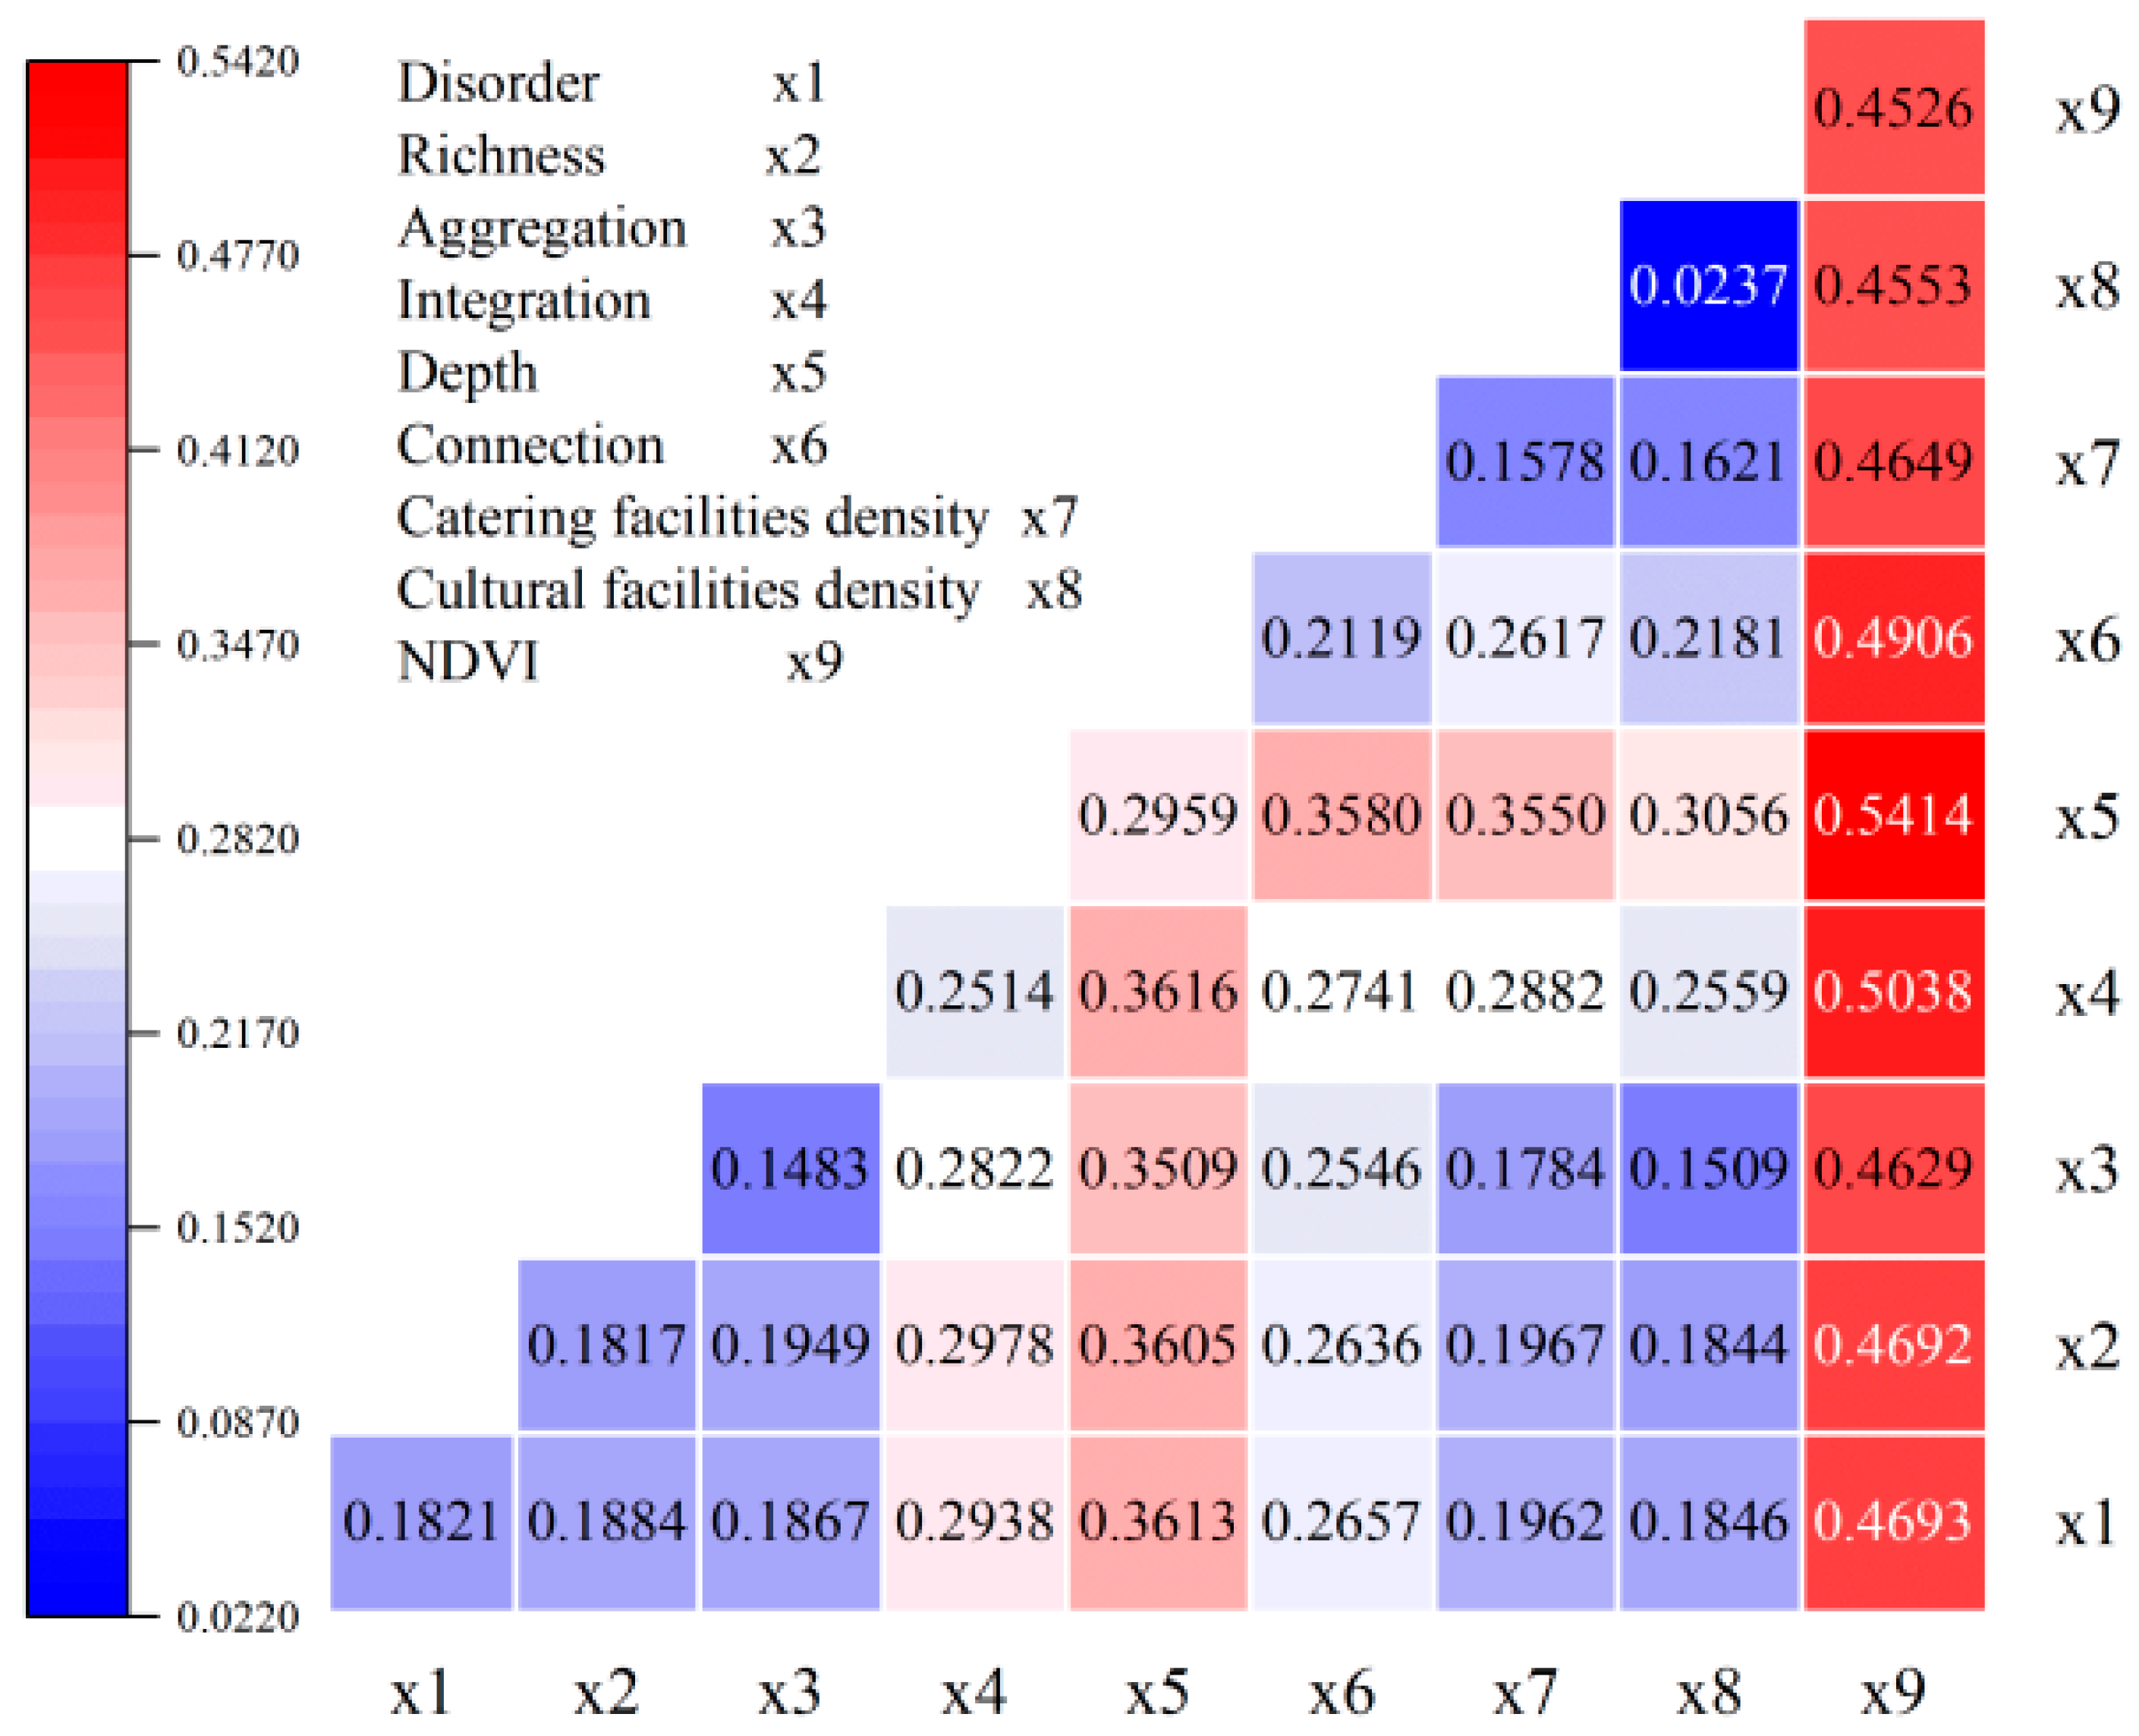
The results of the factor interaction detection (Figure 8) show that any two factors’ interactions show a non-linear enhancement, where the NDVI ∩ depth interaction ranks first in influence (q = 0.5414). The interaction between depth and other factors has the most significant influence on the spatial heterogeneity of urban carbon emissions, followed by integration, which further indicates that roads to a large extent affect the distribution of carbon emissions, and coupled with other factors indirectly affect the intensity of carbon emissions.

5. Discussion

Unlike Europe and the United States, China is undergoing rapid urbanization, and a rough-and-tumble development model will not only produce ghost cities with chaotic management and low quality but will also increase unnecessary carbon emissions. This paper conducted an in-depth quantitative analysis and research on the spatial correlation and driving mechanism between urban vitality and urban carbon emissions in Xuzhou. We evaluated urban vitality by selecting indicators from four perspectives: social, economic, cultural, and environmental. Then, we compared the spatial distribution characteristics of urban vitality in Xuzhou. The relationship between urban carbon emissions and the spatial distribution characteristics of different dimensions of urban vitality was further investigated. Finally, the influence of each building’s factors of urban vitality on urban carbon emissions was analyzed by using Geodetector.

5.1. Spatial Distribution of Urban Vitality

Although previous studies have proposed a large number of urban vitality theories, these results need to be viewed dialectically in the context of different dimensions of urban development. The results show that the comprehensive vitality of Xuzhou decreases from the center to the periphery, showing a monocentric vitality pattern. It can be seen that high vitality has a significant spillover effect, stimulating the development of the surrounding vitality. The high-value areas of vitality in Xuzhou are clustered in the city center, which is compatible with the outcome of Fu et al. that higher vitality in Asian cities tends to be located in central areas [66]. Although Xuzhou’s monocentric development model is consistent with some other Asian cities already in existence [36], the construction of a polycentric structure can promote balanced city development and thus enhance urban vitality from the urban structure perspective [67]. As can be seen from Figure 5, there is a small vitality center under development on Quancheng Road in the northwest of Jiawang District, which can be included in the next key planning and construction area.
Among the three areas with the highest comprehensive vitality value, Pengcheng Square is the largest commercial square in Xuzhou, and Hubu Mountain is the commercial pedestrian street with the highest pedestrian flow, which indicates that commerce has a significant enhancement effect on the region’s vitality. This may be due to the inconsistent level of urban development, where businesses can be more effective in attracting large amounts of social and economic activity in Xuzhou compared with developed areas [66]. Therefore, future policies need to actively foster commercial activities, build large commercial centers or pedestrian streets, and provide a good consumption environment to enhance the vitality of the city. The third high-value area is Yunlong Park in Quanshan District, which has convenient transportation, excellent facilities, a beautiful landscape, and a strong cultural atmosphere. Many previous studies have concluded that urban green spaces have no significant impact on urban vitality [68], but large green spaces are also a valuable resource in cities. In other words, people will be equally attracted to high-quality green spaces, which generate a lot of social and economic behaviors [66]. Comparing the vitality values of different dimensions, we can find that social vitality is more widely distributed and economic activities are generated when a large population gathers. Areas with high cultural vitality gather in areas with high values of economic and social vitality. Convenient transportation and a unique environment promote the cultural vitality of an area, and diverse cultural and leisure activities attract a large population, thus increasing the comprehensive vitality [69], which is the reason why Yunlong Park is one of the three highest vitality areas. Similar to Liu et al.’s findings, cultural and leisure activities do have a disguised stimulating effect on enhancing urban vitality [67]. Based on the TOPSIS model combining entropy weight and CRITIC, Li identified the spatial distribution pattern of street vitality from the social, economic, and cultural dimensions [70]. Consistent with the results of this paper, he found that the distribution of social vitality is relatively even and broader than that of economic vitality. In addition, the comprehensive vitality of regions related to business functions is also higher. The difference was that he believed that a high degree of functional mixture did not lead to a high degree of street vitality. Luo used the analytic hierarchy process (AHP) to build the vitality of urban space and obtained the results that Chengdu presents as a “single-core” development pattern, with high-value areas located in the core business district [71]. Chen used AHP to build community vitality and made a comparative study with the passenger flow in the street map to explore the fundamental driving mechanism of urban vitality [72]. Compatible with the results of this paper, Chen’s study also demonstrated the strong stimulating effect of commerce on urban vitality. In addition, the center of the high value of vitality was also located at the center of the study area and radiated decreasingly outward. However, the results obtained by Chen using two methods showed different vitality levels in some areas, which may be caused by only referring to the opinions of an expert team. The one-sidedness of the weights led to slight differences in the results. In addition, unlike what was proposed in this paper, Chen found that density had the greatest influence on vitality, which may be due to the maximum weight given to density. It can be seen that although subjective weighting does not affect the overall distribution pattern of vitality, it is possible for different rankings due to different attribute preferences of indicators in each alternative.
As we can see, the results of urban vitality distribution obtained by using other methods such as CRITIC and AHP are similar to the findings of this paper in general, which can justify the method of this paper to a certain extent. However, since the research area and the construction indicators are different, it is impossible to precisely identify whether some minor differences between the results of this paper and other studies are caused by the differences in the study area, in the selection of indicators, or the different principles of the methods. In the future, it is necessary to conduct a comparative study of different methods for the same study area and the same index system and further optimize the evaluation methods while supplementing the existing deficiencies. For example, due to the lack of literature on the relative importance of indicators and the lack of expert teams, this paper adopted a more secure objective entropy weight method. However, in the process of urban planning, the measurement of risk is essential, through which one can assess the risk arising from uncertain events beyond control and the consequences that may result from the decisions [73]. Future research should positively consider adding comparative experiments of methods such as AHP methods that can add risk considerations [73] and synergistic TOPSIS that can satisfy indicator equilibrium.

5.2. Relationship between Urban Vitality and Urban Carbon Emissions

The correlation between different dimensions of vitality and urban carbon emissions varies significantly, which to some extent reflects that urban vitality is composed of multiple aspects [49]. There are many factors affecting urban vitality, but different factors have different effects. The spatial distribution of urban carbon emissions is most consistent with that of social vitality, which is consistent with the research result shown in Figure 8 that the contribution of social vitality-building factors to carbon emissions is significantly higher than that of other vitality-building factors. Among them, the contribution of the road factor to the spatial heterogeneity of carbon emission is significantly larger than the distribution of POI facilities. To some extent, the development of urban roads is conducive to carbon reduction. The increase in roads and the encouragement of public transportation can attract citizens to switch from private cars to lower-energy public transport such as buses or subways, which contributes to energy conservation and emissions reduction as well [74]. In addition, dense roads can constitute smaller blocks, which in turn help create more routes and shorter distances, thus encouraging people to choose to walk. Therefore, both the increase in road accessibility and density can reduce regional carbon emissions, but the impact of road density is relatively small [75]. Following the views of Jacobs, many researchers have further confirmed the promoting effect of density on urban vitality [67]. It is worth noting that the results from this paper indicate that the research units with the highest vitality are not all areas with the densest roads, which indicates that the positive effect of density on urban vitality is limited. Moreover, this coincides with the previous findings by Yue et al. that density is not a good indicator of urban vitality [12]; both of our findings reinforce Montgomery’s urbanization research argument that “density itself does not necessarily produce urbanization: it is a necessary but not a sufficient condition for urbanization” [32]. In contrast, the connection (density) has less influence on carbon emissions than that of depth (convenience). Therefore, the government should give priority to road convenience and appropriately increase road density in urban road planning.
For facility distribution, disorder contributes more to carbon emissions than aggregation and richness, and orderly mixed land use is conducive to enhancing urban vitality, while richness and aggregation have no significant correlation with urban vitality. In other words, high richness and randomness of land use are neither conducive to urban carbon emissions reduction nor urban vitality stimulation [67]. The low correlation between carbon emissions and economic vitality and the second-lowest contribution of economic factors are consistent with previous studies that the business level has a small or even negative impact on carbon emissions [76]. Carbon emissions intensity is highly negatively correlated with environmental vitality, and it can be seen that the contribution of NDVI values far exceeds other factors. This is because green space can effectively compensate for carbon loss; therefore, increasing ecological land and reducing construction land can greatly reduce carbon emissions. Urban managers should seriously consider the impact of a green environment when planning land use. Increasing vegetation coverage is not only for carbon emissions reduction but also for improving the living environment, thus enhancing environmental vitality [77]. The effect of cultural facilities on the distribution of carbon emissions is minimal, although it can be influenced by other factors, but the effect is limited. However, the city is an “organic life entity”, and culture is the gene and core of the city. Rich and interesting leisure and cultural activities can stimulate the vitality of the city in a disguised way. Therefore, Xuzhou should focus on enhancing the attractiveness and radiation of the city’s culture, cultivating and developing a distinctive culture.
There is a significant positive correlation between carbon emissions intensity and city scale. The expansion of city size will also result in an increase in commuting time and the use of motor vehicles, which will lead to the intensification of energy consumption and carbon emissions [76]. Therefore, the carbon emissions of cities with monocentric development modes are generally higher during expansion [78]. Although some studies have shown that there is no significant relationship between polycentric spatial patterns and carbon emissions [79], theoretically speaking, building multiple centers can help reduce regional traffic and shorten the distance between residences and offices, and leisure places. In other words, building multiple centers also has a positive effect on urban emissions reduction.

5.3. A New Living Structure for Urban Vitality

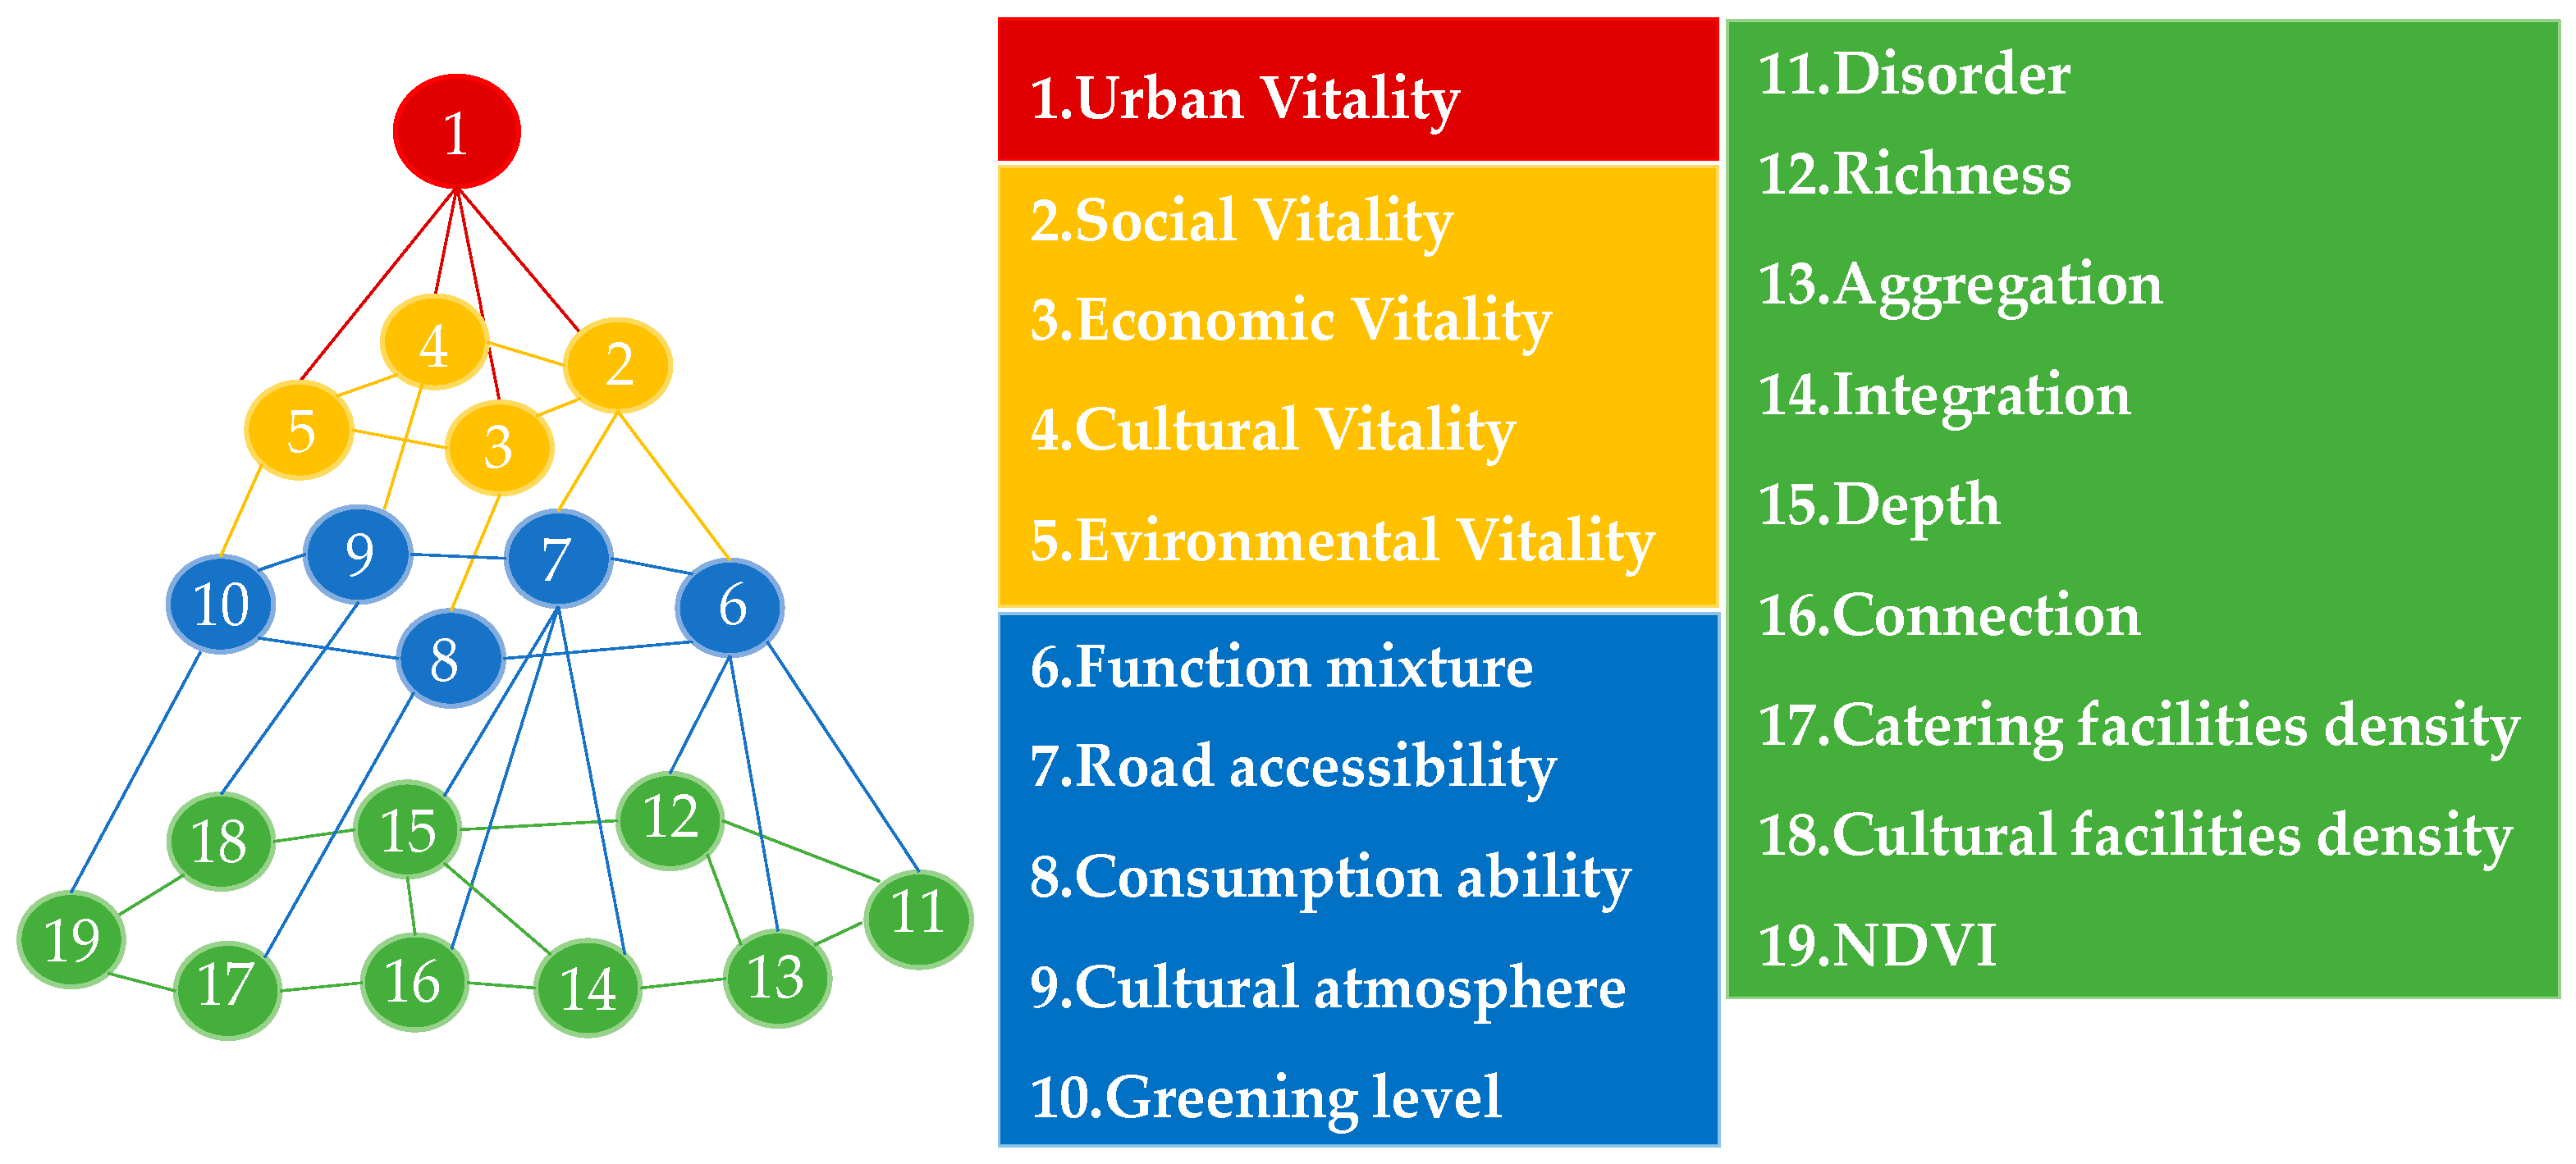
Urban vitality is a complex system. As shown in Figure 9, scaling hierarchy is an important characteristic of a complex system. The scaling hierarchy, or more correctly, a recursive structure that satisfies far more small substructures than large ones [80], is found in all natural or unnatural complex systems, such as social, biological, and information systems [81]. This was originally discovered by observing the cities of natural evolution. In his work, The Nature of Order, Alexander pointed out that beauty, or livingness, or vitality, exists in deep structures, and proposed a refined mathematical concept to capture this inherent order in all complex systems [82]. The order, or living structure as it is called, is essential to evoke the vitality or livingness of the system. The living structure conforms to two laws: all the small substructures are more numerous than the large ones (Scaling law) [83], and the size of the substructures is more or less similar (Tobler’s law) [84]. According to the principle that the more substructures, the more vital, and the higher the hierarchy of the substructures, the more vital [85], a method based on the number of substructures (S) and their inherent hierarchy (H) was used to calculate the livingness of an image (structure), that is L = S * H [86]. It provided an objective measure of how orderly or good a structure is. The goodness of a design is no longer a subjective judgment, but a fact [85]. However, this new order is not well applied in the urban vitality literature currently.
Vitality is also interchangeable with livingness, organized complexity, etc. [4]. Under this concept, urban vitality can also be described as a kind of order. Urban vitality as an organized complex system, a living structure with inherent hierarchy, can be decomposed into countless substructures according to its internal structure and organizational laws. In other words, urban vitality is a complex interlocking network with a recursive structure, rather than a flat hierarchy. However, traditional representations of urban vitality are still mechanical. Therefore, based on the concept of recursion, urban vitality in this paper was organically represented as a life structure (Figure 9). Depending on the number of substructures and the inherent hierarchy, the vitality or living structure can be expressed as L = 19 × 4 = 76.
The study of life structure provides a good enlightenment to urban vitality, which is not composed of prefabricated elements, but rather a coherent whole formed through differentiation, adaptation, and then evolution [87]. In other words, urban vitality is continuously developing and evolving; therefore, more hierarchy and substructures should be added to Figure 9 in the future. The calculation method of L = S × H [86] provides a new approach to the measurement of urban vitality. During the evaluation process, urban vitality is constantly divided and differentiated in order to continuously create new substructures and scale hierarchies. Hence, the research on urban vitality in the future should create more substructures, which can be well suited to wholeness so as to obtain higher vitality. In addition, in the scenario shown in Figure 9, we can see that urban vitality was composed of 19 recursively defined substructures, which means that urban vitality evolved recursively from 19 substructures. In this process, the principles of far more small substructures than large onesand “roughly similar” are satisfied, although the second to third hierarchy is slightly violated, which means that the dividing of the second to third hierarchy should be focused on in the subsequent work.

6. Conclusions

Urban carbon emissions reduction and vitality are inevitable themes in the current studies of urbanization, and the study of the relationship between them is of great significance for future urban development. Different from previous studies, this study integrated two perspectives of urban vitality and urban carbon emissions for analysis. We initially constructed an urban vitality evaluation system and analyzed the spatial heterogeneity of urban vitality distribution in Xuzhou. Then, we explored the spatial distribution relationship between different dimensions of vitality and carbon emissions and further clarified the influence mechanism of different vitality-building factors on the spatial distribution of carbon emissions in Xuzhou. In addition to the results consistent with previous studies, some specific conclusions with regional characteristics were also obtained to provide some suggestions for further urbanization in Xuzhou. The results show that: (1) The construction of the polycentric structure is more conducive to the construction of a low-carbon and high-vitality city. The distribution of vitality in Xuzhou shows a spatially divergent feature of decreasing from the center to the surrounding area, a common monocentric development pattern in Asian cities. In the future, the Xuzhou government can focus on supporting a developing sub-center near Quancheng Road in Gulou District. (2) High-density roads and facilities have a limited positive impact on vitality but will intensify the carbon emission intensity of a region. Cities should pay attention to the rational and orderly planning of land use, balance the supporting construction of housing and employment, and strengthen the coordination arrangement of urban spatial structure and function distribution. Furthermore, cities should plan streamlined and convenient roads and improve the public transportation system to encourage people to travel, shorten commuting distances, and reduce commuting carbon emissions. (3) Culture and environment reflect the soft power and carrying capacity of a city, respectively, which can revitalize the urban vitality of an area and contribute to carbon emissions reduction. Therefore, the dual impact of environment and cultural should be taken into consideration in future spatial planning. Yunlong Park in Xuzhou City is a good case. (4) As can be seen from the distribution of vitality, commerce has a strong stimulating effect on the urban vitality of Xuzhou and has no significant relationship with carbon emissions. The government should actively build large commercial centers or commercial pedestrian streets to provide a good consumption environment.
There are still some limitations in this paper, which will be compensated for in future research. The method that evaluates the vitality of a city from the perspectives of society, economy, environment, and culture applies to any city. However, the evaluation indicators selected in Table 2 still have some deficiencies. Non-spatial factors, such as citizens’ feelings and consumption structure, are difficult to quantify on a micro scale, but to some extent, these indicators will affect the vitality of the city. In addition, this paper considers the cultural facilities’ density to measure urban cultural vitality, which may cause errors in the evaluation results due to the limited data, and a single data source can only describe part of the vitality. In the future, the evaluation framework should be further improved and supplemented, and new indicators should be added. This study explores the relationship between urban vitality and urban carbon emissions, but the correlation between the two is not only reflected in the changes in correlation coefficients and contribution values. In the future, it is necessary to explore quantitatively the different driving mechanisms of different factors on carbon emissions and vitality and further discuss and analyze them using different tools. Finally, based on the concept of living structure, the evaluation model of urban vitality also needs to be further compared and improved.

Author Contributions

Conceptualization, H.Y., A.M.M.T. and Q.H.; methodology, H.Y. and Q.H.; software, Q.H.; validation, Q.H., L.C. and H.Y.; data curation, Q.H.; writing—original draft preparation, Q.H. and H.Y.; writing—review and editing, H.Y. and L.C.; visualization, Q.H.; supervision, H.Y.; funding acquisition, H.Y. All authors have read and agreed to the published version of the manuscript.

Funding

This research was funded by the National Natural Science Foundation of China, grant numbers 41971335, 51978144, and 42201451; the third comprehensive scientific investigation project in Xinjiang, grant number 2022xjkk1006; the Xinjiang Uygur Autonomous Region Key Research and Development Program, grant number 2022B01012-1; and the Science and Technology Innovation Project of Jiangsu Provincial Department of Natural Resources, grant numbers 2022004 and 2022008.

Data Availability Statement

Not applicable.

Acknowledgments

The authors would like to thank the National Institute for Environmental Studies (NIES) for making the ODIAC anthropogenic emission dataset freely available. Our deepest gratitude goes to the anonymous reviewers and editors for their careful work and thoughtful suggestions that have greatly improved this paper.

Conflicts of Interest

The authors declare no conflict of interest.

References

  1. Zhang, L.; Gu, Q.Y.; Guo, J.; Huang, Y. Spatio-Temporal Differentiation Characteristics and Urbanization Factors of Urban Household Carbon Emissions in China. Int. J. Environ. Res. Public Health 2022, 19, 4451. [Google Scholar] [CrossRef]
  2. Lanfen, L. The good life: Criticism and construction of urban meaning. Soc. Sci. China 2010, 31, 133–146. [Google Scholar] [CrossRef]
  3. Guan, X.; Wei, H.; Lu, S. Assessment on the urbanization strategy in China: Achievements, challenges and reflections. Habitat Int. 2018, 71, 97–109. [Google Scholar] [CrossRef]
  4. Jacobs, J. The Death and Life of Great American Cities; Random House: New York, NY, USA, 1961; p. 99. [Google Scholar]
  5. Lynch, K. The Image of the City; The MIT Press: Boston, MA, USA, 1960; p. 46. [Google Scholar]
  6. Wu, J.Y.; Ta, N.; Song, Y.; Lin, J.; Chai, Y.W. Urban form breeds neighborhood vibrancy: A case study using a GPS-based activity survey in suburban Beijing. Cities 2018, 74, 100–108. [Google Scholar] [CrossRef]
  7. Long, Y.; Huang, C.C. Does block size matter? The impact of urban design on economic vitality for Chinese cities. Environ. Plan. B Urban Anal. City Sci. 2019, 46, 406–422. [Google Scholar] [CrossRef]
  8. Jiang, Y.H.; Chen, Z.J.; Sun, P.J. Urban Shrinkage and Urban Vitality Correlation Research in the Three Northeastern Provinces of China. Int. J. Environ. Res. Public Health 2022, 19, 10650. [Google Scholar] [CrossRef]
  9. Lan, F.; Gong, X.Y.; Da, H.L.; Wen, H.Z. How do population inflow and social infrastructure affect urban vitality? Evidence from 35 large- and medium-sized cities in China. Cities 2020, 100, 102454. [Google Scholar] [CrossRef]
  10. Shi, J.A.; Miao, W.; Si, H.Y.; Liu, T. Urban Vitality Evaluation and Spatial Correlation Research: A Case Study from Shanghai, China. Land 2021, 10, 1195. [Google Scholar] [CrossRef]
  11. Liu, S.J.; Zhang, L.; Long, Y.; Long, Y.; Xu, M.H. A New Urban Vitality Analysis and Evaluation Framework Based on Human Activity Modeling Using Multi-Source Big Data. Isprs Int. J. Geo-Inf. 2020, 9, 617. [Google Scholar] [CrossRef]
  12. Yue, Y.; Zhuang, Y.; Yeh, A.G.O.; Xie, J.Y.; Ma, C.L.; Li, Q.Q. Measurements of POI-based mixed use and their relationships with neighbourhood vibrancy. Int. J. Geogr. Inf. Sci. 2017, 31, 658–675. [Google Scholar] [CrossRef]
  13. Fan, Z.X.; Duan, J.; Luo, M.L.; Zhan, H.R.; Liu, M.R.; Peng, W.C. How Did Built Environment Affect Urban Vitality in Urban Waterfronts? A Case Study in Nanjing Reach of Yangtze River. Isprs Int. J. Geo-Inf. 2021, 10, 611. [Google Scholar] [CrossRef]
  14. Yang, J.; Cao, J.; Zhou, Y. Elaborating non-linear associations and synergies of subway access and land uses with urban vitality in Shenzhen. Transp. Res. Part A Policy Pract. 2021, 144, 74–88. [Google Scholar] [CrossRef]
  15. Lu, S.; Huang, Y.; Shi, C.; Yang, X. Exploring the Associations Between Urban Form and Neighborhood Vibrancy: A Case Study of Chengdu, China. Isprs Int. J. Geo-Inf. 2019, 8, 165. [Google Scholar] [CrossRef]
  16. Shunfa, H.; Hui, E.C.m.; Yaoyu, L. Relationship between urban spatial structure and carbon emissions: A literature review. Ecol. Indic. 2022, 144, 109456. [Google Scholar] [CrossRef]
  17. Yi, Y.; Wang, Y.; Li, Y.; Qi, J. Impact of urban density on carbon emissions in China. Appl. Econ. 2021, 53, 6153–6165. [Google Scholar] [CrossRef]
  18. Sun, C.; Zhang, Y.; Ma, W.; Wu, R.; Wang, S. The Impacts of Urban Form on Carbon Emissions: A Comprehensive Review. Land 2022, 11, 1430. [Google Scholar] [CrossRef]
  19. Li, C.; Li, Y.; Shi, K.; Yang, Q. A Multiscale Evaluation of the Coupling Relationship between Urban Land and Carbon Emissions: A Case Study of Chongqing, China. Int. J. Environ. Res. Public Health 2020, 17, 3416. [Google Scholar] [CrossRef]
  20. Dong, D.; Duan, H.; Mao, R.; Song, Q.; Zuo, J.; Zhu, J.; Wang, G.; Hu, M.; Dong, B.; Liu, G. Towards a low carbon transition of urban public transport in megacities: A case study of Shenzhen, China. Resour. Conserv. Recycl. 2018, 134, 149–155. [Google Scholar] [CrossRef]
  21. Cai, M.; Shi, Y.; Ren, C.; Yoshida, T.; Yamagata, Y.; Ding, C.; Zhou, N. The need for urban form data in spatial modeling of urban carbon emissions in China: A critical review. J. Clean. Prod. 2021, 319, 128792. [Google Scholar] [CrossRef]
  22. Wu, C.; Li, G.; Yue, W.; Lu, R.; Lu, Z.; You, H. Effects of Endogenous Factors on Regional Land-Use Carbon Emissions Based on the Grossman Decomposition Model: A Case Study of Zhejiang Province, China. Environ. Manag. 2015, 55, 467–478. [Google Scholar] [CrossRef]
  23. Guo, X.; Chen, H.; Yang, X. An Evaluation of Street Dynamic Vitality and Its Influential Factors Based on Multi-Source Big Data. Isprs Int. J. Geo-Inf. 2021, 10, 143. [Google Scholar] [CrossRef]
  24. Lv, G.; Zheng, S.; Hu, W. Exploring the relationship between the built environment and block vitality based on multi-source big data: An analysis in Shenzhen, China. Geomat. Nat. Hazards Risk 2022, 13, 1593–1613. [Google Scholar] [CrossRef]
  25. Chen, S.; Lang, W.; Li, X. Evaluating Urban Vitality Based on Geospatial Big Data in Xiamen Island, China. Sage Open 2022, 12, 21582440221134519. [Google Scholar] [CrossRef]
  26. Xuzhou Statistics Department; Statistical Bureau. Statistical Bulletin of Xuzhou National Economic and Social Development in 2021 [EB/OL]. Available online: http://tj.xz.gov.cn/xwzx/001004/20220325/f8a67525-ef08-41d1-b962-4002e6d64fe4.html (accessed on 27 November 2022).
  27. Zou, K.; Shu, Y.Q.; Li, G.E. Urban Land-carbon Framework Construction Based on Ecological Network Analysis and Its Space-time Evolution Research. J. Ecol. Rural. Environ. 2022, 38, 972–982. [Google Scholar]
  28. Oda, T.; Maksyutov, S. A very high-resolution (1 km × 1 km) global fossil fuel CO2 emission inventory derived using a point source database and satellite observations of nighttime lights. Atmos. Chem. Phys. 2011, 11, 543–556. [Google Scholar] [CrossRef]
  29. Kobashi, T.; Yoshida, T.; Yamagata, Y.; Naito, K.; Pfenninger, S.; Say, K.; Takeda, Y.; Ahl, A.; Yarime, M.; Hara, K. On the potential of “Photovoltaics plus Electric vehicles” for deep decarbonization of Kyoto’s power systems: Techno-economic-social considerations. Appl. Energy 2020, 275, 115419. [Google Scholar] [CrossRef]
  30. McElwee, P.; Calvin, K.; Campbell, D.; Cherubini, F.; Grassi, G.; Korotkov, V.; Le Hoang, A.; Lwasa, S.; Nkem, J.; Nkonya, E.; et al. The impact of interventions in the global land and agri-food sectors on Nature’s Contributions to People and the UN Sustainable Development Goals. Glob. Chang. Biol. 2020, 26, 4691–4721. [Google Scholar] [CrossRef]
  31. Lei, Y.F.; Lu, C.Y.; Su, Y.; Huang, Y.F. Research on the coupling relationship between urban vitality and urban sprawl based on the multi-source nighttime light data-A case study of the western Taiwan Strait urban Agglomeration. Hum. Geogr. 2022, 37, 119–131. [Google Scholar] [CrossRef]
  32. Montgomery, J. Making a city: Urbanity, vitality and urban design. J. Urban Des. 1998, 3, 93–116. [Google Scholar] [CrossRef]
  33. Jost, L. Entropy and diversity. Oikos 2006, 113, 363–375. [Google Scholar] [CrossRef]
  34. Hill, M.O. Diversity and Evenness: A Unifying Notation and Its Consequences. Ecology 1973, 54, 427–432. [Google Scholar] [CrossRef]
  35. Hsieh, T.C.; Ma, K.H.; Chao, A. iNEXT: An R package for rarefaction and extrapolation of species diversity (Hill numbers). Methods Ecol. Evol. 2016, 7, 1451–1456. [Google Scholar] [CrossRef]
  36. Yue, W.; Chen, Y.; Zhang, Q.; Liu, Y. Spatial Explicit Assessment of Urban Vitality Using Multi-Source Data: A Case of Shanghai, China. Sustainability 2019, 11, 638. [Google Scholar] [CrossRef]
  37. Hillier, B. Centrality as a process: Accounting for attraction inequalities in deformed grids. Urban Des. Int. 1999, 4, 107–127. [Google Scholar] [CrossRef]
  38. Hillier, B.; Hanson, J. The Social Logic of Space; Cambridge University Press: Cambridge, UK, 1989. [Google Scholar]
  39. Hillier, B.; Penn, A.; Hanson, J. Natural movement: Or, configuration and attraction in urban pedestrian movement. Environ. Plan. B Plan. Des. 1993, 20, 29–66. [Google Scholar] [CrossRef]
  40. Lu, Y.; Seo, H.-B. Developing visibility analysis for a retail store: A pilot study in a bookstore. Environ. Plan. B Plan. Des. 2015, 42, 95–109. [Google Scholar] [CrossRef]
  41. Zikirya, B.; He, X.; Li, M.; Zhou, C. Urban Food Takeaway Vitality: A New Technique to Assess Urban Vitality. Int. J. Environ. Res. Public Health 2021, 18, 3578. [Google Scholar] [CrossRef]
  42. Wang, W.W.; Wang, S.; Chen, H.; Liu, L.J.; Fu, T.L.; Yang, Y.X. Analysis of the Characteristics and Spatial Pattern of the Catering Industry in the Four Central Cities of the Yangtze River Delta. Isprs Int. J. Geo-Inf. 2022, 11, 321. [Google Scholar] [CrossRef]
  43. Ye, Y.; Li, D.; Liu, X. How block density and typology affect urban vitality: An exploratory analysis in Shenzhen, China. Urban Geogr. 2018, 39, 631–652. [Google Scholar] [CrossRef]
  44. Gan, X.Y.; Huang, L.; Wang, H.Y.; Mou, Y.C.; Wang, D.; Hu, A. Optimal Block Size for Improving Urban Vitality: An Exploratory Analysis with Multiple Vitality Indicators. J. Urban Plan. Dev. 2021, 147, 04021027. [Google Scholar] [CrossRef]
  45. Montalto, V.; Moura, C.J.T.; Langedijk, S.; Saisana, M. Culture counts: An empirical approach to measure the cultural and creative vitality of European cities. Cities 2019, 89, 167–185. [Google Scholar] [CrossRef]
  46. Pohan, A.F.; Ginting, N.; Zahrah, W. Case study: Asia Mega Mas Shophouse Area, Medan. In Proceedings of the 1st International Conference on Industrial and Manufacturing Engineering (ICI and ME), Medan, Indonesia, 16 October 2018. [Google Scholar]
  47. Zhu, J.; Lu, H.; Zheng, T.; Rong, Y.; Wang, C.; Zhang, W.; Yan, Y.; Tang, L. Vitality of Urban Parks and Its Influencing Factors from the Perspective of Recreational Service Supply, Demand, and Spatial Links. Int. J. Environ. Res. Public Health 2020, 17, 1615. [Google Scholar] [CrossRef]
  48. Kaya, I.; Colak, M.; Terzi, F. A comprehensive review of fuzzy multi criteria decision making methodologies for energy policy making. Energy Strategy Rev. 2019, 24, 207–228. [Google Scholar] [CrossRef]
  49. Liu, D.X.; Shi, Y.S. The Influence Mechanism of Urban Spatial Structure on Urban Vitality Based on Geographic Big Data: A Case Study in Downtown Shanghai. Buildings 2022, 12, 569. [Google Scholar] [CrossRef]
  50. Kubler, S.; Robert, J.; Derigent, W.; Voisin, A.; Le Traon, Y. A state-of the-art survey & testbed of fuzzy AHP (FAHP) applications. Expert Syst. Appl. 2016, 65, 398–422. [Google Scholar] [CrossRef]
  51. Hobbs, B.F.; Chankong, V.; Hamadeh, W.; Stakhiv, E.Z. Does choice of multicriteria method matter? An experiment in water resources planning. Water Resour. Res. 1992, 28, 1767–1779. [Google Scholar] [CrossRef]
  52. Tzeng, G.H.; Huang, J.J. Multiple Attribute Decision Making: Methods and Applications; CRC Press: Boca Raton, FL, USA, 2011. [Google Scholar]
  53. Zavadskas, E.K.; Mardani, A.; Turskis, Z.; Jusoh, A.; Nor, K.M.D. Development of TOPSIS Method to Solve Complicated Decision-Making Problems: An Overview on Developments from 2000 to 2015. Int. J. Inf. Technol. Decis. Mak. 2016, 15, 645–682. [Google Scholar] [CrossRef]
  54. Shi, Y.; Liu, D. Relationship between Urban New Business Indexes and the Business Environment of Chinese Cities: A Study Based on Entropy-TOPSIS and a Gaussian Process Regression Model. Sustainability 2020, 12, 10422. [Google Scholar] [CrossRef]
  55. Djordjevic, B.; Krmac, E. Evaluation of Energy-Environment Efficiency of European Transport Sectors: Non-Radial DEA and TOPSIS Approach. Energies 2019, 12, 2907. [Google Scholar] [CrossRef]
  56. Zavadskas, E.K.; Kaklauskas, A.; Kalibatas, D.; Turskis, Z.; Krutinis, M.; Bartkiene, L. Applying the TOPSIS-F Method to Assess Air Pollution in Vilnius. Environ. Eng. Manag. J. 2018, 17, 2041–2050. [Google Scholar] [CrossRef]
  57. Dong, Y.H.; Peng, F.L.; Guo, T.F. Quantitative assessment method on urban vitality of metro-led underground space based on multi-source data: A case study of Shanghai Inner Ring area. Tunn. Undergr. Space Technol. 2021, 116, 104108. [Google Scholar] [CrossRef]
  58. Anselin, L. Local indicators of spatial association—LISA. Geogr. Anal. 1995, 27, 93–115. [Google Scholar] [CrossRef]
  59. Anselin, L.; Syabri, I.; Smirnov, O. Visualizing multivariate spatial correlation with dynamically linked windows. In Proceedings of the CSISS Workshop on New Tools for Spatial Data Analysis, Santa Barbara, CA, USA, 12 November 2002. [Google Scholar]
  60. Cima, E.G.; Uribe-Opazo, M.A.; Johann, J.A.; da Rocha, W.F., Jr.; Dalposso, G.H. Analysis of Spatial Autocorrelation of Grain Production and Agricultural Storage in Parana. Eng. Agric. 2018, 38, 395–402. [Google Scholar] [CrossRef]
  61. Wang, J.F.; Xu, C.D. Geodetector: Principle and prospective. Acta Geogr. Sin. 2017, 72, 116–134. [Google Scholar]
  62. Zhou, X.; Wen, H.; Zhang, Y.; Xu, J.; Zhang, W. Landslide susceptibility mapping using hybrid random forest with GeoDetector and RFE for factor optimization. Geosci. Front. 2021, 12, 101211. [Google Scholar] [CrossRef]
  63. Wang, H.; Qin, F.; Xu, C.; Li, B.; Guo, L.; Wang, Z. Evaluating the suitability of urban development land with a Geodetector. Ecol. Indic. 2021, 123, 107339. [Google Scholar] [CrossRef]
  64. Zhang, X.; Liao, L.; Xu, Z.; Zhang, J.; Chi, M.; Lan, S.; Gan, Q. Interactive Effects on Habitat Quality Using InVEST and GeoDetector Models in Wenzhou, China. Land 2022, 11, 630. [Google Scholar] [CrossRef]
  65. Yue, W.Z.; Chen, Y.; Thy, P.T.M.; Fan, P.L.; Liu, Y.; Zhang, W. Identifying urban vitality in metropolitan areas of developing countries from a comparative perspective: Ho Chi Minh City versus Shanghai. Sustain. Cities Soc. 2021, 65, 102609. [Google Scholar] [CrossRef]
  66. Fu, R.; Zhang, X.; Yang, D.; Cai, T.; Zhang, Y. The Relationship between Urban Vibrancy and Built Environment: An Empirical Study from an Emerging City in an Arid Region. Int. J. Environ. Res. Public Health 2021, 18, 525. [Google Scholar] [CrossRef]
  67. Liu, S.; Zhang, L.; Long, Y. Urban Vitality Area Identification and Pattern Analysis from the Perspective of Time and Space Fusion. Sustainability 2019, 11, 4032. [Google Scholar] [CrossRef]
  68. Sung, H.G.; Go, D.H.; Choi, C.G. Evidence of Jacobs’s street life in the great Seoul city: Identifying the association of physical environment with walking activity on streets. Cities 2013, 35, 164–173. [Google Scholar] [CrossRef]
  69. Li, Q.; Cui, C.; Liu, F.; Wu, Q.; Run, Y.; Han, Z. Multidimensional Urban Vitality on Streets: Spatial Patterns and Influence Factor Identification Using Multisource Urban Data. Isprs Int. J. Geo-Inf. 2022, 11, 2. [Google Scholar] [CrossRef]
  70. Li, M.Y.; Pan, J.H. Assessment of Influence Mechanisms of Built Environment on Street Vitality Using Multisource Spatial Data: A Case Study in Qingdao, China. Sustainability 2023, 15, 1518. [Google Scholar] [CrossRef]
  71. Luo, Z.Z.; Zhang, Y.Z. Analysis of the distribution of Vitality Spaces in main urban areas of Chengdu city based on POI big data. Ind. Constr. 2021, 51, 53–61. [Google Scholar] [CrossRef]
  72. Chen, J.L.; Tian, W.K.; Xu, K.X.; Pellegrini, P. Testing Small-Scale Vitality Measurement Based on 5D Model Assessment with Multi-Source Data: A Resettlement Community Case in Suzhou. Isprs Int. J. Geo-Inf. 2022, 11, 626. [Google Scholar] [CrossRef]
  73. Kut, P.; Pietrucha-Urbanik, K. Most Searched Topics in the Scientific Literature on Failures in Photovoltaic Installations. Energies 2022, 15, 8108. [Google Scholar] [CrossRef]
  74. Li, H.; Strauss, J.; Liu, L. A Panel Investigation of High-Speed Rail (HSR) and Urban Transport on China’s Carbon Footprint. Sustainability 2019, 11, 2011. [Google Scholar] [CrossRef]
  75. Shu, Y.; Lam, N.S.N. Spatial disaggregation of carbon dioxide emissions from road traffic based on multiple linear regression model. Atmos. Environ. 2011, 45, 634–640. [Google Scholar] [CrossRef]
  76. Shen, Y.S.; Lin, Y.C.; Cui, S.; Li, Y.; Zhai, X. Crucial factors of the built environment for mitigating carbon emissions. Sci. Total Environ. 2022, 806, 150864. [Google Scholar] [CrossRef]
  77. Chuai, X.W.; Yuan, Y.; Zhang, X.Y.; Guo, X.M.; Zhang, X.L.; Xie, F.J.; Zhao, R.Q.; Li, J.B. Multiangle land use-linked carbon balance examination in Nanjing City, China. Land Use Policy 2019, 84, 305–315. [Google Scholar] [CrossRef]
  78. Li, S.; Xue, F.; Xia, C.; Zhang, J.; Bian, A.; Lang, Y.; Zhou, J. A Big Data-Based Commuting Carbon Emissions Accounting Method-A Case of Hangzhou. Land 2022, 11, 900. [Google Scholar] [CrossRef]
  79. Liu, K.; Xue, M.; Peng, M.; Wang, C. Impact of spatial structure of urban agglomeration on carbon emissions: An analysis of the Shandong Peninsula, China. Technol. Forecast. Soc. Chang. 2020, 161, 120313. [Google Scholar] [CrossRef]
  80. Jiang, B. Living Structure Down to Earth and Up to Heaven: Christopher Alexander. Urban Sci. 2019, 3, 96. [Google Scholar] [CrossRef]
  81. Jiang, B. A complex-network perspective on Alexander’s wholeness. Phys. A Stat. Mech. Its Appl. 2016, 463, 475–484. [Google Scholar] [CrossRef]
  82. Alexander, C. The Nature of Order; Taylor & Francis: Berkeley, CA, USA, 2004. [Google Scholar]
  83. Jiang, B. Geospatial Analysis Requires a Different Way of Thinking: The Problem of Spatial Heterogeneity. In Trends in Spatial Analysis and Modelling of Settlements and Infrastructure, Proceedings of the 1st International Land Use Symposium (ILUS), Dresden, Germany, 11–13 November 2015; Springer: Berlin/Heidelberg, Germany; pp. 23–40.
  84. Tobler, W.R. A computer movie simulating urban growth in the Detroit region. Econ. Geogr. 1970, 46, 234–240. [Google Scholar] [CrossRef]
  85. Jiang, B.; de Rijke, C. Representing geographic space as a hierarchy of recursively defined subspaces for computing the degree of order. Comput. Environ. Urban Syst. 2022, 92, 101750. [Google Scholar] [CrossRef]
  86. Jiang, B.; de Rijke, C. Structural Beauty: A Structure-Based Computational Approach to Quantifying the Beauty of an Image. J. Imaging 2021, 7, 78. [Google Scholar] [CrossRef] [PubMed]
  87. Jiang, B.; Huang, J.T. A new approach to detecting and designing living structure of urban environments. Comput. Environ. Urban Syst. 2021, 88, 101646. [Google Scholar] [CrossRef]
Figure 1. The main urban area of Xuzhou.
Remotesensing 15 02173 g001
Figure 2. Spatial distribution of carbon emissions in Xuzhou. ① Xuzhou Chacheng electric Co., Ltd. ② Jiangsu Huamei Thermoelectric Co., Ltd, ③ Xuzhou Huarun Electric Power Co., Ltd. ④ Xuzhou Power Generation Co., Ltd.; Xuzhou Tianyu Gas Power Generation Co., Ltd ⑤. Xukuang Comprehensive Utilization Power Generation Co., Ltd. ⑥ Jiangsu Kanshan Power Generation Co., Ltd.
Remotesensing 15 02173 g002
Figure 3. The conceptual framework.
Remotesensing 15 02173 g003
Figure 4. Road accessibility distribution map in Xuzhou.
Remotesensing 15 02173 g004
Figure 5. Multi-dimensional vitality in Xuzhou.
Remotesensing 15 02173 g005
Figure 6. Multi-dimensional vitality in Xuzhou. (A) Comprehensive vitality and CO2; (B) economic vitality and CO2; (C) social vitality and CO2; (D) environmental vitality and CO2; (E) comprehensive vitality and economic vitality; (F) comprehensive vitality and social vitality; (G) comprehensive vitality and environmental vitality; (H) social vitality and economic vitality; (I) social vitality and environmental vitality; (J) social vitality and cultural vitality; (K) economic vitality and environmental vitality; and (L) economic vitality and cultural vitality.
Remotesensing 15 02173 g006
Figure 7. The q statistic of different factors. **: Significant correlation.
Remotesensing 15 02173 g007
Figure 8. Factor interaction detection results.
Remotesensing 15 02173 g008
Figure 9. The living structure of urban vitality.
Remotesensing 15 02173 g009
Table 1. Classification of POI.
Function TypeCountsProportion
Catering17,27943.23%
Guesthouse15933.99%
Education28537.14%
Medical18884.72%
Entertainment28117.03%
Public administration and service764719.13%
Commercial service1470.37%
Transport facilities575114.39%
Table 2. Evaluation index system of urban vitality.
DimensionsIndicatorsInformation EntropyWeight
Function mixtureDisorder(X1)0.9136.495%
Richness(X2)0.8848.619%
Aggregation(X3)10.001%
Road accessibilityIntegration(X4)0.85111.067%
Depth(X5)0.9076.927%
Connection(X6)0.85211.049%
Consumption abilityCatering facilities density(X7)0.69822.475%
Cultural atmosphereCultural facilities density(X8)0.55433.159%
Greening levelNDVI(X9)0.9970.208%
Table 3. Moran’ I of different dimensions of vitality and carbon emissions.
BivariateMoran’ I
CO2 EmissionComprehensive vitality0.440
Social vitality0.500
Economic vitality0.375
Environment vitality−0.626
Cultural vitality0.133
Comprehensive vitalitySocial vitality0.491
Economic vitality0.381
Environment vitality−0.328
Cultural vitality0.141
Social vitalityEconomic vitality0.407
Disclaimer/Publisher’s Note: The statements, opinions and data contained in all publications are solely those of the individual author(s) and contributor(s) and not of MDPI and/or the editor(s). MDPI and/or the editor(s) disclaim responsibility for any injury to people or property resulting from any ideas, methods, instructions or products referred to in the content.