Abstract
The mitigation of the urban heat island effect is increasingly imperative in light of climate change. Blue–green space, integrating water bodies and green spaces, has been demonstrated to be an effective strategy for reducing the urban heat island effect and enhancing the urban environment. However, there is a lack of coupled analysis on the cooling island effect of blue–green space at the meso-micro scale, with previous studies predominantly focusing on the heat island effect. This study coupled the single urban canopy model (UCM) with the mesoscale Weather Research and Forecasting (WRF) numerical model to simulate the cooling island effect of blue–green space in the Eastern Sea-River-Stream-Lake Linkage Zone (ESLZ) within the northern subtropical zone. In particular, we comparatively investigated the cooling island effect of micro-scale blue–green space via three mitigation strategies of increasing vegetation, water bodies, and coupling blue–green space, using the temperature data at the block scale within 100 m square of the urban center on the hottest day in summer. Results showed that the longitudinally distributed lakes and rivers in the city had a significant cooling effect on the ambient air temperature (Ta) at the mesoscale, with the largest cooling range occurring during the daytime and ranging from 1.01 to 2.15 °C. In contrast, a 5~20% increase in vegetation coverage or 5~15% increase in water coverage at the micro-scale was observed to reduce day and night Ta by 0.71 °C. Additionally, the most significant decrease in physiologically equivalent temperature (PET) was found in the mid-rise building environment, with a reduction of 2.65–3.26 °C between 11:00 and 13:00 h, and an average decrease of 1.25°C during the day. This study aims to guide the optimization of blue–green space planning at the meso-micro scale for the fast-development and expansion of new urban agglomerations.
1. Introduction
With global warming and urbanization, urban heat islands (UHI) have become more intense and widespread, leading to an increase in extreme temperature-related disasters [1,2,3,4]. Multidisciplinary research focusing on urban thermal environmental effects, climate variability, and natural hazards, etc have been previously conducted to address the UHI effect [5,6,7]. One key strategy is to utilize blue–green landscapes, including mountains, streams, lakes, green areas, and wetlands, which have been shown to play a significant role in controlling and enhancing the local climate and ecology. In response to regional climate and environmental issues, urban spatial planning and design have increasingly embraced the strategy of utilizing urban blue–green space systems. This involves protecting, restoring, and building green and blue landscapes in urban areas while enhancing the intrinsic porosity and microcirculation capacities of cities.
Blue–green space refers to blue space (rivers and lakes) and green space (lawns and trees), which have an evident cooling island effect [8,9]. Because of its environmental protection and cost-effectiveness, the cooling island effect of blue–green space has been increasingly acknowledged as a potential and effective way to alleviate the urban heat island effect [9,10,11,12]. Improving regional and urban blue–green space, analyzing the evolution and changing characteristics of cooling island effects, and enhancing permeability within cities and regions have become crucial approaches for urban areas to fulfill national ecological priorities and promote green development.
The cooling island effect of the blue–green space depends on its scale, structure, type, density, connectedness, and sophistication [13,14,15,16]. The layout design and structure of green space affects its cooling ability. Furthermore, compared with a single large area of green space, closely spaced and well-connected green space can provide better cooling island effects for adjacent urban areas [17,18]. However, the cooling island effect of blue–green space at a multi-spatial scale and their interactions haven’t been fully studied [19,20,21,22,23]. In addition, the positive correlation between the area of blue–green space and the intensity of the cooling island was widely recognized by many previous studies, so increasing the density of blue–green space has been a common technique for enhancing the urban cooling island effect and solving the UHI effect [24,25,26]. While previous studies on the cooling island effect have primarily focused on heat island mitigation strategies for vegetation at various spatial scales, few have investigated the interrelationships between these strategies and the different forms of blue–green space [27,28,29,30,31,32,33,34,35,36].
In this study, the cooling island effect of blue–green space on different spatial scales was systematically studied. We used the meso-micro scale model coupling analysis method to investigate the cooling island effect of blue–green space in northern subtropical zone regions and cities and simulated the influence of different forms of blue–green space on the thermal environment of central urban areas. Specifically, we aimed to (Figure 1): (1) explore the cooling island effect of blue–green space and its influencing factors at two different scales of region and block; (2) comparatively analyze the influences of blue–green spatial patterns on thermal environment heterogeneity under different building environments; and (3) establish the relationship between blue–green space distributions and their associated cooling effects at the meso-micro scale.
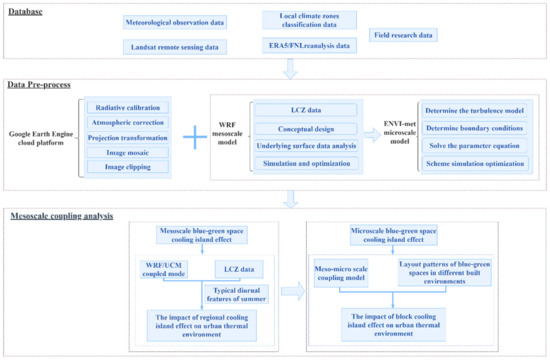
Figure 1.
Flow chart.
2. Study Area
The northern boundary of the northern subtropical zone, which corresponds to the 0 °C isotherm of the average temperature in the coldest month of January, is a well-known north–south boundary in China’s physical geography. The temperature zone boundary exhibits a significant trend of shifting toward higher latitudes due to global change. The spatial distribution of the northern subtropical zone is particularly sensitive to global warming. To understand the potential impact of climate change on natural landscapes, it is essential to have a thorough understanding of the spatial variation characteristics of urban ecology.
Since October 2018, the Huaihe River Ecological Economic Belt has been elevated as a part of a national strategy. The eastern Huaihe River Lake Linkage Zone, which is part of the northern subtropical zone and includes Huai’an, Yancheng, Yangzhou, Taizhou, and Chuzhou, and boasts natural location advantages (Figure 2). Except for Huai’an, the other four cities belong to the ESLZ’s world-class urban agglomeration, the Yangtze River Delta. The Yangtze River Delta is China’s fastest-growing economic region and has developed into one of the six greatest urban agglomerations globally, with particularly pronounced summer heat island effects. The ESLZ, driven by the development of world-class urban agglomerations, is unavoidably impacted by the growing urban heat island effect, becoming a typical area affected by the urbanization process and rapid urbanization in China. Being near the sea, the ESLZ has abundant water and green spaces that provide favorable conditions for studying the cooling island effect of blue–green space.
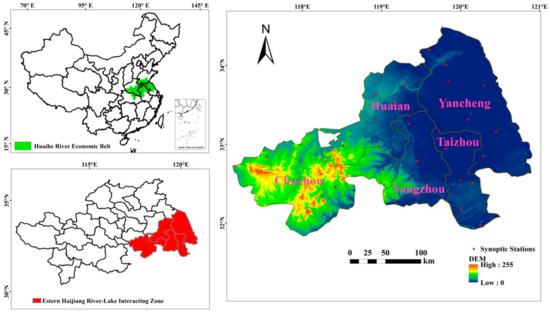
Figure 2.
Study area.
3. Data and Method
3.1. Classification Data Based on Local Climate Zones
The LCZ classification system comprises building types and land cover types, each with 17 subcategories under two types. Building types range from LCZ 1 to LCZ 10, while land cover types include LCZ A to LCZ G [37]. Given that land cover characteristics can change due to climate change, agricultural cultivation, and seasonal cycles, land cover types are further assigned four variable characteristics, namely b, s, d, and w [38].
3.2. Relevant Data of National Meteorological Observation Stations
The data sets used in this study include: (1) spatial distribution data consisting of hourly and daily observations of elements such as temperature, air pressure, relative humidity, water vapor pressure, wind, and precipitation from 2472 national meteorological observation stations from 2000 to 2020. (2) The monthly grid dataset of surface temperature provided by the Meteorological Data Center of the China Meteorological Administration (V2.0) (http://data.cma.cn/, accessed on 20 May 2020). This dataset is based on the National Meteorological Information Center’s special project of basic data and contains the latest temperature data from high-density ground stations in China (2472 national meteorological observation stations). The data covers a time scale from 1961 to the present and has a horizontal resolution of 0.5° × 0.5°.
3.3. WRF Driving Field Reanalysis Data
The data set used in this study is the Final Operational Global Analysis (FNL) data provided by the National Centers for Environmental Prediction (NCEP) (http://rda.ucar.edu/datasets). This data set is generated by the Global Data Assimilation System (GDAS), which integrates a large number of ground observation data and satellite remote sensing inversion data. The FNL data has a horizontal resolution of 1° × 1° and is available four times a day (0000 UTC, 0600 UTC, 1200 UTC, 1800 UTC). The data covers a time scale from July 1999 to the present and has a total of 26 layers from 1000 hPa to 10 hPa in the vertical direction.
3.4. World Urban Database and Access Portal Tools
The World Urban Database and Access Portal Tools (WUDAPT) Level 0 method [39,40] creates an LCZ map using free tools and public satellite data. This method consists of three steps: (1) data preprocessing; (2) digitizing and evaluating sample training areas using Google Earth; and (3) LCZ classification using SAGA GIS. On 5 August 2018, the USGS acquired Landsat-8 Level-1 Terrain Correction (LT1) data through the Earth Explorer portal. The spatial resolution is 30 m in the visible near-infrared and short-wave infrared bands of Landsat-8, and 100 m in the thermal infrared band. All data is projected and clipped to the region of interest (ROI) using SAGA GIS. At least 20 identical training sample regions for each of the 17 LCZ categories in ROI are selected and manually photographed by Google Earth. The second set of existing LCZ sites are categorized using the distinctive spectral signal per each LCZ training category, which has been identified. The SAGA precision matrix polygon array software is used to assess the classification accuracy of the second group, and each member’s forecasted LCZ class is compared to its training class. After several iterations, the overall training classification results are integrated into the SAGA classification model to classify the entire ROI. Resampling generates an LCZ map at a resolution of 400 m, which is then assembled into a 1 km grid while keeping a classification of 17 classes to generate the desired WRF input.
3.5. Overview of WRF/UCM Coupling Model
To simulate the physical processes involved in heat, momentum, and atmospheric water exchange in mesoscale complex urban environments, the urban canopy model (UCM) is coupled with the Weather Research and Forecasting (WRF) model. The key principle of the coupled model is to improve the parameterization of the lower boundary conditions to provide reliable and accurate urban climate island (UCI) simulations for the study area. WRF/UCM is a single-layer mesoscale model that considers a generalized urban geometric environment, including building shadows, reflections of short- and long-wave radiation, wind profiles of canopies, and multi-layer heat transfer equations for roofs, walls, and pavement [41,42]. WRF/UCM is a single-layer model that can reproduce the urban blue–green space with a broad urban structure and geometry, providing more accurate horizontal weather prediction and improved boundary conditions for simulation. In the past two decades, the eastern seaboard of Luzon (ESLZ) has experienced rapid and unplanned urbanization, with many unoccupied pieces of land being developed into built-up areas. Thus, proper land-use and land-cover change (LUCC) data are required to capture the fast urbanization model to mimic the climate characteristics of the urban heat island (UHI) according to LUCC. However, the WRF model cannot adequately depict the existing scenario of urban expansion in the ESLZ in recent years due to the outdated default AVHRR/MODIS satellite data. Hence, the LCZ data with a spatial resolution of 400 m was used for the simulation. Overall, the paper focuses on construction land, green space, and water bodies since the proportion of bare land is low.
3.5.1. Synoptic Background
This simulation considers the typical summer temperature from 4 to 7 August 2018. The temperature recorded by the meteorological center in this area reached as high as 46.85 °C, which was the hottest period observed during the summer months of June through August in the past 21 years. The selected period had low wind speeds, less cloud cover, and less precipitation, making it conducive to the daily-scale study of the cooling island effect in blue–green spaces. Therefore, the chosen period is appropriate for evaluating the efficiency of the WRF/UCM model in presenting the expected UCI phenomenon.
3.5.2. Mode Configuration
The simulation area is centered at (33°N, 120°E) and consists of 3 layers of bidirectional nesting with 441 × 342, 717 × 546, and 1176 × 885 grid points that are located in the east–west and north–south orientations, correspondingly (Figure 3). The horizontal resolutions of the first (outermost), second, and third (innermost) multi-grid are 10 km, 2 km, and 0.4 km, respectively. There are 33 layers in the vertical direction, and the model top layer pressure is 50 hPa. The integration time of all experiments is from 02:00 on 4 August 2018 to 02:00 on 6 August 2018, and the simulation results are output every hour. The period between 02:00–24:00 on 4 August 2018 is the adjustment stage of the model, without analysis [35,36,43]. The day of 5 August 2018 serves as model analysis time (Table 1).

Figure 3.
Three-layer nesting with horizontal resolutions of (d01: Outermost layer) 10 km, (d02: Second layer) 2 km, and (d03: Innermost layer) 0.4 km.

Table 1.
Physical parameters in WRF-UCM V4.0.3.
The microclimate environment of each LCZ was tested through the observation of various meteorological parameters and the results of model derivation. Additionally, the UCI value was measured by the temperature difference between the LCZs [44]. The microenvironment of the built urban environment can be influenced by a wide range of urban factors, including urban morphology, urban substances, and urban greenery, and their intricate interactions need to be investigated and studied to formulate urban planning strategies with resilient climates [45,46,47]. The ENVI-met study area is a 300 m square centered on the intersection of two major commercial boulevards, with a few surrounding residences (Figure 4). The site is a crowded shopping area and a gathering spot for local communities. Its off-core urban typology is common to many Chinese and global cities: a mix of commercial and residential structures with sparse vegetative coverage. Considering that this paper evaluated the relevant parameters of the ESLZ and compared them in different urban environment modeling scenarios, the input parameters of the initial model of the ENVI-met simulation are shown in Table 2.

Figure 4.
Input comparison of three UHI thermal heterogeneous environment models; open mid-rise: Hengdui, Huai‘an City; open low-rise: Yandu District Education Bureau, Yancheng City; compact low-rise: Xuansheng Temple, Yangzhou City).
Table 2.
ENVI-met simulation initial model input parameters.
To compare the effects of blue–green space on UCI enhancement under three different UHI environments, three building environment models were selected for simulation. The LCZ was adjusted according to three thermodynamic properties: summer temperature, inter-seasonal temperature divergence, and deviation from average temperature. In this study, the fractal network evolution method was used to scale the UHI phenomenon in the study area, and the thermal field conditions were divided into high, medium, and low levels using a single beta distribution. It should be noted that, due to the urban environmental structure and density of the study area, only three types of buildings were considered: open middle-rise, open low-rise, and compact low-rise buildings (Figure 4). Soil and meteorological datasets were regularly monitored and collected using weather stations located at the center of each LCZ. Additionally, a handheld GPS was used to record auxiliary data such as vegetation location, and the ENVI-met model was used to update detailed information of land use, input files, and surface materials to evaluate the effects of different types of greenery on the built environment.
3.6. Intensity Analysis of Urban Cooling Island Effect
The UCI intensity is defined according to the temperature difference between the temperature of the urban blue–green space and the temperature of the construction land, which is expressed by Equation (1):
where △Tr-u is the UCI intensity, tr is the blue–green space temperature, and tu is the urban construction land temperature. The positioning of meteorological stations in the ESLZ were selected, and the changes of WRF/UCM temperature values and LCZ distribution were superimposed and analyzed. At the same time, according to the local distribution pattern of LCZ, the average value of T2m of crop fields, vegetation, water bodies, and wetlands were selected to calculate tr.
△Tr-u = tr − tu
4. Results and Analysis
In this paper, the WUDAPT level 0 method was used to obtain the LCZ distribution map of the ESLZ, as shown in Figure 5. Table 3 indicates an overall accuracy rate of 85.9% and a Kappa coefficient of 0.81, demonstrating high accuracy. Non-urban LCZ classes A, D, and G demonstrated high precision, while urban classes with accuracy ranging from 70% to 90% include LCZ 4, 8, and 9. LCZ 2, 10, and E had the lowest precision, likely due to containing only 38, 18, and 32 training regions, respectively. Some classes exhibited poor accuracy, with larger non-diagonal values, namely dense low-rise and scattered buildings (162 out of 426 regions) and open low-rise and scattered buildings (132 out of 176 regions). Accuracy was also poor between sparsely built and large low-rise (199 out of 920), large low-rise and heavy industry (6 out of 18), and open high-rise and open low-rise (175 out of 881).
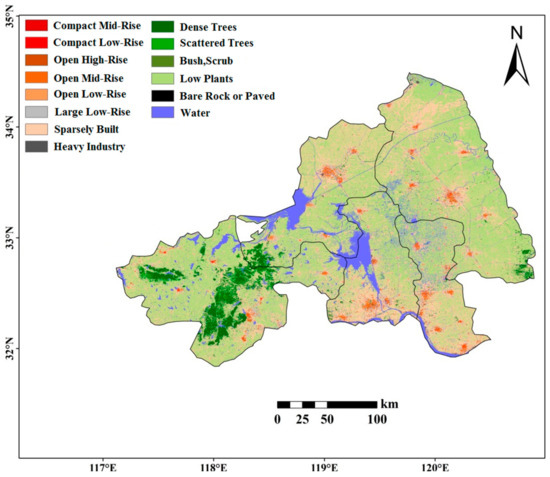
Figure 5.
LCZ classification in the study area.
Table 3.
Accuracy Matrix for WUDAPT level 0 training areas.
4.1. WRF/UCM Mode Verification and Assessment
The 2 m air temperature data obtained from the WRF model (shown in Figure 6 and Figure 7) with a spatial resolution of 400 m were used as the input field data for the micro-scale urban planning model ENVI-met. In order to verify the implementation of the WRF/UCM model, the simulation results were compared with average daily and hourly observational data from 31 meteorological stations in the study area. The results show that the simulated T2m values agree well with the observed T2m values on a daily basis (see Figure 8), indicating that WRF/UCM can accurately reproduce the daily variation of T2m. Furthermore, the differences between the simulated and observed T2m values, as well as the coefficient of determination, were evaluated (see Table 4). The deviation between the simulation and observed T2m values was relatively small, ranging from 0.57 to 1.26 °C. The model’s simulation of the diurnal variation of T2m in the urban core was more accurate than its simulation of the surrounding areas, particularly at noon compared to early morning and late evening. The model also simulated higher temperatures in the urban core compared to the surrounding countryside. Additionally, the spatial patterns of the simulated and observed T2m values were compared, and the scatter plots of the simulated and observed T2m values are shown in Figure 8. There was a clear correlation between the simulated and observed T2m spatial distributions on a daily basis, and the simulated correlation coefficient was higher when there was more site data available.
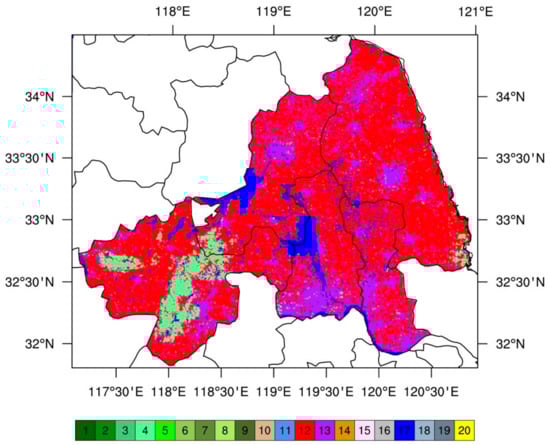
Figure 6.
Land classification map based on LCZ in layer 3 simulation grid.
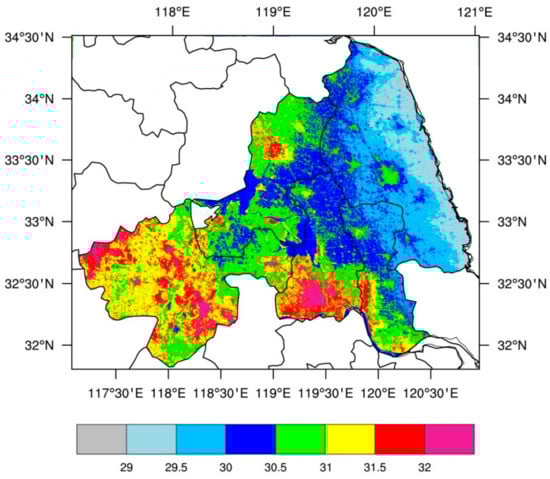
Figure 7.
A 2m average air temperature of WRF model in simulated days.

Figure 8.
Observation and simulation scatter plot of air temperature at 2 m height.
Table 4.
Observation and simulation of mean temperature at 2 m height in the innermost layer.
Each LCZ (open mid-rise, open low-rise, compact low-rise) has a unique microclimate with different urban coverage, including vegetation, buildings, and impervious surfaces. The UCI intensity calculation results based on observed and simulated values are presented in Figure 9 and Figure 10, respectively. The model simulation results show a high level of agreement with the observed temperature. The WRF/UCM model demonstrates good performance in simulating the cooling island effect in blue–green spaces during the day, with the maximum UCI intensity occurring at around 07:00 h. The fluctuation of Hongze Lake, Gaoyou Lake, and the northern lake swings in Yangzhou City may be some of the important factors influencing the diurnal variation of UCI intensity. Based on the WRF/UCM model estimates, the cooling effects of lakes and rivers can impact the UCI intensity along the coast. The vertically distributed lakes and rivers in the city have a significant cooling effect on the surrounding air temperature, with the largest cooling occurring during the daytime, ranging from 1.01 to 2.15 °C. However, this cooling effect is not observed beyond 400 m from the river and can be ignored beyond this range. Additionally, the urban form also has a significant impact on the cooling island effect, and the selection of the urban-rural integration point can affect the result of the cooling island effect’s intensity.
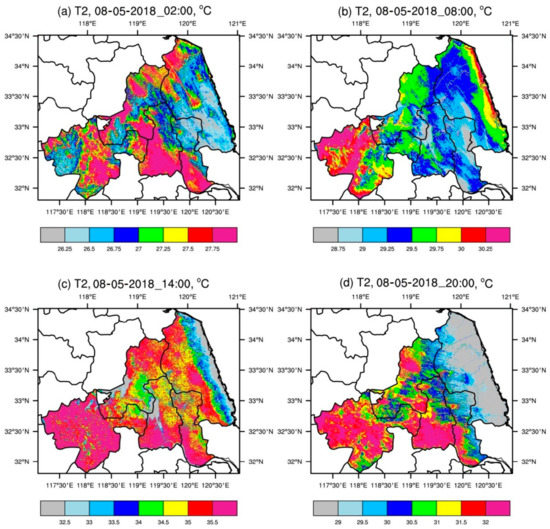
Figure 9.
Daily variation of air temperature at 2 m in WRF model on simulated day.
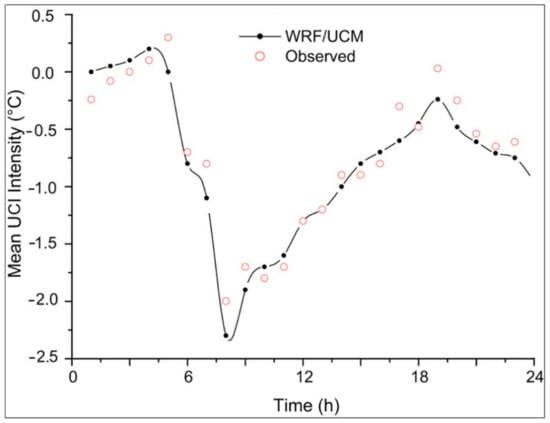
Figure 10.
Daily variation of mean intensity of urban cooling island.
4.2. ENVI-Met Model Evaluation and Validation
The baseline model’s horizontal boundary conditions and the attributes of the urban surface have an impact on the ENVI-met modelling process [48]. For this simulation, all the data such as climate, soil conditions, trees and shrubs, and infrastructure, etc., are derived from the inner part of the UHI area (which consists mainly of open mid-rise, open low-rise, and compact low-rise buildings), and have a negligible effect on the lateral boundary conditions. To facilitate comparison, this paper uses temperature and humidity data from 5 to 6 August 2018. The ENVI-met simulation results show good agreement with the measured Ta and relative humidity, with high coefficients of determination, i.e., 0.86 for air temperature and 0.69 for humidity (as shown in Figure 11). However, in the evening (17:00~19:00 h), the maximum value is underestimated by about 2.75 °C, and the relative humidity is overestimated by about 15~20% of the actual measured value at 20:00 h. These differences may be due to the larger time step (25 min) for updating the sun azimuth position and the atmospheric radiation flux. Overall, the simulation results of this model are credible.
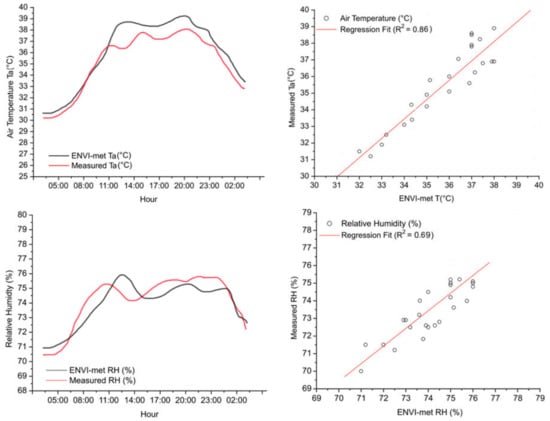
Figure 11.
Comparison of model results with weather station data.
4.3. Base Model
Open mid-rise and compact low-rise areas have a smaller sky view factor (SVF) due to their higher building density and deeper urban canopy in tightly populated residential areas. On the other hand, the open low-rise area has the largest SVF due to its lower building density and shallower urban canopy. In the green space model, adding 5% to 20% vegetation has a different impact on the SVF value in different building environments. For instance, the SVF value in the open low-rise area is lower due to the influence of vegetation factors. The median SVF was more directly affected in the open low-rise area (0.21), followed by compact low-rise (0.12) and open mid-rise (0.09). This difference is mainly due to the narrower street width of dense low-rise buildings and the greater influence of vegetation. In the model simulation, owing to the high SVF level and concentrated sunlight radiation influence, Figure 12 shows a strong correlation between SVF and Ta (R2 = 0.71) at 14:00 noon, while at midnight (02:00 h), the relationship between SVF and Ta was even higher (R² = 0.80). This indicates that the open urban building environment receives more solar energy in the daytime. Therefore, applying the urban green land cover and shading impacts through the green space model can significantly decrease solar radiation and ultimately lead to the cooling of the daily-scale environment. In contrast, the urban thermal variability (high SVF) in the open low-rise environment is lower than that in green areas and shady environments (low SVF).

Figure 12.
Linear fitting relationship between sky view factor and air temperature.
4.4. Simulation Analysis of Cooling Island Effect in Urban Green Space
As shown in Figure 13 and Figure 14, increasing vegetation coverage by 5% to 20% in the green space model resulted in a certain degree of temperature reduction during the simulation period. At 14:00 h and 02:00 h, the temperature reductions were approximately 0.59 °C and 0.61 °C for open mid-rise, 0.51 °C and 0.53 °C for open low-rise, and 0.54 °C and 0.51 °C for compact low-rise. The addition of greenery to urban environments can ultimately improve human thermal comfort, and the most significant temperature reductions were observed in compact low-rise and open mid-rise environments, mainly due to changes in SVF values resulting from the addition of greenery to the roadside in the open low-rise area. According to the temperature distribution at a height of 1.5 m in the green space model, the cooling effect of vegetation on the surrounding environment is significantly enhanced with increasing height. This is because the effect of green space on the surrounding air temperature is mainly achieved through the exchange of air in both the green space and nearby airflow, and the wind speed is greater the further away from the ground it is. The low-temperature area at a height of 1.5 m is mainly located in the distribution area of the green space, due to the low wind speed near the surface, and the cooling effect of the green space on adjacent areas is mainly achieved through its own shade. The wind speed is the main factor affecting this exchange, and the low-temperature area is also mainly distributed in the downwind direction of the green space.

Figure 13.
A 1.5 m surface temperature map of each mode at noon in summer (14:00 h).
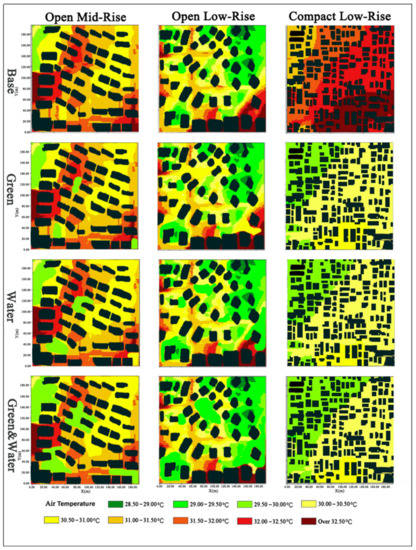
Figure 14.
A 1.5 m surface temperature map of each mode at noon in summer (02:00 h).
4.5. Simulation Analysis of Cooling Island Effect in Urban Water
Figure 13 and Figure 14 demonstrate that in the water model, increasing the water coverage by about 5~15% results in a decrease in temperature for all building types at both 14:00 h and 00:02 h, with the largest reduction observed in open mid-rise buildings (about 0.70 °C and 0.71 °C). The cooling effect of water is more significant in low-rise buildings (open low-rise and compact low-rise), with temperature decreases of about 0.61 °C, 0.63 °C, 0.63 °C, and 0.60 °C, respectively. All models with water bodies show different degrees of cooling island effects compared to the base model. Mitigation strategies that reduce heat capture are more effective in reducing ambient temperatures, particularly in open mid-rise buildings with lower SVF and higher density building units that capture more heat. Since building materials retain heat, the temperatures of buildings remain high even at night when heat begins to dissipate. Based on the simulation results of 1.5 m temperature fields in the water model, it can be seen that water has a strong mitigation effect on low-altitude temperatures, and the cooling difference between different water bodies is small. Transpiration is the primary factor affecting the cooling of water, and the closer the water is to the water surface, the more pronounced the transpiration effect, and the stronger the mitigation effect on the surrounding temperature. In summary, the cooling effect of water on the surrounding environment is superior to that of green space, and both have a noticeable cooling effect. Therefore, combining water and green space in landscape design can enhance their ability to alleviate the heat island effect of the surrounding environment horizontally and vertically.
4.6. Analysis of Cooling Island Effect of Urban Blue–Green Spatial Coupling Model
The Rayman model was used to calculate the pavement PET on 5 August 2018 for each model, taking into account factors such as Ta, humidity levels, wind velocity, and airflow (Figure 15). In the blue–green spatially coupled model, which combined the water and green space models, lower PETs were observed compared to the base model. The most significant decrease in PET was observed in the open mid-rise area, with a reduction of 2.65–3.26 °C during the period from 11:00 to 13:00 h, and an average decrease of 1.25 °C throughout the day. Additionally, in the compact low-rise area, PET decreased by 2.65–2.88 °C from 12:00 to 14:00 h, and an average decrease of 1.87 °C was observed throughout the day.
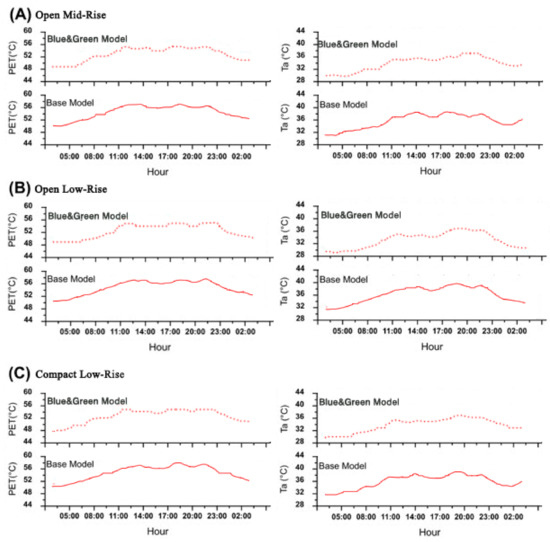
Figure 15.
Variations of Ta and PET in each model.
In the open low-rise area, PET decreased by 2.64 to 3.15 °C from 12:00 to 14:00, and the average PET decreased by 1.38 °C throughout the day. Across the three urban environments, the highest abnormal value of Ta is around 1.08 °C, and the abnormal value of PET can be as high as 21.45 °C. Therefore, urban thermal inhomogeneity has a significant influence on urban thermal comfort. Based on the analysis, the proportion of urban blue–green space area is significantly higher than that of the other two models (water model and green space model) in terms of alleviating UHI.
The Ta in open mid-rise is higher compared to compact low-rise and open low-rise. During summer, the urban thermal environment is controlled by tree shading and canopies. In the green space model, the Ta value is higher than the base model because of the lower surface albedo of the soil surface compared to concrete. Figure 16 shows that the blue–green space coupling model can reduce Ta by 0.91 °C during summer. Compared to compact low-rise and open low-rise, the coupling method in open mid-rise has the best effect on mitigating UHI, and the impact of blue–green space is more significant in urban core areas with high built environment density.

Figure 16.
Cooling situation of each model at (14:00 h) and (02:00 h).
5. Discussion
5.1. Advantages of Meso-Micro Scale Coupled Models in Urban Thermal Environments
The lack of in situ meteorological data can be an obstacle to modeling urban mitigation strategies for extreme temperatures. To address this issue, the paper explores a method to generate ENVI-met model input using the WRF pattern. The WRF/UCM model is used to evaluate the multiple climatic variable mechanisms in the flux of heat, dynamism, and moisture substance in the constructed urban environment. The model offers enhanced boundary conditions for horizontal synoptic weather prediction and enables the recreation of the building design of an urban area with standardized urban framework. The simulations employing dynamical downscaling using WRF/UCM explore the different climatic effects of the blue–green space environment within the setting of the UCI over through the ESLZ. The findings reveal that the WRF/UCM is very capable of simulating UCI effects, and the kind and distribution of thermal diversity of UHI are directly connected to the effects of urbanization and LUCC shifts. The outcomes demonstrated that the WRF/UCM is very capable of simulating UCI effects, as evidenced by the consistency among the predicted and actual statistics for T2m. The findings also demonstrate that rapid urbanization has significantly altered the UCI effect throughout the ESLZ zone, and UCI intensity is far more difficult and complicated in urban cores than that in rural surroundings on a diurnal timescale. Biodiversity loss and the transformation of arable land to built-up areas are the main causes of these rising temperatures, which may enhance sensible thermal performance and diminish latent temperature distribution in recently constructed urban areas in the ESLZ. In addition, the mesoscale model could be modified for accurate weather boundary circumstance data, and the WRF model can couple single-layer UCM, providing an opportunity for UCI effect simulation considering the simple geometric shape of buildings.
The simulation results of WRF/UCM indicate that despite the complex and nonlinear characteristics of the numerical model, there is a rigorous linear relationship between the warming rate and land-use change. The combined effects of urbanization and anthropogenic heat release cause temperature changes at the city scale due to condensed urban structures and corresponding power usage. The fragmentation of the urban cooling zone in the ESLZ is closely related to the blue–green spatial pattern. There is an inherent relationship between the temperature distribution caused by rapid urbanization and the characteristics of urban surfaces that alter the urban thermodynamic equilibrium state. One obvious change is the heat flux density around dense urban building areas in the ESLZ. The simulated diurnal latent heat flux drops throughout the day and climbs at night, mainly due to the conversion of blue–green space into urban construction land, which increases the proportion of urban construction land. The results of the study indicate that changes in land use, particularly the conversion of blue and green spaces to urban construction land, have significant impacts on the urban canopy heat island (UCHI) effect. This is due to a reduction in surface evapotranspiration and increased thermal inertia, resulting in a faster surface heating flow. The UCHI effect is most intense during midday due to the thermal characteristics of the urban landscape, but at night, there is no direct solar heating, leading to a decrease in local-scale turbulence and the formation of an inversion layer above the ESLZ. This causes the heat flux from the ground to accumulate until daybreak, leading to an increase in sensible heat flux and a decrease in latent heat flux during the daytime. These findings are consistent with previous studies [36].
Recommendations for mitigating UHI often involve retrofits and adjustments at the scale of urban infrastructure. For example, adding substantial urban forests, large areas of cooling substances, or rooftop gardens throughout the city can help. Computer simulation is an advantageous tool because it can quickly predict large-scale changes in real urban morphology [49,50,51,52]. Research on large-scale deployment of thermal mitigation strategies is of great significance for exploring urban thermal environments. However, the influence range of the cooling island effect in blue–green space varies depending on the analysis environment. Therefore, it is necessary to repeat the same assessments in several geographical environments. The study found that the highest cooling effect can only be obtained in areas with higher sky view factors and those closer to main streets [53]. In high-rise areas, cool roofs are generally ineffective in controlling radiant street temperature [11,54,55]. Growing more greenery is another widely considered and simulated thermal mitigation strategy. Green roofs can reduce T2m intensity during the daytime by between 0.3 °C and 0.7 °C, although the size of the structure affects its performance [56]. The thermal mitigation efficiency of street trees is more significant when the percentage of canopy cover expands from 10% to 55%. The reduction efficiency can be between 0.5 °C and 1.8 °C [51,53]. However, in certain circumstances, such as when wind strength decreases and humidity levels increase, the benefits of plants in reducing urban heat may be offset by the human perception of heat [57,58].
The dynamic diurnal variation of thermal mitigation strategies is the most commonly used simulation. According to the study done in [59], the cooling peak of cool substances/cooling materials occurs between noon and evening, which is when solar and radiation temperatures are at their highest. In contrast, the cooling peak of green roofs occurs after the evening. Sailor [60] attributed this to the positive relationship between the evapotranspiration rate and Ta, which typically reaches its climax within a couple minutes of cooling. Green spaces can provide the same cooling peaks as cooling substances, according to research studies [53,56]. Our findings support the hypothesis made by Erell et al. [61] that shading, which occurs when solar radiation strikes the tree canopy, is the primary cause of tree cooling. When comparing simulation outcomes, the deployment rate of the treatment hypothesis under study is a crucial factor to take into account. In reality, different geographic environments have different levels of viability for large-scale UHI mitigation approaches. For example, Rosenzweig et al. (2006) calculated that 64% of the surface area of New York City meets the requirement for increased albedo and showed that Ta can be reduced by 0.94 °C through cold materials. With the improvement of computer performance, the accuracy of simulation has also improved accordingly. At present, within a 50 km × 50 km range, there is a certain gap between the mesoscale atmospheric model used in the horizontal study areas and the micro-scale atmospheric model in the service areas of 1 km × 1 km and smaller. One advantage of microscale models is their high spatial resolution, which requires less parameterization of static inputs, including structures, terrain, and flora, and may be described more clearly [62].
Currently, medium and micro-scale simulation technology is being applied to the ecological planning analysis of blue–green space, which represents relatively advanced research. However, further exploration is required to improve the accuracy of simulation calculation, particularly in the areas of model parameter setting, grid division, and mathematical calculation model. Future studies should consider anthropogenic heat release, transport-related heat fluxes, and parameters of heterogeneity between buildings. The ENVI-met model is limited in its ability to describe the walls and ceilings of urban buildings within the research region, as internal building heat, absorption coefficient, and reflectance ratios are unpredictable and heterogeneous. Additionally, block-scale surface heat islands (1.5 m height) and regional-scale canopy heat islands (2 m height) have not been thoroughly analyzed, and further comparative analysis at different scales is needed.
5.2. The Influence of Blue–Green Spatial Layout Pattern on Microclimate
Field observation and numerical simulation methods are more suitable for small-scale residential research. The cooling effect of blue–green space revealed by ENVI-met in this paper is also consistent with many previous studies [55,63,64]. This paper establishes several statistical connections between urban form, reflectivity, and urban size and shape using SVF. The urban canopy has a significant impact on solar radiation, which can limit direct sunlight radiation under excessive light latitude. As a result, an unfavorable thermal environment exists in the urban canopy with high SVF in open constructed areas compared to shaded low SVF areas. Dense green space or water can produce a cooling island effect during the day (12:00~14:00 h). In addition, heating can be released at night from densely populated building environments that collect solar energy throughout the day. Furthermore, roadside plantations with attached water bodies can reduce thermal impacts from the built environment of the neighborhood.
In general, increasing vegetation coverage by 5–20% or adding more water by 5–15% can reduce the daily-scale Ta by up to 0.71 °C. In middle- and high-rise building environments, temperatures can be controlled by planting more vegetation or adding water bodies. It is highly recommended to increase and maintain roadside greenery and attach grass plantations to water bodies, as they can effectively reduce ambient temperatures and building energy consumption. Vegetation planted along both sides of the road and the open space around buildings, which is attached to water, can help to reduce the influence of direct solar radiation during the daytime. Considering the density of central buildings in the ESLZ, the effect of the blue–green space coupling model in open low-rise building surroundings is better compared to that in compact low-rise and open middle-rise areas. The blue–green space coupling model can be used to mitigate the UHI phenomenon in both old and new development areas. Combining blue–green space can reduce PET because direct sunlight can be limited, resulting in a significant impact on the heat comfort of the city.
With the continuous improvement of data accuracy and the advent of the era of big data, the investigation into the cooling island effect of urban blue–green spaces can continue to deepen in many aspects. For instance, high-resolution images can be utilized to investigate the impact of different plant species on the cooling island effect of urban blue–green spaces. In addition, multi-source big data can be integrated, incorporating high temporal and spatial resolution ground monitoring meteorological data, as well as high spatial resolution urban 3D morphological data, into a data management platform. This comprehensive approach provides accurate and dynamic information support for the development of urban blue–green space planning. While investigating the form and layout of urban blue–green spaces is important, the complexity and relevance of the geographic system necessitates a deeper exploration of the influence of relevant factors, such as urban wind direction and speed, and their incorporation into the design scheme of urban blue–green spaces. This will improve the research system of the cooling island effect.
6. Conclusions
In this paper, the WUDAPT 0-level method is used to obtain the LCZ distribution data of the ESLZ, which is then incorporated into the WRF/UCM model using the dynamic downscaling method to simulate the UHI effect. The resulting data from the WRF-UCM model are then used as input data for the ENVI-met model to evaluate the effects of green space, water, and coupled blue–green space models on the thermal environment’s heterogeneity in diverse architectural settings (open mid-rise, open low-rise, and compact low-rise) in the ESLZ.
At the mesoscale, the consistency between T2m simulation data and observation data indicates that WRF/UCM has a strong ability to simulate the UCI effect. UCI intensity in urban core areas is more complex than that in edge area, the UCI effect covers a broad spatial dimension for T2m and the heating rate of the nearby urban canopy. The morphology and nature of urban surfaces are the main driving forces leading to the weakening of the UCI effect. The earth’s surface thermal budget reflects the intensity of LUCC transformation, specifically the increase in thermal inertia and decline in the dehumidification cooling effect caused by land surfaces to urban structures in blue–green space. LUCC transitions play an important role in the behavior of UCI diurnal variability and microclimate effects. WRF/UCM has a better simulation effect on the cooling island effect of blue–green space during the day, and the maximum UCI intensity is around 07:00 h. Hongze Lake, Gaoyou Lake, and the lake swings in the northern part of Yangzhou City may be some of the important factors affecting the diurnal intensity variation of UCI. The estimated results from the WRF/UCM model suggest that the urban cooling island effect intensity along the river is affected by lakes and rivers. The longitudinally distributed lakes and rivers in the city exert a significant cooling effect on the greater surrounding air temperature, and the cooling range is the largest during the day, ranging from 1.01 to 2.15 °C.
At the microscale, by contrasting the urban landscape’s connection with SVF, the impact of different mitigation strategies on the microclimate of typical summer day blocks was simulated. By using the green space model, the water model, and the coupled blue–green space model, it was observed that the cooling effect of water on the surrounding environment is stronger than that of green space, and both have significant cooling effects. The combination of water and green space can enhance their ability to mitigate the heat island effect of the surrounding environment both horizontally and vertically. The blue–green coupling model produced a lower PET compared to the basic model by mixing the water and green space models, with the open mid-rise implementation showing the maximum reduction in PET.
The meso-micro scale model coupling analysis method can be quickly and efficiently applied to the study of the cooling island effect of regional and urban blue–green spaces, as well as to simulate the impact of different forms of blue–green spaces on the thermal environment of central urban areas. Through the layered coupling of mesoscale numerical models and microscale models, refined simulations at different scales can be achieved.
Author Contributions
Conceptualization, F.Q. and Z.P.; methodology, Z.X.; software, L.W., Y.P. and Z.X; validation, Z.P. and Q.L.; formal analysis, Z.P. and N.D.; investigation, F.Q. and Z.X; resources, F.Q.; data curation, L.W. and Z.P.; writing—original draft preparation, Z.P.; writing—review and editing, F.Q. and Z.X. All authors have read and agreed to the published version of the manuscript.
Funding
The research work was financially supported by the National Science and Technology Infrastructure of China (No. 2005DKA32300), the Major Projects of the Ministry of Education (No. 16JJD770019), the Data Sharing Infrastructure of Earth System Science Data Centre of the Lower Yellow River Region (http://henu.geodata.cn, accessed on 20 May 2018), and the Geospatial Data Cloud site, the attribution Climatic Research Unit, University of East Anglia, Computer Network Information Center, Chinese Academy of Sciences (http://www.gscloud.cn, accessed on 20 May 2019).
Data Availability Statement
The data and codes that support the findings of this study are available on request from the corresponding author.
Conflicts of Interest
The authors declare no conflict of interest.
References
- Stott, P.A.; Stone, D.A.; Allen, M.R. Human contribution to the European heatwave of 2003. Nature 2004, 432, 610–614. [Google Scholar] [CrossRef] [PubMed]
- Holt, A.R.; Mears, M.; Maltby, L.; Warren, P. Understanding spatial patterns in the production of multiple urban ecosystem services. Ecosyst. Serv. 2015, 16, 33–46. [Google Scholar] [CrossRef]
- Jandaghian, Z.; Akbari, H. The Effect of Increasing Surface Albedo on Urban Climate and Air Quality: A Detailed Study for Sacramento, Houston, and Chicago. Climate 2018, 6, 19. [Google Scholar] [CrossRef]
- Watts, N.; Amann, M.; Arnell, N.; Ayeb-Karlsson, S.; Beagley, J.; Belesova, K.; Boykoff, M.; Byass, P.; Cai, W.; Campbell-Lendrum, D.; et al. The 2020 report of the Lancet Countdown on health and climate change: Responding to converging crises. Lancet 2021, 397, 129–170. [Google Scholar] [CrossRef]
- Schinas, O.; Ross, H.H.; Rossol, T.D. Financing green ships through export credit schemes Transp. Res. Part D Transp. Environ. 2018, 65, 300–311. [Google Scholar] [CrossRef]
- Manoli, G.; Fatichi, S.; Schläpfer, M.; Yu, K.; Crowther, T.W.; Meili, N.; Burlando, P.; Katul, G.G.; Bou-Zeid, E. Magnitude of urban heat islands largely explained by climate and population. Nature 2019, 573, 55–62. [Google Scholar] [CrossRef]
- Cai, W.; Zhang, C.; Suen, H.P.; Ai, S.; Bai, Y.; Bao, J.; Chen, B.; Cheng, L.; Cui, X.; Dai, H.; et al. The 2020 China report of the Lancet Countdown on health and climate change. Lancet Public Health 2020, 6, e64–e81. [Google Scholar] [CrossRef]
- Martins, T.A.; Adolphe, L.; Bonhomme, M.; Bonneaud, F.; Faraut, S.; Ginestet, S.; Michel, C.; Guyard, W. Impact of Urban Cool Island measures on outdoor climate and pedestrian comfort: Simulations for a new district of Toulouse, France. Sustain. Cities Soc. 2016, 26, 9–26. [Google Scholar] [CrossRef]
- Yu, Z.W.; Guo, Q.H.; Sun, R.H. Impact of urban cooling effect based on landscape scale: A review. Chin. J. Appl. Ecol. 2015, 26, 636–642. [Google Scholar]
- Park, M.; Hagishima, A.; Tanimoto, J.; Narita, K.-I. Effect of urban vegetation on outdoor thermal environment: Field measurement at a scale model site. Build. Environ. 2012, 56, 38–46. [Google Scholar] [CrossRef]
- Santamouris, M.; Ban-Weiss, G.; Osmond, P.; Paolini, R.; Synnefa, A.; Cartalis, C.; Muscio, A.; Zinzi, M.; Morakinyo, T.E.; Ng, E.; et al. Progress in Urban Greenery Mitigation Science—Assesment Methodologies Advanced Technologies and Impact on Cities. J. Civ. Eng. Manag. 2018, 24, 638–671. [Google Scholar] [CrossRef]
- Yu, Z.; Yao, Y.; Yang, G.; Wang, X.; Vejre, H. Strong contribution of rapid urbanization and urban agglomeration development to regional thermal environment dynamics and evolution. For. Ecol. Manag. 2019, 446, 214–225. [Google Scholar] [CrossRef]
- Zhang, W.; Wang, W.; Hou, G.; Gong, C.; Jiang, M.; Lyu, X. Cooling effects of different wetlands in semi-arid rural region of northeast China. Theor. Appl. Climatol. 2020, 141, 31–41. [Google Scholar]
- Gunawardena, K.; Wells, M.; Kershaw, T. Utilizing green and blue-space to mitigate urban heat island intensity. Sci. Total Environ. 2017, 584, 1040–1055. [Google Scholar] [CrossRef]
- Peng, J.; Xie, P.; Liu, Y.; Ma, J. Urban thermal environment dynamics and associated landscape pattern factors: A case study in the Beijing metropolitan region. Remote Sens. Environ. 2016, 173, 145–155. [Google Scholar] [CrossRef]
- Carvalho, D.; Martins, H.; Marta-Almeida, M.; Rocha, A.; Borrego, C. Urban resilience to future urban heat waves under a climate change scenario: A case study for Porto urban area (Portugal). Urban Clim. 2017, 19, 1–27. [Google Scholar] [CrossRef]
- Zupancic, T.; Westmacott, C.; Bulthuis, M. The Impact of Green Space on Heat and Air Pollution in Urban Communities: A Meta-Narrative Systematic Review; David Suzuki Foundation Vancouver: Vancouver, BC, Canada, 2015. [Google Scholar]
- Shih, W. Greenspace patterns and the mitigation of land surface temperature in Taipei metropolis. Habitat Int. 2017, 60, 69–80. [Google Scholar] [CrossRef]
- Zhou, W.; Wang, J.; Cadenasso, M.L. Effects of the spatial configuration of trees on urban heat mitigation: A comparative study. Remote Sens. Environ. 2017, 195, 1–12. [Google Scholar] [CrossRef]
- Estoque, R.C.; Murayama, Y.; Myint, S.W. Effects of landscape composition and pattern on land surface temperature: An urban heat island study in the megacities of Southeast Asia. Sci. Total Environ. 2017, 577, 349–359. [Google Scholar] [CrossRef]
- Fan, H.; Yu, Z.; Yang, G.; Liu, T.Y.; Hung, C.H.; Vejre, H. How to cool hot-humid (Asian) cities with urban trees? An optimal landscape size perspective. Agric. For. Meteorol. 2018, 265, 338–348. [Google Scholar] [CrossRef]
- Ren, Y.; Deng, L.-Y.; Zuo, S.-D.; Song, X.-D.; Liao, Y.-L.; Xu, C.-D.; Chen, Q.; Hua, L.-Z.; Li, Z.-W. Quantifying the influences of various ecological factors on land surface temperature of urban forests. Environ. Pollut. 2016, 216, 519–529. [Google Scholar] [CrossRef] [PubMed]
- Yu, Z.; Guo, X.; Jørgensen, G.; Vejre, H. How can urban green spaces be planned for climate adaptation in subtropical cities? Ecol. Indic. 2017, 82, 152–162. [Google Scholar] [CrossRef]
- Santamouris, M. Cooling the cities—A review of reflective and green roof mitigation technologies to fight heat island and improve comfort in urban environments. Sol. Energy 2012, 103, 682–703. [Google Scholar] [CrossRef]
- Zhou, X.L.; Wang, Y.C. Spatial-temporal dynamics of urban green space in response to rapid urbanization and greening policies. Landsc. Urban Plan. 2011, 100, 268–277. [Google Scholar] [CrossRef]
- Zhou, Y.; Shi, T.; Hu, Y.; Gao, C.; Liu, M.; Fu, S.; Wang, S. Urban green space planning based on computational fluid dynamics model and landscape ecology principle: A case study of Liaoyang City, Northeast China. Chin. Geogr. Sci. 2011, 21, 465–475. [Google Scholar] [CrossRef]
- Papangelis, G.; Tombrou, M.; Dandou, A.; Kontos, T. An urban “green planning” approach utilizing the Weather Research and Forecasting (WRF) modeling system: Acase study of Athens, Greece. Landsc. Urban Plan. 2012, 105, 174–183. [Google Scholar] [CrossRef]
- Kubota, T.; Lee, H.S.; Trihamdani, A.R.; Phuong, T.T.T.; Tanaka, T.; Matsuo, K. Impacts of land use changes from the Hanoi Master Plan 2030 on urban heat islands: Part 1. Cooling effects of proposed green strategies. Sustain. Cities Soc. 2017, 32, 295–317. [Google Scholar] [CrossRef]
- Zölch, T.; Maderspacher, J.; Wamsler, C.; Pauleit, S. Using green infrastructure for urban climate-proofing: An evaluation of heat mitigation measures at the micro-scale. Urban For. Urban Green. 2016, 20, 305–316. [Google Scholar] [CrossRef]
- Manob, D.; Arijit, D.; Sahil, M. Quantifying the cooling effect of urban green space: A case from urban parks in a tropical mega metropolitan area (India). Sustain. Cities Soc. 2022, 87, 104062. [Google Scholar]
- Yu, Z.; Yang, G.; Zuo, S.; Jørgensen, G.; Koga, M.; Vejre, H. Critical review on the cooling effect of urban blue-green space: A threshold-size perspective. Urban For. Urban Green. 2020, 49, 126630. [Google Scholar] [CrossRef]
- Lin, B.S.; Lin, C.T. Preliminary study of the influence of the spatial arrangement of urban parks on local temperature reduction. Urban For. Urban Green. 2016, 20, 348–357. [Google Scholar] [CrossRef]
- Du, H.; Cai, Y.; Zhou, F.; Jiang, H.; Jiang, W.; Xu, Y. Urban blue-green space planning based on thermal environment simulation: A case study of Shanghai, China. Ecol. Indic. 2019, 106, 105501. [Google Scholar] [CrossRef]
- McRae, I.; Freedman, F.; Rivera, A.; Li, X.; Dou, J.; Cruz, I.; Ren, C.; Dronova, I.; Fraker, H.; Bornstein, R. Integration of the WUDAPT, WRF, and ENVI-met models to simulate extreme daytime temperature mitigation strategies in San Jose, California. Build. Environ. 2020, 184, 107180. [Google Scholar] [CrossRef]
- Umberto, B.; Zahra, J.; Jonathan, G. Effects of greenery enhancements for the resilience to heat waves: A comparison of analysis performed through mesoscale (WRF) and microscale (Envi-met) modeling. Sci. Total Environ. 2020, 747, 141300. [Google Scholar]
- Khan, A.; Chatterjee, S.; Weng, Y. Urban Heat Island Modeling for Tropical Climates; Elsevier: Amsterdam, The Netherlands, 2020. [Google Scholar]
- Stewart, I.D.; Oke, T.R. Local climate zones for urban temperature studies. Bull. Am. Meteorol. Soc. 2012, 93, 1879–1900. [Google Scholar] [CrossRef]
- Lin, Z.; Xu, H. A Study of Urban Heat Island Intensity Based on “Local Climate Zones”. J. Geo-Inf. Sci. 2017, 19, 713–722. [Google Scholar]
- Bechtel, B.; Alexander, P.J.; Böhner, J.; Ching, J.; Conrad, O.; Feddema, J.; Mills, G.; See, L.; Stewart, I. Mapping local climate zones for a worldwide database of form and function of cities. ISPRS Int. J. Geo-Inf. 2015, 4, 99–219. [Google Scholar] [CrossRef]
- Bechtel, B.; Alexander, P.J.; Beck, C.; Böhner, J.; Brousse, O.; Ching, J.; Demuzere, M.; Fonte, C.; Gál, T.; Hidalgo, J.; et al. Generating WUDAPT Level 0 data—Current status of production and evaluation. Urban Clim. 2019, 27, 24–45. [Google Scholar] [CrossRef]
- Kusaka, H.; Kimura, F. Thermal effects of urban canyon structure on the nocturnal heat is- land: Numerical experiment using a mesoscale model coupled with an urban canopy model. J. Appl. Meteorol. 2004, 43, 1899–1910. [Google Scholar] [CrossRef]
- Kusaka, H.; Kimura, F. Coupling a single-layer urban canopy model with a simple atmo-spheric model: Impact on urban heat island simulation for an idealized case. J. Meteorol. Soc. Jpn. Ser. II 2004, 82, 67–80. [Google Scholar] [CrossRef]
- Wang, J.; Yan, Z.; Quan, X.-W.; Feng, J. Urban warming in the 2013 summer heat wave in eastern China. Clim. Dyn. 2016, 48, 3015–3033. [Google Scholar] [CrossRef]
- Stewart, I.D.; Oke, T.R.; Krayenhoff, E.S. Evaluation of the “local climate zone” scheme using temperature observations and model simulations. Int. J. Climatol. 2014, 34, 1062–1080. [Google Scholar] [CrossRef]
- O’Malley, C.; Piroozfar, P.; Farr, E.R.P.; Pomponi, F. Urban Heat Island (UHI) mitigating strategies: A case-based comparative analysis. Sustain. Cities Soc. 2015, 19, 222–235. [Google Scholar] [CrossRef]
- Perini, K.; Magliocco, A. Effects of vegetation, urban density, building height, and atmospheric conditions on local temperatures and thermal comfort. Urban For. Urban Green. 2014, 13, 495–506. [Google Scholar] [CrossRef]
- Ozkeresteci, I.; Crewe, K.; Brazel, A.J.; Bruse, M. Use and evaluation of the ENVI-met model for environmental design and planning: An Experiment on Linear Parks. In Proceedings of the 21st International Cartographic Conference (ICC), Durban, South Africa, 10–16 August 2003. [Google Scholar]
- Paas, B.; Schneider, C. A comparison of model performance between ENVI-met and Austal2000 for particulate matter. Atmos. Environ. 2016, 145, 392–404. [Google Scholar] [CrossRef]
- Li, H.; Zhou, Y.; Wang, X.; Zhou, X.; Zhang, H.; Sodoudi, S. Quantifying urban heat island intensity and its physical mechanism using WRF/UCM. Sci. Total. Environ. 2018, 650, 3110–3119. [Google Scholar] [CrossRef]
- Liu, X.; Tian, G.; Feng, J.; Wang, J.; Kong, L. Assessing summertime urban warming and the cooling efficacy of adaptation strategy in the Chengdu-Chongqing metropolitan region of China. Sci. Total Environ. 2018, 610–611, 1092–1102. [Google Scholar] [CrossRef]
- Ng, E.; Chen, L.; Wang, Y.; Yuan, C. A study on the cooling effects of greening in a high-density city: An experience from Hong Kong. Build. Environ. 2012, 47, 256–271. [Google Scholar] [CrossRef]
- Peng, J.; Hu, Y.; Dong, J.; Liu, Q.; Liu, Y. Quantifying spatial morphology and connectivity of urban heat islands in a megacity: A radius approach. Sci. Total Environ. 2020, 714, 136792. [Google Scholar] [CrossRef]
- Wang, Y.; Berardi, U.; Akbari, H. Comparing the effects of urban heat island mitigation strategies for Toronto, Canada. Energy Build. 2016, 114, 2–19. [Google Scholar] [CrossRef]
- Ma, S.; Pitman, A.; Yang, J.; Carouge, C.; Evans, J.; Hart, M.; Green, D. Evaluating the Effectiveness of Mitigation Options on Heat Stress for Sydney, Australia. J. Appl. Meteorol. Clim. 2018, 57, 209–220. [Google Scholar] [CrossRef]
- Tsoka, S.; Tsikaloudaki, A.; Theodosiou, T. Analyzing the ENVI-met microclimate model’s performance and assessing cool materials and urban vegetation applications–A review. Sustain. Cities Soc. 2018, 43, 55–76. [Google Scholar] [CrossRef]
- Rosenzweig, C.; Solecki, W.; Slosberg, R. Mitigating New York City’s heat island with urban forestry, living roofs, and light surfaces. In Proceedings of the Sixth Symposium on the Urban Environment, Atlanta, GA, USA, 30 January–2 February 2006. [Google Scholar]
- Berardi, U.; Wang, Y. The Effect of a Denser City over the Urban Microclimate: The Case of Toronto. Sustainability 2016, 8, 822. [Google Scholar] [CrossRef]
- Ghaffarianhoseini, A.; Berardi, U.; Ghaffarianhoseini, A. Thermal performance characteristics of unshaded courtyards in hot and humid climates. Build. Environ. 2015, 87, 154–168. [Google Scholar] [CrossRef]
- Lai, D.; Liu, W.; Gan, T.; Liu, K.; Chen, Q. A review of mitigating strategies to improve the thermal environment and thermal comfort in urban outdoor spaces. Sci. Total. Environ. 2019, 661, 337–353. [Google Scholar] [CrossRef]
- Sailor, D.J. Simulated urban climate response to modifications in surface albedo and vegetative cover. J. Appl. Meteorol. 1994, 34, 1694–1704. [Google Scholar] [CrossRef]
- Erell, E.; Pearlmutter, D.; Williamson, T. Urban Microclimate: Designing the Spaces Between Buildings; Earthscan: New York, NY, USA, 2011. [Google Scholar]
- Simon, H.; Kropp, T.; Sohni, F.; Bruse, M. Downscaling Climate Models: Running Nested Simulations in the Microclimate Model ENVI-Met; Passive and Low Energy Architecture: Hong Kong, China, 2018. [Google Scholar]
- Skelhorn, C.; Lindley, S.; Levermore, G. The impact of vegetation types on air and surface temperatures in a temperate city: A fine scale assessment in Manchester, UK. Landsc. Urban Plan. 2014, 121, 129–140. [Google Scholar] [CrossRef]
- Taleghani, M.; Sailor, D.J.; Tenpierik, M.; Dobbelsteen, A.V.D. Thermal assessment of heat mitigation strategies: The case of Portland State University, Oregon, USA. Build. Environ. 2014, 73, 138–150. [Google Scholar] [CrossRef]
Disclaimer/Publisher’s Note: The statements, opinions and data contained in all publications are solely those of the individual author(s) and contributor(s) and not of MDPI and/or the editor(s). MDPI and/or the editor(s) disclaim responsibility for any injury to people or property resulting from any ideas, methods, instructions or products referred to in the content. |
© 2023 by the authors. Licensee MDPI, Basel, Switzerland. This article is an open access article distributed under the terms and conditions of the Creative Commons Attribution (CC BY) license (https://creativecommons.org/licenses/by/4.0/).