Abstract
As far as the knowledge of the seabed is concerned, both for safe navigation and for scientific research, 3D models, particularly digital bathymetric models (DBMs), are nowadays of fundamental importance. This work aimed to evaluate the quality of DBMs according to the interpolation methods applied to obtain grid format 3D surfaces from scattered sample points. Other complementary factors affecting DBM vertical accuracy, such as seabed morphological complexity and surveyed points sampling density, were also analyzed by using a factorial ANOVA experimental design. The experiments were performed on a multibeam dataset provided by the Italian Navy Hydrographic Institute (IIM) with an original resolution of 1 m × 1 m grid spacing, covering a surface of 0.24 km2. Six different sectors comprising different seabed morphologies were investigated. Eight sampling densities were randomly extracted from every sector, each with four repetitions. Finally, four different interpolation methods were tested, including: radial basis multiquadric function (RBMF), ordinary kriging (OK), universal kriging (UK) and Gaussian Markov random fields (GMRF). The results demonstrated that both RBMF and OK produced very accurate DBM in areas characterized by low levels of seabed ruggedness at sampling densities of only 0.0128 points/m2 (equivalent grid spacing of 8.84 m). In contrast, a higher density of 0.1024 points/m2 (3.13 m grid spacing) was required to produce accurate DBM in areas with more complex seabed topography. On the other hand, UK and GMRF were strongly influenced by morphology and sampling density, yielding higher vertical random errors and more prone to slightly overestimate seabed depths. In addition, sampling density and morphology were the factors that most influenced the vertical accuracy of the interpolated DBM. In this sense, the highly statistically significant influence of the interaction between sampling density and morphology on the vertical accuracy of the interpolated DBM confirms the need to perform a preliminary analysis of seabed morphological complexity in order to increase, if necessary, the number of surveyed points in cases of complex morphologies.
1. Introduction
Knowledge of the submerged part of the Earth has always been one of the most important aspects faced by the scientific community. Navigation, port works, and the exploration of marine resources are just some of the areas that require in-depth information []. Bathymetric surveys are carried out whenever there is a need to precisely know the morphological trend of the seabed. They are, therefore, preliminary to the realization of maritime and river works, and are indispensable for verifying the continuity of water heads and dredging volumes [,]. They also play a fundamental role in monitoring the evolution of beaches and coastlines []. Furthermore, bathymetric surveys are useful for other aims, such as geomorphological studies, habitat mapping and many more [,,].
Bathymetric surveys can be performed using different types of instrumentation. Among them, those based on the transmission of acoustic signals through the water stand out, such as single-beam sonar (SBS) [], multiple-beam sonar (MBS) [], and side-scan sonar (SSS) []. This type of instrument determines the depth by considering the time interval between the emission and the return of the sound pulse generated by the echo sounder and dividing it by two. Next, the distance from the keel to the bottom is measured by multiplying half the time taken by the impulse (exit and return) by the speed of sound in the water []. Another methodology is that based on satellite bathymetry, or by extracting the depths using multispectral images []. This approach is based on the principle that the different wavelengths of light penetrate the water at different depths to be reflected from the seabed and recorded by the satellite’s multispectral sensor. This type of remote sensing technique is now widely applied through using both medium-spatial-resolution (Landsat []) and high-spatial-resolution satellite imagery (QuickBird [] or Worldview 3 []). In these cases, the vertical accuracy achieved for depth data took values, in terms of RMSE, of 1.41 m for Landsat [], 0.518 m for the log-band ratio method and 0.35 m for the OBRA method working on QuickBird imagery [], or 3.71 m for WorldView 3 []. Furthermore, there are several studies in the literature in which electronic navigational charts (ENC) are used as a source to extract bathymetric information [].
Depth data obtained from the different technologies are used to ensure safe navigation by producing different type of maps. As data sample densities from hydrographic sensors have increased, methods of sea-floor representation have shifted from vector-based products such as selected soundings and contours, to gridded bathymetric models []. These gridded models present a height value in each node, resulting in a matrix of numbers (digital elevation model, DEM). Particularly, a 3D model of the seabed is called a digital depth model (DDM) [].
Following the set of standards for hydrographic surveys provided by the International Hydrographic Organization (IHO) [], bathymetric survey requirements can be highly variable depending on the intended use of the final product. In fact, the required bathymetric coverage, which is based on the combination of the survey pattern and the theoretical detection area of the survey instrumentation, depends on the formal classification of the survey area. For example, the so-called “Special Order Areas”, i.e., those areas where under-keel clearance is critical for safe navigation, require very demanding minimum standards in terms of feature detection (detection of cubic features > 1 m) and maximum allowable total vertical uncertainty (lower than meters where seabed depth is entered in meters). In this sense, it is useful to count on spatial methods able to convert scattered seabed depth points into a 3D grid model. This way of manipulating spatial information to extract new information is usually performed with a Geographic Information System (GIS), which allows the user to perform geoprocessing tasks such as data interpolation. In this regard, spatial interpolation is the process, method, or mathematical function used to estimate an unknown attribute value at unmeasured/unsampled points from measurements made at surrounding sites (known values of sampled points) []. Note that obtaining a full bathymetric coverage is quite expensive, so interpolation methods could be an interesting way to reduce the price (i.e., reduce sample density) in relatively smooth seabed areas while maintaining the required minimum standards.
All interpolation techniques are based on the simple concept that the closest points have more similar values [], which means that nearby points must be at similar heights, otherwise the field will be discontinuous. This is known as Tobler’s First Law of Geography [], a phenomenon usually known as spatial dependence, spatial continuity or autocorrelation [].
Interpolation methods can be classified in many ways including local/global, exact/ approximate, and deterministic/geostatistical methods.
Global interpolation methods use a single function or model to fit the entire dataset. This function is then used to estimate values at any point within the data range []. On the other hand, local interpolation methods use a different model for each point or local neighbourhood of points. These methods use the nearby data points to estimate the value of an unknown point [,].
Exact interpolation methods use the known data points to derive a surface that passes exactly through all the data points [], while approximate interpolation methods construct interpolated surfaces that approximate but do not pass through known points []. In this sense, exact interpolation methods provide the exact values of the function at the known data points. By contrast, approximate interpolation methods are only accurate to a certain extent at sample points, depending on the complexity of the formula used and the number of data points available [].
Another distinction is made between deterministic and stochastic methods. Deterministic methods do not use the statistical properties of the measured points. In this sense, they are usually applied when there is sufficient knowledge of the surface to be modeled, each predicted value being the result of a deterministic function []. On the other hand, the stochastic methods leverage the statistical properties of the measured points, incorporating the concept of randomness and uncertainty [,,,,].
Finally, deterministic interpolation methods are used to create gridded surfaces from scattered sampling points (actually measured points) based on either the degree of similarity (e.g., inverse distance weighting (IDW)) or the degree of smoothing (e.g., radial basis functions (RBF)). On the other hand, geostatistical or stochastic interpolation methods consider random functions, trying to model the spatial dependence between points and usually include prediction error or uncertainty [].
It is now known that the accuracy of the obtained DEM is affected by various factors. In fact, several studies in the literature analyze which factors may have the greatest influence on DEM accuracy. In most cases, these factors can be reduced to the following: (i) the sampling density and spatial sampling distribution; (ii) the interpolation method applied to build the grid DEM; (iii) the morphological complexity or surface variability of the work area; and (iv) the vertical and planimetric accuracy of sampled points [,,,,,,,,,].
However, and unlike the vertical precision of digital elevation models which has been extensively studied, there are few works focused on statistically analyzing which factors may have the greatest influence on the vertical accuracy of seabed depth modeled as a grid DBM.
The aim of this study was to statistically evaluate the vertical accuracy of digital bathymetric models (DBM) obtained from MBS surveys as a function of the sampling density, the interpolation method, and the morphological complexity of the surveyed seabed. The possible interactions between these three factors were also studied.
2. Materials and Methods
This section provides a description of the investigated study area and type of datasets. In addition, the experimental design devised to achieve the objectives proposed above is presented.
Before testing various interpolation methods to generate the 3D bathymetric models, the analysis of the seabed morphology was carried out. In doing so, six different sectors were chosen, trying to represent different morphologies with variable complexity (seabed variability and roughness). This was the first source of variation of our experimental design. Eight sampling densities, each one composed of four repetitions, were randomly extracted for each sector, constituting the second source of variation. Once these first two steps were accomplished, the different interpolation methods tested in this work were applied to each repetition of sampling density and morphologically differentiated seabed sector.
It should be noted that each of the repetitions of each sampling density, due to its random extraction, corresponded to a different spatial distribution of the sampled points. Figure 1 shows a flowchart containing the different methodological steps conducted in this study. These steps will be explained in detail in the following sections.
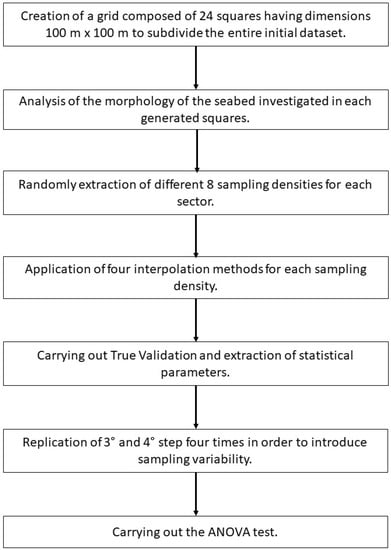
Figure 1.
Flowchart of the methodological phases carried out in this study.
2.1. Study Area and Dataset
The experiment was conducted on a dataset provided by the Istituto Idrografico della Marina Militare (IIMM) located in an area close to the coast of the island of Giglio (Italy) (Figure 2). The area extends within the following WGS84 geographic coordinates: West = 10°55′34.11″, East = 10°56′0.72″, South = 42°21′6.18″, North = 42°21′19.58″, covering a surface of 0.24 km2. Depth values in the selected area ranged between −5.45 m and −108 m, presenting a nominal vertical accuracy of approximately 1 cm.
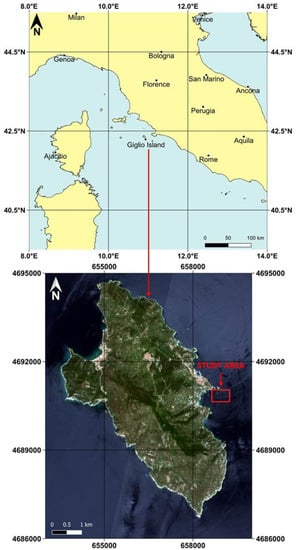
Figure 2.
The study area in equirectangular projection and WGS84 geographic coordinates (EPSG: 4326) (top). Visualization of Giglio Island (RGB composition of Sentinel-2B images) in UTM/WGS 84 plane coordinates expressed in meters (EPSG: 32632) (bottom).
In particular, the dataset consisted of 240,000 depth points obtained with a multibeam sonar during a bathymetric survey conducted in 2012. The original grid spacing of the DBM was 1 m × 1 m, which according to the International Hydrographic Organization, would correspond to a Special Order 1 area [].
This study area was chosen because it is characterized by a high level of variability of the seabed. The entire dataset was subdivided into 24 squares (100 m × 100 m) (Figure 3), each with 10,000 depth points. The decision to divide the entire dataset into 100 m × 100 m square sectors was made to ensure distinct seafloor topographies to study the effect of morphological factors on interpolation accuracy in constructing grid DBMs. In particular, of these 10,000 points per hectare, only 95% were used to extract various subsets as seeds to generate our seabed models with the different interpolation methods. The remaining 5% were set aside and used as checkpoints for subsequent validation. This means that up to 500 checkpoints were used to assess the DBM vertical accuracy of each sector, which is enough to obtain very high reliability in the estimation of systematic and random errors [].
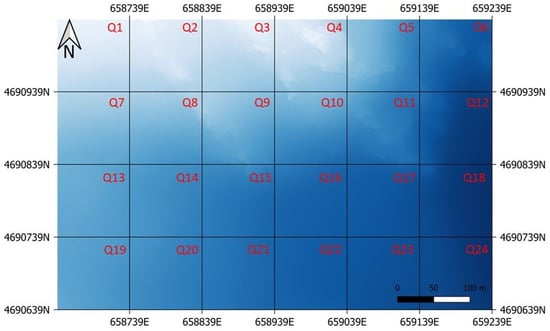
Figure 3.
Representation of the entire subset subdivision in 24 squares, or sectors, of 100 m × 100 m.
Among the 24 squares generated at the beginning, only six (Q2, Q3, Q4, Q8, Q15, Q23) were selected as representative of the different investigated seabed morphologies. These differentiated seabed morphologies were detected using the Morphological Variation Index (MVI) described in Section 2.2.
Starting from the sample of 9500 points located in each of the six selected sectors, eight sampling densities were randomly extracted, ranging from a minimum of 16 points (point density of 0.0016 points/m2, equivalent to a grid spacing of 25 m) to a maximum of 2048 points (point density of 0.2048 points/m2, grid spacing of about 2.2 m) (see Table 1). Four randomly extracted sample-point distributions (repetitions) for each sampling density were considered. In order to have a better distribution of sample points, randomly stratified sampling was applied to select the same number of points in each square of 25 m × 25 m.

Table 1.
Tested sampling densities with their corresponding equivalent grid spacing.
Figure 4 shows an example of some sampling densities extracted from the initial dataset of sector Q4 (sampling densities SD1, SD3, SD5 and SD7). They represent one of the four spatial distributions (repetitions) of points extracted for each sample density and sector. Note that the process of extracting the eight sampling densities was repeated four times by randomly varying the position of the sample points.
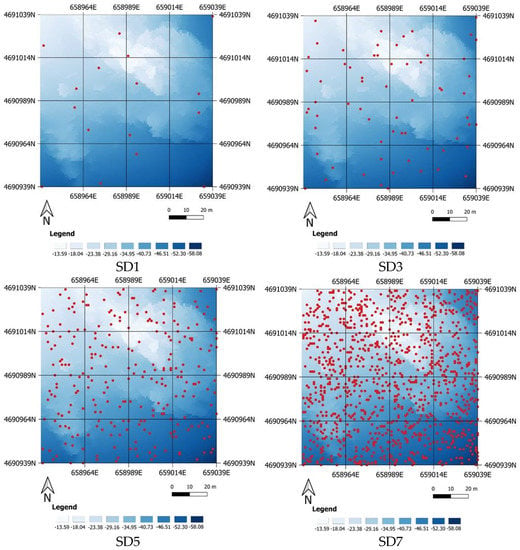
Figure 4.
Representation of four sampling densities (SD1, SD3, SD5 and SD7) extracted from the entire initial dataset for the sector Q4. It corresponds to one of the four sample point repetitions.
2.2. Seabed Morpholological Complexity
To quantitatively estimate the degree of seabed morphological complexity as a guide to select morphologically differentiated sectors in the experimental design, the MVI index introduced by Alcaras et al. [] was used. This index is given by the following equation:
where the first term, , represents the variation of the direction of the slope (ascending or descending), while the second term, , refers to slope variation. Both terms in Equation (1) were calculated along both directions (x and y/latitude and longitude). The results of this index are then multiplied by 100 in order to scale up the values obtained.
MVI was applied to the entire dataset, thus computing 24 MVI values (i.e., as many as the grid squares initially generated). Subsequently, and from analyzing the values of MVI obtained, only six sectors were extracted, showing relatively different MVI values, thus representing significantly different seabed morphological complexities (Table 2).

Table 2.
MVI values of the representative six sectors extracted potentially corresponding to different seabed morphological complexities.
As can be seen from the values shown in Table 2, the selected sectors ranged from a flat seabed (0.057) to a very rough and variable seabed (1.604). Figure 5 shows the different morphological complexities of the six sectors finally selected. In particular, it is worth noting that the MVI index proved to be a good tool to estimate the morphological complexity of the investigated seabed, since sector Q4, having the highest MVI value, was also the one with the highest morphological variability (Figure 5).
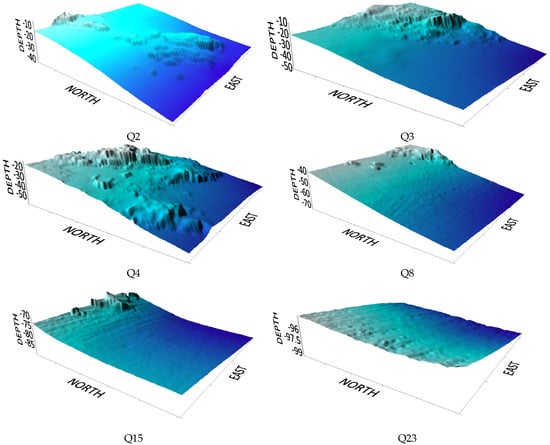
Figure 5.
3D representation of the different sectors selected to investigate the factor seabed morphological complexity.
2.3. Interpolation Methods
Spatial interpolation is defined as the procedure used to predict the value of attributes at unobserved points within a study area covered by existing observations [].
Four different interpolation methods were considered and tested in this study. Radial basis multiquadric function (RBMF), ordinary kriging (OK) and universal kriging (UK) were implemented using ArcGIS software (version 10.8), while Gaussian Markov random fields (GMRF) was implemented using a MATLAB code freely available at https://github.com/3DLAB-UAL/dem-gmrf (accessed on 12 April 2023).
As regards the ordinary and universal kriging, among the various semi-variograms available in ArcGIS, the so-called stable semi-variogram was chosen (exponential kernel function), optimizing all the fitting parameters initially set up in ArcGIS. The semi-variogram measures the degree of spatial autocorrelation used to assign weights in kriging interpolations. The experimental semi-variogram plots one-half of the square of the differences between samples versus their distance (h) from one another (semi-variance) []. The semi-variance is represented by the following expression []:
where γ(h) is the semi-variance at lag h, N(h) is the number of pairs of sample points separated by a distance h, Z(xi) is the measured value at location xi, and Z(xi + h) is the measured value at location xi + h.
It is worth noting that the semi-variogram is a measure of how well two points in a dataset are correlated as a function of their separation distance. In this way, when two points are close to each other, they tend to be more highly correlated than when they are far apart []. Therefore, the semi-variogram allows kriging to estimate the spatial correlation structure of the dataset and use this information to make predictions of values at unsampled locations [,].
2.3.1. Radial Basis Multiquadric Function
As reported in [], radial basis functions (RBF) are conceptually akin to fitting a rubber membrane through the measured sample points while minimizing the total curvature of the surface. They include different bases or kernels that significantly affect how the rubber membrane will conform to the sample points. A radial basis function approximation takes the following form:
where :[0, ) → R is a fixed univariate function and the coefficients, are real numbers, and represents the norm, being the Euclidean norm the most common choice. Mathematically, s(x) can be conceived as a linear combination of translations of a fixed function that is radially symmetric with respect to the given norm [].
Among the various RBF that can be found in the bibliography, Franke [] recommends the Multiquadric (RBMF) as the one providing the best results in terms of the statistical and visual evaluation of the modeled surface. In this case, the RBF kernel is given by the expression , where d equals the distance from the point to every interpolated node and c is the so-called smoothing factor.
2.3.2. Ordinary Kriging
Ordinary kriging (OK) is an interpolation method that can provide predictions of unknown values of a random function, which is considered as the BLUE (best linear unbiased estimator) in the sense of least variance []. It is also BUE (best unbiased estimator) if data respect the bell curve. When kriging is compared with deterministic interpolators, there are major differences. In fact, the former provides uncertainty assessment, anisotropy detection or methodology assumptions [].
Kriging aims to predict the value of the random variable at an unsampled point of a geographical region [,] by assuming the following model:
where are the kriging weights.
The function is composed of a deterministic component μ and a random function [].
The deterministic component is a constant value for each location in each area. As commented before, this stochastic method gives the optimal prediction under the presumption that the process is second-order stationery and normally distributed [,].
2.3.3. Universal Kriging
Universal kriging (UK) assumes the following model []:
where is the variable of interest, is some deterministic function, and is a term that considers random variation [].
UK is applied when the dependent variable does not meet the criterion of second-order stationarity necessary for OK. Second-order stationarity means that the mean and variance are the same on the entire area and that the correlation between any two observations depends only on their relative position in space [,]. Unlike OK, where the mean is assumed constant over the entire region of study, UK assumes that the mean depends on the spatial location, a relationship that can be approximated by a model [].
2.3.4. Gaussian Markov Random Fields
A Markov random field (MRF), also called the undirected graphical model, is a set of random variables (seabed depth in this case) having a Markov property described by an undirected graph []. Each edge-linking node in the graph represents dependency between the two nodes involved. In the case of DEM interpolation, and supposing a 4-neigborhood dependency graph for DEM grid points, two types of nodes are usually assumed: (i) estimated elevation at grid points (m) and (ii) observed elevations (z) (see Figure 6). Both affect the central cell estimate depending on prior factors (Fp) and observation factors (Fo), respectively [].
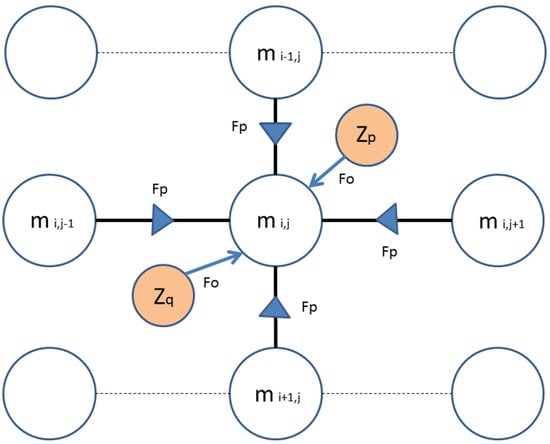
Figure 6.
GMRF graph corresponding to 4-neighbourhood scheme for a grid point at row i and column j.
An important special case is when the random field is Gaussian, also called Gaussian Markov random fields (GMRF). Supposing a random variable z (z being seabed depth in this case), a GMRF X(z) is defined by a mean function µ(z) = E(X(z)) and a covariance function C(z, t) = Cov(X(z), X(t)). It has the property that, for every finite collection of points {s1, …, sp}, x ≡ (X(s1), …, X(sp))T ∼ N(µ, Σ), where Σij = C(si, sj).
The reader can find a detailed explanation of the procedure and the mathematical framework applied in this work in []. It should be noted that the GMRF mathematical framework has the advantage of making it possible to retrieve the estimated uncertainty for each interpolated elevation point and even includes break lines (terrain discontinuities) between adjacent cells to produce high-quality topographic models.
2.4. Vertical Accuracy Evaluation
To evaluate the vertical accuracy of the models obtained with the different interpolation methods applied, a technique known as true validation was undertaken []. It consists of determining the difference between the calculated depth and the measured one in each independent checkpoint extracted from the initial dataset.
Finally, the statistical values of these residuals are calculated, such as mean, standard deviation, minimum, maximum and root mean square error (RMSE) [,].
RMSE was calculated in accordance with the formula:
where N is the number of the depth points, Zi(x, y) is the interpolated depth at the location i(x, y), and is the measured depth (checkpoint) at the same location i(x, y).
The estimation of random and systematic errors by using RMSE and mean statistics, respectively, assumes that the errors follow a normal distribution and there are no outliers. However, this assumption is not usually true when dealing with modelling topographic surfaces []. In this way, robust accuracy metrics including median and normalized median absolute deviation (NMAD) [] were also adopted in our experiment. Median and NMAD can be considered as robust alternatives to mean and RMSE, respectively. NMAD is expressed as follow:
where t is the number of checkpoints, is the i-th residual or estimation error. The constant 1.4826 is a correction parameter, making NMAD unbiased for the normal distribution of DEM errors, disregarding the abnormality induced by outliers [].
It should be noted that the robustness of median and NMAD is at the cost of efficiency loss for the normal distribution [].
2.5. ANOVA Test
The analysis of variance test (ANOVA) is a widely known statistical tool used to determine the influence of independent variables or factors (aggregated at different levels or groups) on a dependent variable by comparing the variance within groups with the variance among groups, and is the initial step in the analysis of factors that could affect a given dataset [,].
After performing the true validation vertical accuracy assessment for the four replicates taken at each sampling density tested, a full factorial ANOVA test was carried out with a single dependent variable (error statistics such as median, RMSE or NMAD) and several independent sources of variability or factors. Factorial experiments are defined when it is possible to evaluate the effect of two or more factors on the values taken by a dependent variable. In this case, the factors analyzed were sampling density (SD), seabed morphological complexity (M), and the interpolation method (IM), including the interactions between them. Figure 7 shows the factorial ANOVA test applied in our study. Q2 to Q23 represent the different sectors selected to investigate the factor seabed morphological complexity, while SD1 to SD8 refer to the different sampling densities tested. Finally, OK, UK, RBMF and GMRF are the four interpolation methods applied, and R1 to R4 are the four replicates taken at random for each sampling density.
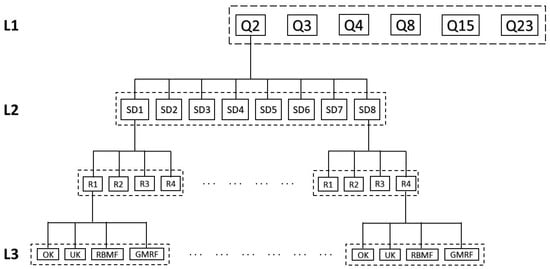
Figure 7.
Factorial ANOVA test scheme applied in this study for the sector Q2. L1: level 1 (morphological complexity). L2: level 2 (sampling density). L3: level 3 (interpolation method). This factorial flowchart is repeated for each sector.
Tukey’s mean separation post hoc test, also known as Tukey HSD (honestly significant difference) test, was performed for those factors or interactions that were indicated as statistically significant by the ANOVA test. Tukey’s test works by calculating a critical value based on the number of groups being compared and the total sample size. This critical value represents the minimum difference between two group means that is needed to conclude that the two groups are significantly different []. Then, for each pair of groups being compared, Tukey’s test calculates the difference between their means and compares it to the critical value. If the difference between the two means is larger than the critical value, the two groups are considered significantly different [,].
3. Results and Discussion
The vertical error statistics (systematic and random errors) corresponding to the true validation accuracy assessment were calculated by means of a specific code programmed in MATLAB.
3.1. Vertical Systematic Error
In order not to overextend the presentation of the results obtained, only the systematic errors obtained using a robust bias estimator such as the median were analyzed. Table 3 shows that all the factors that influenced the vertical bias given by the median statistical parameter (p-value < 0.05). In particular, from analyzing the F-value, it is possible to state that morphology (M) is the factor with the highest influence (F-value = 15.731). Next, we have the significant interaction between sampling density (SD) and morphology (F-factor = 11.485), and the high impact of the influence of sampling density (F-factor = 10.736). It should be noted that the interpolation method (IM), although statistically significant, was the factor that contributed the least (F-value = 8.886) towards explaining the variability of the systematic error (i.e., vertical bias).

Table 3.
Results of ANOVA test for the median statistic.
Figure 8 depicts the general trend of the vertical bias (median of the residuals) with respect to the factor SD. From the analysis of this figure, it is possible to conclude that the higher the density of the points surveyed to generate the seabed 3D models, the lower the vertical bias observed. In particular, there was first a decrease of positive bias (seabed depth overestimation) for the first four sampling densities, and a settlement for the last three, where a depth underestimation (slightly negative bias of about 2 cm) was found. Anyway, only the bias obtained for SD1, SD2 and SD3 (lowest sampling densities) were significantly different from zero (no bias), showing a low average positive bias that, in any case, was below 10 cm. This is likely due to the fact that UK needs high sampling densities to obtain more accurate results []. Note that UK is prone to overestimating the actual seabed depth, since it assumes that the mean depends on spatial location []. As far as the influence of the sampling density and the distribution of points is concerned, studies such as [,,] confirm the dependence of the model’s accuracy on both factors, thus stating the results obtained.
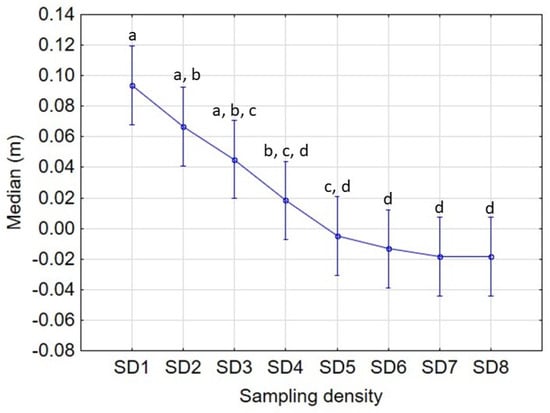
Figure 8.
Trend graph of the median of the residuals (Zinterpolated − Zcheckpoint) with respect to the factor Sampling Density. For each SD all morphologies and interpolation methods are included. Vertical bars denote 95% confidence intervals. Different letters between sampling densities indicate significant differences according to Tukey’s test (p < 0.05).
The general relationship between the interpolation method applied and the computed vertical systematic error is shown in Figure 9. It can be deduced that OK and RBMF were the interpolation methods that least influenced the bias of the seabed 3D model, both showing their potential as unbiased interpolators.
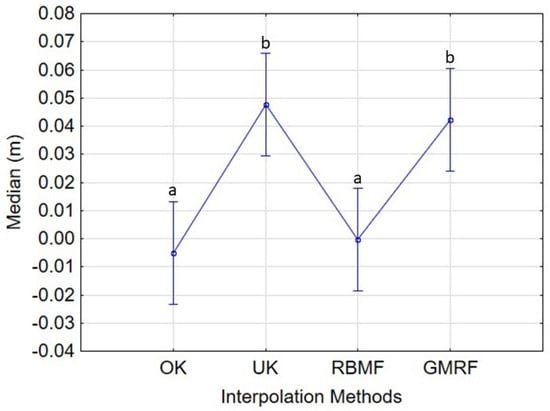
Figure 9.
Trend graph of the median of the residuals (Zinterpolated − Zcheckpoint) with respect to the factor Interpolation Method. Vertical bars denote 95% confidence intervals. Different letters between interpolation methods indicate significant differences according to Tukey’s test (p < 0.05).
By contrast, UK and GMRF demonstrated to slightly overestimate (below 5 cm on average) seabed depths. It is worth noting that UK models the spatial variability of the mean value of seabed depth by means of a deterministic trend function, which ultimately helps to over-smooth the resulting 3D model. This issue could explain the slight seabed-depth overestimation found in the tested sectors.
In the same way, GMRF interpolation method counts on a tuning parameter called the tolerance parameter or relaxation factor (σp) []. This parameter may be compared to the smoothing factor of interpolation based on radial basis functions (e.g., []). In fact, a low σp value or tolerance might not be suitable for sharp changes in elevation over short distances (high complexity morphologies). In such situations, the resulting 3D surface model would likely look over-smoothed, as it is convenient to diminish the stiffness of the interpolated surface by increasing the tolerance parameter. In this work, and for the sake of simplicity, a σp value of 1 m was used for all sectors, which could mean that some local roughness areas were modeled with an excessively restrictive tolerance parameter (too low), which contributed to an over-smoothing of the finally interpolated 3D-surface model.
Figure 10 depicts the specific interaction between the factors SD and IM. In other words, it shows how the intensity of the bathymetric sampling interacts with the interpolation methods tested in relation to the vertical systematic error of the obtained seabed 3D models. The results shown in this figure confirm that UK and GMRF performed worse than OK and RBMF, leading to a positive bias (seabed depth overestimation) associated with lower sampling densities. This bias is practically removed by increasing the sampling density to obtain a grid spacing less than 8.8 m (SD4). On the contrary, both OK and RBMF did not display any significant bias for the full range of sampling densities tested. In this case, it is possible to see how the bias in the case of OK and RBMF is almost always equal to zero when considering all the sampling densities tested.
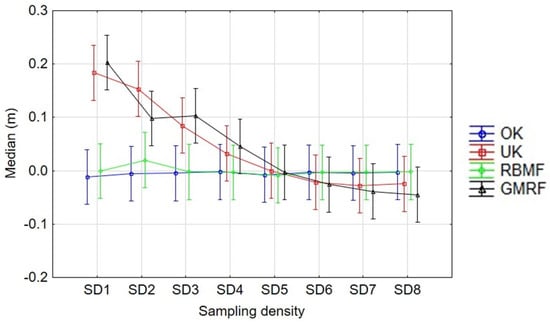
Figure 10.
Trend graph of the median of the residuals (Zinterpolated − Zcheckpoint) with respect to the interaction between Sampling Density and Interpolation Method. Vertical bars denote 95% confidence intervals.
Finally, Figure 11 displays the results of the vertical systematic error due to interpolation according to the significant interactions between the factors morphology and the interpolation method. In this case, it is possible to observe how all the interpolation methods tested in this work presented a significantly different behavior depending on the morphology of the seabed. In particular, it should be noted that GMRF was the interpolation method most influenced by morphology, providing both a positive and negative bias for all sectors except Q2 and Q23. UK also had a positive bias, albeit more moderate than GMRF. Once again, OK and RBMF proved to be unbiased interpolators for the full range of morphological complexities tested in this work and are qualified as the most suitable to work on any morphology even with low sampling densities. The negative bias obtained in the Q4 sector is certainly due to the previously analyzed tolerance factor. As was also found in [,], this parameter greatly affects the error and strongly depends on the type of morphology characterizing the sector. In the case of sector Q4, since the area is characterized by a strong variability of the seabed surface, the tolerance parameter was too low and, therefore, there was an underestimation of the interpolated surface with respect to the real one. Thus, it can be seen that the influence of the seabed/terrain morphology greatly influences the accuracy of the digital models obtained. Similar results were also found in the studies conducted by Masataka [] and Guo et al. [], confirming the strong influence of the slope or the terrain roughness.
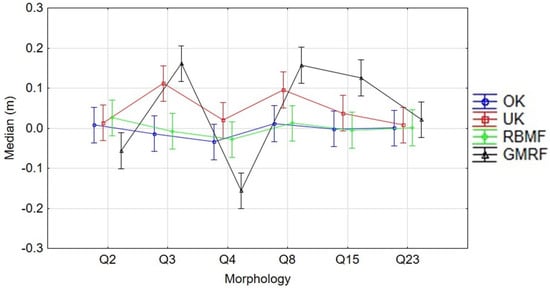
Figure 11.
Trend graph of the median of the residuals (Zinterpolated − Zcheckpoint) with respect to the interaction between Morphology and Interpolation Method. Vertical bars denote 95% confidence intervals.
3.2. Vertical Random Error
As was previously done for the vertical systematic error, a single robust estimator of random error such as NMAD was used to analyze the influence of interpolation methods on the random error of the gridded seabed surface. NMAD is an estimator of scale or variability and is insensitive to the presence of outliers. Moreover, it is not sensitive to the sample size [].
In order to obtain a complete statistical analysis, the ANOVA test was also performed on the RMSE statistic, but in order to not overextend the presentation of the results obtained, only those obtained for the NMAD are shown. The results are reported in the Supplementary Materials, where Table S1 shows the average value of vertical RMSE ± Standard deviation (four replicates) for each sample density and morphology tested. Table S2 shows the result of the ANOVA test, while Figures S1–S6 show the error trends as a function of the parameters analyzed (SD, M, MI, and the interactions between them). The results obtained for RMSE were very similar to those obtained and shown for NMAD.
The ANOVA test results for NMAD are reported in Table 4. As in the case of vertical bias, all the factors influenced the vertical random error given by NMAD, showing p-values clearly less than 0.05. The greatest influencing factor was SD, followed by M and IM (F-values of 545.538, 380.374 and 290.306, respectively). In this case, the factors contributed to explaining the variability of the random error much more significantly than the double and triple interactions.

Table 4.
ANOVA test results for vertical random error estimated from NMAD.
Figure 12 plots SD against the vertical random error (NMAD). The analysis of this Figure suggests that increasing the number of sampling points leads to a decreasing error. In fact, a very low density of sampling points reported a high random vertical error of about 1.8 m, while the highest sampling densities, SD7 and SD8, produced a very low interpolation vertical error of about 0.1 m. In this way, it is possible to conclude that the higher the density of the points surveyed, the lower the vertical random error observed. The plot of this error against the sampling density fits well with a decreasing potential function []. These results are in agreement with those reported by Borga et al. [] and Lazzaro et al. [], confirming that the greater the sampling density, the lower the impact of the interpolation method on the vertical random error; it is simply due to the shortening of the distance between surveyed and interpolated points. As confirmed also by Liu et al. [], the initial dataset can be reduced to a certain level without significantly decreasing the vertical accuracy of the output 3D-surface model.
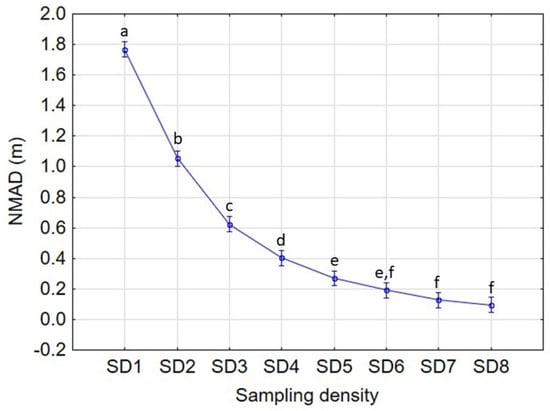
Figure 12.
Trend plot of NMAD vs. Sampling Density factor. For each SD all morphologies and interpolation methods are included. Vertical bars denote 95% confidence intervals. Different letters between sampling densities indicate significant differences according to Tukey’s test (p < 0.05).
Figure 13 displays the relationship between the vertical random error given by NMAD and the morphology factor. As predictable, the largest error (1.3 m) corresponded to the sector Q4, the morphologically more complex seabed sector. On the other hand, the flat seabed that characterized sector Q23 obtained the lowest interpolation error. It is important to note that the trend of the vertical error follows the previously calculated MVI values shown in Table 2. These results confirm the reliability of this index to estimate morphological complexity, also confirming the previous results obtained by Alcaras et al. []. It also reveals the strong dependency between the accuracy of the interpolated 3D-surface model and the morphological complexity of the surveyed seabed.
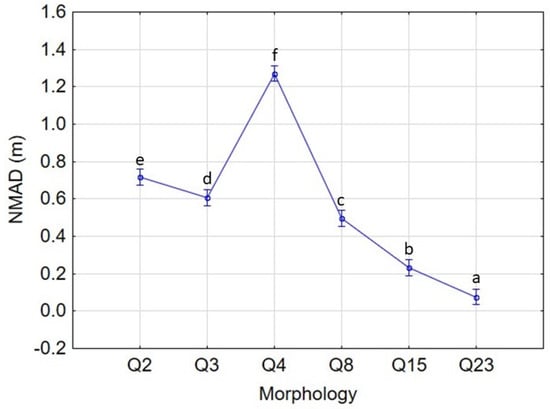
Figure 13.
Plot of NMAD vs. Morphology factor. Vertical bars denote 95% confidence intervals. Different letters between morphologies indicate significant differences according to Tukey’s test (p < 0.05).
The results of the vertical interpolation error (NMAD), depending on the applied interpolation method, are depicted in Figure 14. RBMF was the significantly best-performing interpolation method, achieving a mean NMAD below 0.3 m. It was closely followed by OK, which returned a mean NMAD value of 0.35 m. In contrast, both GMRF and UK performed significantly worse, obtaining mean NMAD values of 0.75 m and 0.9 m, respectively. These results agree with those obtained by Alcaras et al. [], confirming the good performance of OK with the so-called stable semi-variograms among the group of stochastic interpolation methods. Similarly, RBMF proved to be an outstanding and efficient method within the group of deterministic interpolators. The study conducted by Wu et al. [] confirms the results obtained in this work, confirming that OK and RBF perform the best when building a DBM according to the values recorded of RMSE and MAE. In addition, the studies published by Bello-Pineda et al. [] and Curtarelli et al. [] are in line with the obtained results, highlighting the excellent performance of the OK as an interpolation method. On the contrary, UK and GMRF were prone to over-smoothing the actual seabed surface, constituting a serious problem in the case of rugged topography.
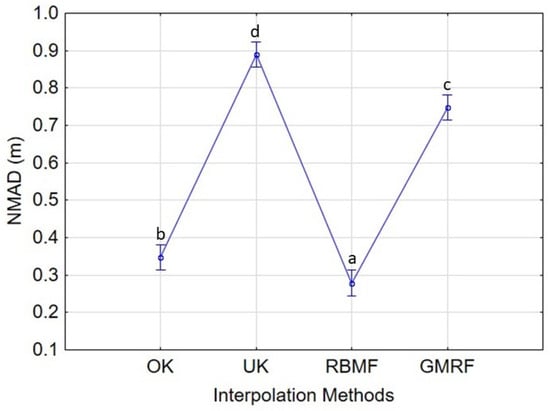
Figure 14.
Plot of NMAD vs. interpolation method factor. Vertical bars denote 95% confidence intervals. Different letters between interpolation methods indicate significant differences according to Tukey’s test (p < 0.05).
Figure 15 reports NMAD versus sampling density for each of the morphologies tested. It is worth noting that the relationship between SD and NMAD fits well to a decreasing potential function of the type , where B is a constant to adjust and AM is a factor (e.g., MVI) that depends on the morphological complexity of the surveyed area. In this sense, an increase in the sampling intensity leads to a decrease in the interpolation error that is modulated as a function of the seabed roughness. Sector Q4, having the highest seabed roughness, presented the largest vertical random error for SD1 (16 sample points), while sector Q23, the least morphologically complex, obtained the smallest error for SD1 (only about 0.25 m). These results confirm the findings reported by Aguilar et al. [] and the study conducted by Alcaras et al. [], stating the need to increase the number of sampling points (progressive sampling) in seabed areas characterized by a rugged topography.
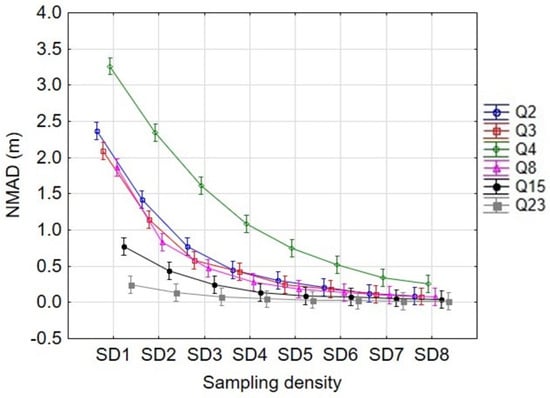
Figure 15.
Plot of NMAD vs. Sampling Density factor for each morphology surveyed (interaction between SD and M factors). Vertical bars denote 95% confidence intervals.
The results corresponding to the vertical random error, as a function of the combination of SD and IM, are depicted in Figure 16. Again, a decreasing potential function is drawn when plotting NMAD versus SD, although the exponent seems to be modified according to the interpolation method applied. In fact, the negative slope of the decreasing potential function is much higher for UK and GMRF than for OK and RBMF. Furthermore, the vertical random error made by the OK and RBMF interpolators is smaller than that made by the UK and GMRF for all sampling densities. Regarding the two best methods, it can be noted that, starting from SD3, the error becomes lower (around 0.4 m), decreasing more and more as the sampling density used increases. On the contrary, UK and GRMF need a higher density of points to reduce the error, particularly from SD5 onwards. These results confirm the need to increase the sampling density to obtain more accurate results, as shown in [].
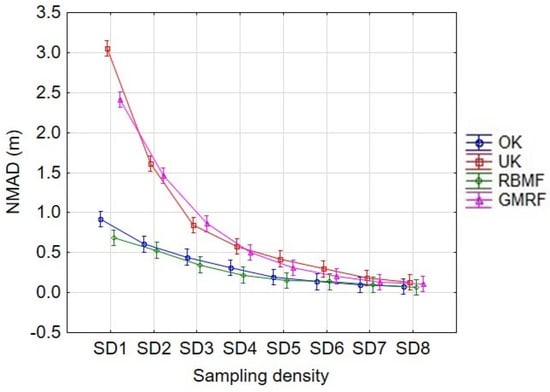
Figure 16.
Plot of NMAD vs. Sampling Density factor for each interpolation method (interaction between SD and IM factors). Vertical bars denote 95% confidence intervals.
Finally, Figure 17 shows the results corresponding to the influence of the interaction between M and IM on the vertical random error of the interpolated 3D surface. As mentioned above, a sort of clustering can be distinguished into two categories. On the one hand, OK and RBMF, the best interpolators for all tested sample densities. On the other hand, the UK and GMRF performed the worst. As expected, the maximum interpolation error was obtained with UK in the most rugged sector Q4 (mean value of 1.79 m), while the minimum error was obtained with OK and RBMF in sector Q23 (close to zero, i.e., almost no error).
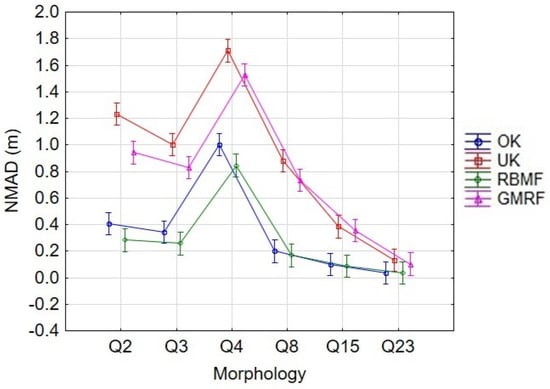
Figure 17.
Plot of NMAD vs. Morphology for each interpolation method. Vertical bars denote 95% confidence intervals.
As can be seen in Figure 17, all the interpolation methods turned out to be influenced by the morphology in which they were applied. For example, OK and RBMF generated less vertical error than UK and GMRF in all morphologies tested, although this difference was practically negligible in the flattest morphology Q23. These results prove the good performance of the morphological index used to estimate the topographic complexity of the seabed, since the error trend is quite similar to the MVI values shown in Table 2. It also confirms the strong dependence between the interpolation method and the morphology of the studied area, a relationship also pointed out in several works such as [,,,].
4. Conclusions
The results obtained in this study confirm that the morphological complexity of the seabed, the sampling density and the interpolation method have an important and statistically significant impact on the vertical accuracy of the interpolated digital bathymetric models (grid format). The error of these 3D-surface models was estimated using the true validation method and two robust statistical parameters: the median for the vertical systematic error and the NMAD for the vertical random error.
From the analysis of the results provided by the ANOVA test, it can be stated that sampling density and morphology are the factors that most influence the accuracy of interpolated digital bathymetric models, relegating the interpolation method to third place. In addition, the statistically significant influence of the interaction between sampling density and morphology on the vertical accuracy of the interpolated 3D surface confirms the need to perform a preliminary analysis of the morphological complexity of the seabed in order to increase, when necessary, the sampling intensity (surveyed points) in cases of complex morphologies.
The results demonstrated that both radial basis multiquadric function (RBMF) and ordinary kriging (OK) interpolators were able to build accurate grid-format bathymetric models in areas characterized by low levels of variation of seabed morphology with low sampling densities (8 m grid spacing). In contrast, a higher sampling density (3 m grid spacing 3 m or less) was required to produce accurate bathymetric models in areas characterized by high level of variation of seabed morphology. In cases with the most rugged seabeds, RBMF resulted to be the most accurate interpolation method, while universal kriging (UK) and Gaussian Markov fandom field (GMRF) appeared to be strongly influenced by morphology and sampling density, showing that they are more likely to slightly overestimate seabed depths.
MVI proved to be a very powerful index to estimate the degree of roughness of the seabed, so it can be recommended to carry out a preliminary study of the morphological complexity of the seabed to be surveyed. Since every preliminary study has its price, this first reconnaissance survey would be based on a survey with a low sample density or previously available navigation charts, which may be economically affordable. It should be noted that the IHO Standards for hydrographic surveys for “Exclusive Order area of survey” would require a very expensive survey, with up to 200% feature search and 200% bathymetric coverage.
Future developments of this work and further studies will be focused on testing other interpolation methods and datasets representative of different seabed configurations. In addition, further tests will be carried out to validate the use of MVI to quantitatively represent the variation of seabed morphology.
Supplementary Materials
The following supporting information can be downloaded at: https://www.mdpi.com/article/10.3390/rs15082072/s1, Table S1: Average value of vertical RMSE ± Standard deviation (four replicates) for each sample density and morphology tested, Table S2: Results of ANOVA test for the RMSE statistic, Figures S1–S6: Trend graph of the RMSE of the residuals (Zinterpolated − Zcheckpoint) with respect to the factors Sampling Density, Morphology, Interpolation Method and the combination between these factors. For each SD all morphologies and interpolation methods are included. Vertical bars denote 0.95 confidence intervals. In Figures S1–S3 different letters between sampling densities, interpolation methods and morphologies indicate significant differences according to Tukey’s test (p < 0.05).
Author Contributions
Conceptualization, F.J.A. and C.P.; Methodology, F.J.A.; Software, F.J.A.; Validation, M.A.A.; Investigation, P.P.A., F.J.A., C.P. and M.A.A.; Data curation, P.P.A.; Writing—original draft, Pier Paolo Amoroso; Writing—review & editing, F.J.A., C.P. and M.A.A.; Supervision, F.J.A. and C.P. All authors have read and agreed to the published version of the manuscript.
Funding
This research received no external funding.
Data Availability Statement
No new data were created or analyzed in this study. Data sharing is not applicable to this article.
Acknowledgments
This work takes part of the general research lines promoted by the Agrifood Campus of International Excellence ceiA3, Spain (http://www.ceia3.es/, accessed on 12 April 2023) and by the International PhD Programme “Environment, Resources and Sustainable Development” of Department of Science and Technology of Parthenope University of Naples (https://www.unescochair.uniparthenope.it, accessed on 12 April 2023). The Hydrographic Institute of Italian Navy (IIM) provides the multi-beam data acquired during a bathymetric survey.
Conflicts of Interest
The authors declare no conflict of interest.
References
- Ferreira, I.O.; de Andrade, L.C.; Teixeira, V.G.; Santos, F.C.M. State of art of bathymetric surveys. Bull. Geod. Sci. 2022, 28, 1. [Google Scholar] [CrossRef]
- Le Deunf, J.; Debese, N.; Schmitt, T.; Billot, R. A Review of Data Cleaning Approaches in a Hydrographic Framework with a Focus on Bathymetric Multibeam Echosounder Datasets. Geosciences 2020, 10, 254. [Google Scholar] [CrossRef]
- Lague, D.; Feldmann, B. Topo-bathymetric airborne LiDAR for fluvial-geomorphology analysis. Dev. Earth Surf. Process. 2020, 23, 25–54. [Google Scholar] [CrossRef]
- Aguilar, F.J.; Fernandez-Luque, I.; Aguilar, M.A.; García Lorca, A.M.; Viciana, A.R. The integration of multi-source remote sensing data for the modelling of shoreline change rates in a mediterranean coastal sector. Int. J. Remote Sens. 2019, 40, 1148–1174. [Google Scholar] [CrossRef]
- Prampolini, M.; Angeletti, L.; Castellan, G.; Grande, V.; Le Bas, T.; Taviani, M.; Foglini, F. Benthic Habitat Map of the Southern Adriatic Sea (Mediterranean Sea) from Object-Based Image Analysis of Multi-Source Acoustic Backscatter Data. Remote Sens. 2021, 13, 2913. [Google Scholar] [CrossRef]
- Brown, C.J.; Smith, S.J.; Lawton, P.; Anderson, J.T. Benthic habitat mapping: A review of progress towards improved understanding of the spatial ecology of the seafloor using acoustic techniques. Estuar. Coast. Shelf Sci. 2011, 92, 502–520. [Google Scholar] [CrossRef]
- Lamarche, G.; Orpin, A.R.; Mitchell, J.S.; Pallentin, A. Benthic Habitat Mapping. In Biological Sampling in the Deep Sea; Wiley: Hoboken, NJ, USA, 2016; pp. 80–102. ISBN 9781118332535. [Google Scholar]
- Arseni, M.; Voiculescu, M.; Georgescu, L.P.; Iticescu, C.; Rosu, A. Testing Different Interpolation Methods Based on Single Beam Echosounder River Surveying. Case Study: Siret River. ISPRS Int. J. Geo-Inf. 2019, 8, 507. [Google Scholar] [CrossRef]
- Wilson, M.F.J.; O’Connell, B.; Brown, C.; Guinan, J.C.; Grehan, A.J. Multiscale terrain analysis of multibeam bathymetry data for habitat mapping on the continental slope. Mar. Geod. 2007, 30, 3–35. [Google Scholar] [CrossRef]
- Degraer, S.; Moerkerke, G.; Rabaut, M.; Van Hoey, G.; Du Four, I.; Vincx, M.; Henriet, J.P.; Van Lancker, V. Very-high resolution side-scan sonar mapping of biogenic reefs of the tube-worm Lanice conchilega. Remote Sens. Environ. 2008, 112, 3323–3328. [Google Scholar] [CrossRef]
- Amoroso, P.P.; Parente, C. The importance of sound velocity determination for bathymetric survey. Acta IMEKO 2021, 10, 46–53. [Google Scholar] [CrossRef]
- Figliomeni, F.G.; Parente, C. Bathymetry from satellite images: A proposal for adapting the band ratio approach to IKONOS data. Appl. Geomat. 2022, 1, 1–17. [Google Scholar] [CrossRef]
- Sagawa, T.; Yamashita, Y.; Okumura, T.; Yamanokuchi, T. Satellite Derived Bathymetry Using Machine Learning and Multi-Temporal Satellite Images. Remote Sens. 2019, 11, 1155. [Google Scholar] [CrossRef]
- Muzirafuti, A.; Barreca, G.; Crupi, A.; Faina, G.; Paltrinieri, D.; Lanza, S.; Randazzo, G. The Contribution of Multispectral Satellite Image to Shallow Water Bathymetry Mapping on the Coast of Misano Adriatico, Italy. J. Mar. Sci. Eng. 2020, 8, 126. [Google Scholar] [CrossRef]
- Parente, C.; Pepe, M. Bathymetry from worldview-3 satellite data using radiometric band ratio. Acta Polytech. 2018, 58, 109–117. [Google Scholar] [CrossRef]
- Alcaras, E.; Amoroso, P.P.; Figliomeni, F.G.; Parente, C.; Vallario, A. Using Electronic Navigational Chart for 3d Bathymetric Model of the Port of Naples. Int. Arch. Photogramm. Remote Sens. Spat. Inf. Sci. 2023, XLVIII-4/W6-2022, 7–13. [Google Scholar] [CrossRef]
- International Hydrographic Organization. Standards for Hydrographic Surveys S-44 Edition 6.0.0; International Hydrographic Organization: 16 Bld Princesse Charlotte, Monaco, 2020. [Google Scholar]
- Alcaras, E.; Vallario, A.; Claudio, P. Comparison of different interpolation methods for DEM production. Int. J. Adv. Trends Comput. Sci. Eng. 2019, 6, 1654–1659. [Google Scholar] [CrossRef]
- Weng, Q. An evaluation of spatial interpolation accuracy of elevation data. In Progress in Spatial Data Handling: 12th International Symposium on Spatial Data Handling; Springer: Berlin/Heidelberg, Germany, 2006; pp. 805–824. [Google Scholar]
- Tobler, W. Frame independent spatial analysis. In Accuracy of Spatial Databases; CRC Press: Boca Raton, FL, USA, 1989; pp. 115–122. [Google Scholar]
- Tobler, W.R. A Computer Movie Simulating Urban Growth in the Detroit Region. Econ. Geogr. 1970, 46, 234–240. [Google Scholar] [CrossRef]
- Griffith, D.A. Advanced spatial statistics for analysing and visualizing geo-referenced data. Int. J. Geogr. Inf. Syst. 1993, 7, 107–123. [Google Scholar] [CrossRef]
- Arun, P.V. A comparative analysis of different DEM interpolation methods. Egypt. J. Remote Sens. Space Sci. 2013, 16, 133–139. [Google Scholar] [CrossRef]
- Li, J.; Heap, A.D. Spatial interpolation methods applied in the environmental sciences: A review. Environ. Model. Softw. 2014, 53, 173–189. [Google Scholar] [CrossRef]
- Wu, C.Y.; Mossa, J.; Mao, L.; Almulla, M. Comparison of different spatial interpolation methods for historical hydrographic data of the lowermost Mississippi River. Ann. GIS 2019, 25, 133–151. [Google Scholar] [CrossRef]
- Özdamar, L.; Demirhan, M.; Özpınar, A. A comparison of spatial interpolation methods and a fuzzy areal evaluation scheme in environmental site characterization. Comput. Environ. Urban Syst. 1999, 23, 399–422. [Google Scholar] [CrossRef]
- Lam, N.S.-N. Spatial Interpolation Methods: A Review. Am. Cartogr. 1983, 10, 129–150. [Google Scholar] [CrossRef]
- Caruso, C.; Quarta, F. Interpolation methods comparison. Comput. Math. Appl. 1998, 35, 109–126. [Google Scholar] [CrossRef]
- Negreiros, J.G.; Painho, M.; Aguilar, M.A.; Aguilar, F. Spatial error and interpolation uncertainty appraisal within Geographic Information Systems. Res. J. Appl. Sci. 2008, 3, 471–479. [Google Scholar]
- Colin Childs. Interpolating Surfaces in ArcGIS Spatial. Semant. Sch. 2004, p. 17804891. Available online: https://www.semanticscholar.org/paper/Interpolating-Surfaces-in-ArcGIS-Spatial-Childs/944f410c2ac7456fe951b726f63c2f41466b9f67 (accessed on 3 February 2023).
- Gunarathna, M.H.J.P.; Nirmanee, K.G.; Kumari, N. Are Geostatistical Interpolation Methods Better than Deterministic Interpolation Methods in Mapping Salinity of Groundwater? Int. J. Res. Innov. Earth Sci. 2016, 3, 1375–2394. [Google Scholar]
- Meng, Q.; Liu, Z.; Borders, B.E. Assessment of regression kriging for spatial interpolation–comparisons of seven GIS interpolation methods. Cartogr. Geogr. Inf. Sci. 2013, 40, 28–39. [Google Scholar] [CrossRef]
- Varouchakis, Ε.A.; Hristopulos, D.T. Comparison of stochastic and deterministic methods for mapping groundwater level spatial variability in sparsely monitored basins. Environ. Monit. Assess. 2013, 185, 1–19. [Google Scholar] [CrossRef]
- Negreiros, J.; Painho, M.; Aguilar, F.; Aguilar, M. Geographical information systems principles of ordinary kriging interpolator. J. Appl. Sci. 2010, 10, 852–867. [Google Scholar] [CrossRef]
- Gong, G.; Mattevada, S.; O’Bryant, S.E. Comparison of the accuracy of kriging and IDW interpolations in estimating groundwater arsenic concentrations in Texas. Environ. Res. 2014, 130, 59–69. [Google Scholar] [CrossRef]
- Aguilar Torres, F.J.; Aguilar Torres, M.Á.; Agüera Vega, F.; Carvajal Ramírez, F.; Sánchez Salmerón, P.L. Efectos de la morfología del terreno, densidad muestral y métodos de interpolación en la calidad de los modelos digitales de elevaciones. In Evaluación de la Calidad en Modelos Digitales de Elevaciones; Grupo de Investigación Ingeniería Cartográfica: Jaén, Spain, 2002; pp. 453–465. [Google Scholar]
- Aguilar, F.J.; Agüera, F.; Aguilar, M.A.; Carvajal, F. Effects of terrain morphology, sampling density, and interpolation methods on grid DEM accuracy. Photogramm. Eng. Remote Sens. 2005, 71, 805–816. [Google Scholar] [CrossRef]
- Chaplot, V.; Darboux, F.; Bourennane, H.; Leguédois, S.; Silvera, N.; Phachomphon, K. Accuracy of interpolation techniques for the derivation of digital elevation models in relation to landform types and data density. Geomorphology 2006, 77, 126–141. [Google Scholar] [CrossRef]
- Chen, C.; Yang, S.; Li, Y. Accuracy Assessment and Correction of SRTM DEM Using ICESat/GLAS Data under Data Coregistration. Remote Sens. 2020, 12, 3435. [Google Scholar] [CrossRef]
- Gosciewski, D. The effect of the distribution of measurement points around the node on the accuracy of interpolation of the digital terrain model. J. Geogr. Syst. 2013, 15, 513–535. [Google Scholar] [CrossRef]
- Guo-an, T.; Strobl, J.; Jian-ya, G.; Mu-dan, Z.; Zhen-jiang, C. Evaluation on the accuracy of digital elevation models. J. Geogr. Sci. 2001, 11, 209–216. [Google Scholar] [CrossRef]
- Guo, Q.; Li, W.; Yu, H.; Alvarez, O. Effects of topographie variability and lidar sampling density on several DEM interpolation methods. Photogramm. Eng. Remote Sens. 2010, 76, 701–712. [Google Scholar] [CrossRef]
- Masataka, T. Accuracy of Digital Elevation Model according to Spatial Resolution. Int. Arch. Photogramm. Remote Sens. 1998, 32, 613–617. [Google Scholar]
- Mesa-Mingorance, J.L.; Ariza-López, F.J. Accuracy Assessment of Digital Elevation Models (DEMs): A Critical Review of Practices of the Past Three Decades. Remote Sens. 2020, 12, 2630. [Google Scholar] [CrossRef]
- Aguilar, F.J.; Mills, J.P.; Delgado, J.; Aguilar, M.A.; Negreiros, J.G.; Pérez, J.L. Modelling vertical error in LiDAR-derived digital elevation models. ISPRS J. Photogramm. Remote Sens. 2010, 65, 103–110. [Google Scholar] [CrossRef]
- Alcaras, E.; Amoroso, P.P.; Parente, C. The Influence of Interpolated Point Location and Density on 3D Bathymetric Models Generated by Kriging Methods: An Application on the Giglio Island Seabed (Italy). Geosciences 2022, 12, 62. [Google Scholar] [CrossRef]
- Krivoruchko, K. “Spatial Statistical Data Analysis for GIS Users”-Esri Community. Available online: https://community.esri.com/t5/arcgis-geostatistical-analyst-questions/quot-spatial-statistical-data-analysis-for-gis/td-p/394418 (accessed on 3 February 2023).
- Zimmerman, D.L.; Zimmerman, M.B. A Comparison of Spatial Semivariogram Estimators and Corresponding Ordinary Kriging Predictors. Technometrics 1991, 33, 77–91. [Google Scholar] [CrossRef]
- Wang, J.-F.; Stein, A.; Gao, B.-B.; Ge, Y. A review of spatial sampling. Spat. Stat. 2012, 2, 1–14. [Google Scholar] [CrossRef]
- Pardo-Iguzquiza, E.; Chica-Olmo, M. Geostatistics with the Matern semivariogram model: A library of computer programs for inference, kriging and simulation. Comput. Geosci. 2008, 34, 1073–1079. [Google Scholar] [CrossRef]
- Goovaerts, P. Kriging and Semivariogram Deconvolution in the Presence of Irregular Geographical Units. Math. Geosci. 2008, 40, 101–128. [Google Scholar] [CrossRef]
- ArcGIS. How Radial Basis Functions Work—ArcGIS Pro|Documentation; ArcGIS: Online, 2023; Available online: https://pro.arcgis.com/en/pro-app/latest/help/analysis/geostatistical-analyst/how-radial-basis-functions-work.htm (accessed on 3 February 2023).
- Buhmann, M.D. Radial basis functions. Acta Numer. 2000, 9, 1–38. [Google Scholar] [CrossRef]
- Franke, R. Scattered Data Interpolation: Tests of Some Method. Math. Comput. 1982, 38, 181–200. [Google Scholar] [CrossRef]
- Van Beers, W.C.M.; Kleijnen, J.P.C. Kriging for interpolation in random simulation. J. Oper. Res. Soc. 2003, 54, 255–262. [Google Scholar] [CrossRef]
- Webster, R.; Oliver, M.A. Geostatistics for Environmental Scientists; John Wiley & Sons: Hoboken, NJ, USA, 2008; pp. 1–315. [Google Scholar] [CrossRef]
- Chen, C.; Bei, Y.; Li, Y.; Zhou, W. Effect of interpolation methods on quantifying terrain surface roughness under different data densities. Geomorphology 2022, 417, 108448. [Google Scholar] [CrossRef]
- Oliver, M.; Webster, R.; Gerrard, J. Geostatistics in Physical Geography. Part I: Theory. Trans. Inst. Br. Geogr. 1989, 14, 259–269. [Google Scholar] [CrossRef]
- Strandberg, J.; Sjöstedt de Luna, S.; Mateu, J. Prediction of spatial functional random processes: Comparing functional and spatio-temporal kriging approaches. Stoch. Environ. Res. Risk Assess. 2019, 33, 1699–1719. [Google Scholar] [CrossRef]
- Johnston, K.; Ver Hoef, J.M.; Krivoruchko, K.; Lucas, N. (2) (PDF) Using ArcGIS Geostatistical Analyst. Available online: https://www.researchgate.net/publication/200043204_Using_ArcGIS_geostatistical_analyst (accessed on 3 February 2023).
- Gundogdu, K.S.; Guney, I. Spatial analyses of groundwater levels using universal kriging. J. Earth Syst. Sci. 2007, 116, 49–55. [Google Scholar] [CrossRef]
- Armstrong, M. Problems with universal kriging. J. Int. Assoc. Math. Geol. 1984, 16, 101–108. [Google Scholar] [CrossRef]
- Booker, A.J.; Dennis, J.E.; Boeing, P.D.F.; Serafini, D.B.; Lawrence Berkeley, E.O.; Torczon, V.; Trosset, M.W. A Rigorous Framework for Optimization of Expensive Functions by Surrogates. Struct. Optim. 1998, 17, 1–13. [Google Scholar] [CrossRef]
- Kiš, I.M. Comparison of ordinary and universal kriging interpolation techniques on a depth variable (a case of linear spatial trend), case study of the Šandrovac Field. Rud. Geol. Naft. Zb. 2016, 31, 41–58. [Google Scholar] [CrossRef]
- Li, S.Z. Markov Random Field Modeling in Image Analysis; Springer: Berlin/Heidelberg, Germany, 2009; p. 357. [Google Scholar]
- Aguilar, F.J.; Aguilar, M.A.; Blanco, J.L.; Nemmaoui, A.; Lorca, A.M.G. Analysis and validation of grid DEM generation based on Gaussian markov random field. Int. Arch. Photogramm. Remote Sens. Spat. Inf. Sci. ISPRS Arch. 2016, 41, 277–284. [Google Scholar] [CrossRef]
- Voltz, M.; Webster, R. A comparison of kriging, cubic splines and classification for predicting soil properties from sample information. J. Soil Sci. 1990, 41, 473–490. [Google Scholar] [CrossRef]
- Li, Z. On the Measure of Digital Terrain Model Accuracy. Photogramm. Rec. 1988, 12, 873–877. [Google Scholar] [CrossRef]
- Aguilar, F.J.; Aguilar, M.A.; Agüera, F. Accuracy assessment of digital elevation models using a non-parametric approach. Int. J. Geogr. Inf. Sci. 2007, 21, 667–686. [Google Scholar] [CrossRef]
- Höhle, J.; Höhle, M. Accuracy assessment of digital elevation models by means of robust statistical methods. ISPRS J. Photogramm. Remote Sens. 2009, 64, 398–406. [Google Scholar] [CrossRef]
- Rousseeuw, P.J.; Croux, C. Alternatives to the Median Absolute Deviation. J. Am. Stat. Assoc. 1993, 88, 1273–1283. [Google Scholar] [CrossRef]
- Rousseeuw, P.J.; Hubert, M. Robust statistics for outlier detection. Wiley Interdiscip. Rev. Data Min. Knowl. Discov. 2011, 1, 73–79. [Google Scholar] [CrossRef]
- Cochran, R.S. Book Review: Statistical Methods-7th Edition. Educ. Psychol. Meas. 1983, 43, 319–320. [Google Scholar] [CrossRef]
- Sthle, L.; Wold, S. Analysis of Variance (ANOVA). Chemom. Intell. Lab. Syst. 1989, 6, 259–272. [Google Scholar] [CrossRef]
- Ruxton, G.D.; Beauchamp, G. Time for some a priori thinking about post hoc testing. Behav. Ecol. 2008, 19, 690–693. [Google Scholar] [CrossRef]
- Abdi, H.; Williams, L.J. Encyclopedia of Research Design; Sage: Thousand Oaks, CA, USA, 2010. [Google Scholar]
- Alcaras, E.; Amoroso, P.P.; Falchi, U.; Parente, C. On the Accuracy of Geoid Heights Derived from Discrete GNSS/Levelling Data Using Kriging Interpolation. In International Association of Geodesy Symposia; Springer: Berlin/Heidelberg, Germany, 2022; pp. 1–7. [Google Scholar] [CrossRef]
- Carlson, R.E.; Foley, T.A. The parameter R2 in multiquadric interpolation. Comput. Math. Appl. 1991, 21, 29–42. [Google Scholar] [CrossRef]
- Aguilar, F.J.; Aguilar, M.A.; Agüera, F.; Sánchez, J. The accuracy of grid digital elevation models linearly constructed from scattered sample data. Int. J. Geogr. Inf. Sci. 2006, 20, 169–192. [Google Scholar] [CrossRef]
- Huber, P.J.; Ronchetti, E.M. Robust Statistics, 2nd ed.; Wiley: Hoboken, NJ, USA, 2009; pp. 1–354. [Google Scholar] [CrossRef]
- Borga, M.; Vizzaccaro, A. On the interpolation of hydrologic variables: Formal equivalence of multiquadratic surface fitting and kriging. J. Hydrol. 1997, 195, 160–171. [Google Scholar] [CrossRef]
- Lazzaro, D.; Montefusco, L.B. Radial basis functions for the multivariate interpolation of large scattered data sets. J. Comput. Appl. Math. 2002, 140, 521–536. [Google Scholar] [CrossRef]
- Liu, X.; Zhang, Z.; Peterson, J.; Chandra, S. The Effect of LiDAR Data Density on DEM Accuracy. In Proceedings of the International Congress on Modelling and Simulation (MODSIM07), Christchurch, New Zealand, 10–13 December 2007. [Google Scholar]
- Bello-Pineda, J.; Luis Hernández-Stefanoni, J. Comparing the performance of two spatial interpolation methods for creating a digital bathymetric model of the Yucatan submerged platform. Panam. J. Aquat. Sci. 2007, 2, 247–254. [Google Scholar]
- Curtarelli, M.; Leão, J.; Ogashawara, I.; Lorenzzetti, J.; Stech, J. Assessment of Spatial Interpolation Methods to Map the Bathymetry of an Amazonian Hydroelectric Reservoir to Aid in Decision Making for Water Management. ISPRS Int. J. Geo-Inf. 2015, 4, 220–235. [Google Scholar] [CrossRef]
- Erdogan, S. A comparision of interpolation methods for producing digital elevation models at the field scale. Earth Surf. Process. Landf. 2009, 34, 366–376. [Google Scholar] [CrossRef]
Disclaimer/Publisher’s Note: The statements, opinions and data contained in all publications are solely those of the individual author(s) and contributor(s) and not of MDPI and/or the editor(s). MDPI and/or the editor(s) disclaim responsibility for any injury to people or property resulting from any ideas, methods, instructions or products referred to in the content. |
© 2023 by the authors. Licensee MDPI, Basel, Switzerland. This article is an open access article distributed under the terms and conditions of the Creative Commons Attribution (CC BY) license (https://creativecommons.org/licenses/by/4.0/).