Article

Radiometric Correction with Topography Influence of Multispectral Imagery Obtained from Unmanned Aerial Vehicles

by
Agnieszka Jenerowicz
*,
Damian Wierzbicki
and
Michal Kedzierski
Department of Imagery Intelligence, Faculty of Civil Engineering and Geodesy, Military University of Technology, 00-908 Warsaw, Poland
*
Author to whom correspondence should be addressed.
Remote Sens. 2023, 15(8), 2059; https://doi.org/10.3390/rs15082059
Submission received: 9 February 2023 / Revised: 31 March 2023 / Accepted: 12 April 2023 / Published: 13 April 2023
(This article belongs to the Special Issue Applications of Unmanned Aerial Vehicle (UAV) Based Remote Sensing)

Abstract

:
This article aims to present the methods of the radiometric correction of multispectral images—a short review of the existing techniques. The role of radiometric correction is essential to many applications, especially in precision farming, forestry, and climate analysis. Moreover, this paper presents a new relative approach, which considers the angle of inclination of the terrain and the angle of incidence of electromagnetic radiation on the imaged objects when obtaining the baseline data. This method was developed for data obtained from low altitudes—for imagery data acquired by sensors mounted on UAV platforms. The paper analyses the effect of the correction on the spectral information, i.e., the compatibility of the spectral reflection characteristics obtained from the image with the spectral reflection characteristics obtained in the field. The developed method of correction for multispectral data obtained from low altitudes allows for the mapping of spectral reflection characteristics to an extent that allows for the classification of terrestrial coverage with an accuracy of over 95%. In addition, it is possible to distinguish objects that are very similar in terms of spectral reflection characteristics. This research presents a new method of correction of each spectral channel obtained by the multispectral camera, increasing the accuracy of the results obtained, e.g., based on SAM coefficients or correlations, but also when distinguishing land cover types during classification. The results are characterized by high accuracy (over 94% in classification).

1. Introduction

A lot of information is obtained by interpreting photos taken from different heights, close-range photogrammetry, UAV (unmanned aerial vehicle) photos, and satellite imagery. Of course, the better the image quality, the more information can be read. Interpretation will be difficult or impossible if the image is fuzzy, out of focus, and noisy. That is why obtaining images of the highest quality, as well as methods of correcting these images to eliminate distortions and improve radiometric quality, is such a significant problem currently. Since satellite imagery began to be acquired, techniques for their correction have also been developed [1,2,3,4,5]. At present, there are many algorithms dedicated to this task. However, the correction of low-altitude images is a relatively new topic. Various studies are still underway to find the proper methods to improve the quality of UAV images [1,6,7]. The effectiveness of these methods for images obtained in very different conditions has still not been confirmed.
The development of low-altitude imaging requires the development of correction techniques adapted to the images recorded by UAVs, which is the subject of many modern studies [4]. Due to the low flight altitude, the correction of UAV images is usually limited to noise reduction and detector errors. The atmospheric and solar correction stage is neglected due to the short length of the radiation path [6]. However, recent studies [7,8] have shown that the atmospheric correction of such images cannot be omitted entirely, especially when they are low-quality images obtained in unfavourable conditions characterised by haze or blurring [9,10].
After reducing the influence of the atmosphere, it remains to consider the sun’s impact and topography’s impact on the image quality. Solar and topographical correction reduces the uneven illumination of the scene, which affects the pixel values, from which the reflective properties of objects can be determined. Solar and topographic correction can be solved with a simple cosine correction model, which considers only the solar zenith angle and the distance of the Earth from the sun. In some of its modifications, the incidence angle is also considered [11,12,13,14,15,16,17]. The application of radiometric correction is essential in remote sensing applications. The process of radiometric calibration refers to the ability to convert the digital numbers recorded by imaging systems into physical units such as radiance (W/m2/sr/µm) or apparent top-of-atmosphere reflectance. This type of correction is crucial for reliable quantitative measurements of the images [18]. When studying climate change, it is important to know the correct reflectance values of forests to accurately establish their health [19,20,21,22,23]. Moreover, in precision agriculture, accurate reflectance data are used to determine whether a crop field is being watered properly or to look for pest infestation [24,25,26,27]. In addition, accurate spectral response is crucial in different multitemporal analyses [28,29,30].
The importance of radiometric correction in the case of satellite and aerial imagery is obvious. Due to the high altitude of the platforms, the influence of the atmosphere must be removed. However, in the case of UAV data, it is not so obvious. As mentioned by Shin et al. [22], UAV images are acquired at a relatively low altitude compared to aerial or satellite imagery, therefore they may not possess significant radiometric distortions. However, UAV images have small field of view, and therefore it is important to proceed with mosaicking. Because the time to acquire images by UAV for a large area is much longer than in the case of aerial or satellite images, each UAV image may experience a different turbulence, a different incidence angle, different illumination, or different signal processing chains. Therefore, the radiometric correction of UAV images is crucial.

1.1. Related Works

In low-altitude multispectral imaging, proper radiometric correction plays an important role. Particularly, it is often overlooked, and is very important, in precise land surface reflectance. Usually, even slight height differences in the terrain cause distortions in the quantitative analysis of multispectral data and vegetation indices of the images obtained from low ceilings. Along with the changing topography of the terrain, the signal received from a similar land cover also changes. This change results from differences in solar irradiance and radiance according to the incidence angle and reflection inclination [31]. The occurrence of differences in reflection causes, in turn, the area with the same spectral characteristics to be reflected in a completely different way. Therefore, it will be classified as a completely different class. In areas with even low denivelations, differences in reflection geometry and illumination angles are caused by different inclination angles and orientations of the sensor during the flight of the UAV platform. Thus, in images that have not been normalised, there will be differences in the exposure of the areas “facing” towards the sun and the shaded regions.
Based on Figure 1, areas with varied terrain are deprived of the influence of unequal and heterogeneous lighting, e.g., on the slopes of hills. Radiometric correction considering the area’s topography can also be used in the stage preceding data classification for urbanised areas. The image processed in this way may have less contrast, but the details in the image are more visible than in the original image [32]. Due to the elimination of the adverse effect of shading, the classification is improved.
Radiometric correction removes the influence of the atmosphere and converts the pixel brightness value to the value of spectral radiance or reflection coefficient. However, correct and accurate radiometric correction is one of the most significant limitations of remote sensing analyses (Figure 2).
The most crucial stage of radiometric correction is atmospheric correction, which involves transforming the spectral radiance at the upper boundary of the atmosphere to the spectral radiance at the Earth’s surface. This process requires a precise determination of the state of the atmosphere, including the content of gases, aerosols, and dust, which are the source of absorption and scattering in the atmosphere. On this basis, using software that analyses radiation transfer depending on the set parameters, the influence of the atmosphere is modelled; energy transfer models are used here, i.e., RTC (Radiative Transfer Codes). The limitation of electromagnetic radiation transmission, resulting from scattering and absorption in the atmosphere, causes the information about the radiance of objects on the Earth’s surface to be distorted. The recorded radiation value should therefore be “corrected” and simultaneously converted to the dimensionless value of the spectral reflection coefficient. Atmospheric correction can be carried out using two methods: relative and absolute. Absolute methods make it possible to determine the spectral reflection coefficient of radiation, estimated based on the assessment of the state of the atmosphere. For this purpose, the so-called standard models of the types of atmospheres or the amount of radiation scattering are estimated based on the satellite.
On the other hand, relative methods, called empirical methods of atmospheric correction, consist in relating the values recorded in the images to field measurements performed during image registration, while in situ measurements, using spectrometers, spectroradiometers, etc., are performed. Field measurements must be carried out in the same radiation ranges in which remote sensing sensors acquire the image. These methods are used for data obtained from satellite and aerial platforms and for data obtained using sensors mounted on UAVs. Since data obtained from low altitudes (BSL ceiling) are more susceptible to the influence of local conditions than large-scale conditions, the use of absolute methods based on the physical model of the atmosphere for the radiometric calibration of images obtained from low altitudes is not effective.
Mathematical functions or models that describe the conversion of DN values into reflectance values are available for data obtained from satellite or aerial platforms. Still, their availability for sensors mounted on UAV platforms is relatively rarer. Thus, one of the methodologically simplest ways to perform a radiometric correction, and thus to determine spectral reflectance coefficients based on image data obtained from BSL platforms, is to use reflection panels with known spectral characteristics, which would be placed on the scene acquired by the sensor simultaneously with the subject of research. This is necessary to convert the value of each image pixel to a reflectance value. For this, knowledge about the theoretical value of the reflection of the reference panels is used.
A popular relative method is an empirical line (ELC—empirical line correction) method, which uses the radiation values of objects acquired in the image and the values of the reflection coefficient for the same objects obtained from the field measurement, enabling the conversion of the radiation value to the reflectance coefficient using linear regression: R = GainDN + Offset. Based on reference objects for which the reflection coefficient and radiation power values are known; the Gain and Offset values are determined. To correctly carry out the correction with the ELC method, an appropriate set of spectral curves from the image and reference curves from the field measurement should be prepared. These should be spectral curves representing areas with different spectral responses. At least two regions with extreme values of recorded radiation should be selected (e.g., water and apparent white objects). Most researchers usually use two calibration panels (with low reflectance—black, and high reflectance—white) to cover the entire radiometric range of the imaged scene [34,35,36,37,38]. Elements of land cover or natural elements, e.g., spectral characteristics of water, are used as calibration targets [34]. It should be remembered, however, that the calibration panels used must be characterised by Lambertian reflection, and their reflection characteristics should not change over time.
Solar and topographic corrections, which are the radiometric correction steps, are generally solved in a single process (commonly called a topographic correction) since both solar and topographic corrections require both the position of the sun and the topography of the terrain to be considered. These corrections are included in advanced radiometric correction models but are omitted in relative methods due to their complexity. The result of applying topographic and solar correction is the calculated reflectance (coefficient of light reflection from the object) on the surface of the Earth. This correction is necessary for processing low-altitude multispectral images, especially those depicting uneven terrain. Uneven terrain leads to brightness fluctuations between pixels with different topographical features but the same type of surface coverage, so the spectral characteristics of the object can be seriously disturbed, and accurate classification is difficult to achieve.
Traditional topographic correction methods can be divided into three categories: those based on band ratios, those based on Hyperspherical Direction Cosine Transformation (HSDC), and those requiring a digital elevation model (DEM). The first and most straightforward solar and topographic correction methods were based on band ratios. Currently, they are not appropriate due to their low efficiency in relation to later methods. The HSDC approach can dramatically reduce topography’s influence but is ineffective in many multispectral land cover classifications. DEM-based methods are considered the most influential group of methods. They can be grouped into three types: empirical approaches, Lambert methods, and non-Lambertian methods [39], or when using a different division, empirical model, physical model, and semi-empirical model [40]. Empirical models are often inaccurate. Physical models require many parameters and complex calculations. By contrast, semi-empirical models balance some degree of accuracy and complexity. Semi-empirical models are characterised by introducing an additional correction to the physical model. Semi-empirical models include, among others, amendment C [11], amendment SCS + C [14], amendment Minnaert [12], and amendment Minnaert + SCS [41]. The C correction and SCS + C correction models introduce an empirical parameter C for a Lambert surface. The Minnaert and Minnaert + SCS corrections introduce an empirical constant k for a non-Lambert surface [40].
The most popular, and at the same time the simplest, model of topographic correction is the cosine correction model, which considers only the zenith angle of the sun and the distance of the Earth from the sun. Some of its modifications introduce the so-called incidence angle [11,12,13,14,15,16,17] and the C factor, reducing overcorrection [11]. Another popular modification model of the cosine approach is the Sun–Canopy–Sensor (SCS) [32], or the Sun–Crown–Sensor (SCnS), which introduces the normalisation of tree crown surface illumination. These models are recommended mainly for the development of forest areas and may cause excessive correction of areas far from the light source [31]. For example, this effect can be reduced by the SCS + C method [31], which modifies the SCS approach by the addition of the parameter C to the denominator and numerator. Among the non-Lambertian methods, the Minnaert model is the best known. A proper topographic correction method should avoid empirical parameters that are often time- and space-specific and cause inconsistencies in topographically corrected images [42,43]. For this reason, semi-empirical models are most often recommended for topographic correction.
The choice of method depends on the following:
  • The expected quality of the result (simple cosine models are sufficient for rough correction, but semi-empirical models with additional corrections are recommended for more accurate results);
  • The nature of the imaged area and its cover (most of the studies concern the correction of areas covered with vegetation, and here models based on SCS are most often recommended, but for other types of land cover the effectiveness of other topographic correction models should be tested);
  • Technical conditions.
Topographic correction models have different complexities. Empiric models are simple and quick to calculate. Physical models are more complicated. Semi-empirical models are a kind of compromise between complexity and efficiency. In addition, when choosing a topographic correction method, the availability of specialised software or the possibility of self-implementation of the selected method should be considered.
Most methods of topographic correction require knowledge of the incident angle i. This angle can be determined based on the knowledge of the position of the sun and DEM. The cosine of this angle is calculated as follows:
cos i = cos θ cos α + sin θ sin α cos ( A s A r )
where Ar is the surface aspect and As is the solar azimuth angle. The surface aspect is the topographical azimuth, which specifies the direction in which the slope is facing. The values of each cell in the DMT indicate the direction the surface is facing at that location. It is generally measured clockwise in degrees from 0 (north) to 360. Flat areas with no downward direction are assigned a value of −1 in some algorithms. Parameters α and Ar are obtained from DEM and calculated according to the relationships described in [44,45,46].
The described methods are not universal, hence the multitude of them. They cannot always be applied to multispectral data either. Thus, in the next section, attempts were made to develop a new methodology for radiometric correction based on previous research and experience, as well as experiments conducted by the authors of this article.

1.2. Research Purpose

This article reviews the methods of topographic correction of multispectral images. Moreover, it presents a new radiometric correction method for multispectral images obtained from a low altitude, considering the impact of the radiometric calibration of the imaging sensor (build-up methods) using various methods and terrain height differences and slopes. The topographic correction of low-altitude images should be one of the final stages of the overall radiometric correction of multispectral images. The effectiveness of the proposed image processing method was verified based on two independent test sets.
Commonly used radiometric methods for UAV data are quite simple and easy to use; however, they are based only on flight parameters and DEM and reference panels used for camera radiometric calibration at the beginning of the flight. Therefore, the results are not very accurate for different land cover types, such as vegetation and artificial surfaces, especially when flight is conducted in different light conditions. Our new method is based not only on such parameters, but we also consider different land cover types. However, for now it can be only used for the full vegetation season.
This research aimed to develop a radiometric correction of images from the low-altitude method, considering the influence of the sun’s zenith angle (geometry of illumination) and the elevation of the terrain (slope and aspect of terrain). Our radiometric correction method is based on a modified empirical line correction method. The article presents the UAV image topographic correction methodology, the proposed radiometric correction results, and an accuracy analysis based on reference image data.
The paper is structured as follows: Section 1 presents the review of radiometric correction methods and Section 2 introduces the test data and materials. In Section 3, the research method is explained. Section 4 presents the experimental results, Section 5 is the discussion, and finally, Section 6 summarises this work.

2. Materials

This section presents the equipment used in the research—the UAV platform, a multispectral camera, and a spectroradiometer used to obtain reference data.

2.1. UAV Platform

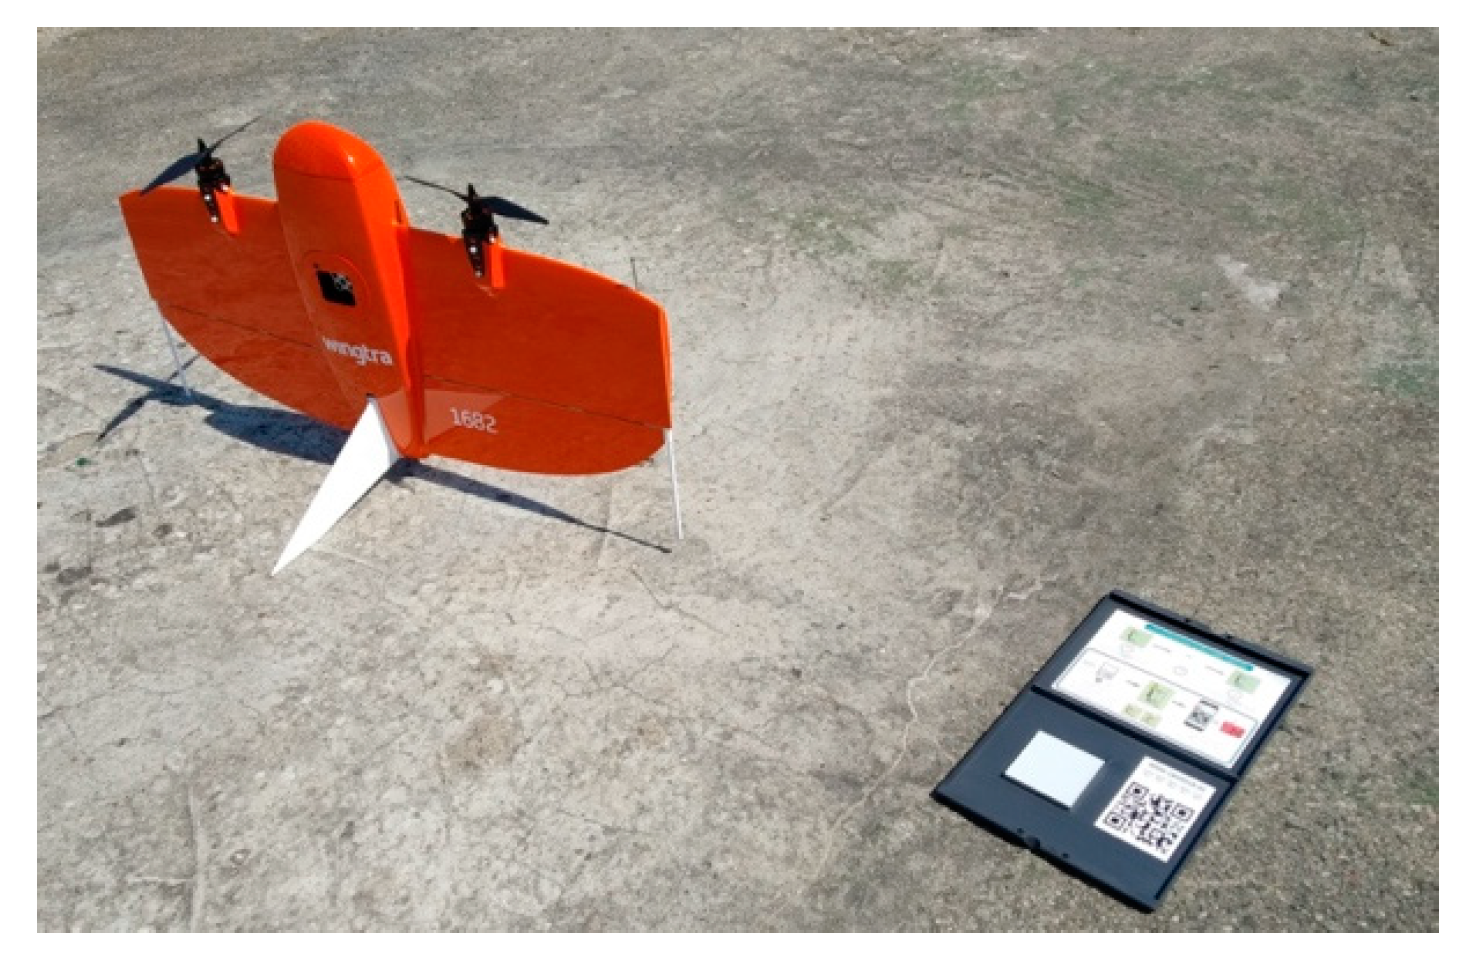
The multispectral data acquired by a Micasense Altum Camera placed on the Tailsitter unmanned platform were used for the research analysis. The flying platform had a single-frequency GNSS receiver, recording data at 10 Hz. The Tailsitter platform is a type of VTOL aircraft Wingtra AG. The general characteristics of the UAV platform include a capacity of 800 g payload, a wingspan of 1.25 m, an empty weight of 3.6 kg, and a max take-off weight of 4.4 kg. The Tailsitter platform model is presented in Figure 3.

2.2. Multispectral Camera

The MicaSense Altum camera was used to acquire multispectral images. MicaSense Altum is an innovative sensor that combines a multispectral and thermal imaging camera. The 2-in-1 solution enables simultaneous image recording in five channels: blue, green, red, red edge, near-infrared (NIR), and a thermal image (8–14 µum) (Figure 4). The shutter of the sensors is triggered simultaneously, which means that the images are recorded synchronously. The obtained data are quickly and easily processed into digital maps thanks to photo geotagging. The five high-resolution lenses in the MicaSense Altum produce detailed images of the vegetation index or soil moisture with a 0.04 m ground pixel and accurate digital models of the terrain surface from a height of 120 m.
The data were obtained as part of the research so that the multispectral data’s field pixel (GSD) size was not greater than 0.10 m.

2.3. Spectroradiometer

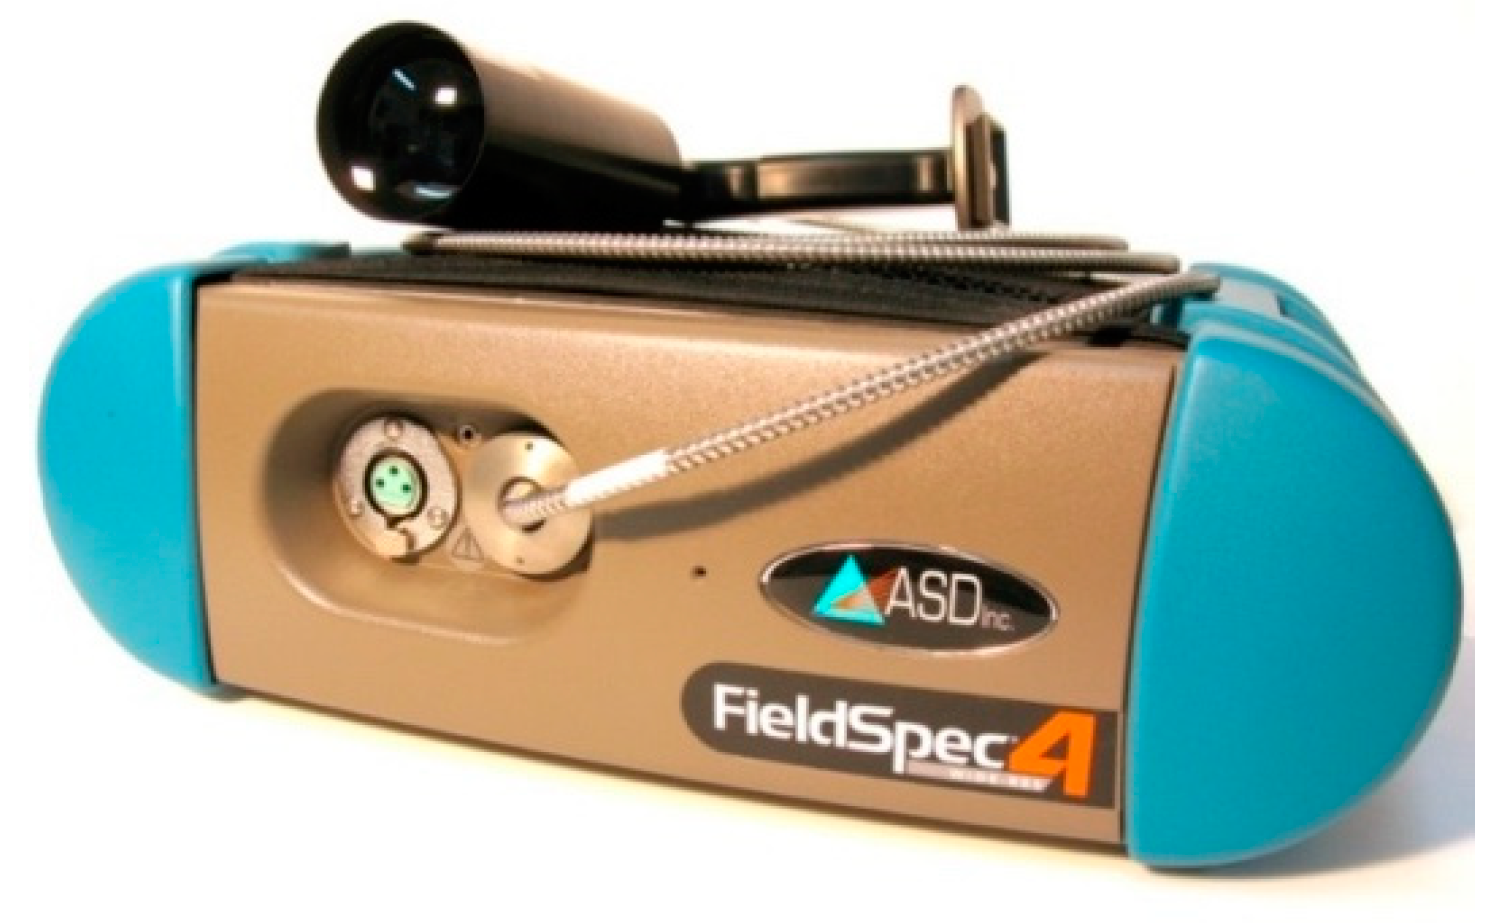
Another device used in the research was the FieldSpec 4 Wide-Res spectroradiometer.
The FieldSpec 4 Wide-Res spectroradiometer records radiation in the range of 350–2500 nm (Figure 4). The radiation range of 350–1000 nm is obtained using a system of 512 silicon photodiodes with a sampling density of 1.4 nm. Two detectors were built to record short-wave infrared, i.e., SWIR 1 (1001–1800 nm) and SWIR 2 (1801–2500 nm). These detectors consist of a concave holographic grid and an InGaAs photodiode that is thermoelectrically cooled. Measurements in the VNIR range were performed in parallel, while in the short-wave infrared, consecutively. It is possible to record 600 channels by each SWIR detector. The spectral resolutions for wavelengths of 700 nm, 1400 nm, and 2100 nm are 3 nm, 30 nm, and 30 nm, respectively [46,47].
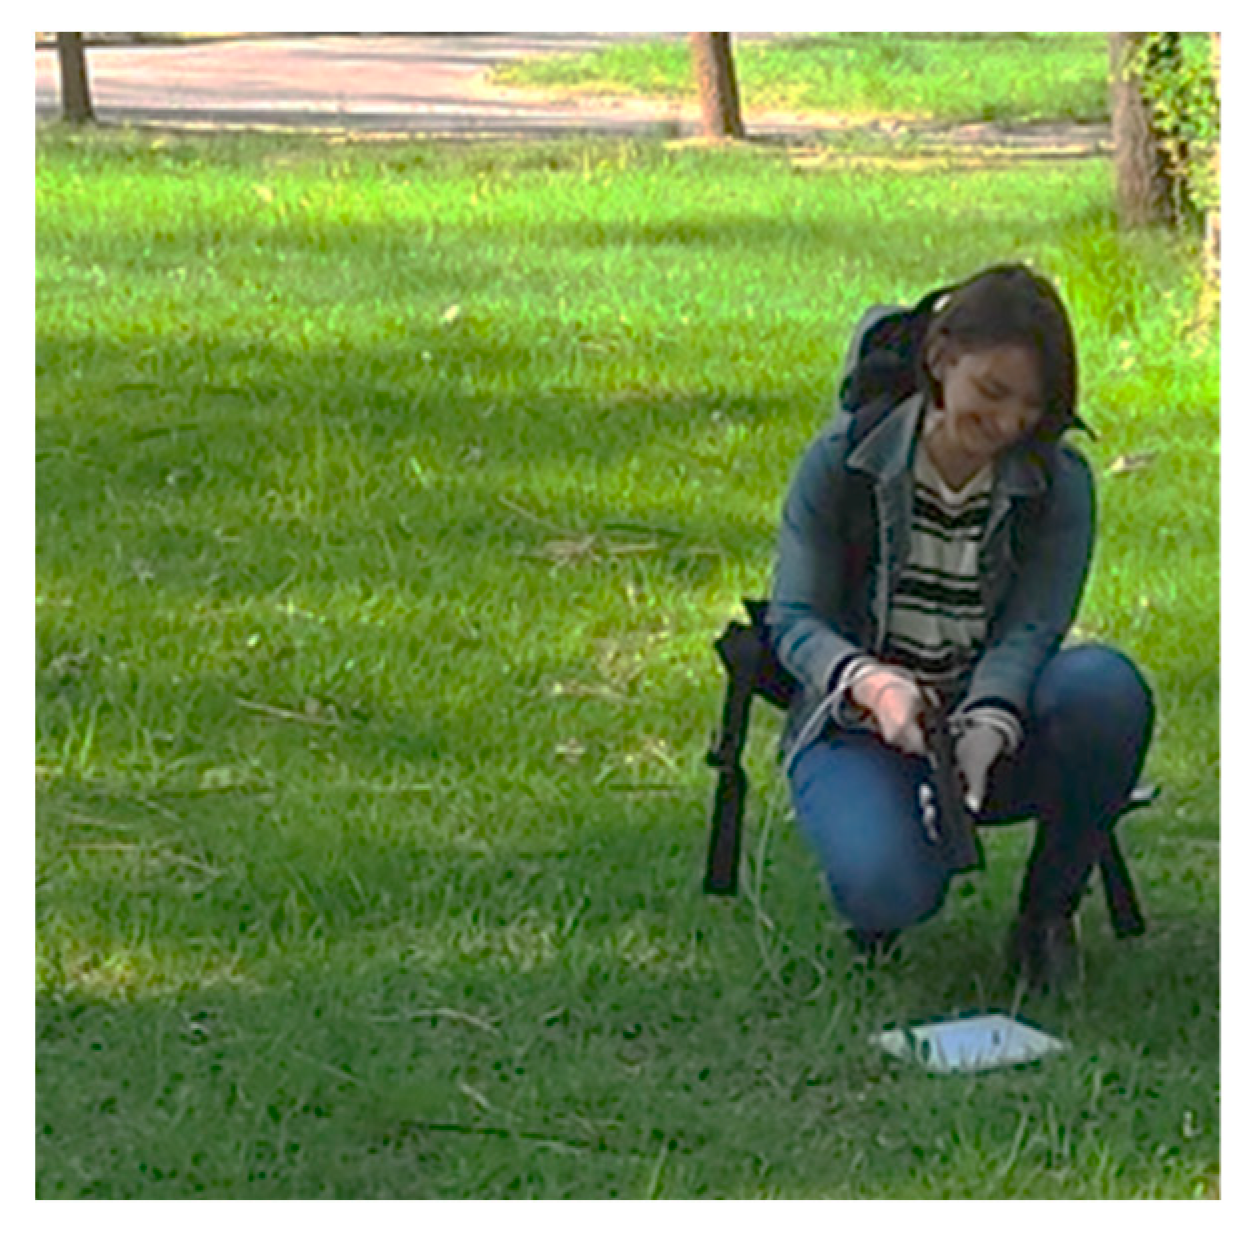
Spectroradiometer data were obtained using a 1° probe or a plant probe. Spectral information was obtained with a frequency of ten measurements per measurement. Additionally, the results were averaged from 20 measurements. Before each measurement, a calibration was performed based on a reflectance standard of 95%.
The spectroradiometer was calibrated using the Zenith Lite SG3151 reflection standard with dimensions of 200 nm × 200 nm × 11 mm, which in the radiation range of 250–2500 nm provides a Lambertian reflection of 95%.

2.4. Area of Interest

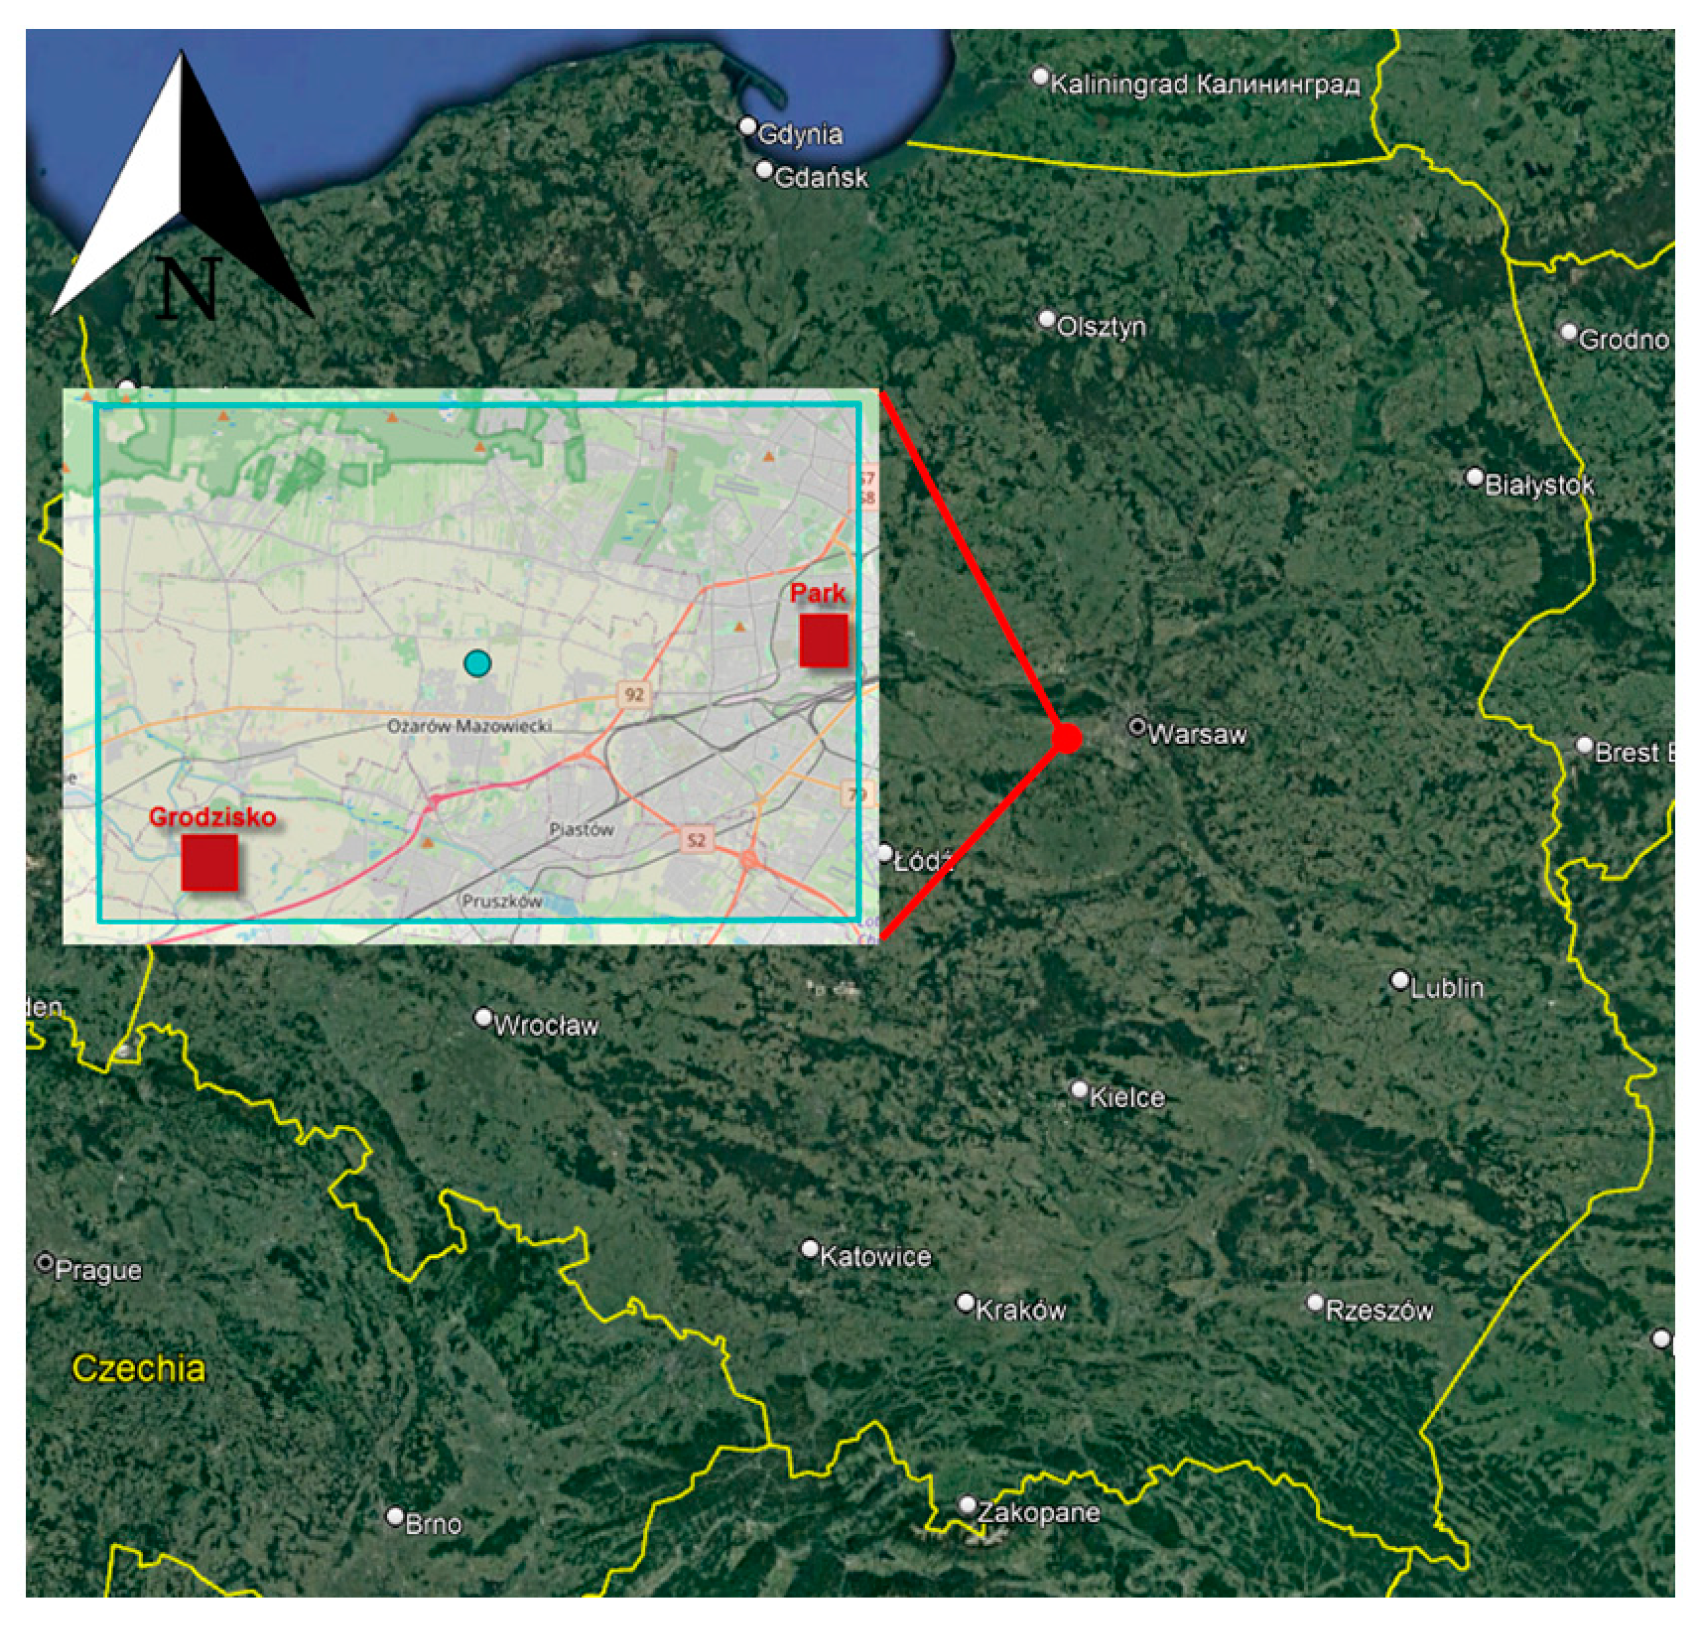
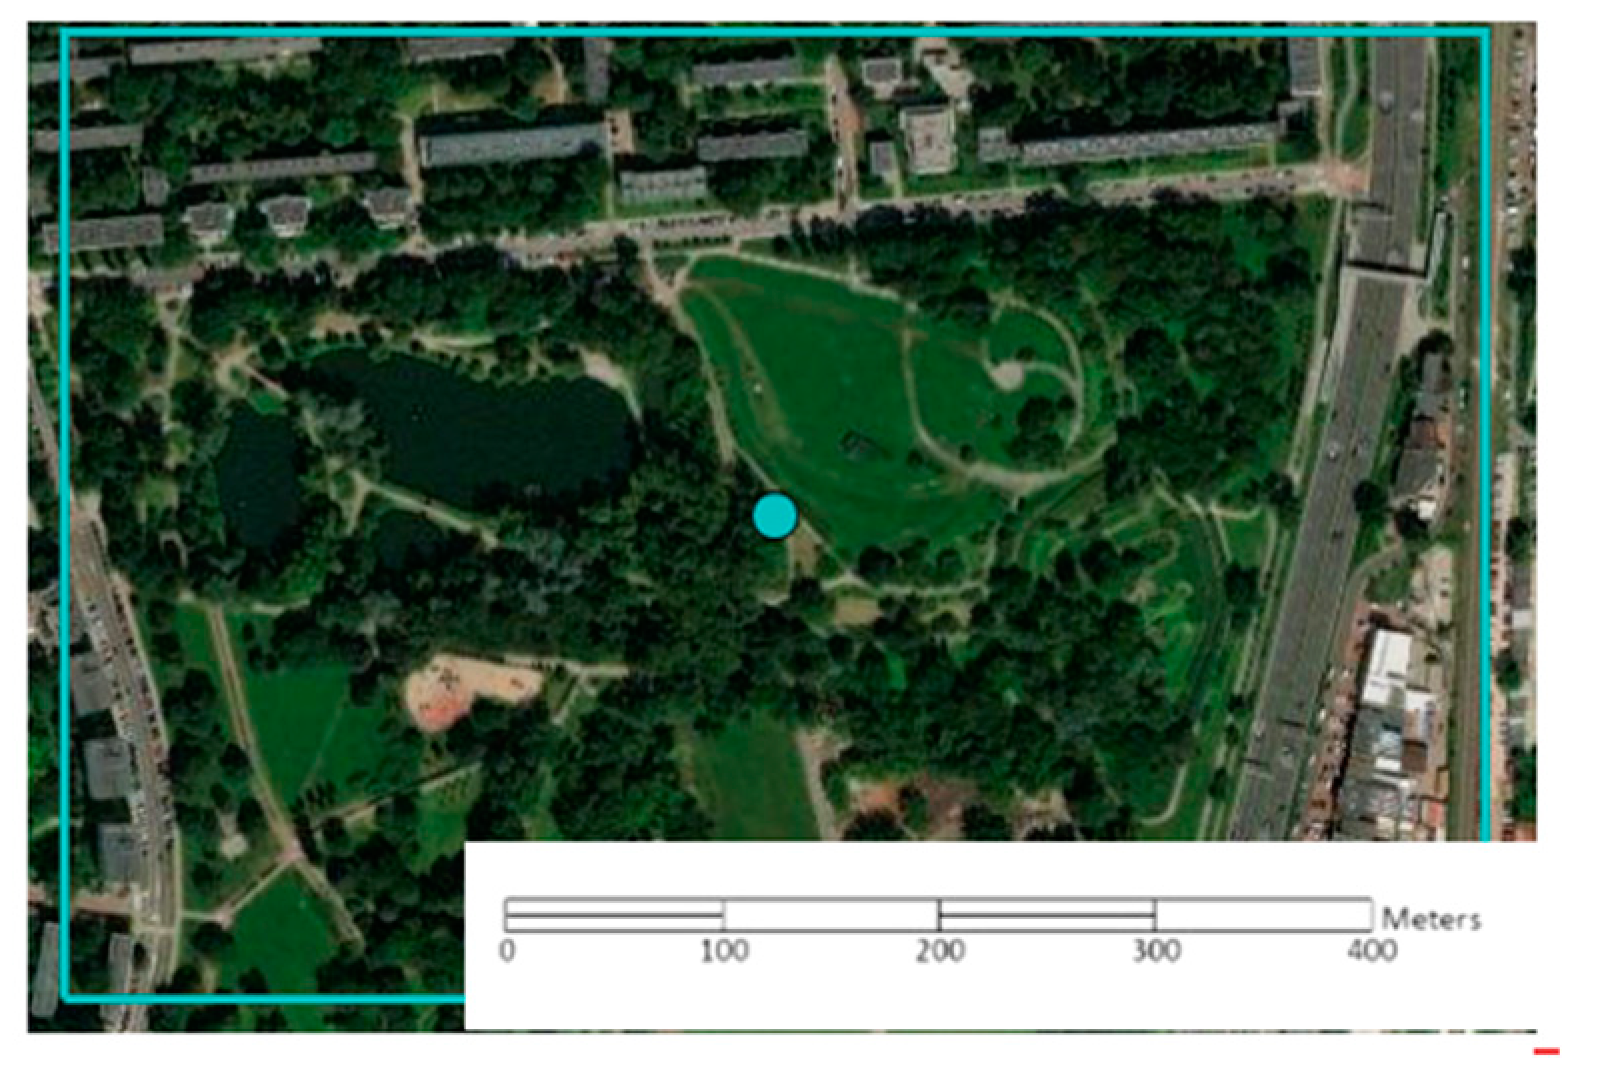
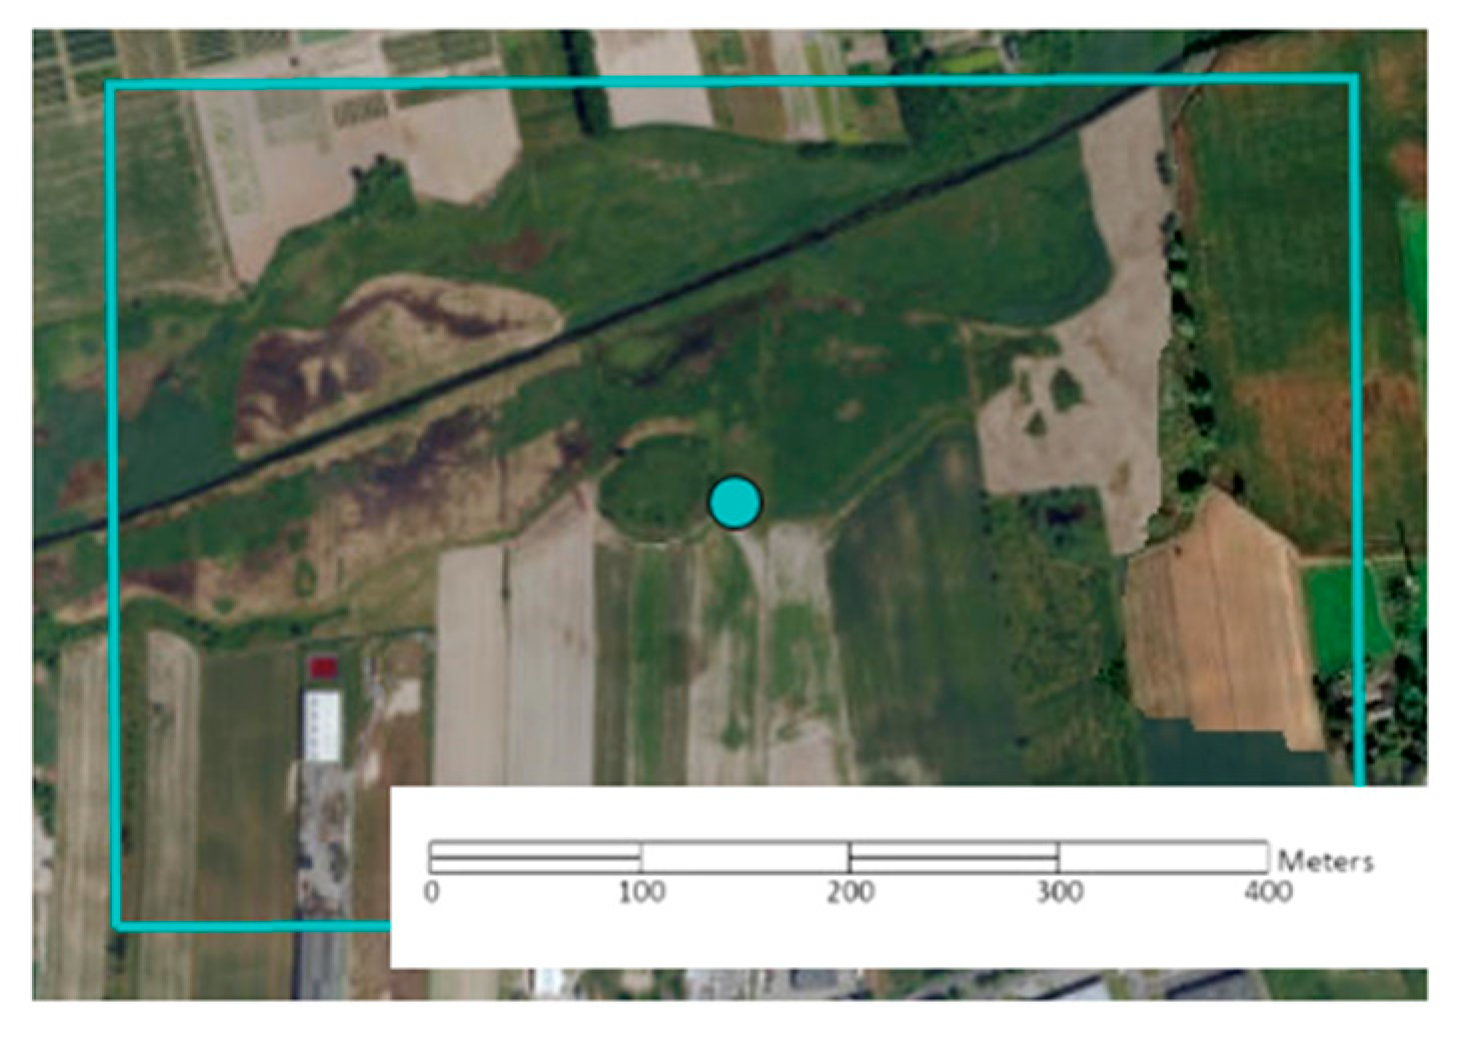
Image data were obtained during air raids for two areas referred to as “Park” and “Grodzisko” (Figure 5). As in the research conducted by [48], the focus was on the area of Poland.
The test “Park” area is in the centre of the capital city of Warsaw and includes the area of the “Moczydło” city park. The park area has height differences and water reservoirs, vegetation, i.e., grass, bushes, and trees (Figure 6).
The “Grodzisko” test site area is much more diverse in terms of height (there are more significant ground elevations) in relation to the “Park” area (Figure 7). The acquired photos covered a fragment of the hill with a part of the flat area (southern part) and the area with compact buildings (northern part). The test area at the time of the UAV flight was covered with low grass vegetation. The buildings in the north part of the study area are characterised by a low degree of urbanisation. There are single-family houses, roads, and technical infrastructure; single trees, shrubs, and grassy vegetation prevail.

3. Research Method

Image data were acquired in June 2021. The choice of measurement period was selected based on the prevailing meteorological conditions and the degree of vegetation development. The weather conditions in June 2021 made it possible to obtain data at a low wind speed of 5 m/s, guaranteeing flight stability and air humidity below 30%. Thanks to this, it was possible to eliminate noise in the infrared channels. In addition, in 2021, the vegetation was in full bloom due to the growing season and the prevailing weather conditions, especially the level of precipitation and air temperature.
The areas where the research was carried out allowed data to be obtained for areas without vegetation, thus simulating the situation in winter, when the vegetation dies.
Photogrammetric flights were carried out for the two presented test areas. In Table 1, the technical information about the flights is presented.
Before acquiring multispectral images, a pre-flight calibration was carried out for each research area based on the reference panel supplied by the camera manufacturer. This step adjusted the camera acquisition parameters to the prevailing flight conditions. Moreover, it allowed information to be obtained on the irradiation value, which can be used for radiometric correction. During the flight, MicaSense Altum registered irradiation and changes in incidence angle. To verify the accuracy of the products resulting from processing image data from the UAV, GPS measurements were carried out for 10 points for each test area.

3.1. Radiometric Correction

The purpose of radiometric correction is to remove systematic errors and variations in the intensity values of the image pixels that may be introduced during image acquisition, transmission, and storage. The goal is to obtain an image with accurate and consistent radiometry, i.e., the relationship between the digital values of the image pixels and the true reflectance of the scene being imaged. Several radiometric correction techniques can be applied to UAV multispectral images.
The most crucial stage of radiometric correction is atmospheric correction, which involves transforming the spectral radiance at the height of the UAV platform to the spectral radiance at the Earth’s surface. This process requires a precise determination of the state of the atmosphere, including the content of gases, aerosols, and dust, which are the source of absorption and scattering in the atmosphere. On this basis, using programs that analyse radiation transfer depending on the set parameters, the influence of the atmosphere is modelled; energy transfer models are used here, i.e., RTC (Radiative Transfer Codes) [49]. The limitation of the transmission of electromagnetic radiation resulting from scattering and absorption in the atmosphere causes the information about the radiance of objects on the Earth’s surface to be distorted, so the acquired radiation value should be “corrected” and, at the same time, converted to the dimensionless value of the spectral reflectance coefficient. Atmospheric correction can be performed using relative and absolute methods [50]. Fundamental techniques make it possible to determine the spectral reflection coefficient of radiation, estimated based on the assessment of the state of the atmosphere. For this purpose, the so-called standard models of atmospheric types or the size of radiant energy are estimated based on satellite data.
On the other hand, relative methods, called empirical methods of atmospheric correction, consist in relating the values acquired in the images to field measurements performed during image registration using spectrometers, spectroradiometers, etc. Field measurements must be carried out in the same radiation ranges in which remote sensing sensors record the image. These methods are used for data obtained from satellite and airborne altitudes and for data obtained using sensors mounted on UAVs. Since data obtained from low altitudes are more susceptible to the influence of local conditions than to large-scale conditions, the use of absolute methods based on the physical model of the atmosphere for the radiometric calibration of images obtained from low altitudes is not effective [51]. Among the relative methods, the ELC method is distinguished. The method assumes that the intensity values of a set of well-calibrated pixels in the image can be used to model the relationship between the digital values and the true reflectance of the scene. The method fits a linear regression model to the data, using the calibrated pixels as a reference [45]. The regression model parameters are then used to correct the intensity values of the remaining pixels in the image. The empirical linear radiometric correction method is simple and fast. The technique can help correct the effects of sensor drift, vignetting, and other sources of radiometric non-uniformity in the image [35]. In our experiments, we used the reflectance data from in situ spectroradiometer measurements of reference panels to establish the linear relationship between DN value and the reflectance of images. Based on this, it was possible to transform a digital number (DN) into surface reflectance (R):
R λ = D N λ × G a i n λ + O f f s e t λ
where
λ—is the band wavelength of the Micasense Altum camera;
Rλ—surface reflectance;
DNλ—digital number of a pixel at wavelength;
Gainλ—gain at wavelength;
Offsetλ—bias at wavelength.
On the area of each test area, reflection panels were placed (on a flat surface); there were four reference panels (Figure 8). These followed reflectance standards: Zenith Polymer Reflectance Standards, 50 cm × 50 cm in size, characterised by low (from about 5%) and high (up to about 95%) reflectance coefficients. All used standards provided Lambertian reflection.

3.2. Data Processing—Generate DSM, DEM, and Orthomosaic

More than 400 photos were obtained for each flight, for which information about the projection centre and information about irradiation was recorded. Based on the registered metadata in Pix4D software, it was possible to generate orthomosaics, digital surface models (DSM), and digital elevation models (DEM) for each test site.
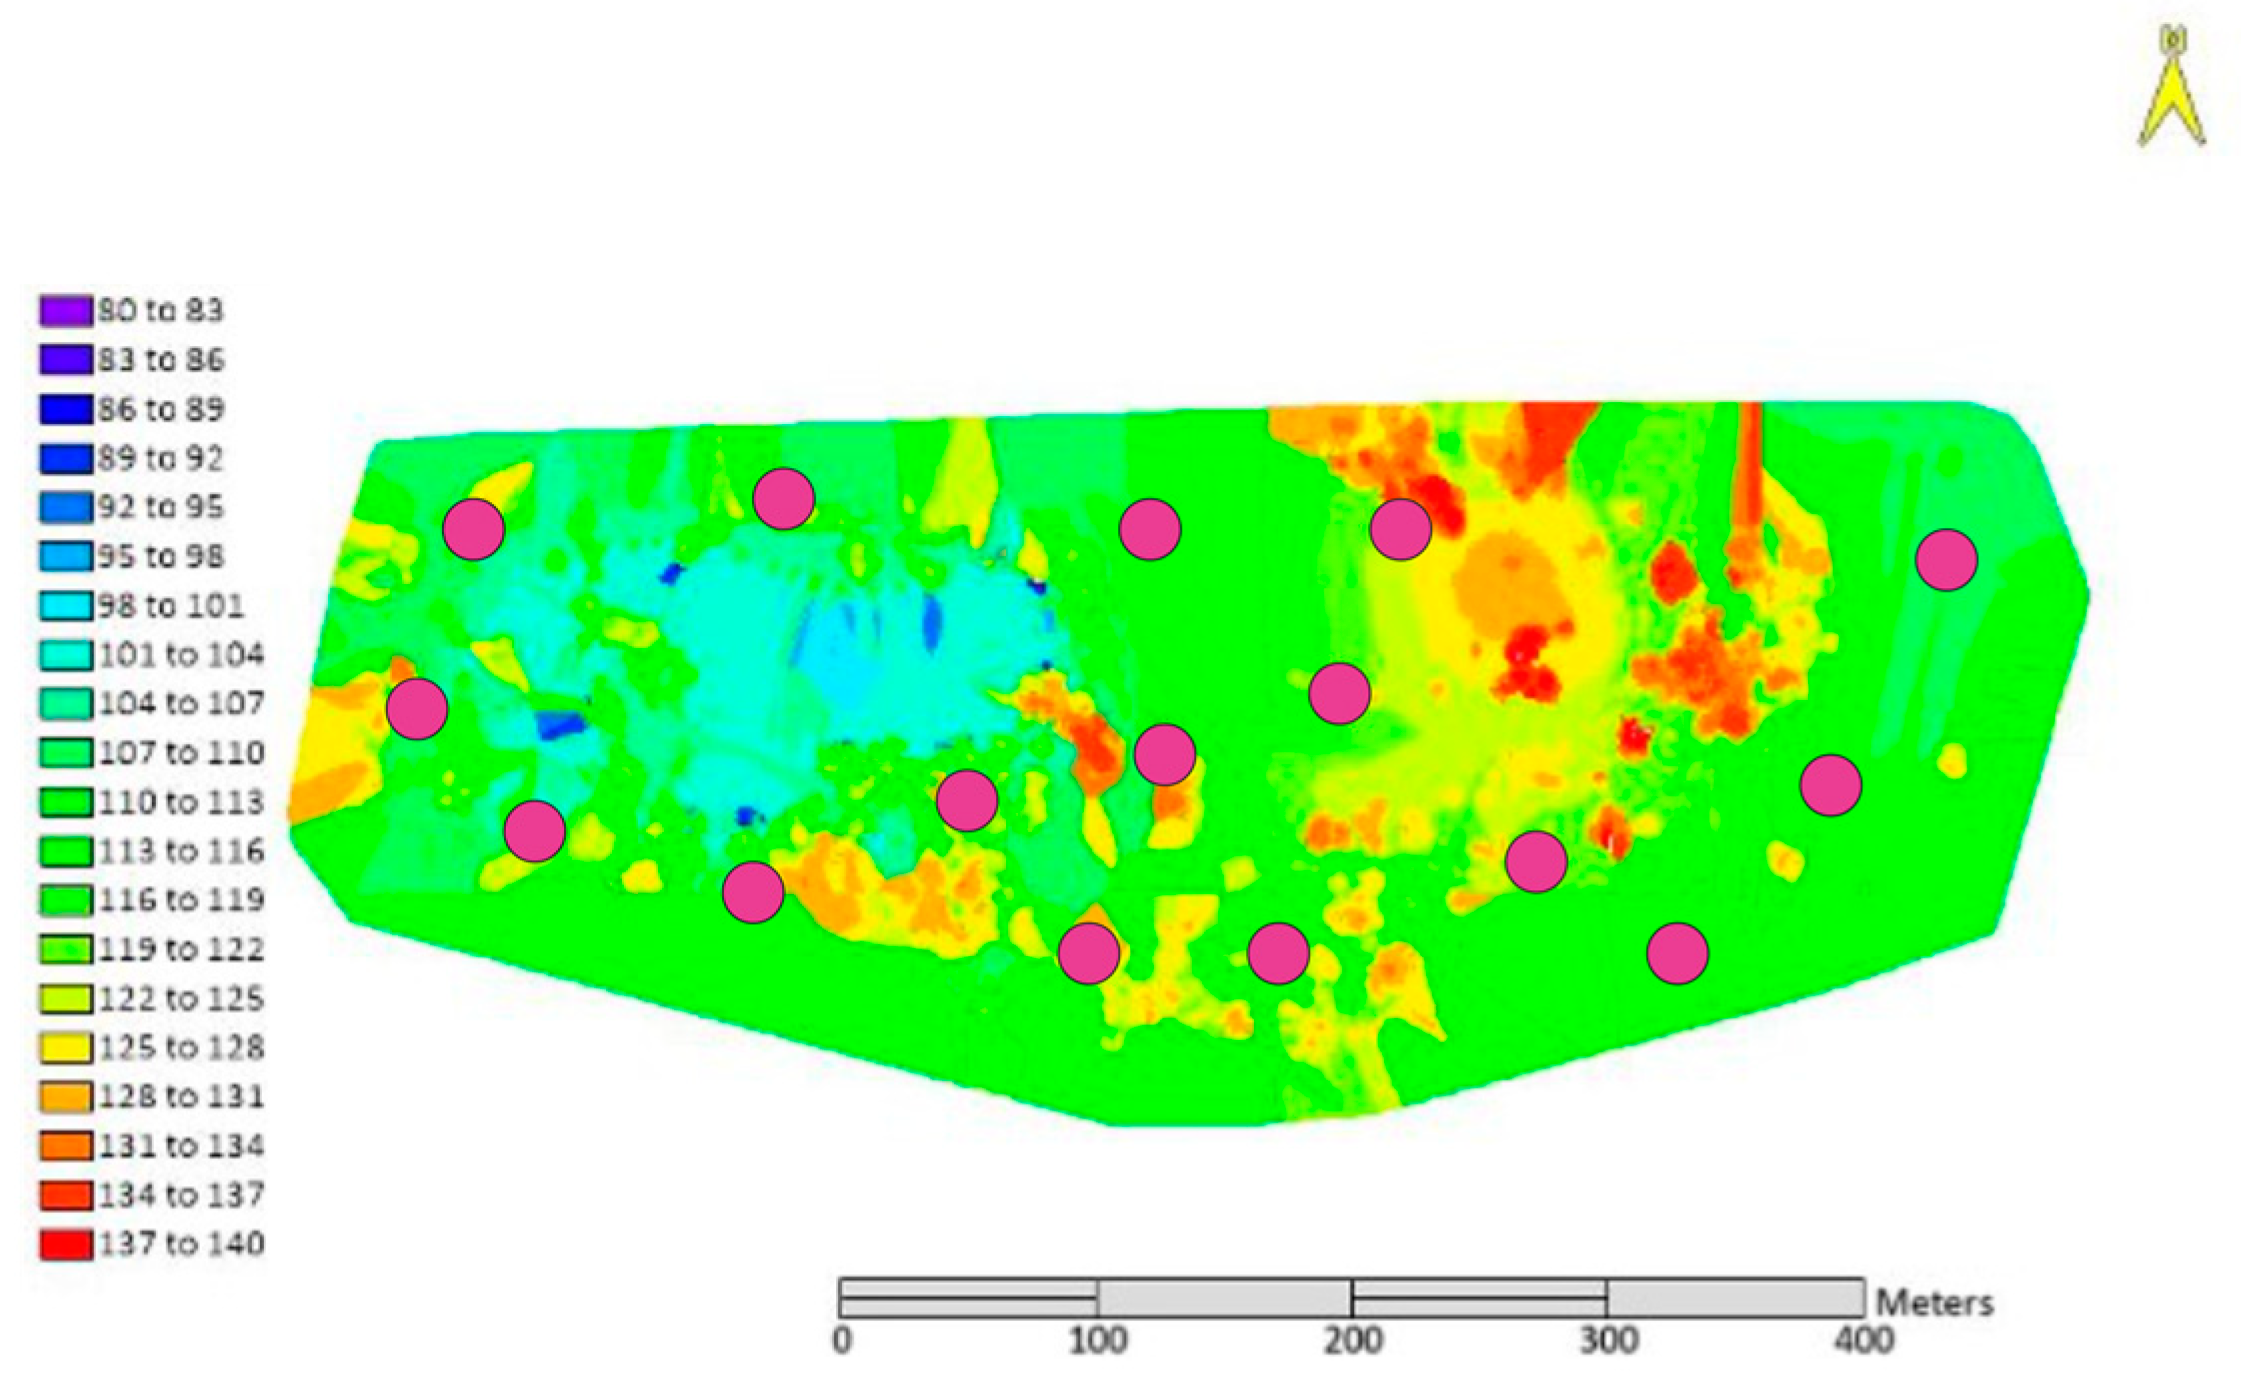
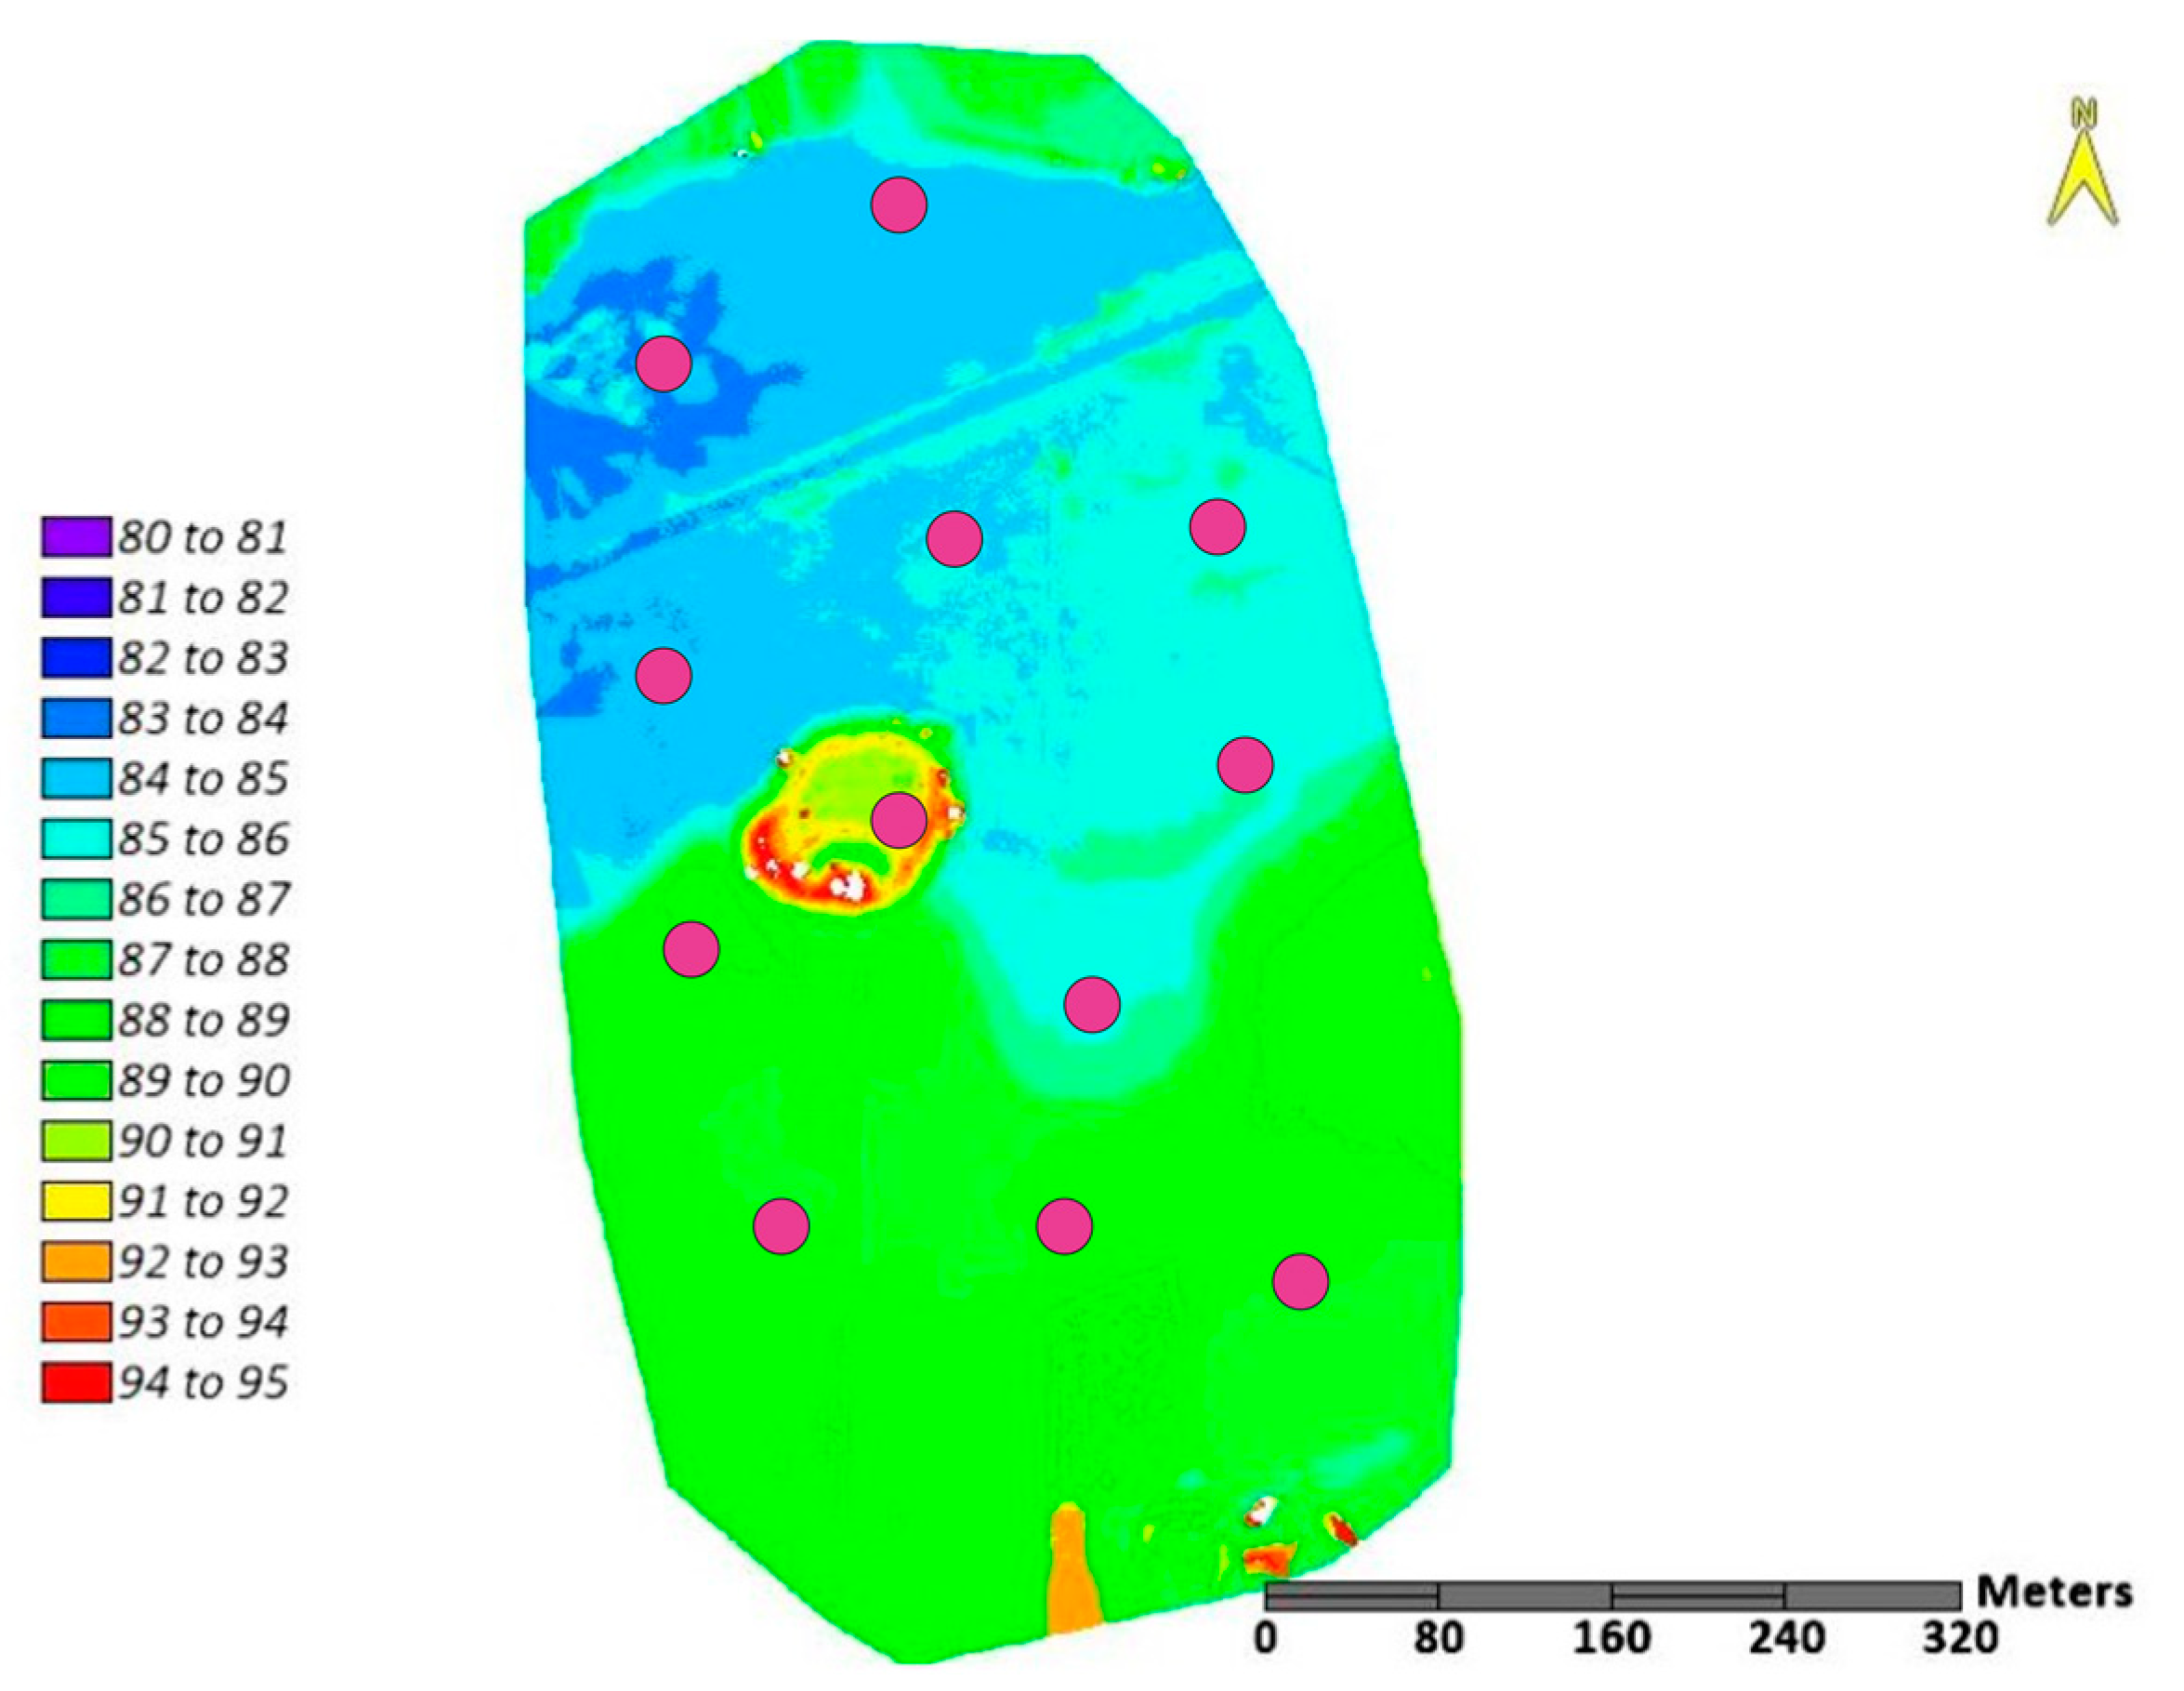
The results are shown in the figures below. The position accuracy for the orthomosaics did not exceed 0.10 m (X, Y) and 0.10 m (Z). During DEM generation, products with a spatial resolution of 10 cm were obtained—shown in Figure 9 and Figure 10 for both test sides. GPS measurements were used to evaluate the results. Measurements were performed for ten field objects—no marked points were used.
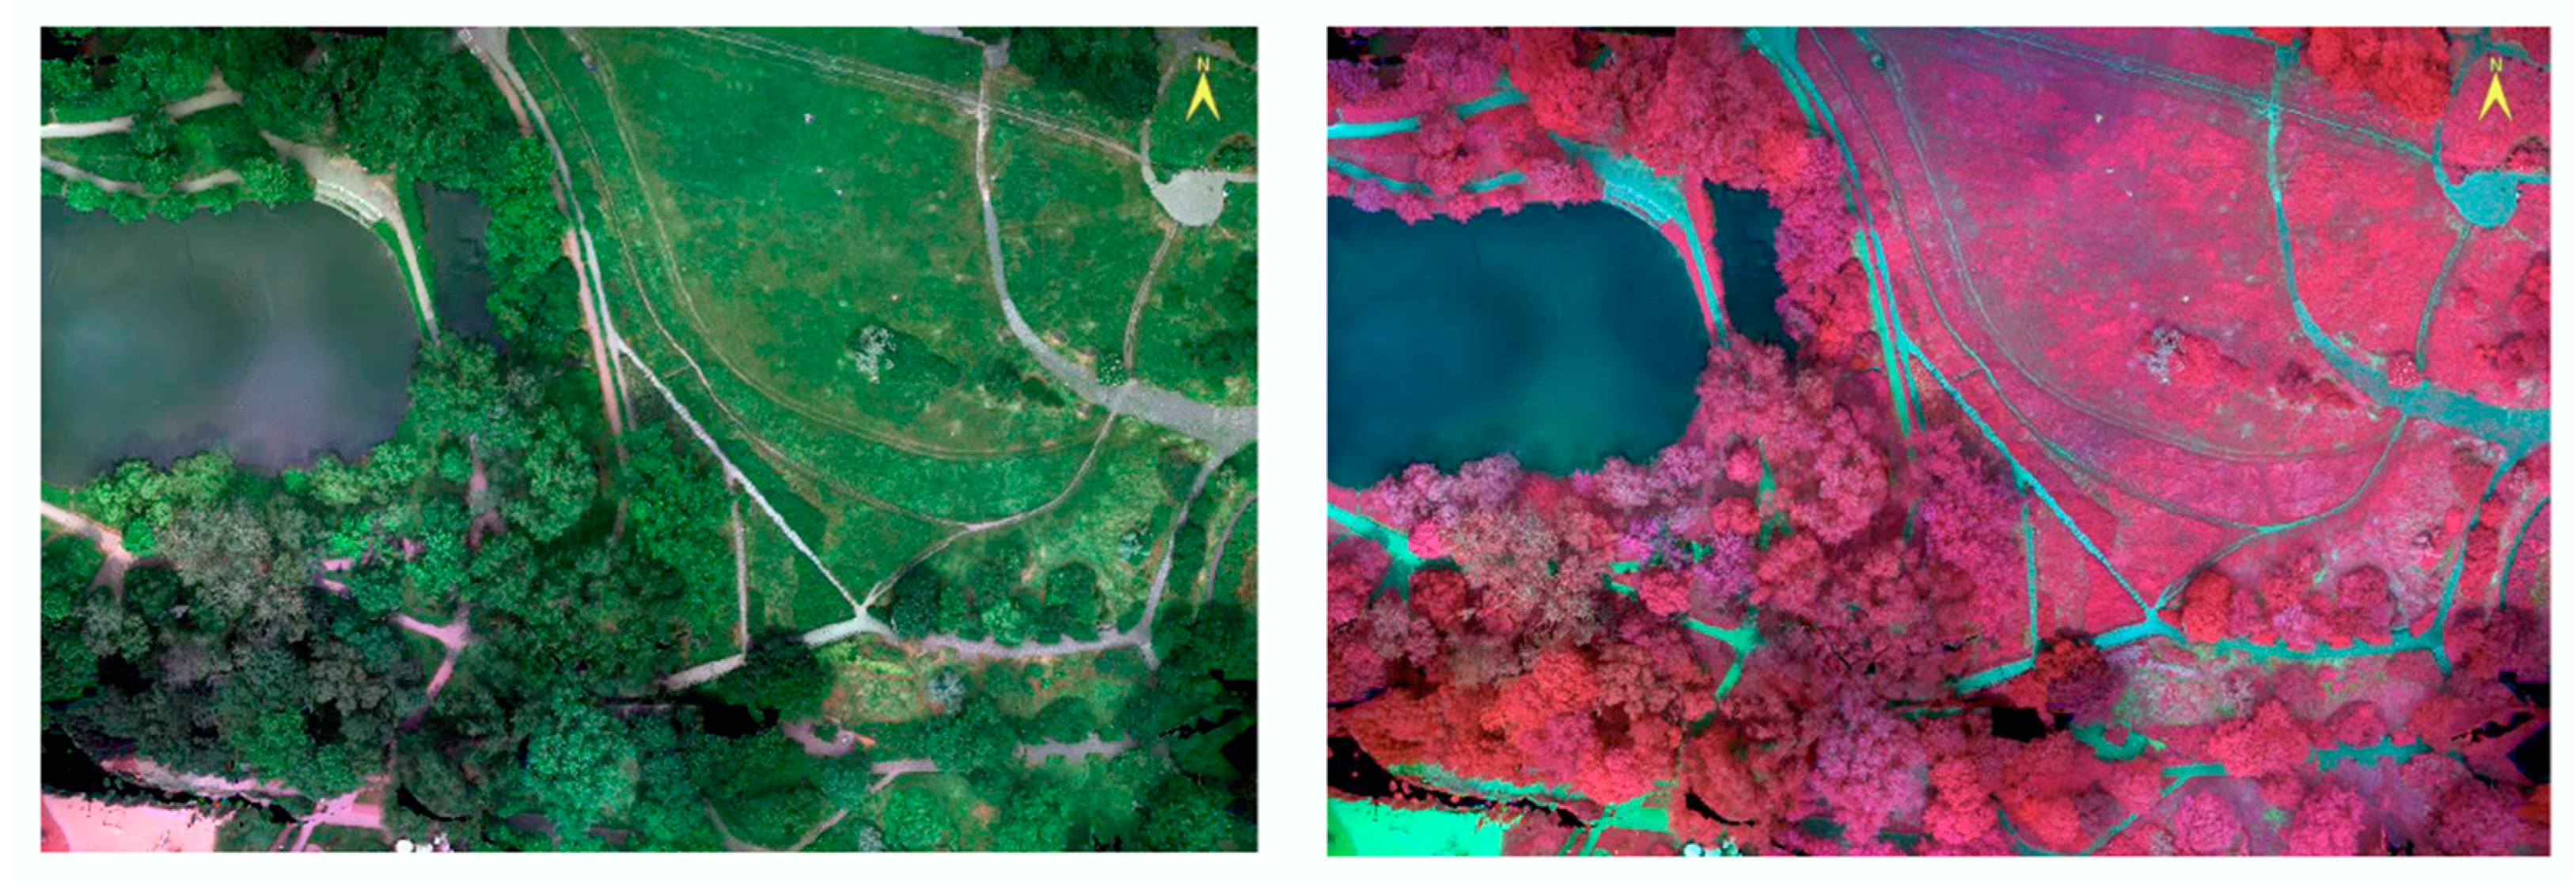
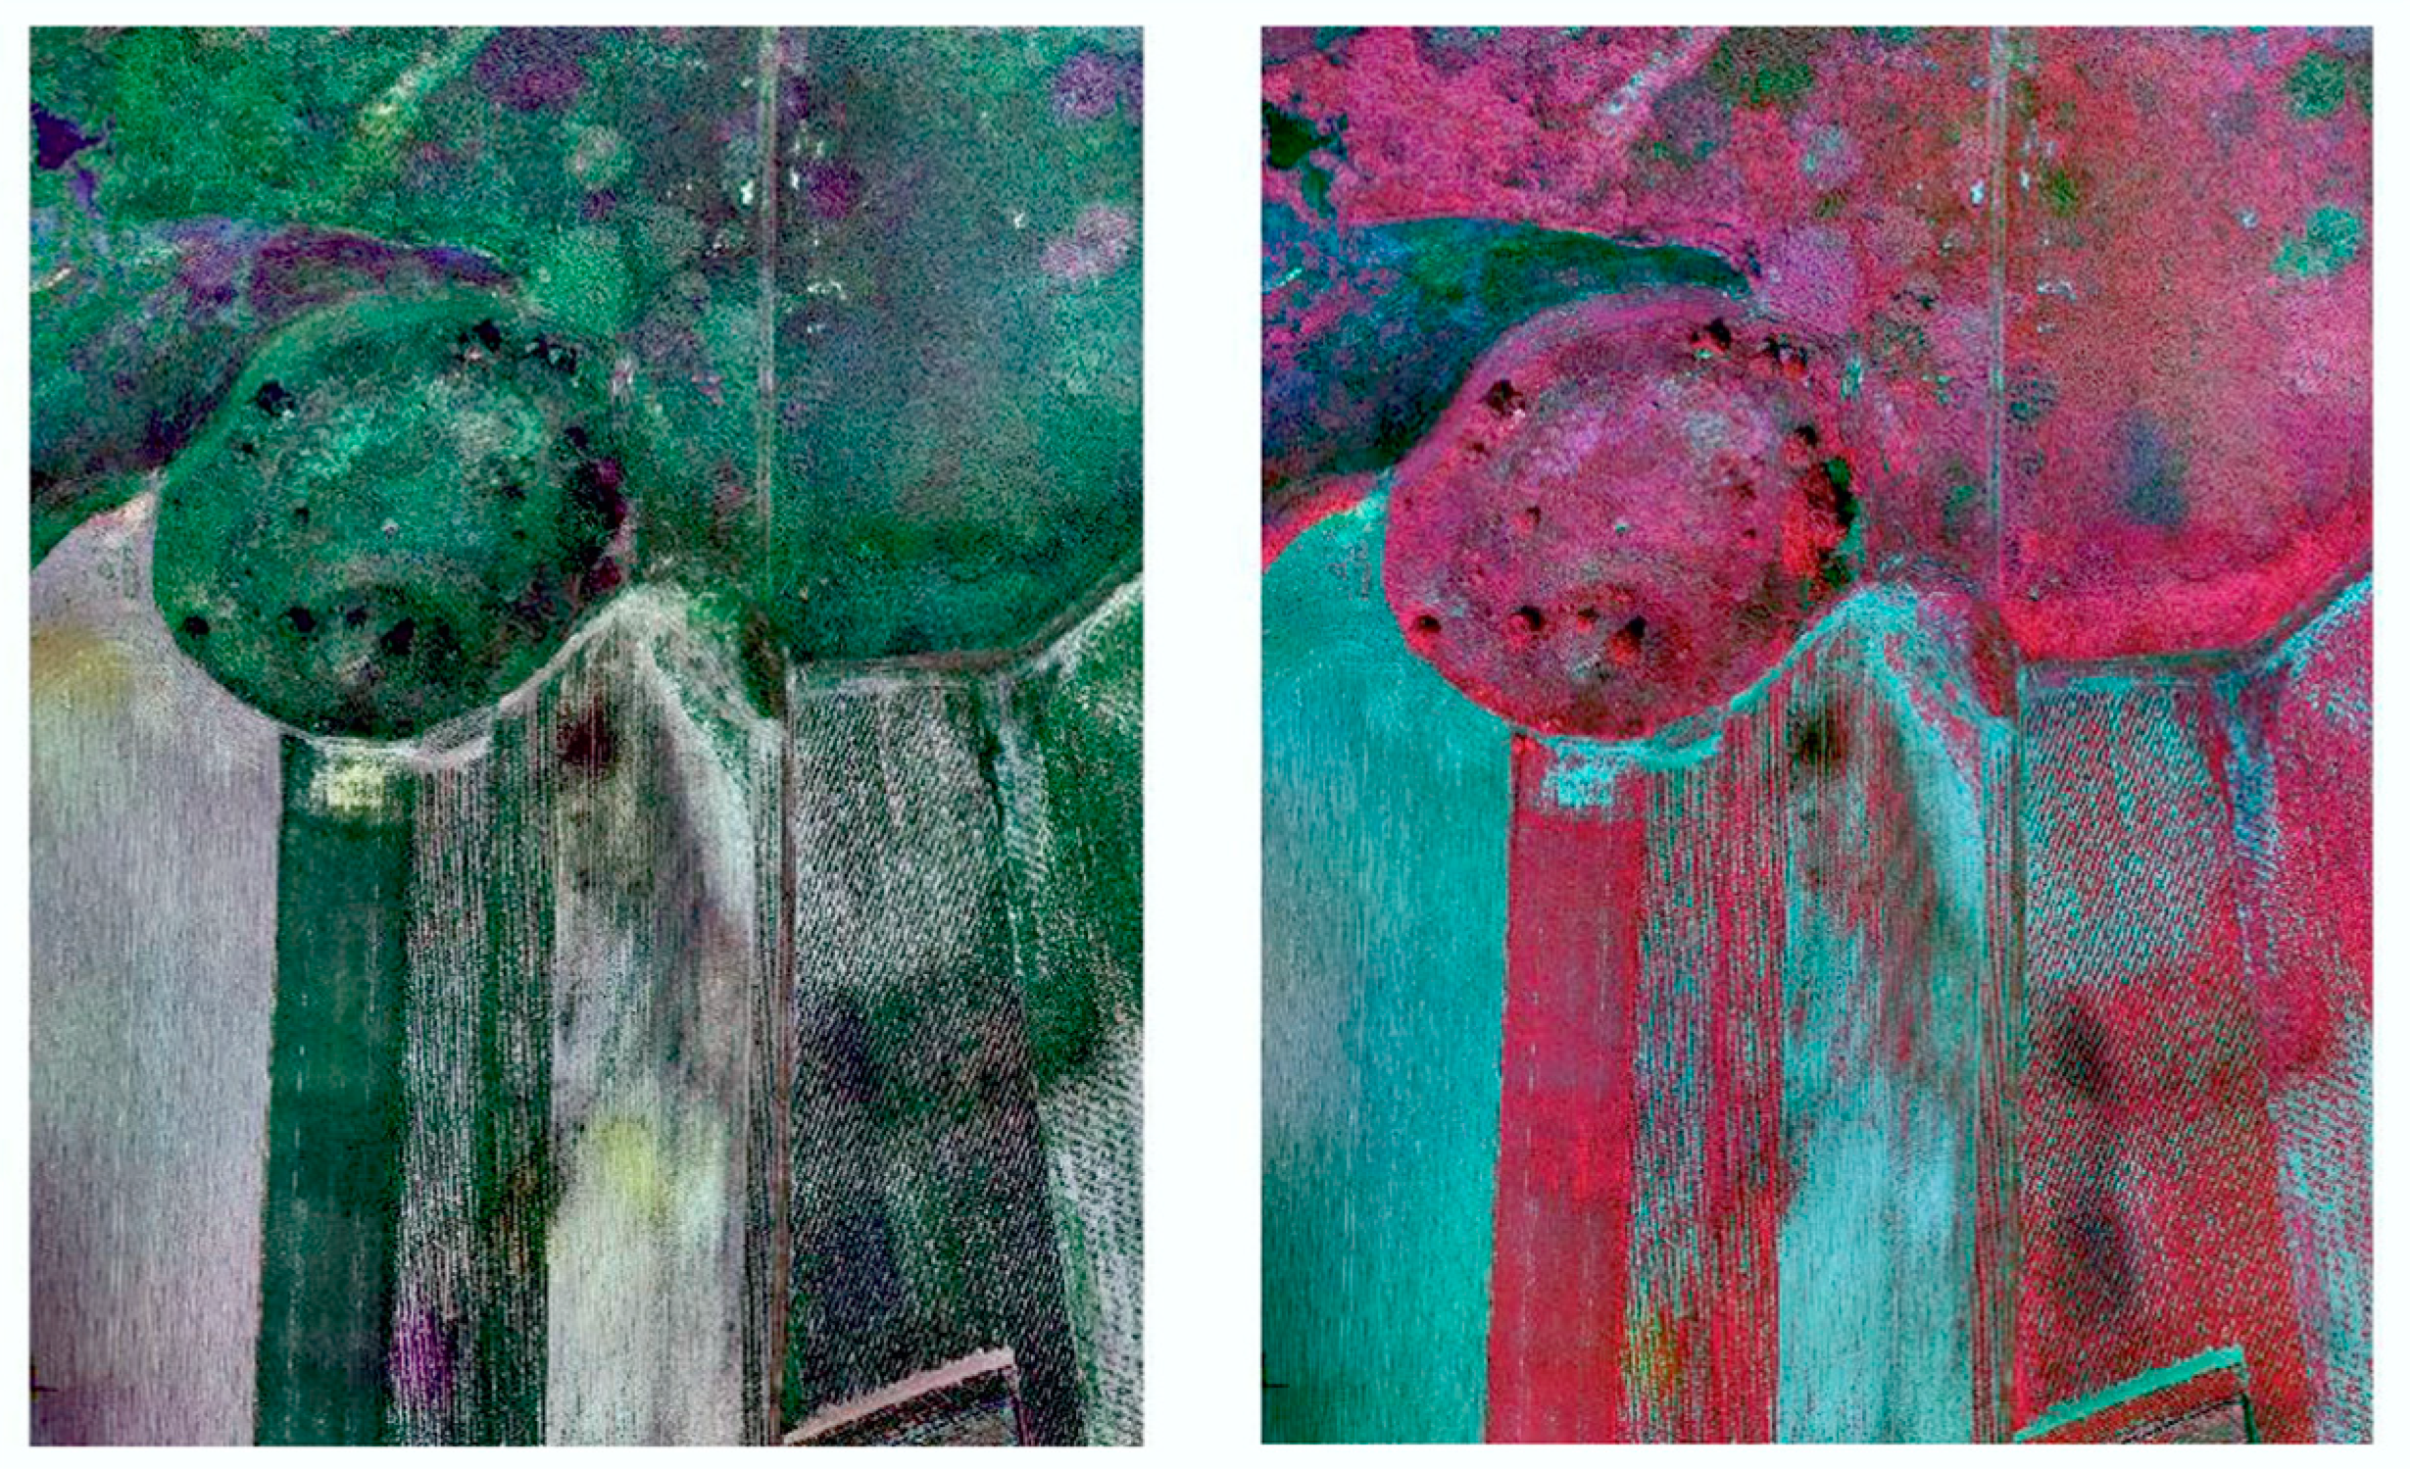
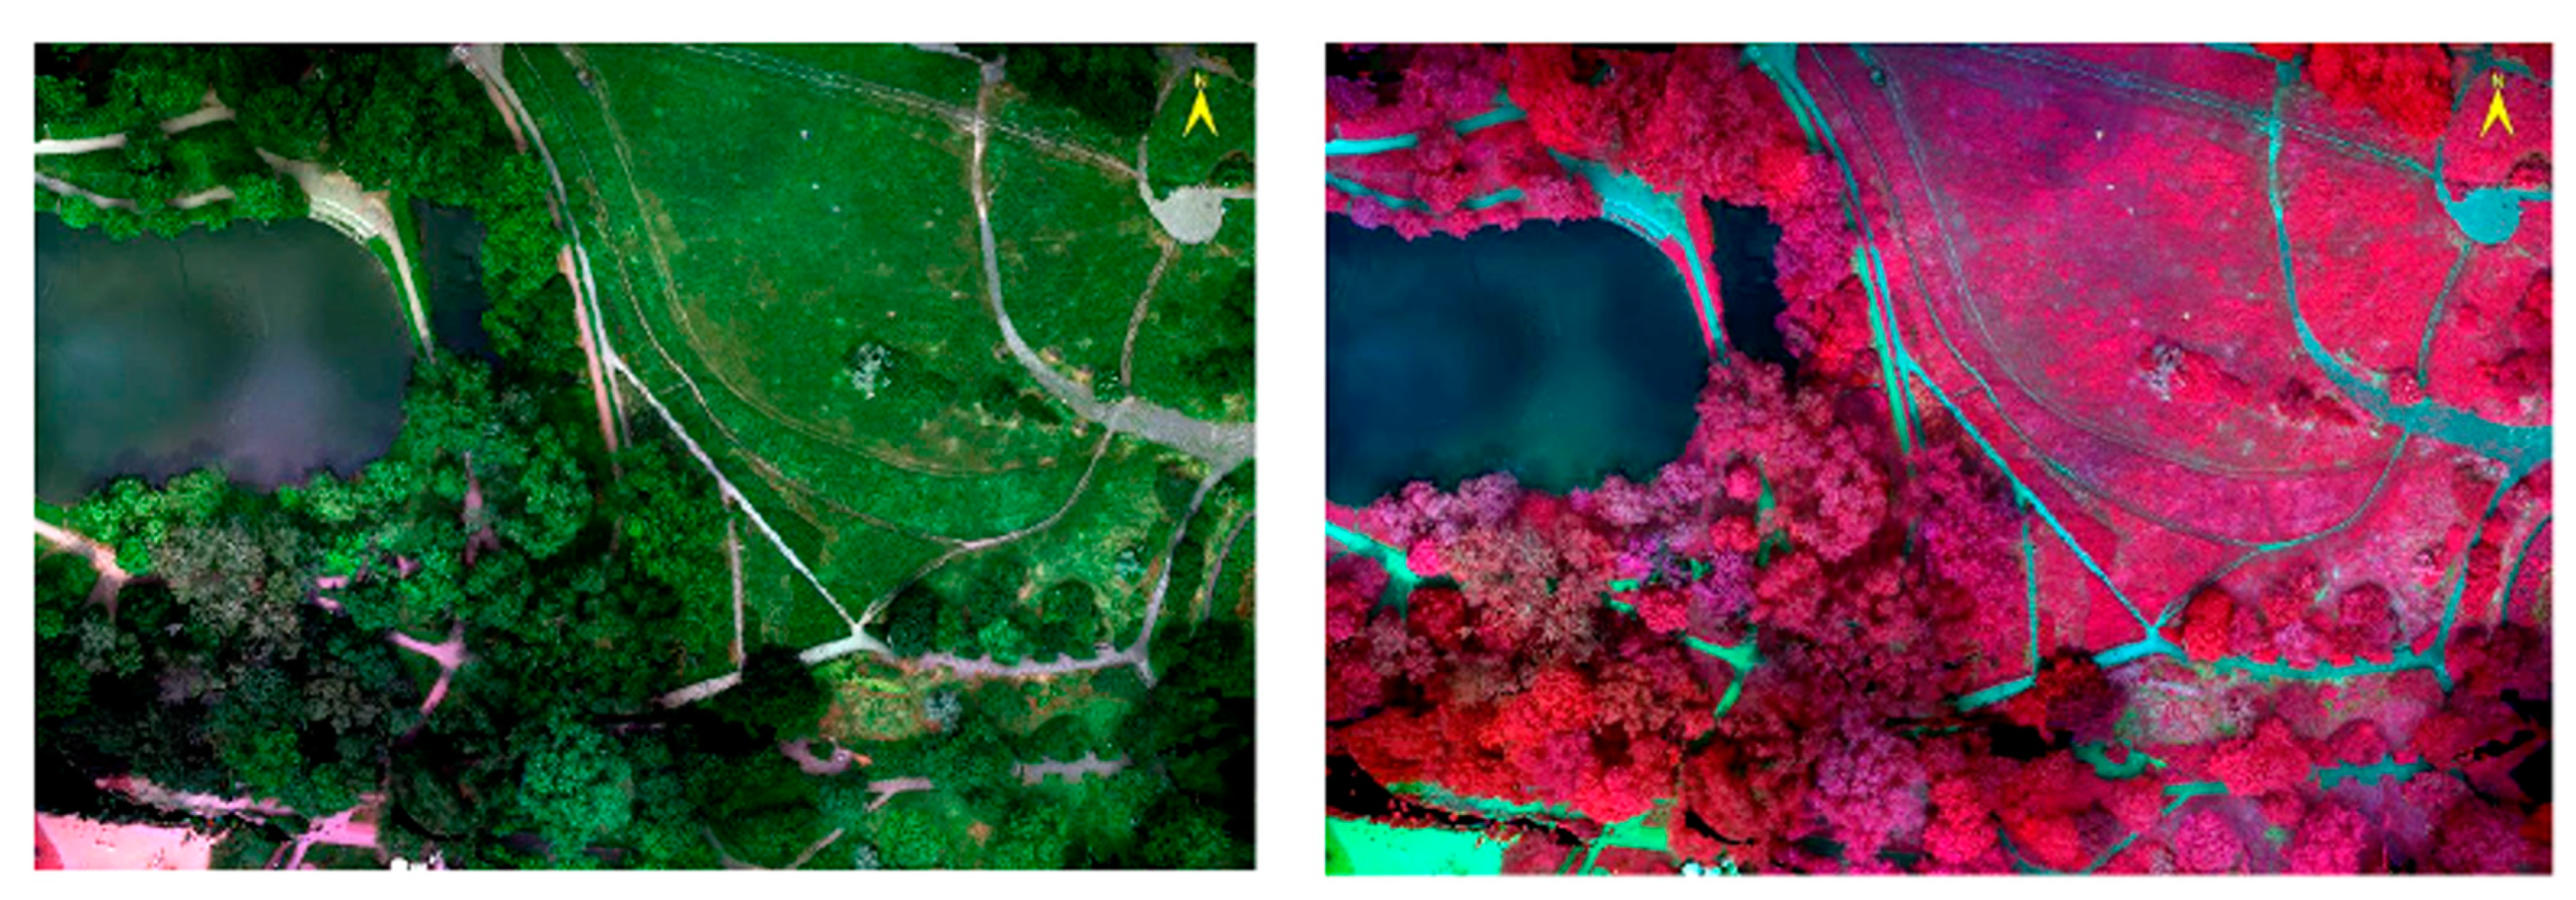
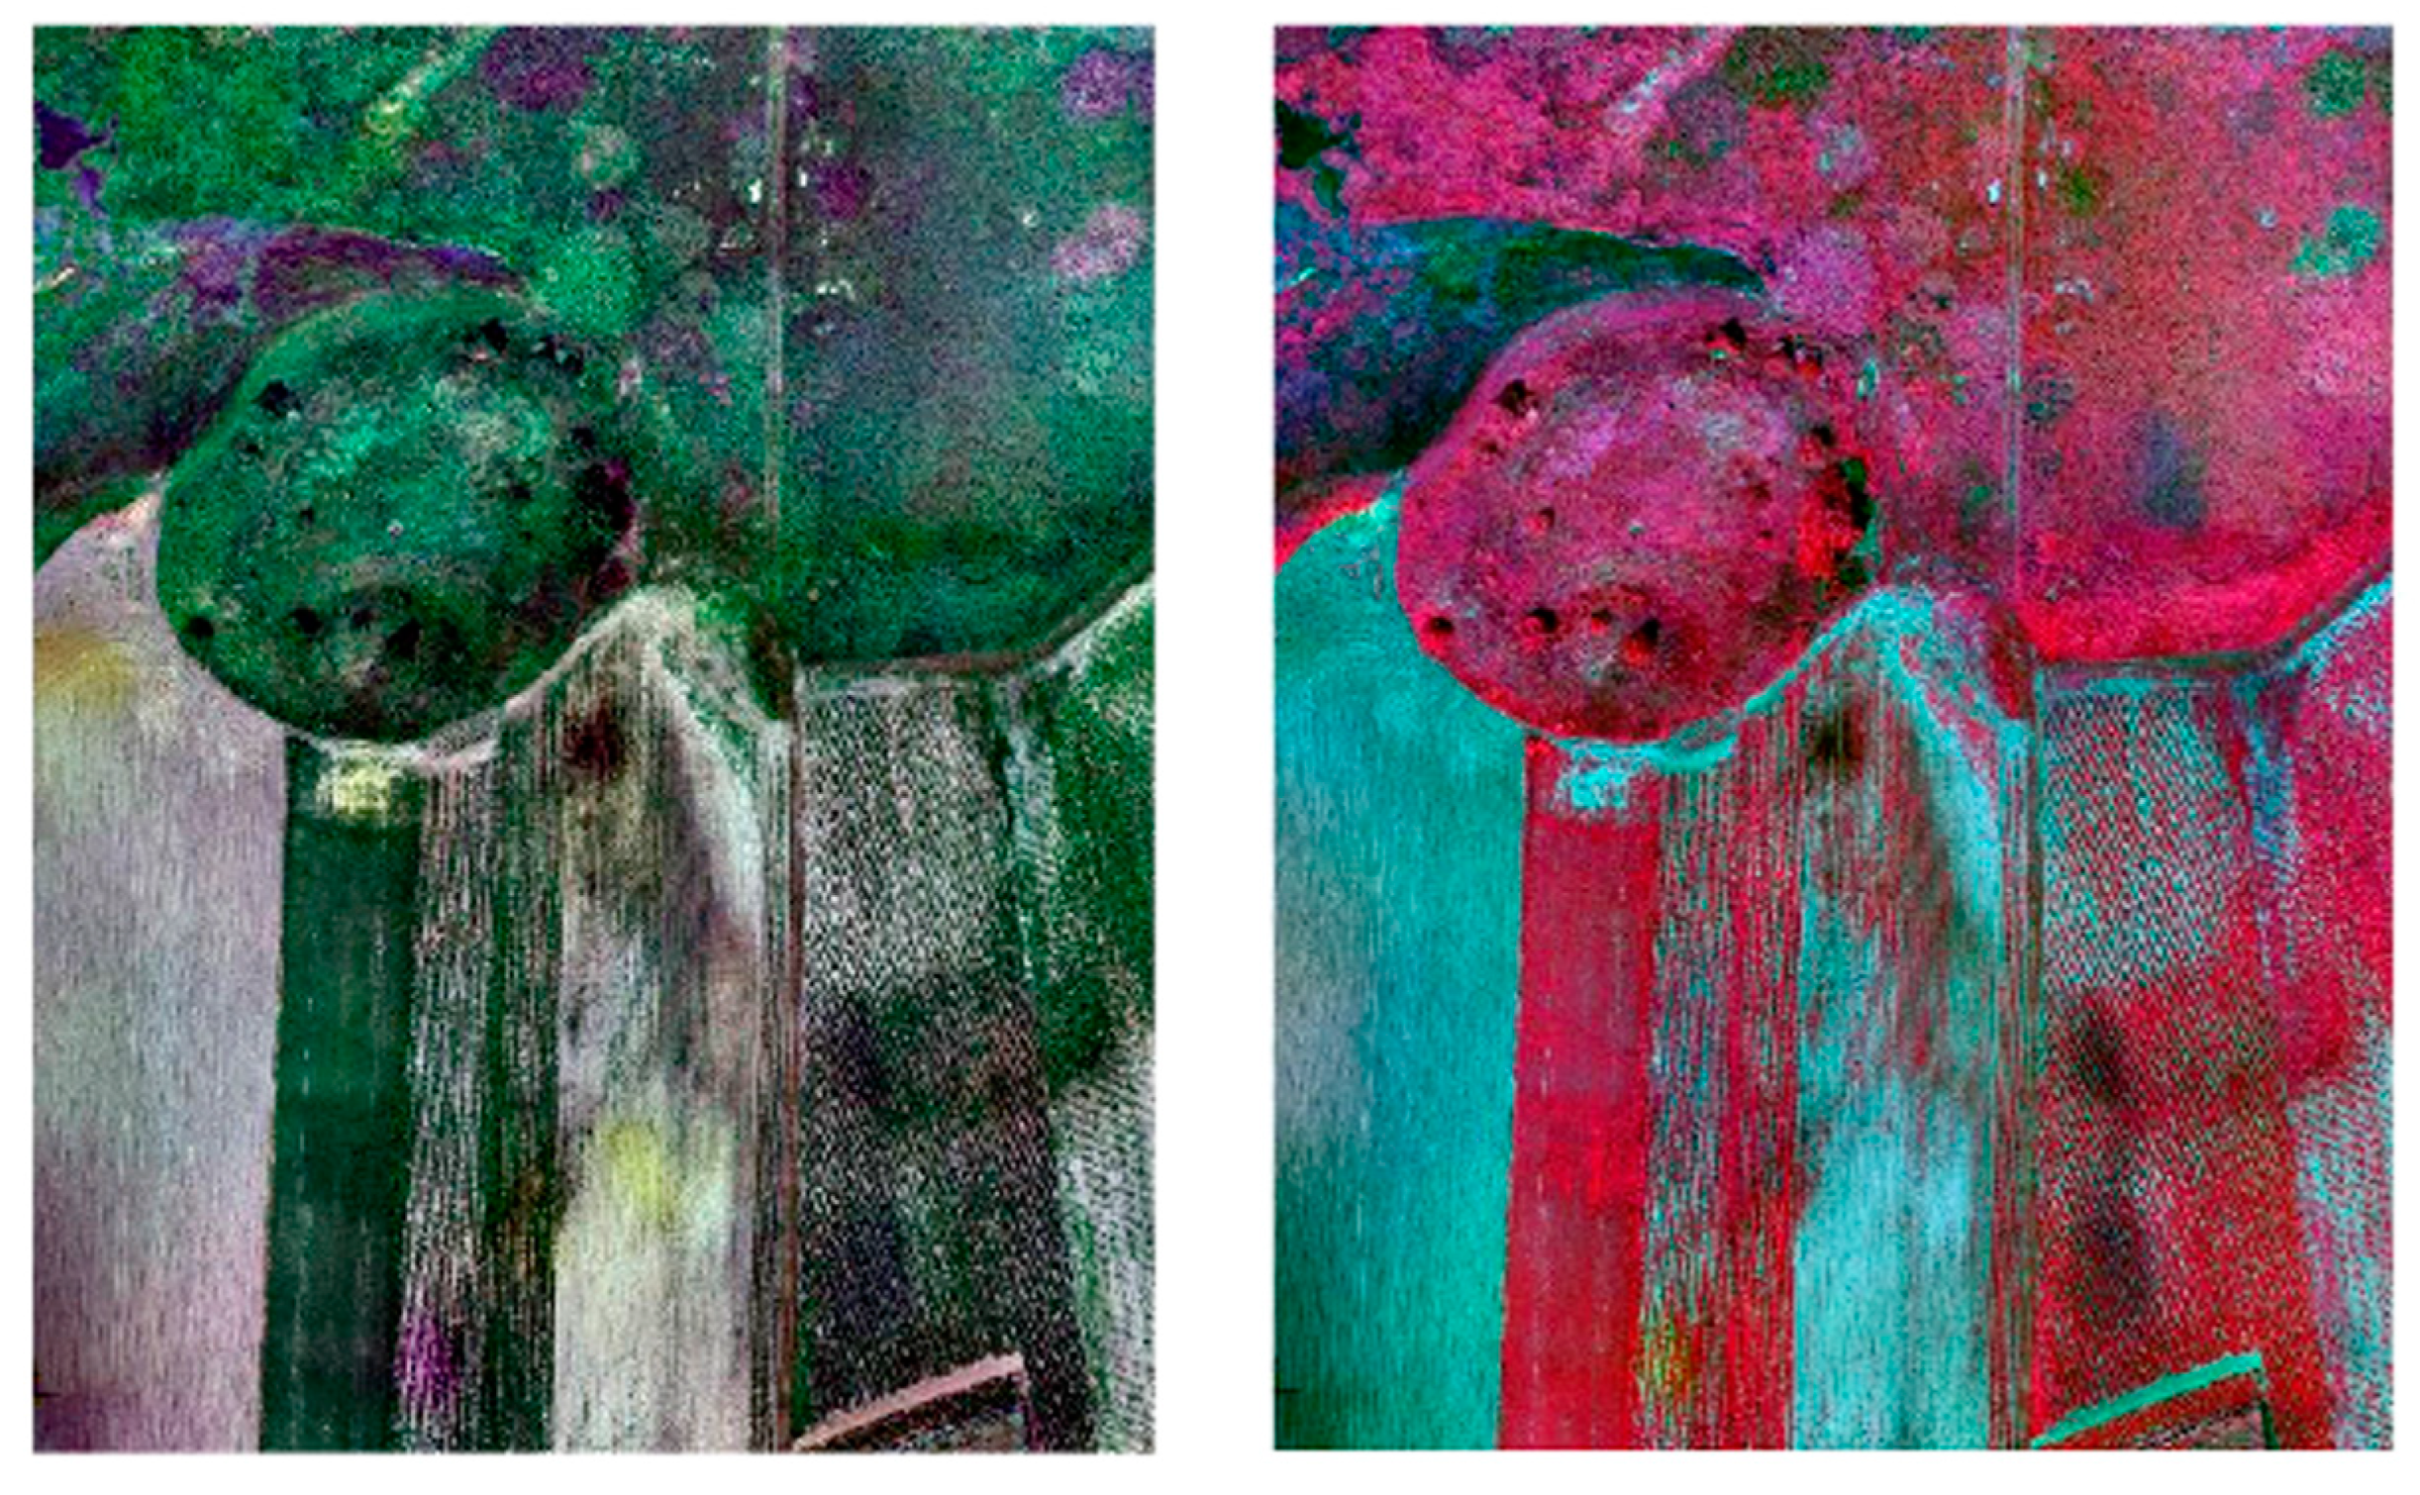
As seen on the developed DEMs, there are apparent differences in the terrain of the depicted areas. In the “Park” and “Grodzisko” areas, there are flat areas and places with large slopes and changes in height. Thus, it was possible to compare the spectral characteristics of the reflection at different slopes of the terrain. Subsequently, orthomosaics were generated based on multispectral data, which also allowed the creation of orthomosaics in the CIR composition. No radiometric correction was applied at this stage—Figure 11 and Figure 12. The process was carried out in the Pix4D software.

3.3. Proposed Methodology

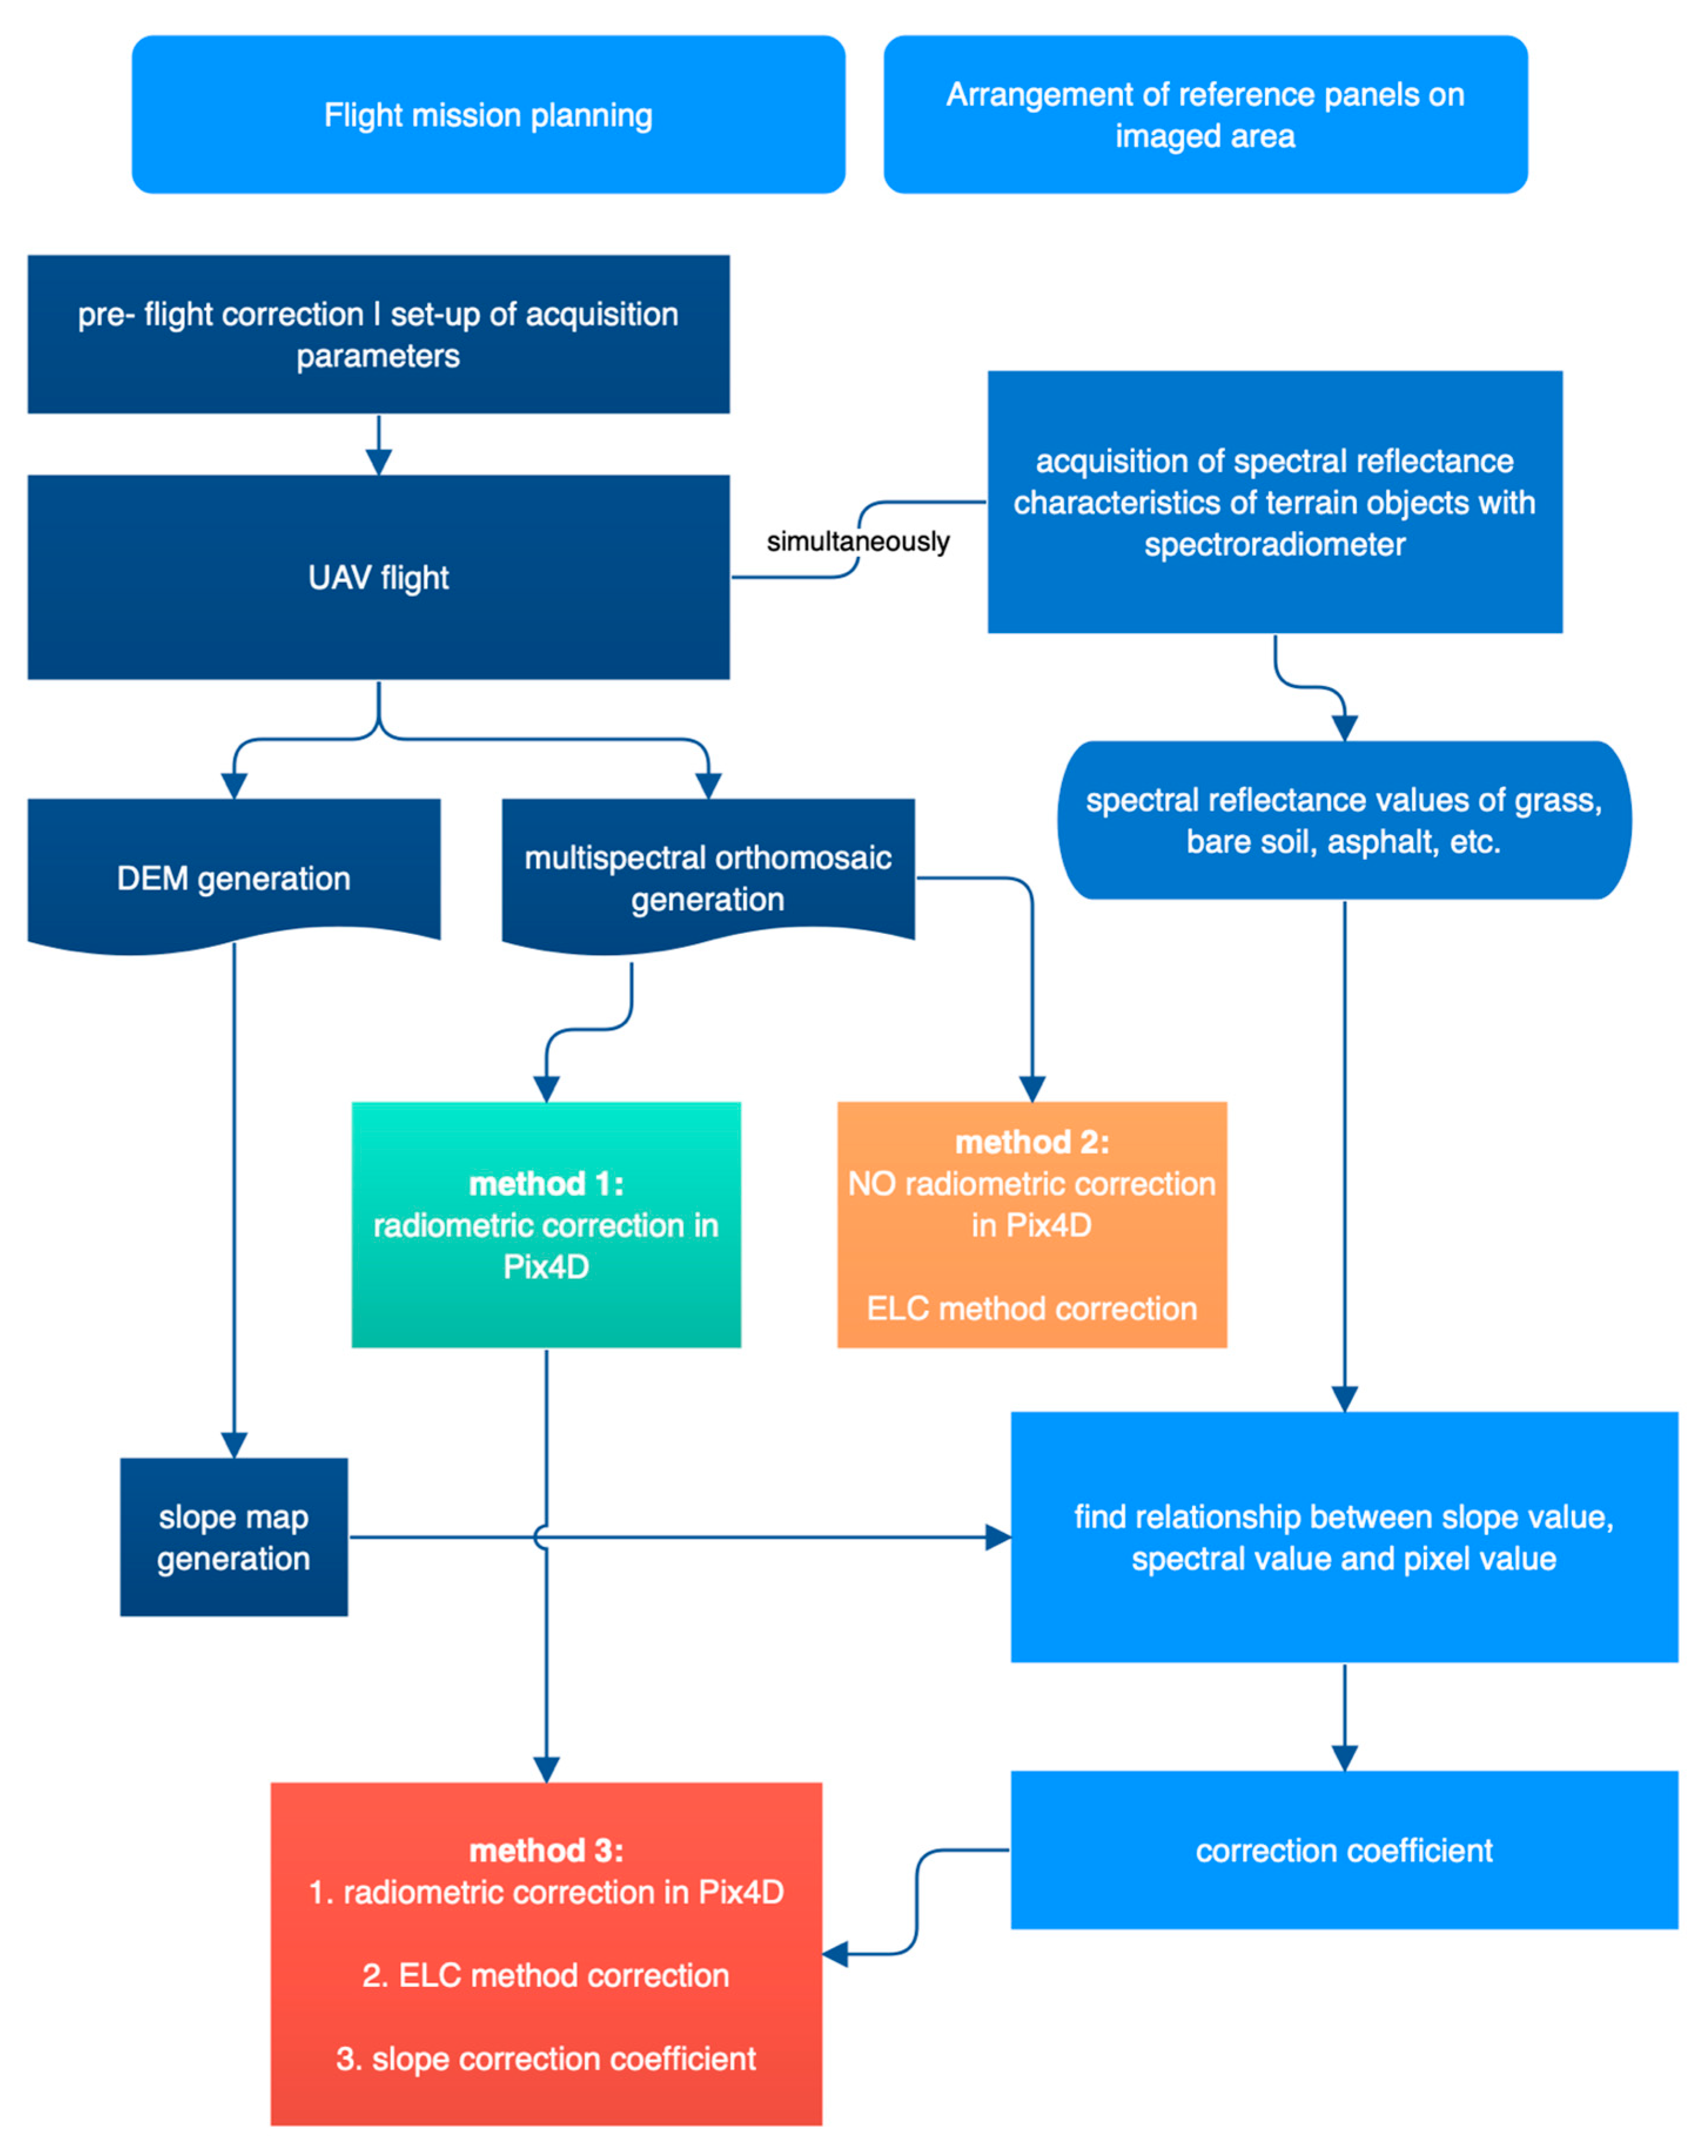
Based on multispectral data, orthomosaics were generated. The pixels do not present any radiometric values, only DN values. Therefore, three approaches to radiometric correction were performed. First, in method 1, in Pix4D, the radiometric correction was performed, i.e., the correction that uses the acquisition information of the camera, sun irradiance, and sun angle. Camera correction considers properties and settings (vignetting, dark current, ISO, etc.) and these parameters were obtained from the Exif metadata. Sun angle correction considers the direction of the incoming sun ray and its projection onto the scene and the sun sensor. Sun irradiance correction is the information provided by the sun irradiance sensors (light sensors), which record the light conditions during the flight in the same spectral bands as the one captured by the multispectral sensor. Supplied with such information, Pix4D normalises the images captured during the flight and thus allows for a comparison of images taken in different illumination conditions [52].
The second method, method 2, is based on the ELC method applied for raw multispectral orthomosaics (without any correction). For this correction, reflection panels (dimensions 50 × 50 cm) with known reflection coefficients were placed on each test area for accurate radiometric correction based on the ELC method.
The third method, method 3, is the original method proposed by the authors; it is a new methodology for the radiometric correction of multispectral images.
The development of the methodology proceeded as follows:
  • Field measurements—flight.
  • Field measurement of spectral reflection characteristics of various land cover elements, such as grass, bare soil, paving stones, stone, sand, gravel, concrete, asphalt, etc., using a spectroradiometer.
  • Generating a DEM.
  • Generating a multispectral orthomosaic based on the acquired image data.
  • Generating products from the DEM—slope—Figure 13.
  • Carrying out radiometric correction using algorithms in Pix4D (irradiance, sun angle, and azimuth).
  • Comparison of spectral reflection characteristics from direct measurement with those from direct measurement—for objects at different angles to the platform.
  • Reading the pixel values for selected points—reading the slope for these values, determining the angle of incidence of radiation and the distance from the object sensor.
  • Development of an empirical approach to radiometric correction based on spectral measurements, a numerical land cover model, slope value, and the angle of incidence of radiation.
  • Comparison of results.
Based on the DEM, slope values were determined, expressed from 0 to 1. Then, slope and reflectance values were read from multispectral images for various land covers based on the initial radiometric correction in the Pix4D program.
This allowed us to link the values of reflection coefficients for different land covers—shown in Figure 13—acquired during the field campaign and slope values (as percents) as well as angles of incidence of radiation and registration by the sensor placed on the UAV platform.
The complete research methodology (for methods 1 and 2 and for our new methodology—method 3) is presented in the diagram below (Figure 14):

4. Results

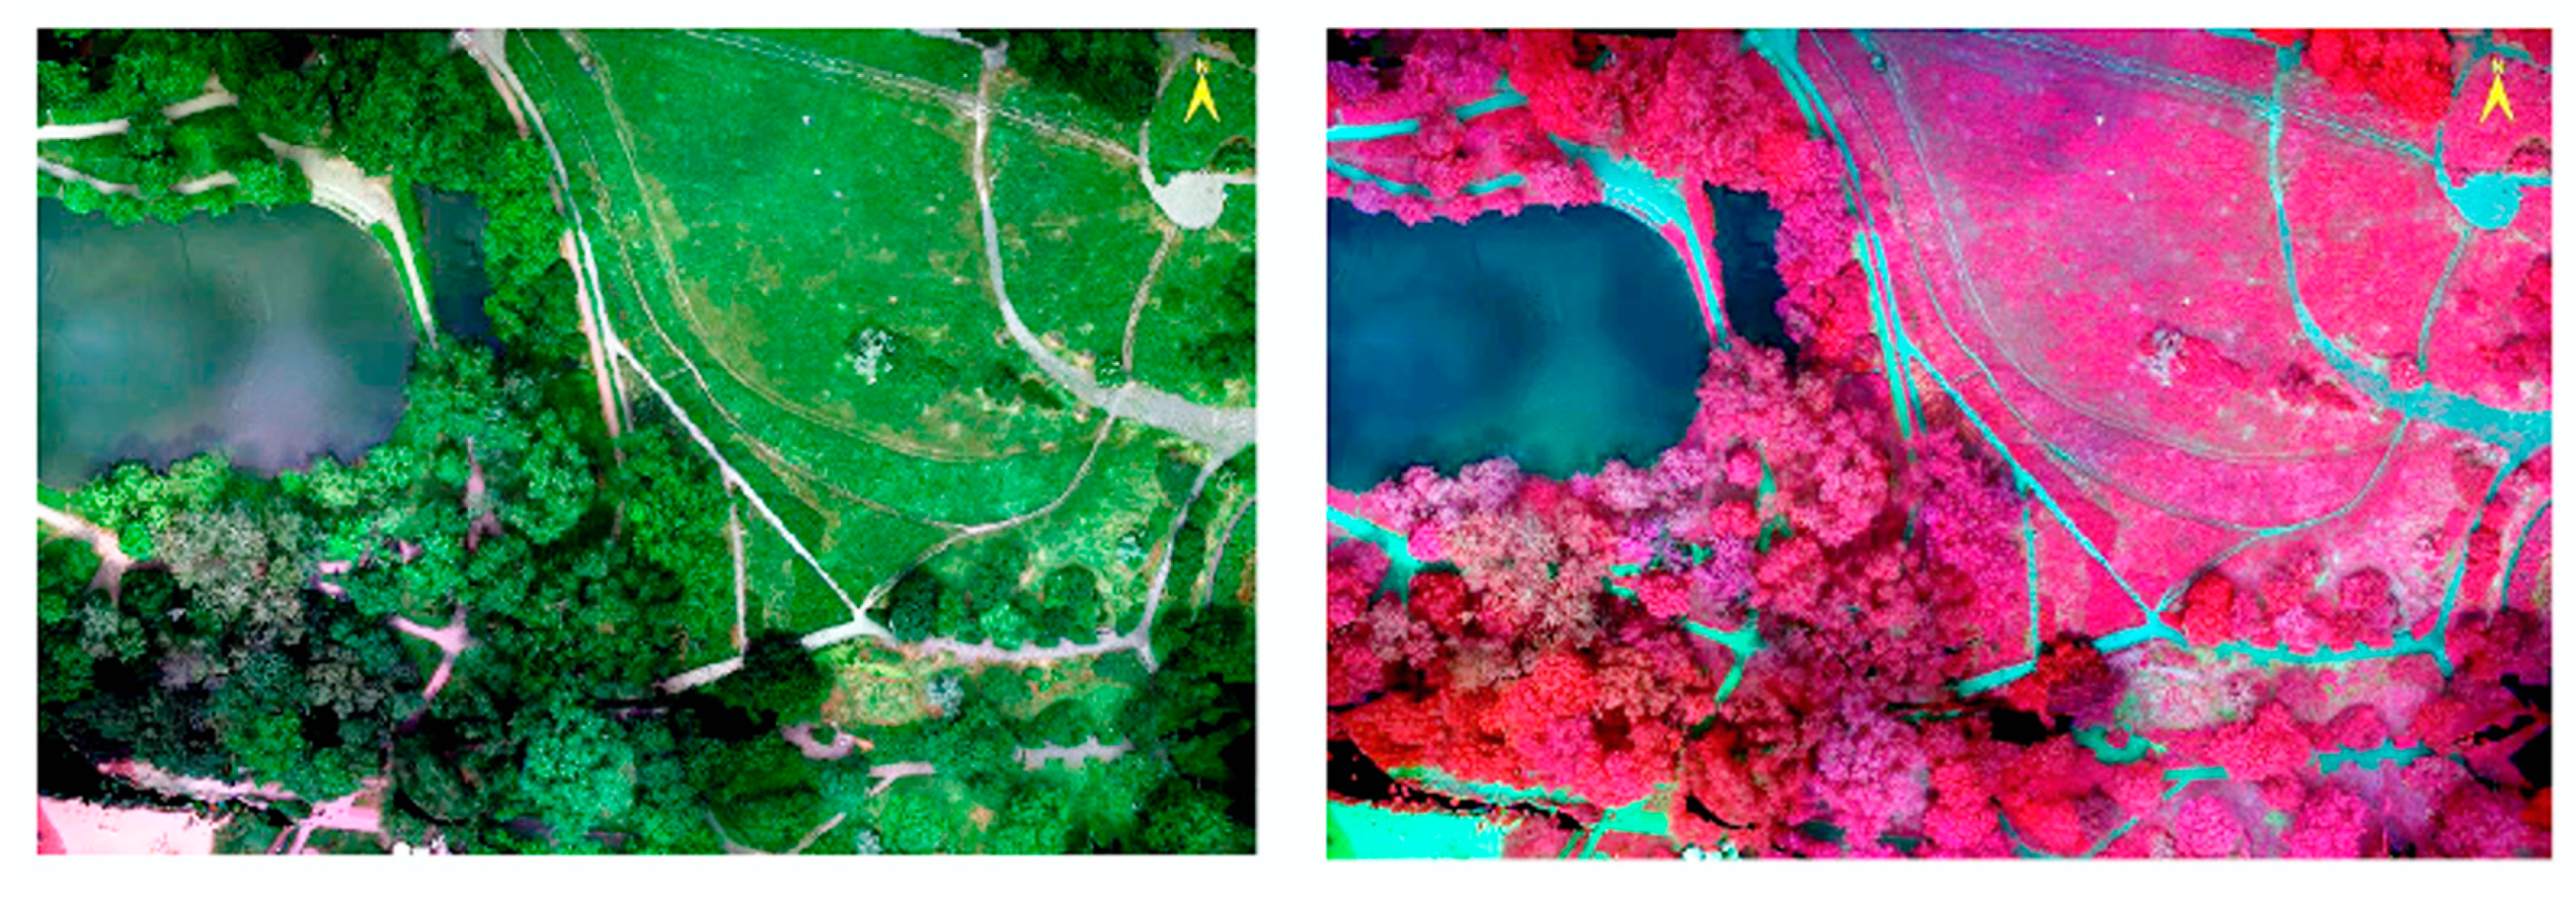
First, method 1 was applied to multispectral images. The results are presented in Figure 15 and Figure 16. Visually, images appear sharper and the colours are brighter.
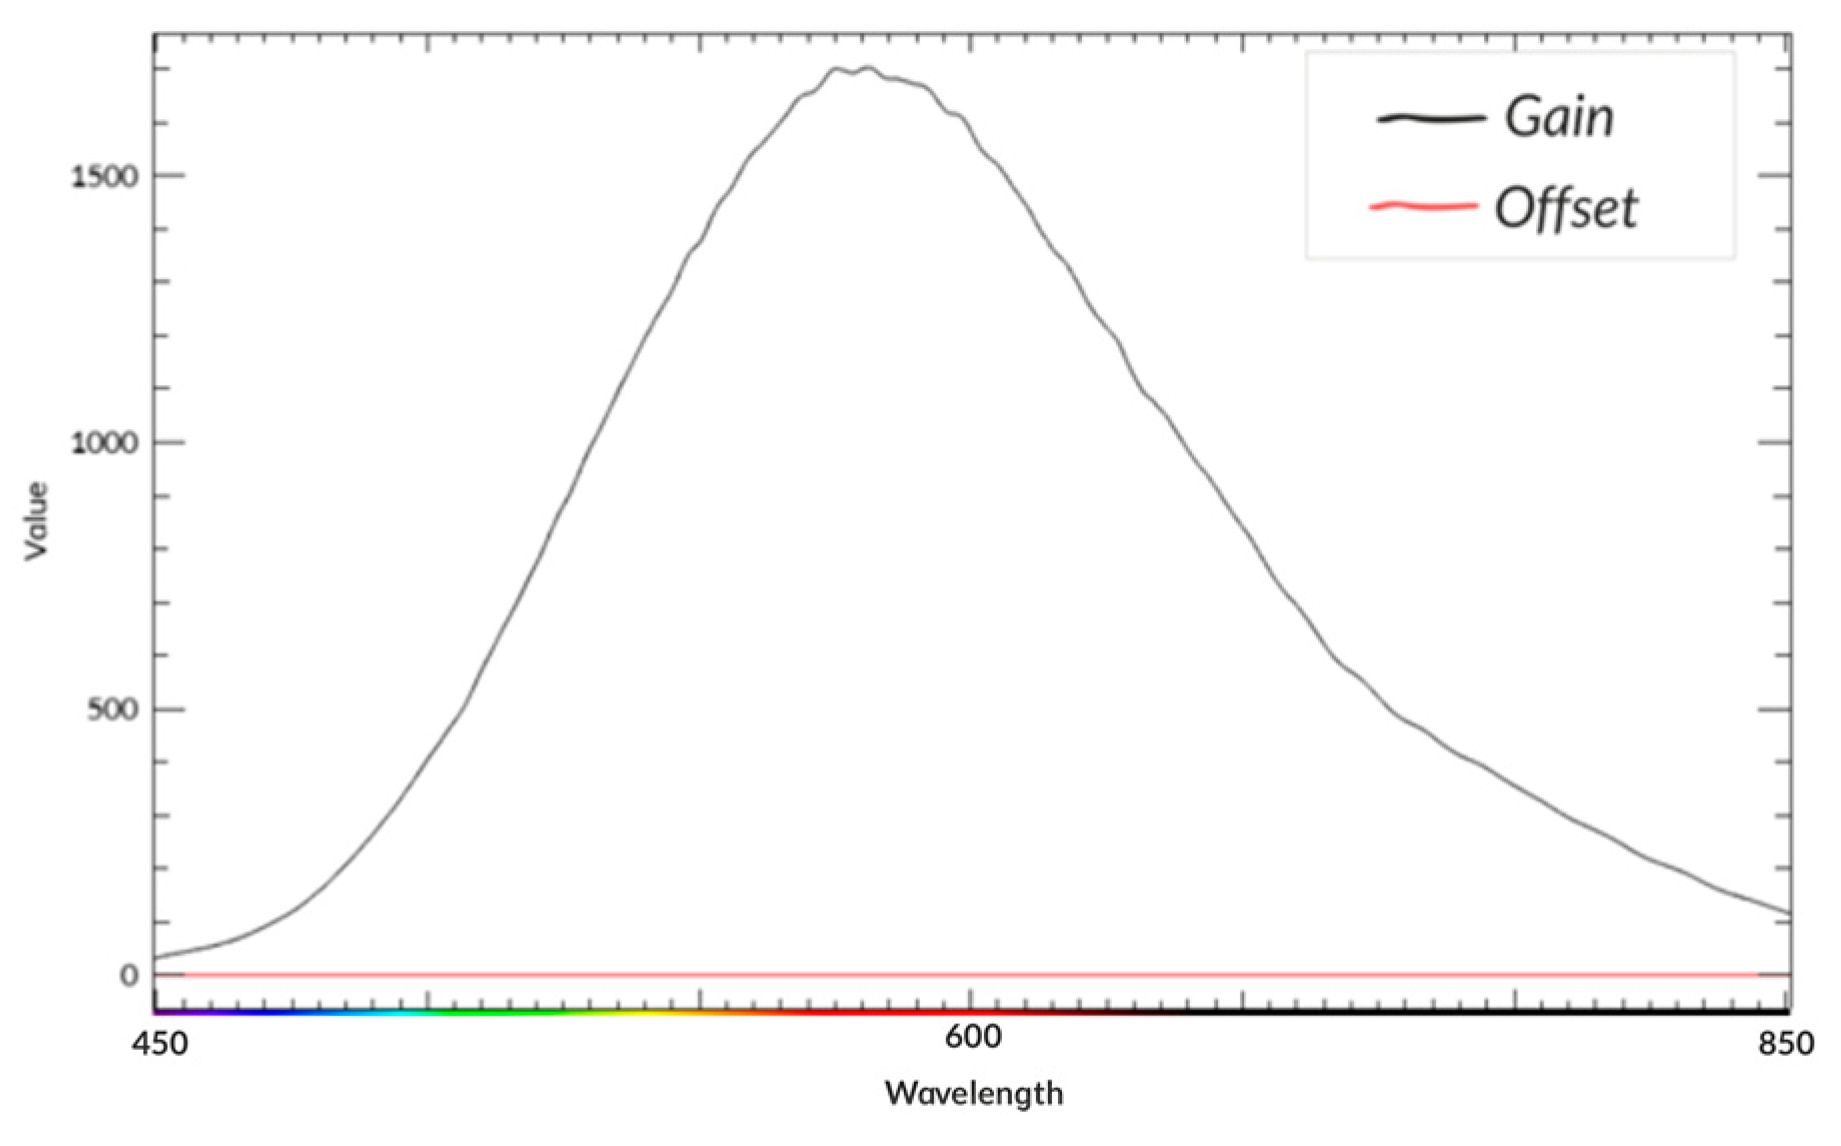
In method 2, reflectance panels were used for the ELC method. As part of the development of radiometric correction based on the ELC method, the impact of the number of reflection standards and the reflection standards used (depending on their average reflectance coefficient) on the accuracy of reflectance determination in the process of radiometric correction using an empirical line was examined. The impact of the analysis of the number of reflection patterns was tested in the study conducted by Poncet et al. [52]. In the described studies, only four standards with Lambertian reflection were used, in contrast to [52]. Based on linear regression, Gain and Offset correction coefficients were determined, whose values are variable depending on the wavelength—Figure 17 and Figure 18. The Offset values are very low: zero or close to zero for all bands. However, the Gain values for all bands can be approximated by the Gaussian function. Thus, the functions were approximated either by a linear or close to a linear function.
Based on a visual analysis of the ELC method applied for one, two, three, or four reference panels for correction, the best fit was obtained for variants which used two standards—the lowest and the highest reflectivity, respectively—but covered most of the spectral range; three reflectance panels (from the lowest and highest reflectivity, and also containing one pattern with an intermediate value); four reflection patterns—all available panels used in the work. Of these three options, the lowest accuracy was obtained for the variant where all four panels were used for correction. For this option, the worst match was obtained for the spectral reflection characteristics of the three scenarios selected. The conclusions converge with the results reported by Poncet et al. [52], who recommend using standards with similar reflection values as the analysed objects.This is caused by the excessive number of observations necessary to determine the parameters of the function changing the value of pixel brightness to the value of the reflection coefficient—similarly observed in the studies [53,54]. Thus, it was found that the best and the easiest solution is to use only two reflection standards—95%, and 5%—to carry out the radiometric correction of multispectral images using the ELC method. The results of radiometric correction with method 2 can be observed in Figure 19 and Figure 20.
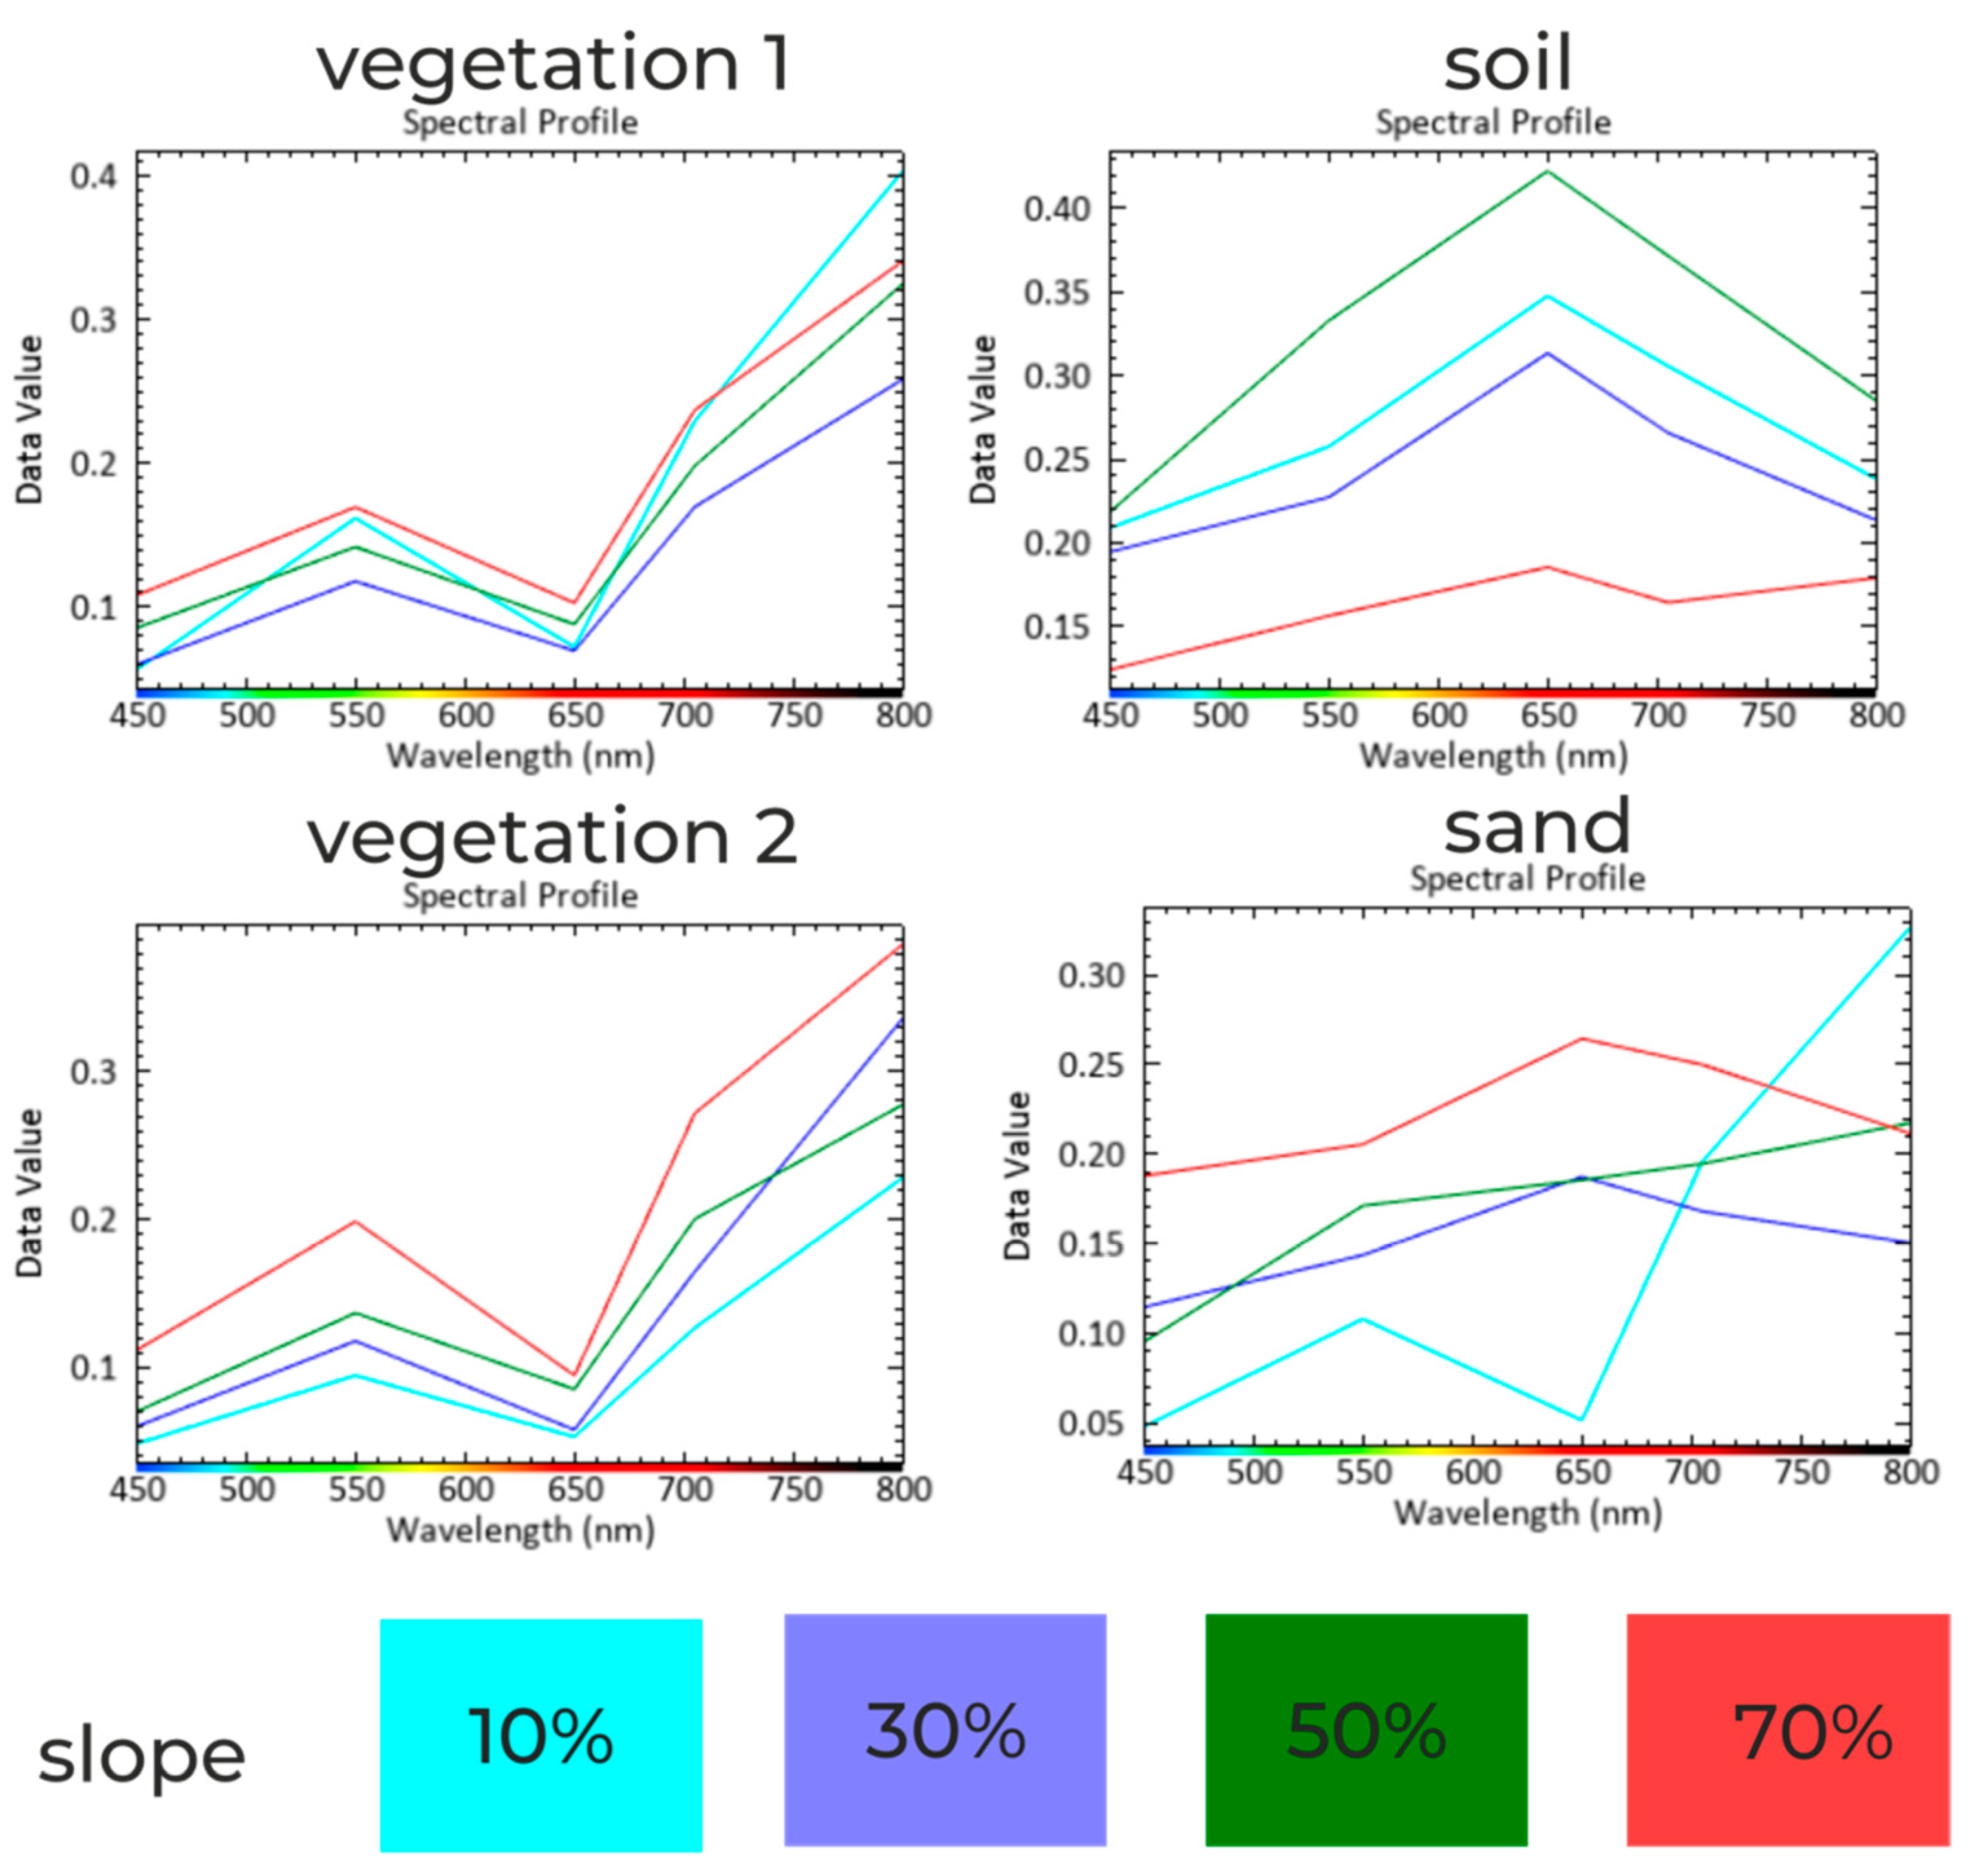
To determine new correction equations following the concept for method 3, the orthomosaic was subjected to radiometric correction based on the methodology applied in the Pix4D program, which considers the sun’s angle and the irradiance change. Then, the image was subjected to ELC correction based on only two reflectance patterns: it was decided to use panels with a reflectance of about 95% and 5%. The image prepared in this way was then subjected to further operations based on the direct measurement of the spectral characteristics of the reflection produced by the spectroradiometer in field conditions and the pixel values for each spectral channel of the multispectral mosaic for selected objects acquired at different angles and for different values of the slope of the terrain (Figure 21).
Based on the obtained values for different inclination values and the values of reflection coefficients of various objects at different slopes and reference values obtained using direct measurements, correction factors were developed for each channel of the MicaSense Altum camera.
To evaluate the accuracy of ELC’s regression fitting, we used goodness of fit (R2):
R 2 = i = 1 n ( y ^ i y ¯ ) 2 i = 1 n ( y i y ¯ ) 2
where y and y ^ denote sample point values (to be fitted) and fitted values by the radiometric correction method, respectively. y represents the mean value of y. n is the total number of sample points.
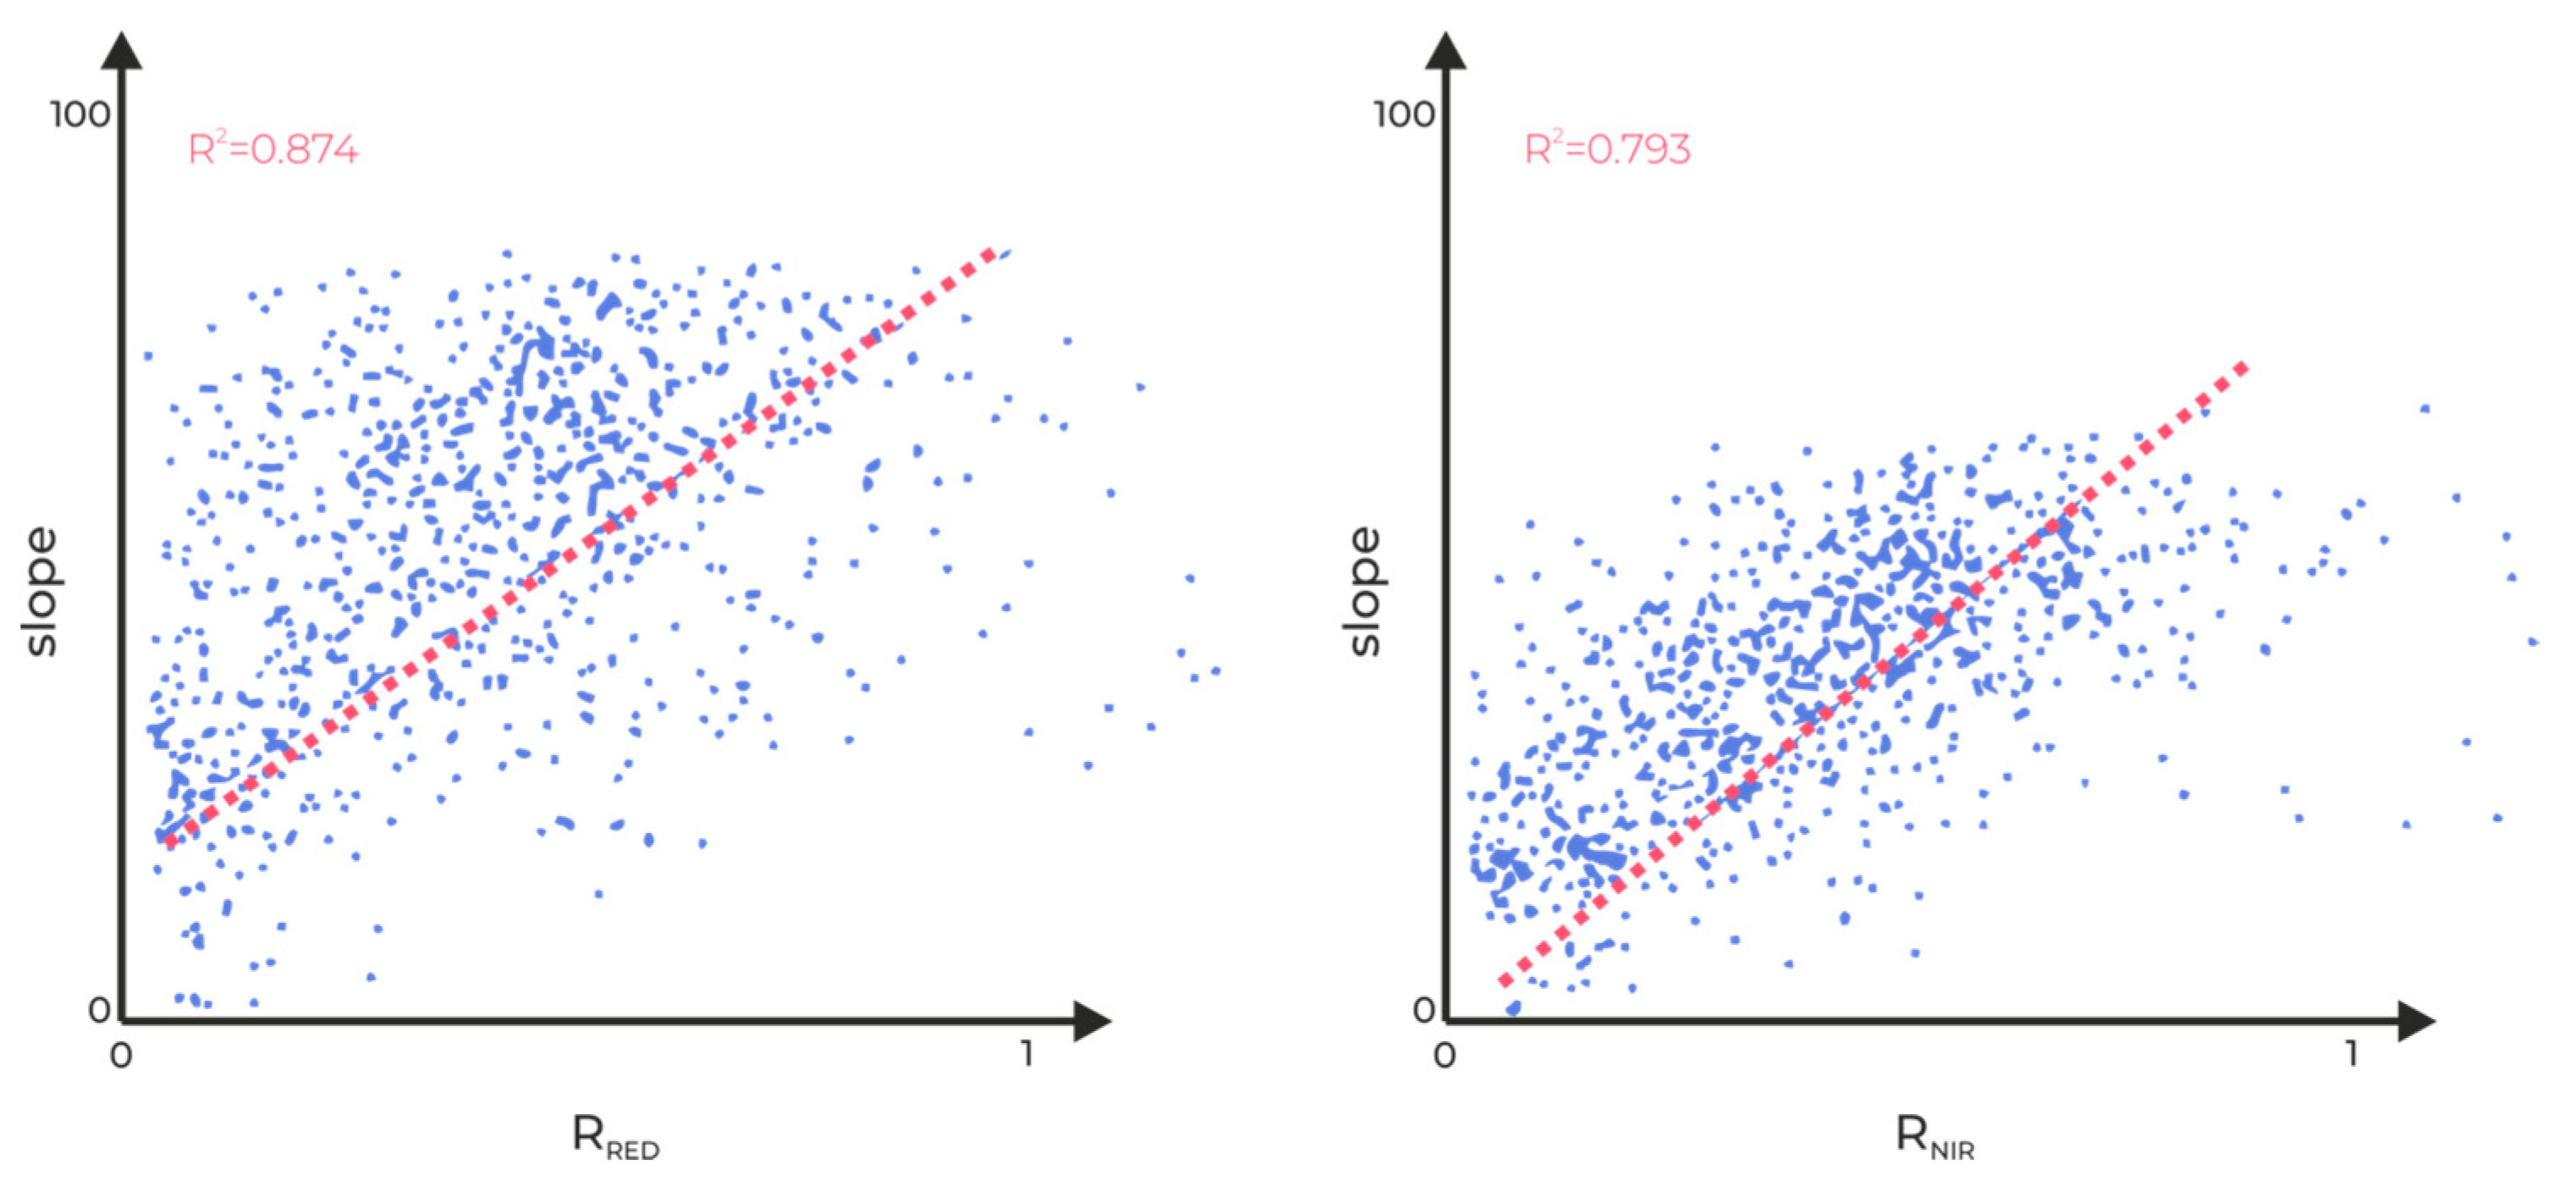
For this purpose, linear regression was used. For individual spectral channels, the R2 coefficient was not lower than 0.785 (for the blue band) (Figure 22).
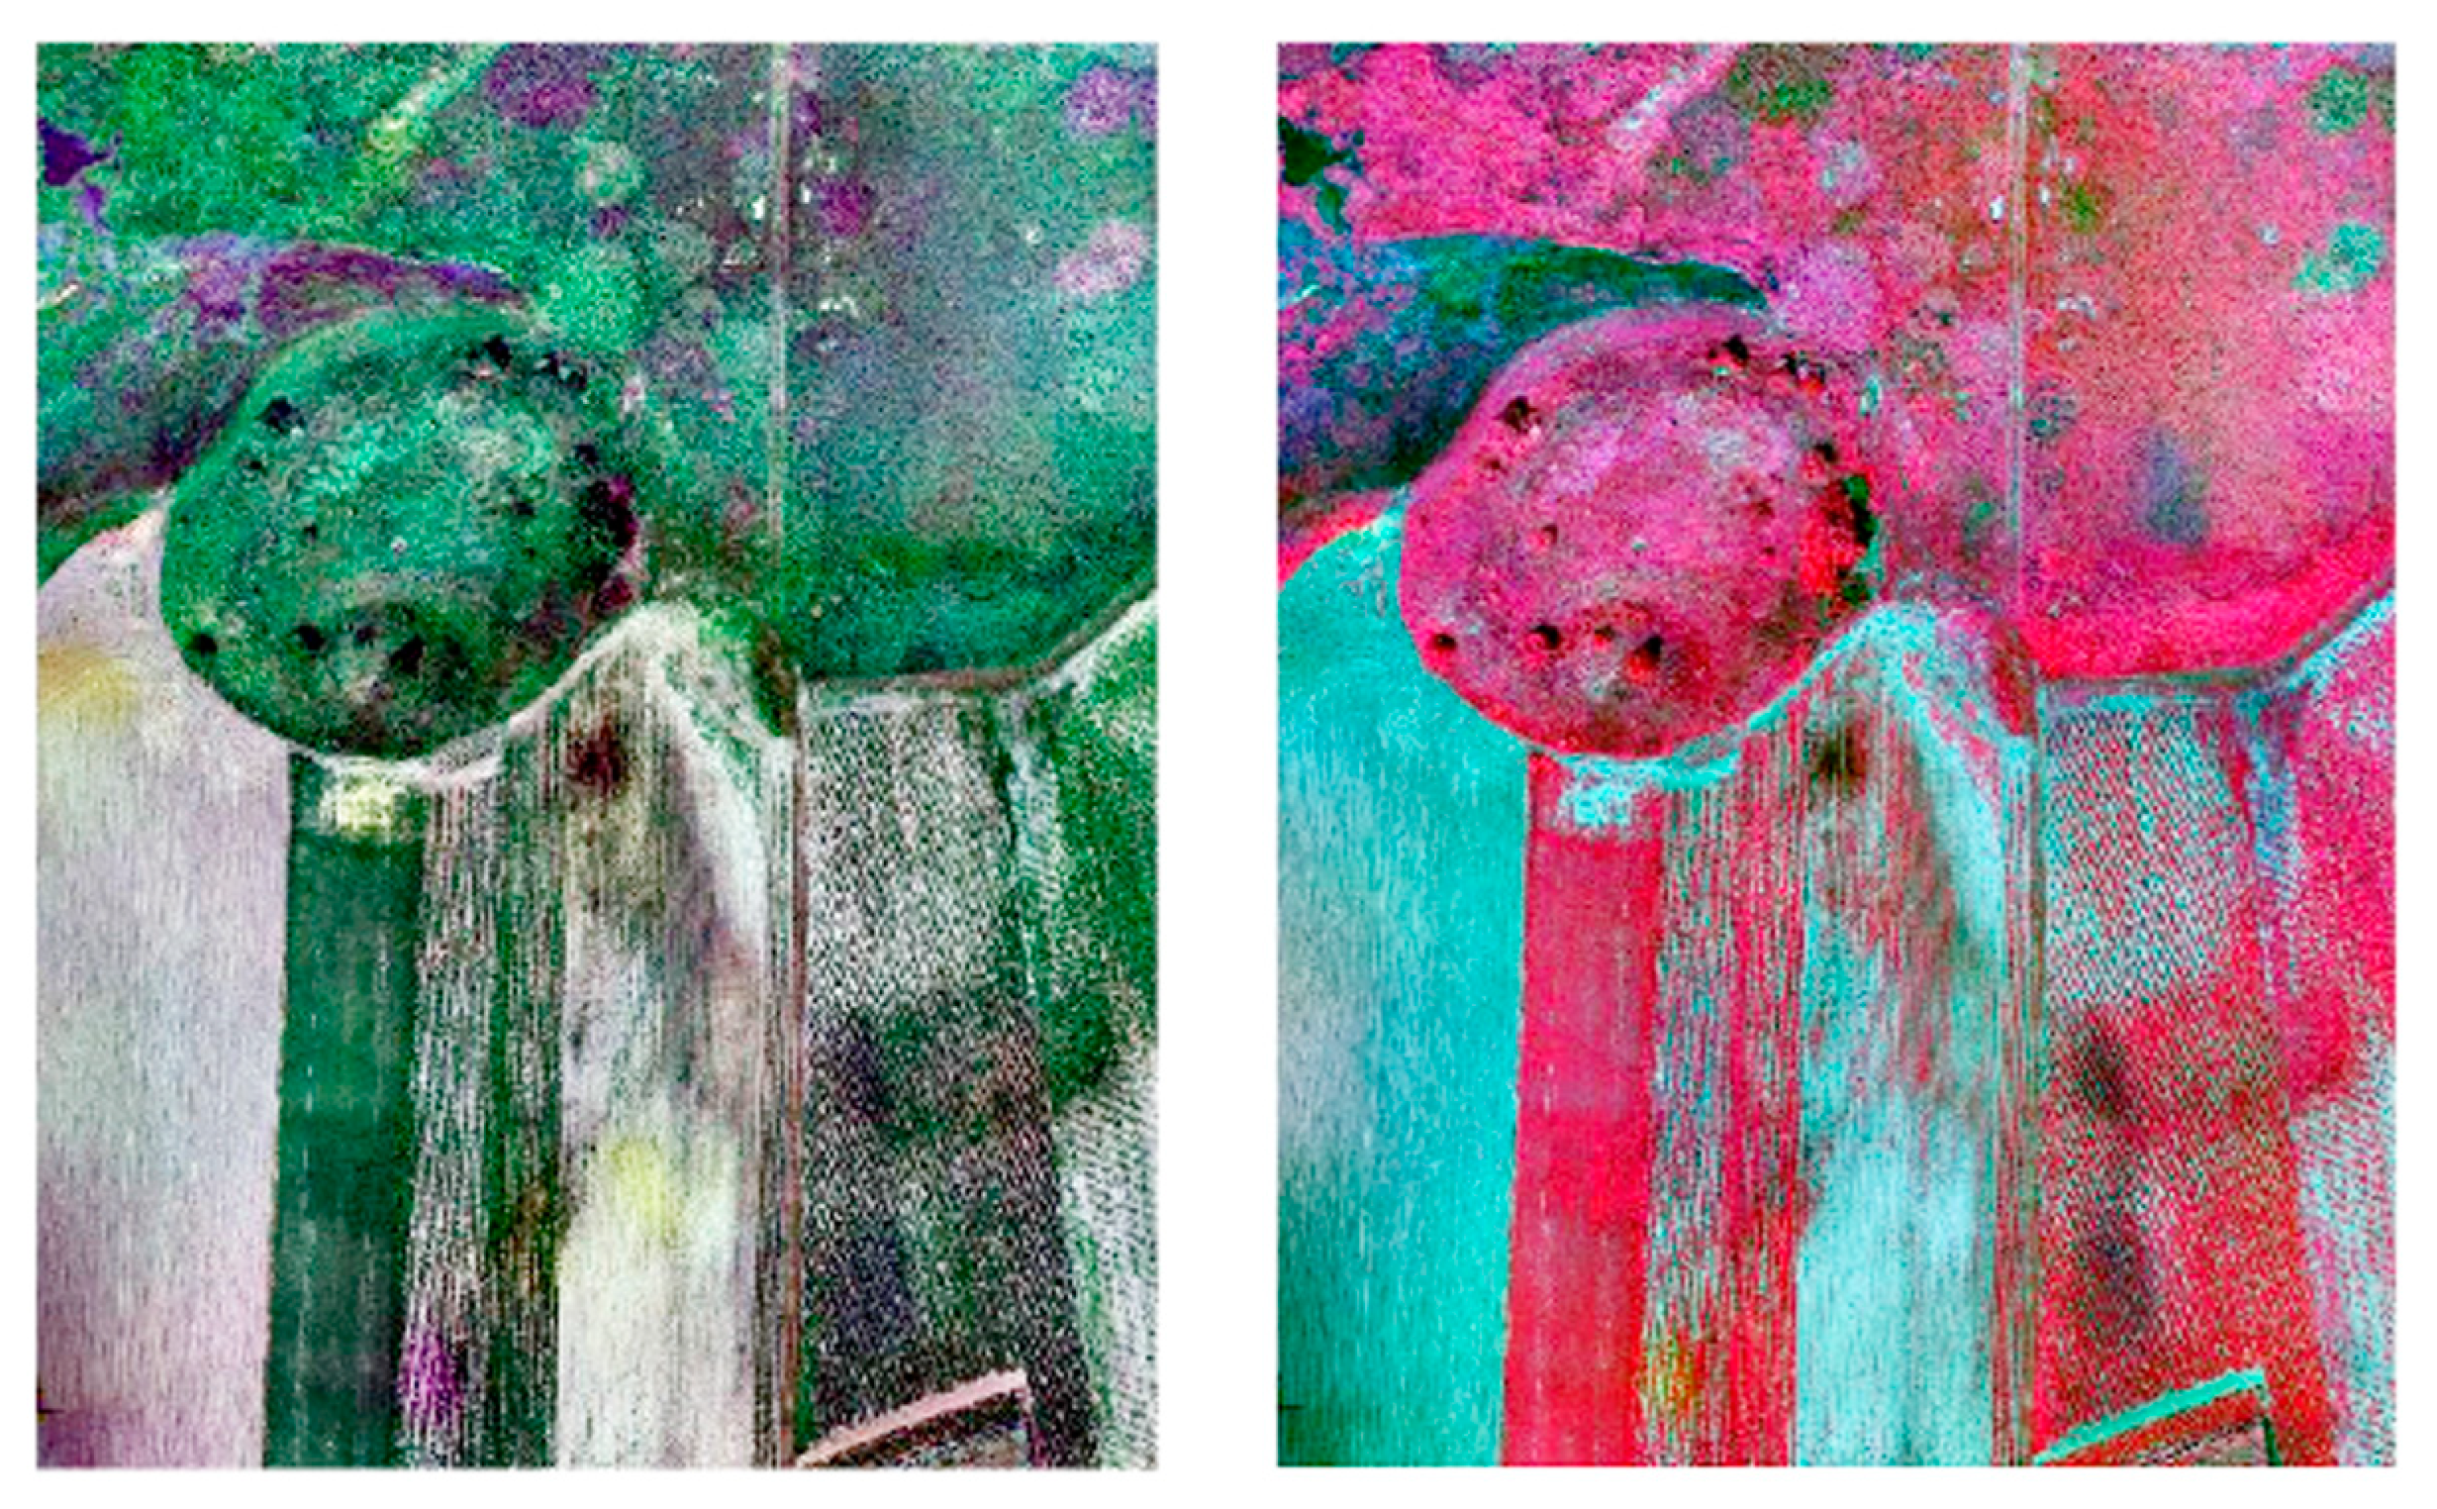
The correction factors for all spectral bands of the MicaSensne Altum camera were determined based on linear regression methods. The correction factors were applied after applying the correction according to method 1 and then correction was performed according to the ELC method—method 2: (4)–(8) (Figure 23 and Figure 24).
k b l u e = 0.978 * R + 0.654
k g r e e n = 0.986 * R + 0.721
k r e d = 0.898 * R + 0.788
k r e d E d g e = 0.914 * R + 0.644
k N I R = 0.923 * R + 0.790
Therefore, the corrected pixel value R c would be equal to R c = R + k.
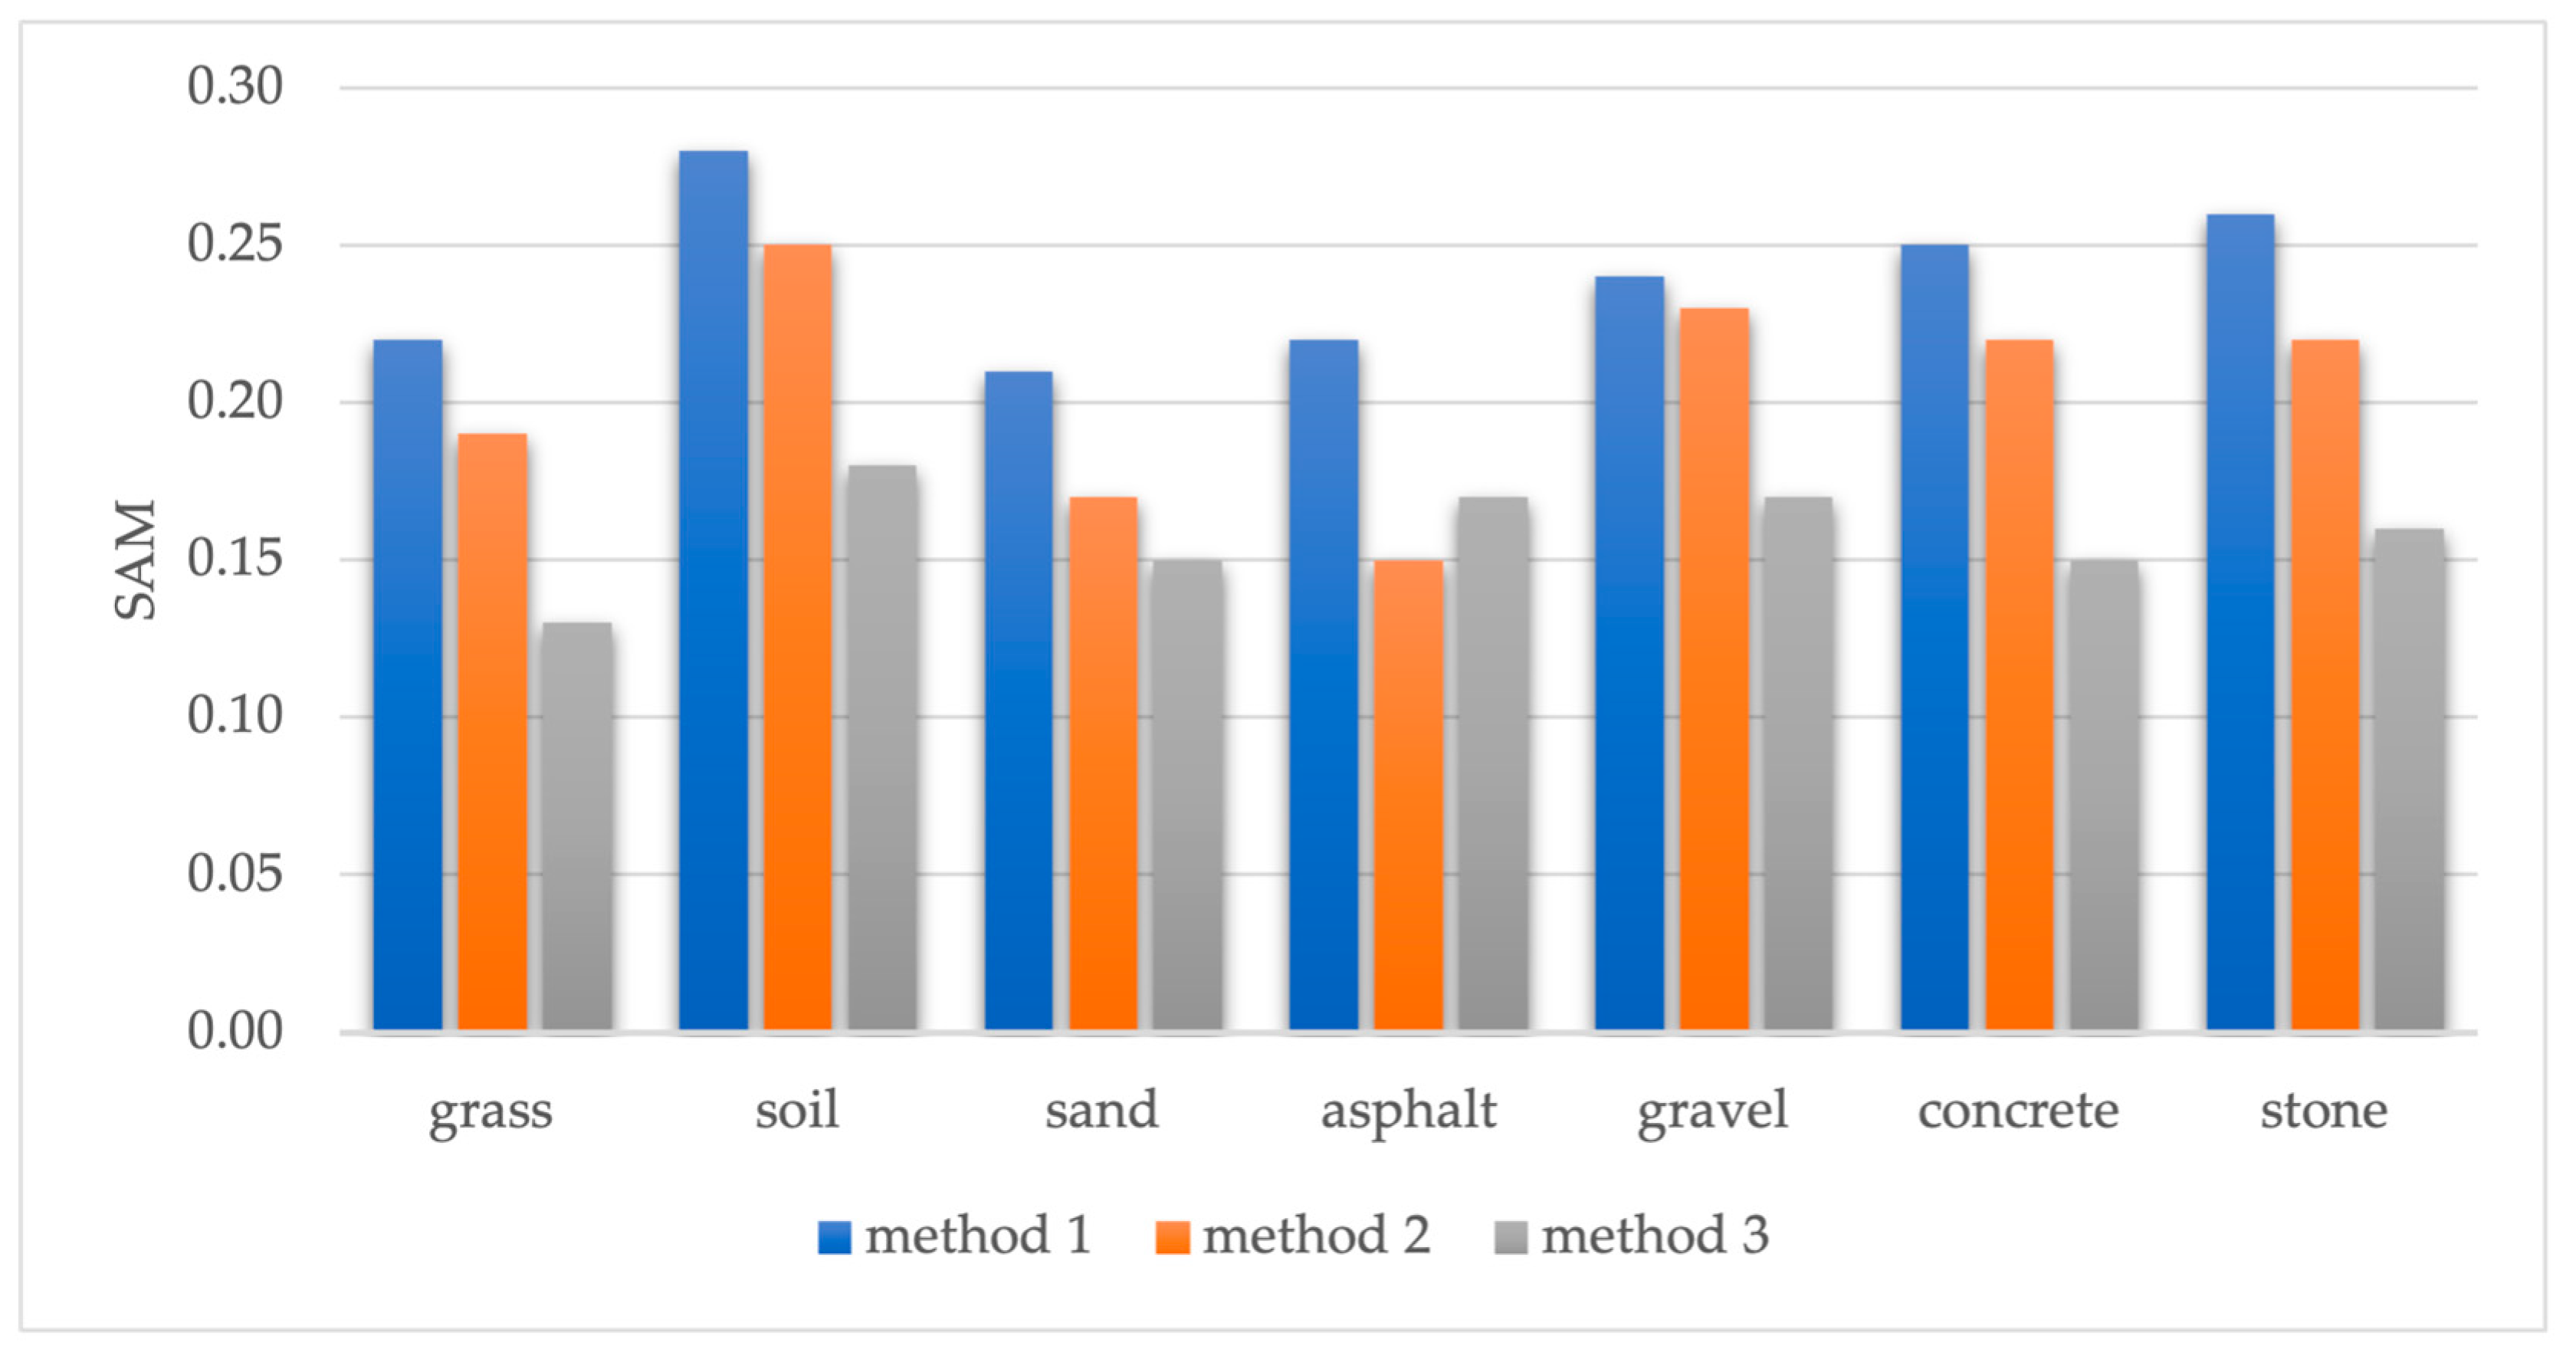
After applying the three methods, reference spectral characteristics and characteristics from images were compared to validate the results. The SAM (Spectral Angle Mapper) function matches the spectral test signature against the reference spectral signature and returns a scalar value. Both the test and the reference spectra must be vectors of identical length. Each element of the SAM score is a spectral angle in radians in the range [0, 3.142]. A lower SAM score indicates a strong match between the test and reference signatures. As observed, the best values were obtained for method 3, which resulted from applying the new correction method (Figure 25).

Radiometric Correction Quality Assessment

There are many different approaches to assessing image quality in the literature; however, there is no universal procedure. However, assessing image quality after radiometric correction often includes correlation coefficient (CC), correlation coefficients, standard deviation values, and differences in pixel brightness values between images [49,55,56].
The correlation coefficient is determined for each band separately and can be calculated based on the following formula:
C C ( I M A G E O R I G , I M A G E C O R R ) = C C ( I M A G E O R I G , I M A G E C O R R ) S D ( I M A G E O R I G ) S D ( I M A G E C O R R )
where
ImageORIG—original image;
ImageCORR—image after radiometric correction;
CC—correlation coefficient;
SD—standard deviation;
COV—covariance.
The standard deviation (SD) describes the data distribution around the average value of the pixels in the image. Covariance is an un-normalised measure of the relationship between the analysed data. Normalisation is achieved by dividing the covariance by the product of standard deviations of the processed data. The result of this processing is the correlation coefficient. It is a normalised measure between the original image and the image after ELC enhancements. The correlation coefficient values are within the range [−1, 1]. The higher the correlation coefficient, the more correlated the data are, thus the more significant the similarity between the original images.
After radiometric correction, the correlation values (Table 2) are close to 1, which means that the global statistics of the image have not changed. Still, the absolute radiometric quality of the radiometric image has improved.
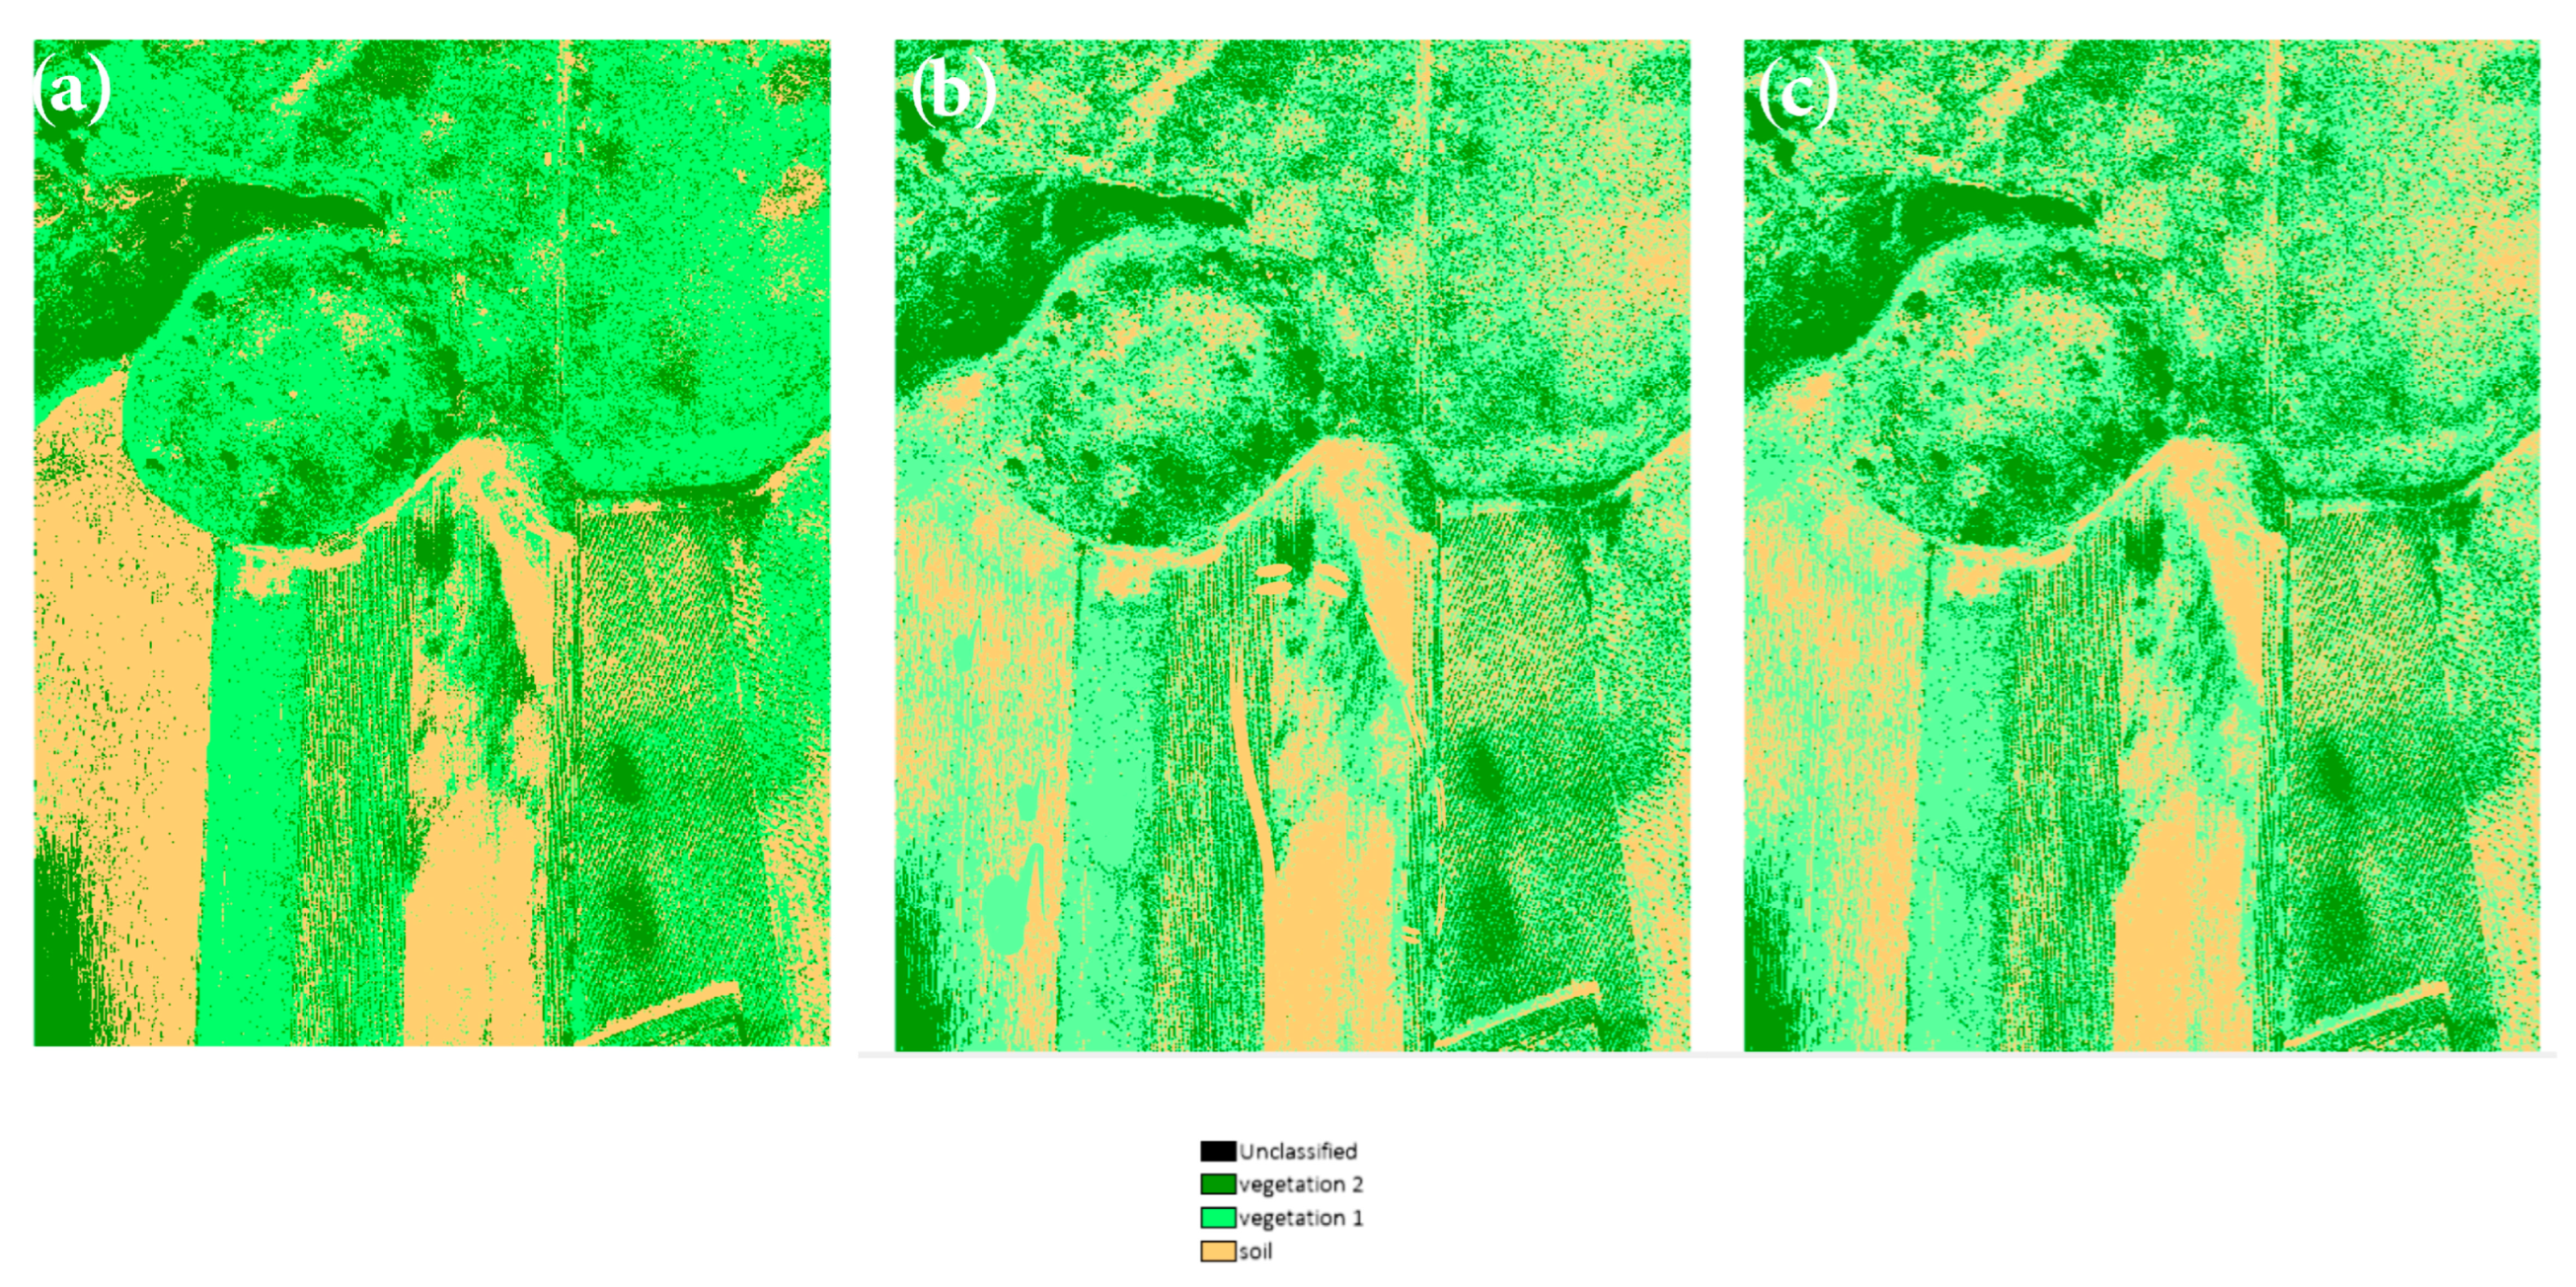
The next step in evaluating the results was to perform supervised classification. During the described work, a supervised classification was carried out using several commonly used classifiers, such as minimum distance, Mahalanobis distance, KNN, etc. The accuracy of the individual classification methods was analysed for the data for which the correction was performed using the first approach. Among the applied methods, the best results in the accuracy assessment were obtained by the maximum likelihood method. The choice of such simple and commonly used methods was dictated by the assumption that these methods are most often used by researchers and users, e.g., in precision farming applications. As in the case of SAM spectral angle analysis, the best results were obtained for the correct image after applying the proposed original correction method (Figure 26).
The two experiments were for supervised classification using the maximum likelihood method. The results show the overall accuracy (OA) of each technique. Method 1 had an OA of 89.588%, method 2 91.255%, and method 3 had an OA of 94.749% of the data. Method 3 has a higher OA than method 1, suggesting it may perform better for this specific dataset and classification task. However, other metrics, such as precision, recall, and F1 score, should also be considered to evaluate the performance of each method fully. Based on the above, our method (method 3) allowed for an increase in the efficiency (quality) of classification by 5.2% compared to the classic ELC method.

5. Discussion

The paper presents a new radiometric correction method for multispectral images obtained from a low altitude, considering the impact of radiometric calibration of the imaging sensor (build-up methods) using various techniques and terrain height differences and slopes. The proposed method is based on the modified empirical line correction, considering the slope correction coefficient. The obtained results of the quality assessment of the proposed method were compared with other studies [57,58,59] in terms of increasing the accuracy of different types of land cover; however, the presented method gives higher precision and consistency than the cited studies.
Before presenting the new method, the authors focused on the radiometric correction of multispectral images based on the camera manufacturer and Pix4D software and the relative empirical line correction method. Similar studies were conducted by Poncet et al. [52]. As in the cited studies, the focus was also on selecting the appropriate number of reflection standards for relative radiometric correction. As presented by Wang and Myint [35], the acquired scene should be placed on as many reference panels as possible to ensure the proper radiometric calibration on raw images. Similar to their research, we have achieved higher data accuracy for the ELC method applied to processed images in Pix4D.
Despite the similarities, the presented studies differ because the new method of correction of each spectral channel obtained by the multispectral camera increases the accuracy of the results obtained, e.g., based on SAM coefficients or correlations, but also when distinguishing land cover types during classification. In the studies described by Poncet et al. [52], the focus was only on showing various radiometric calibration methodologies, including ELC and calibrations applied in the Pix4D software, without proposing new methods. In addition, as the authors themselves stated, radiometric calibration using empirical or manufacturer methods is required to convert raw digital numbers into reflectance and to ensure data accuracy. However, none of the currently used methods increase the accuracy of the results. Thus, the novelty of the proposed new approach is the increase in the results’ accuracy, considering the terrain’s slope.
We introduced the ELC slope correction coefficient to the basic radiometric correction method. As shown in Figure 26, the proposed modified method of radiometric correction allowed for a noticeable (5.2%) improvement in the classification accuracy while maintaining the image structure.
The processing complexity increases with the characteristics of the terrain, and the more rugged the topography, the more adjustments/iterations will be necessary. Furthermore, the various parameters are distinct in multiple swaths. This impacts the final processing time, which in this case ranges from 2 h to even a couple of days (for many multispectral images or even hyperspectral images).
Using only the camera’s exposure parameters to convert radiance from DN may change after a firmware update. Therefore, we can not only take into account manufacturers data to ensure that the energy-to-signal conversion behaviour works as expected [44,45]. Moreover, with the use of reflectance panels or in situ measurements of other objects it is possible for the camera user to conduct radiometric correction without using commercial software [44]. In order to establish accurate radiometric calibration parameters for the camera, it is necessary to use ground or on-board irradiance sensors. Thanks to this, it is possible to obtain accurate surface radiance in Wsr-1m-2, and in the further processing stage to calculate accurate surface reflectance [58,59].
In the accuracy analysis, the focus was only on the analysis of matching the spectral characteristics of the reflection. As can be seen, the worst fit was obtained for method 1, while for the proposed method 3 the results are the best (except with asphalt). For this object, the best fitting was obtained using method 2. However, due to the slight difference in the value of the SAM coefficient, we considered it negligible, as in Chilinski and Ostrowski’s research [60]. In contrast to other studies [58,59,61], high results were obtained not only for land cover objects, whose spectral reflection characteristics are similar in value to the used reflection standards for ELC correction. This is because the analysed objects were located at different heights and different inclinations, and not on a flat area, as is the case with reference panels; thus, the use of correction to take into account the factors related to the slope of the terrain yielded better results than other methods.
The proposed method of correction will allow for a reduction in the radiometric differences in the images included in the block due to the influence of the terrain slope, the angle of incidence of sunlight, and the angle of data recording. The obtained results of the quality assessment of the proposed method were compared with other studies, as presented above.

6. Conclusions

The methodology based on ELC correction and correction factors for different slope values shows high potential in its application with multispectral data from a low altitude. The proposed method of modified ELC correction allowed for a significant improvement in the surface reflectance values obtained directly from UAV multispectral images. In this paper, the effectiveness of the presented method was demonstrated for two areas with different height differences. The high resolution of UAV images allows the use of four compact reference panels, thanks to which it is possible to obtain high-quality calibration results. The performed spectroradiometric measurements allowed for an objective assessment of the results’ quality. The obtained values for the method qualify for the correct classification of the terrain at over 95%. In addition, the agreement of the spectral reflectance characteristics obtained from the image with the data obtained from direct measurements is high.
Based on the performed research, we have proven that our method is an effective method to correct the radiometric non-uniformity in UAV multispectral images, as it takes into account the spectral and spatial characteristics of the images and the specific sensors used. The accuracy of the modified empirical line correction depends on the quality of the reference data and the correct identification of the empirical line. It is recommended to use high-quality reference data and to validate the empirical line using multiple images and scenes. The empirical line correction can improve the consistency and accuracy of the radiometric information in UAV multispectral images, which is essential for various applications, such as land use and land cover mapping, crop monitoring, and environmental assessment.
Commonly used radiometric methods for UAV data are quite simple and easy to use; however, they are based only on flight parameters and DEM and reference panels used for camera radiometric calibration at the beginning of the flight. Therefore, the results are not very accurate for different land cover types, such as vegetation and artificial surfaces, especially when flight is conducted in different light conditions. Our new method is based not only on such parameters, but we also consider different land cover types; however, for now, it can be used only for the full vegetation season. Further research is needed to evaluate the performance of our new radiometric correction under different weather and geographic conditions to compare it with other radiometric correction methods. It is also important to develop more automated and user-friendly tools for empirical line correction to facilitate its application by UAV remote sensing practitioners.

Author Contributions

All authors contributed to the experimental design and participated in the collection of UAV data. All authors provided editorial advice and participated in the review process. Conceptualisation, D.W., M.K. and A.J.; methodology, D.W. and A.J.; data analysis, M.K., A.J. and D.W.; investigation, D.W., A.J. and M.K.; formal analysis, D.W.; writing—original draft, A.J. and D.W.; writing—review and editing, M.K.; project administration, M.K.; supervision, M.K.; funding acquisition, M.K. All authors have read and agreed to the published version of the manuscript.

Funding

This work was financed by Military University of Technology, Faculty of Civil Engineering and Geodesy under research project UGB grant number 815/2023 and Grant No. GB/1/2018/205/2018/DA-990.

Data Availability Statement

Not applicable.

Conflicts of Interest

The authors declare no conflict of interest.

References

  1. Honkavaara, E.; Saari, H.; Kaivosoja, J.; Pölönen, I.; Hakala, T.; Litkey, P.; Mäkynen, J.; Pesonen, L. Processing and Assessment of Spectrometric, Stereoscopic Imagery Collected Using a Lightweight UAV Spectral Camera for Precision Agriculture. Remote Sens. 2013, 5, 5006–5039. [Google Scholar] [CrossRef] [Green Version]
  2. Qiu, Z.; Feng, Z.-K.; Wang, M.; Li, Z.; Lu, C. Application of UAV Photogrammetric System for Monitoring Ancient Tree Communities in Beijing. Forests 2018, 9, 735. [Google Scholar] [CrossRef] [Green Version]
  3. Vivoni, E.R.; Rango, A.; Anderson, C.A.; Pierini, N.A.; Schreiner-McGraw, A.P.; Saripalli, S.; Laliberte, A.S. Ecohydrology with Unmanned Aerial Vehicles. Ecosphere 2014, 5, 130. [Google Scholar] [CrossRef] [Green Version]
  4. Clemens, S.R. Procedures for Correcting Digital Camera Imagery Acquired by the AggieAir Remote Sensing Platform. Master′s Thesis, Utah State University, Logan, UT, USA, 2012. [Google Scholar]
  5. Jakomulska, A.; Sobczak, M. Korekcja Radiometryczna Obrazów Satelitarnych-Metodyka i Przykłady | Radiometric Correction of Satellite Images—Methodology and Exemplification. Teledetekcja Śr. 2001, 32, 152–171. [Google Scholar]
  6. Honkavaara, E.; Khoramshahi, E. Radiometric Correction of Close-Range Spectral Image Blocks Captured Using an Unmanned Aerial Vehicle with a Radiometric Block Adjustment. Remote Sens. 2018, 10, 256. [Google Scholar] [CrossRef] [Green Version]
  7. Kedzierski, M.; Wierzbicki, D.; Sekrecka, A.; Fryskowska, A.; Walczykowski, P.; Siewert, J. Influence of Lower Atmosphere on the Radiometric Quality of Unmanned Aerial Vehicle Imagery. Remote Sens. 2019, 11, 1214. [Google Scholar] [CrossRef] [Green Version]
  8. Yu, X.; Liu, Q.; Liu, X.; Liu, X.; Wang, Y. A Physical-Based Atmospheric Correction Algorithm of Unmanned Aerial Vehicles Images and Its Utility Analysis. Int. J. Remote Sens. 2017, 38, 3101–3112. [Google Scholar] [CrossRef]
  9. Yoon, I.; Jeong, S.; Jeong, J.; Seo, D.; Paik, J. Wavelength-Adaptive Dehazing Using Histogram Merging-Based Classification for UAV Images. Sensors 2015, 15, 6633–6651. [Google Scholar] [CrossRef] [Green Version]
  10. Huang, Y.; Ding, W.; Li, H. Haze Removal for UAV Reconnaissance Images Using Layered Scattering Model. Chin. J. Aeronaut. 2016, 29, 502–511. [Google Scholar] [CrossRef] [Green Version]
  11. Teillet, P.M.; Guindon, B.; Goodenough, D.G. On the Slope-Aspect Correction of Multispectral Scanner Data. Can. J. Remote Sens. 1982, 8, 84–106. [Google Scholar] [CrossRef] [Green Version]
  12. Smith, J.; Lin, T.; Ranson, K.J. The Lambertian Assumption and Landsat Data. Photogramm. Eng. Remote Sens. 1980, 46, 1183–1189. [Google Scholar]
  13. Cavayas, F. Modelling and Correction of Topographic Effect Using Multi-Temporal Satellite Images. Can. J. Remote Sens. 1987, 13, 49–67. [Google Scholar] [CrossRef]
  14. Soenen, S.A.; Peddle, D.R.; Coburn, C.A.; Hall, R.J.; Hall, F.G. Improved topographic correction of forest image data using a 3-D canopy reflectance model in multiple forward mode. Int. J. Remote Sens. 2008, 29, 1007–1027. [Google Scholar] [CrossRef]
  15. Proy, C.; Tanre, D.; Deschamps, P. Evaluation of Topographic Effects in Remotely Sensed Data. Remote Sens. Environ. 1989, 30, 21–32. [Google Scholar] [CrossRef]
  16. Kimes, D.S.; Kirchner, J.A. Modeling the Effects of Various Radiant Transfers in Mountainous Terrain on Sensor Response. IEEE Trans. Geosci. Remote Sens. 1981, GE-19, 100–108. [Google Scholar] [CrossRef]
  17. Conese, C. Topographic Normalization of TM Scenes through the Use of an Atmospheric Correction Method and Digital Terrain Model. Photogramm. Eng. Remote Sens. 1993, 59, 1745–1753. [Google Scholar]
  18. Du, Y.; Teillet, P.M.; Cihlar, J. Radiometric Normalization of Multitemporal High-Resolution Satellite Images with Quality Control for Land Cover Change Detection. Remote Sens. Environ. 2002, 82, 123–134. [Google Scholar] [CrossRef]
  19. Yan, W.Y.; van Ewijk, K.; Treitz, P.; Shaker, A. Effects of Radiometric Correction on Cover Type and Spatial Resolution for Modeling Plot Level Forest Attributes Using Multispectral Airborne LiDAR Data. ISPRS J. Photogramm. Remote Sens. 2020, 169, 152–165. [Google Scholar] [CrossRef]
  20. Koukal, T.; Suppan, F.; Schneider, W. The Impact of Relative Radiometric Calibration on the Accuracy of KNN-Predictions of Forest Attributes. Remote Sens. Environ. 2007, 110, 431–437. [Google Scholar] [CrossRef]
  21. Hakala, T.; Markelin, L.; Honkavaara, E.; Scott, B.; Theocharous, T.; Nevalainen, O.; Näsi, R.; Suomalainen, J.; Viljanen, N.; Greenwell, C.; et al. Direct Reflectance Measurements from Drones: Sensor Absolute Radiometric Calibration and System Tests for Forest Reflectance Characterization. Sensors 2018, 18, 1417. [Google Scholar] [CrossRef] [Green Version]
  22. Shin, J.-I.; Cho, Y.-M.; Lim, P.-C.; Lee, H.-M.; Ahn, H.-Y.; Park, C.-W.; Kim, T. Relative Radiometric Calibration Using Tie Points and Optimal Path Selection for UAV Images. Remote Sens. 2020, 12, 1726. [Google Scholar] [CrossRef]
  23. Helder, D.; Anderson, C.; Beckett, K.; Houborg, R.; Zuleta, I.; Boccia, V.; Clerc, S.; Kuester, M.; Markham, B.; Pagnutti, M. Observations and Recommendations for Coordinated Calibration Activities of Government and Commercial Optical Satellite Systems. Remote Sens. 2020, 12, 2468. [Google Scholar] [CrossRef]
  24. Luo, S.; Jiang, X.; Yang, K.; Li, Y.; Fang, S. Multispectral Remote Sensing for Accurate Acquisition of Rice Phenotypes: Impacts of Radiometric Calibration and Unmanned Aerial Vehicle Flying Altitudes. Front. Plant Sci. 2022, 13, 958106. [Google Scholar] [CrossRef] [PubMed]
  25. Mitchell, N.S.; Bakhtazad, A.; Sabarinathan, J. Customized Shape Detection Algorithms for Radiometric Calibration of Multispectral Imagers for Precision Agriculture Applications. In Proceedings of the 2020 IEEE Canadian Conference on Electrical and Computer Engineering (CCECE), London, ON, Canada, 30 August–2 September 2020; IEEE: Piscataway, NJ, USA, 2020; pp. 1–4. [Google Scholar]
  26. Shin, T.; Jeong, S.; Ko, J. Development of a Radiometric Calibration Method for Multispectral Images of Croplands Obtained with a Remote-Controlled Aerial System. Remote Sens. 2023, 15, 1408. [Google Scholar] [CrossRef]
  27. Siok, K.; Jenerowicz, A.; Ewiak, I. A Simulation Approach to the Spectral Quality of Multispectral Images Enhancement. Comput. Electron. Agric. 2020, 174, 105432. [Google Scholar] [CrossRef]
  28. Ren, H. Relative Radiometric Calibration for Multispectral Remote Sensing Imagery; Christesen, S.D., Sedlacek, A.J., III., Gillespie, J.B., Ewing, K.J., Eds.; SPIE: Bellingham, WA, USA, 2006; p. 63781F. [Google Scholar]
  29. Paolini, L.; Grings, F.; Sobrino, J.A.; Jiménez Muñoz, J.C.; Karszenbaum, H. Radiometric Correction Effects in Landsat Multi-date/Multi-Sensor Change Detection Studies. Int. J. Remote Sens. 2006, 27, 685–704. [Google Scholar] [CrossRef]
  30. Khadka, N.; Teixeira Pinto, C.; Leigh, L. Detection of Change Points in Pseudo-Invariant Calibration Sites Time Series Using Multi-Sensor Satellite Imagery. Remote Sens. 2021, 13, 2079. [Google Scholar] [CrossRef]
  31. Soenen, S.A.; Peddle, D.R.; Coburn, C.A. SCS+C: A Modified Sun-Canopy-Sensor Topographic Correction in Forested Terrain. IEEE Trans. Geosci. Remote Sens. 2005, 43, 2148–2159. [Google Scholar] [CrossRef]
  32. Richter, R. Atmospheric/Topographic Correction: Model ATCOR3 (User Manual) Ver. 3.0. October 1998, DLR-IB 552-05/98; DLR Institute of Optoelectronics: Weßling, Germany, 2006. [Google Scholar]
  33. do Carmo, A.F.C.; Bernardo, N.M.R.; Imai, N.N.; Shimabukuro, M.H. Improving the Empirical Line Method Applied to Hyperspectral Inland Water Images by Combining Reference Targets and in Situ Water Measurements. Remote Sens. Lett. 2020, 11, 186–194. [Google Scholar] [CrossRef]
  34. Wang, C.; Myint, S.W. A Simplified Empirical Line Method of Radiometric Calibration for Small Unmanned Aircraft Systems-Based Remote Sensing. IEEE J. Sel. Top. Appl. Earth Obs. Remote Sens. 2015, 8, 1876–1885. [Google Scholar] [CrossRef]
  35. Herrero-Huerta, M.; Hernández-López, D.; Rodriguez-Gonzalvez, P.; González-Aguilera, D.; González-Piqueras, J. Vicarious Radiometric Calibration of a Multispectral Sensor from an Aerial Trike Applied to Precision Agriculture. Comput. Electron. Agric. 2014, 108, 28–38. [Google Scholar] [CrossRef]
  36. Chavez, P.S. Radiometric Calibration of Landsat Thematic Mapper Multispectral Images. Photogramm. Eng. Remote Sens. 1989, 55, 1285–1294. [Google Scholar]
  37. Karpouzli, E.; Malthus, T. The Empirical Line Method for the Atmospheric Correction of IKONOS Imagery. Int. J. Remote Sens. 2003, 24, 1143–1150. [Google Scholar] [CrossRef]
  38. Gao, Y.; Zhang, W. A Simple Empirical Topographic Correction Method for ETM+ Imagery. Int. J. Remote Sens. 2009, 30, 2259–2275. [Google Scholar] [CrossRef]
  39. Ma, Z.; Jia, G.; Schaepman, M.E.; Zhao, H. Uncertainty Analysis for Topographic Correction of Hyperspectral Remote Sensing Images. Remote Sens. 2020, 12, 705. [Google Scholar] [CrossRef] [Green Version]
  40. Vincini, M.; Reeder, D. Seasonal Changes of Minnaert Topographic Normalization Constants (Ks) in Rugged Deciduous Forest Areas. In Proceedings of the IGARSS 2000. IEEE 2000 International Geoscience and Remote Sensing Symposium. Taking the Pulse of the Planet: The Role of Remote Sensing in Managing the Environment. Proceedings (Cat. No.00CH37120), Honolulu, HI, USA, 24–28 July 2000; IEEE: Piscataway, NJ, USA, 2000; pp. 1603–1605. [Google Scholar]
  41. Qiu, S.; Lin, Y.; Shang, R.; Zhang, J.; Ma, L.; Zhu, Z. Making Landsat Time Series Consistent: Evaluating and Improving Landsat Analysis Ready Data. Remote Sens. 2018, 11, 51. [Google Scholar] [CrossRef] [Green Version]
  42. Reese, H.; Olsson, H. C-Correction of Optical Satellite Data over Alpine Vegetation Areas: A Comparison of Sampling Strategies for Determining the Empirical C-Parameter. Remote Sens. Environ. 2011, 115, 1387–1400. [Google Scholar] [CrossRef] [Green Version]
  43. Smith, G.M.; Milton, E.J. The Use of the Empirical Line Method to Calibrate Remotely Sensed Data to Reflectance. Int. J. Remote Sens. 1999, 20, 2653–2662. [Google Scholar] [CrossRef]
  44. MicaSense, Inc. Support Micasense. 2022. Available online: https://support.micasense.com/hc/en-us/articles/360039671254-User-Guide-for-MicaSense-Sensors (accessed on 19 January 2023).
  45. Walczykowski, P.; Orych, A.; Dąbrowski, R. Designing a Modern Measuring Station for Obtaining Spectral Response Characteristics in Laboratory Conditions. In Proceedings of the the 1st Research Conference in Technical Disciplines, Slovakia, 18–22 November 2013; 2013; pp. 121–124. [Google Scholar]
  46. Walczykowski, P.; Jenerowicz, A.; Orych, A.; Siok, K. Determining Spectral Reflectance Coefficients from Hyperspectral Images Obtained from Low Altitudes. ISPRS—Int. Arch. Photogramm. Remote Sens. Spat. Inf. Sci. 2016, XLI-B7, 107–110. [Google Scholar] [CrossRef] [Green Version]
  47. Sekrecka, A. Application of the XBoost Regressor for an A Priori Prediction of UAV Image Quality. Remote Sens. 2021, 13, 4757. [Google Scholar] [CrossRef]
  48. Gao, B.-C.; Heidebrecht, K.B.; Goetz, A.F.H. Derivation of Scaled Surface Reflectances from AVIRIS Data. Remote Sens. Environ. 1993, 44, 165–178. [Google Scholar] [CrossRef]
  49. Bernardo, N.; Watanabe, F.; Rodrigues, T.; Alcântara, E. An Investigation into the Effectiveness of Relative and Absolute Atmospheric Correction for Retrieval the TSM Concentration in Inland Waters. Model. Earth Syst. Environ. 2016, 2, 114. [Google Scholar] [CrossRef] [Green Version]
  50. Support Pix4D Radiometric Correction. 2022. Available online: https://support.pix4d.com/hc/en-us/articles/202559509-Radiometric-corrections (accessed on 19 January 2023).
  51. Poncet, A.M.; Knappenberger, T.; Brodbeck, C.; Fogle, M.; Shaw, J.N.; Ortiz, B.V. Multispectral UAS Data Accuracy for Different Radiometric Calibration Methods. Remote Sens. 2019, 11, 1917. [Google Scholar] [CrossRef] [Green Version]
  52. Zhou, X.; Liu, C.; Xue, Y.; Akbar, A.; Jia, S.; Zhou, Y.; Zeng, D. Radiometric Calibration of a Large-Array Commodity CMOS Multispectral Camera for UAV-Borne Remote Sensing. Int. J. Appl. Earth Obs. Geoinf. 2022, 112, 102968. [Google Scholar] [CrossRef]
  53. Ortiz, J.D.; Avouris, D.; Schiller, S.; Luvall, J.C.; Lekki, J.D.; Tokars, R.P.; Anderson, R.C.; Shuchman, R.; Sayers, M.; Becker, R. Intercomparison of Approaches to the Empirical Line Method for Vicarious Hyperspectral Reflectance Calibration. Front. Mar. Sci. 2017, 4, 296. [Google Scholar] [CrossRef] [Green Version]
  54. Wald, L. Quality of High Resolution Synthesised Images: Is There a Simple Criterion ? In Proceedings of the Third Conference Fusion of Earth Data: Merging Point Measurements, Raster Maps and Remotely Sensed Images, Antibes, France, 26–28 January 2000; Ranchin, T., Wald, L., Eds.; SEE/URISCA: Antibes, France, 2000; pp. 99–103. [Google Scholar]
  55. Aiazzi, B.; Alparone, L.; Baronti, S.; Garzelli, A. Context-Driven Fusion of High Spatial and Spectral Resolution Images Based on Oversampled Multiresolution Analysis. IEEE Trans. Geosci. Remote Sens. 2002, 40, 2300–2312. [Google Scholar] [CrossRef]
  56. Cakir, H.I.; Khorram, S. Pixel Level Fusion of Panchromatic and Multispectral Images Based on Correspondence Analysis. Photogramm. Eng. Remote Sens. 2008, 74, 183–192. [Google Scholar] [CrossRef] [Green Version]
  57. Tu, Y.-H.; Phinn, S.; Johansen, K.; Robson, A. Assessing Radiometric Correction Approaches for Multi-Spectral UAS Imagery for Horticultural Applications. Remote Sens. 2018, 10, 1684. [Google Scholar] [CrossRef] [Green Version]
  58. Cao, H.; Gu, X.; Sun, Y.; Gao, H.; Tao, Z.; Shi, S. Comparing, Validating and Improving the Performance of Reflectance Obtention Method for UAV-Remote Sensing. Int. J. Appl. Earth Obs. Geoinf. 2021, 102, 102391. [Google Scholar] [CrossRef]
  59. Chiliński, M.T.; Ostrowski, M. Error Simulations of Uncorrected NDVI and DCVI during Remote Sensing Measurements from UAS. Misc. Geogr. 2014, 18, 35–45. [Google Scholar] [CrossRef] [Green Version]
  60. Siok, K.; Ewiak, I.; Jenerowicz, A. Multi-Sensor Fusion: A Simulation Approach to Pansharpening Aerial and Satellite Images. Sensors 2020, 20, 7100. [Google Scholar] [CrossRef] [PubMed]
  61. Siok, K.; Ewiak, I.; Jenerowicz, A. Enhancement of Spectral Quality of Natural Land Cover in the Pan-Sharpening Process. In Proceedings of the Image and Signal Processing for Remote Sensing XXIV, Berlin, Germany, 10–12 September 2018; International Society for Optics and Photonics: Bellingham, WA, USA, 2018; Volume 10789, pp. 513–526. [Google Scholar]
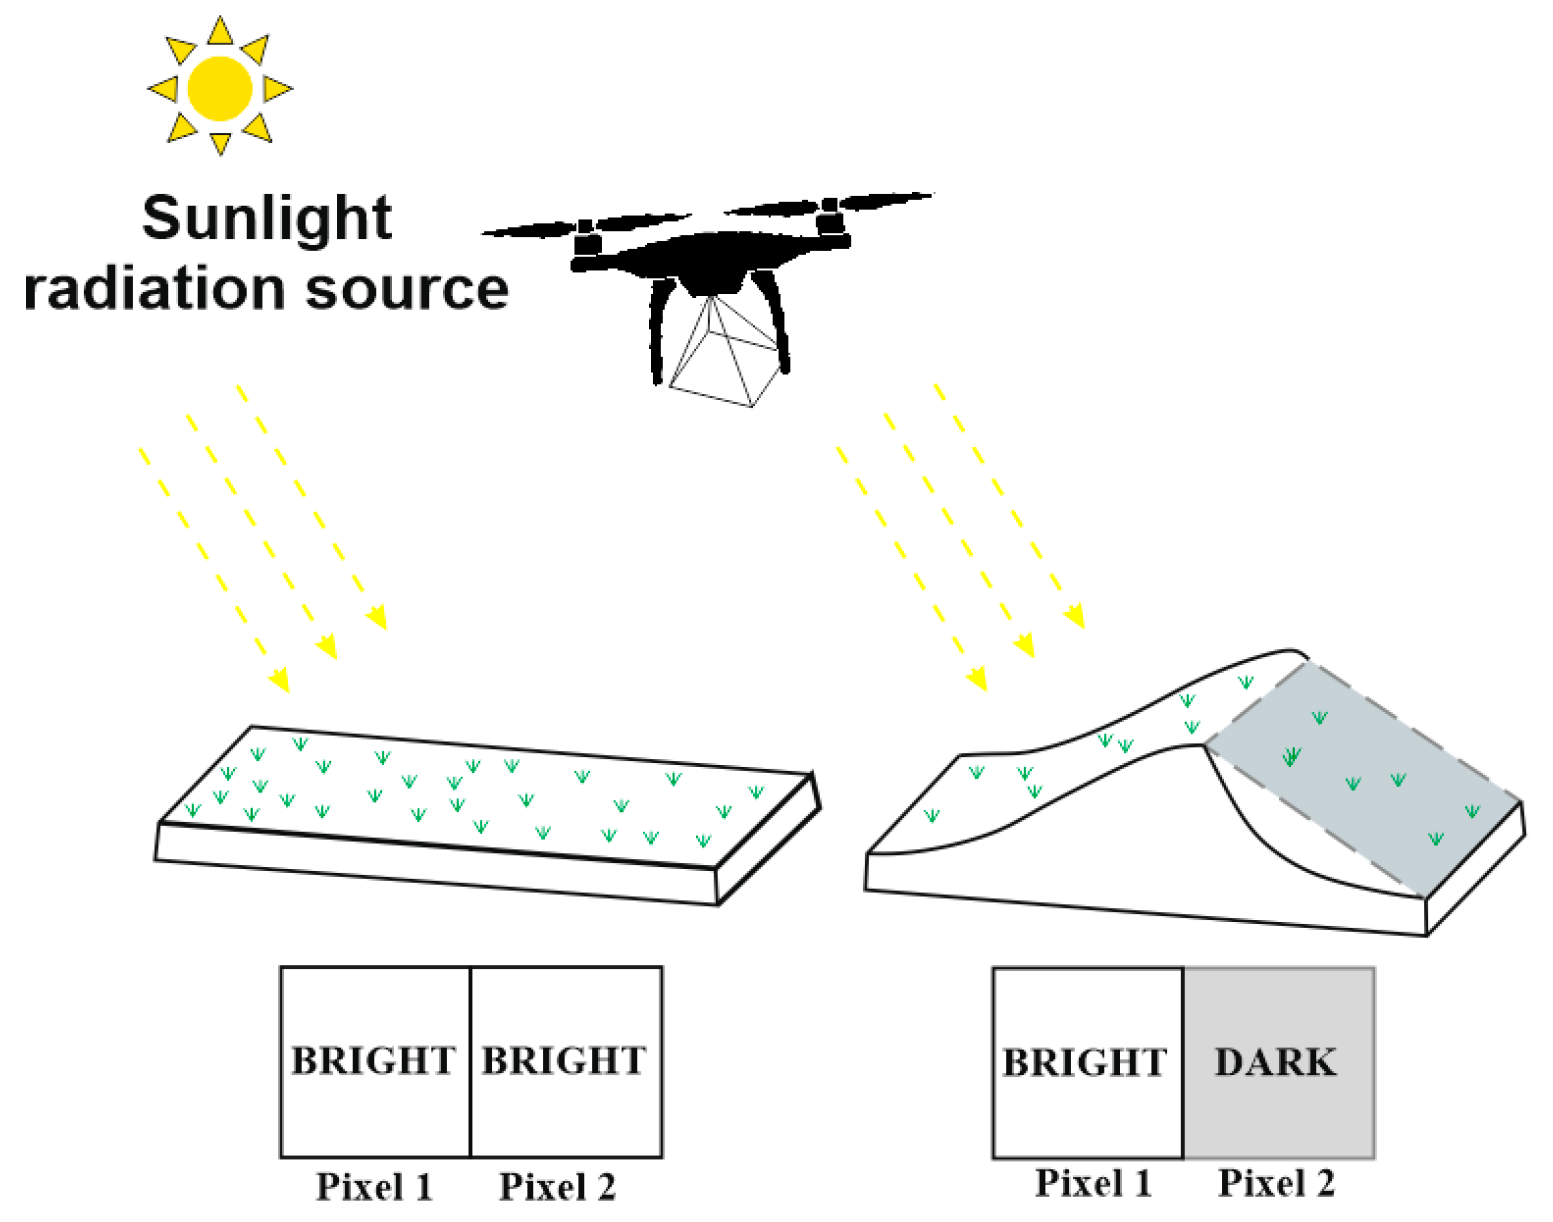
Figure 1. Influence of topography on objects acquired with imaging sensors—based on [33].
Remotesensing 15 02059 g001
Figure 2. Atmospheric correction workflow.
Remotesensing 15 02059 g002
Figure 3. The Tailsitter UAV model before the start of the flight.
Remotesensing 15 02059 g003
Figure 4. Spectroradiometer FieldSpec 4 Wide-Res.
Remotesensing 15 02059 g004
Figure 5. Measurements with Spectroradiometer FieldSpec 4 Wide-Res.
Remotesensing 15 02059 g005
Figure 6. Areas of interest.
Remotesensing 15 02059 g006
Figure 7. “Park” test site.
Remotesensing 15 02059 g007
Figure 8. “Grodzisko” test site.
Remotesensing 15 02059 g008
Figure 9. Four reference panels placed on every scene.
Remotesensing 15 02059 g009
Figure 10. DEM for “Park” test site with control points.
Remotesensing 15 02059 g010
Figure 11. DEM for “Grodzisko” test site with control points.
Remotesensing 15 02059 g011
Figure 12. RGB and CIR orthomosaics for the “Park” test site.
Remotesensing 15 02059 g012
Figure 13. RGB and CIR orthomosaics for the “Grodzisko” test site.
Remotesensing 15 02059 g013
Figure 14. Methodology concept.
Remotesensing 15 02059 g014
Figure 15. Spectral reflectance characteristics obtained during the field campaign.
Remotesensing 15 02059 g015
Figure 16. RGB and CIR orthomosaics for the “Park” test site—method 1.
Remotesensing 15 02059 g016
Figure 17. RGB and CIR orthomosaics for the “Grodzisko” test site—method 1.
Remotesensing 15 02059 g017
Figure 18. Gain and Offset functions for NIR band.
Remotesensing 15 02059 g018
Figure 19. RGB and CIR orthomosaics for the “Park” test site—method 2.
Remotesensing 15 02059 g019
Figure 20. RGB and CIR orthomosaics for the “Grodzisko” test site—method 2.
Remotesensing 15 02059 g020
Figure 21. Spectral reflectance characteristics of selected objects obtained from multispectral imagery after first radiometric correction and ELC method for different slope values.
Remotesensing 15 02059 g021
Figure 22. Regression function for RED and NIR bands.
Remotesensing 15 02059 g022
Figure 23. RGB and CIR orthomosaics for the “Park” test site—method 3.
Remotesensing 15 02059 g023
Figure 24. RGB and CIR orthomosaics for the “Grodzisko” test site—method 3.
Remotesensing 15 02059 g024
Figure 25. SAM values for spectral reflectance characteristics obtained from images after the application of three correction methods.
Remotesensing 15 02059 g025
Figure 26. (a) Classification results for method 1; OA: 89.588%. (b) Classification results for method 2; OA: 91.255%. (c) Classification results for method 3; OA: 94.749%.
Remotesensing 15 02059 g026
Table 1. Technical information about multispectral research flights.
SensorMicasense Altum
Acquisition date 25 June 2021
Acquisition time10 UTC; 12 UTC
Number of images400 per flight
Spatial resolution (cm)0.06 m
DN bit range10 bit
Solar zenith Angle (°) 56.128446
Solar azimuth Angle (°) 281.073873
Table 2. Results of correlation coefficients for each band.
Method 1Method 2Method 3
Blue0.980.980.99
Green0.970.980.99
Red0.960.970.97
RedEdge0.960.960.98
NIR0.970.960.98
Disclaimer/Publisher’s Note: The statements, opinions and data contained in all publications are solely those of the individual author(s) and contributor(s) and not of MDPI and/or the editor(s). MDPI and/or the editor(s) disclaim responsibility for any injury to people or property resulting from any ideas, methods, instructions or products referred to in the content.