Article

Water Balance Analysis of Hulun Lake, a Semi-Arid UNESCO Wetland, Using Multi-Source Data

1
Inner Mongolia Water Resource Protection and Utilization Key Laboratory, Water Conservancy and Civil Engineering College, Inner Mongolia Agricultural University, Hohhot 010018, China
2
Geological Survey Institute of Inner Mongolia, Hohhot 010020, China
3
Key Laboratory of Water and Sediment Sciences, Ministry of Education, Department of Environmental Engineering, Peking University, Beijing 100871, China
4
Lammi Biological Station, Faculty of Biological and Environmental Sciences, University of Helsinki, FI-16900 Lammi, Finland
*
Author to whom correspondence should be addressed.
Remote Sens. 2023, 15(8), 2028; https://doi.org/10.3390/rs15082028
Submission received: 18 February 2023 / Revised: 6 April 2023 / Accepted: 9 April 2023 / Published: 11 April 2023

Abstract

:
Hulun Lake is the largest lake in northeastern China, and its basin is located in China and Mongolia. This research aims to analyze the dynamic changes in the water volume of Hulun Lake and to estimate the groundwater recharge of the lake during the past 60 years. Multi-source data were used, and water-level-data-interpolation extrapolation, water-balance equations, and other methods were applied. The proportion of the contribution of each component to the quantity of water in Hulun Lake during the last 60 years was accurately calculated. Evaporation loss was the main component in the water loss in Hulun Lake. In the last 60 years, the average annual runoff into the lake was about 1.202 billion m3, and it was the factor with the largest variation range and the leading factor affecting the changes in the quantity of water in Hulun Lake. There was groundwater recharge in Hulun Lake for a long period, and the average annual groundwater recharge was about 776 million m3 (excluding leakage). The contribution ratio of the river water, groundwater, and precipitation to the recharging of Hulun Lake was about 5:3:2. The changes in the quantity of water in Hulun Lake are affected by climate change and human activities in China and Mongolia, especially those in Mongolia.

1. Introduction

Lakes and their basins are important locations for human survival, and lakes themselves are sensitive to global changes [1,2]. In the complex and vast system comprising both human and natural components, lakes are the junctions of the interactions between the various cycles of the Earth’s surface system and are important parts of the terrestrial hydrosphere [3]. Lakes are closely related to the biosphere, atmosphere, and lithosphere, and have the special functions in the regulation of regional climates, the recording of regional environmental changes, the maintenance of the balance of regional ecosystems, and breeding biodiversity [4,5]. In recent years, many lakes have experienced salinization and/or eutrophication, shrunk, or even dried up [6,7,8,9,10]. The shrinking of lakes in arid and semi-arid regions leads to their salinization, climate deterioration, the expansion of desert land, vegetation decline, and the inhibition of fish-resource proliferation. The evolution of lake expansion or shrinkage is the result of natural and human activities in lake basins. For large lakes, it is very important to understand the water balance and its evolution [11,12]. The water balance of a lake can be used to calculate the contributions of each component to the water volume of the lake, to analyze the relationships between the components, to clarify the dynamic changes in each component, and to explore the response degree of the lake-water volume to the climate and human activities.
Hulun Lake (also called Dalai Lake) is the largest lake in northern China and is located in the hinterland of the Hulun Buir grassland. The Hulun Buir grassland is a high-quality natural pasture and an important animal-husbandry production base in China. The water resources of Hulun Lake have an important impact on the local ecology and economy. The main rivers entering the lake span Mongolia and China, with a large basin area, and the relevant data are not systematic and are difficult to collect. So far, several studies have been conducted on the area, water level, and water volume of Hulun Lake.
First, in terms of the changes in the area and water level, Hwang et al. used TOEX/Poseidon altimetry to analyze the water-level changes of six inland lakes in China from 1993 to 2003 [13]. Zhang et al. used ICESAT and Landsat data to study the changes in the water levels and areas of 10 lakes with areas greater than 1000 km2 in China from 2003 to 2009 [14]. Zhou et al. used Landsat and Google Earth Engine data from 1991 to 2017 to carry out continuous dynamic monitoring of lakes with areas greater than 1 km2 in the Mongolian Plateau [15]. Li et al. used satellite images to analyze the water-level decline in Hulun Lake from 2003 to 2009 [16]. Li et al. monitored the water-level change in Hulun Lake from 2002 to 2015 using Jason -satellite data and compared it with historical data [17]. In that study, the water storage, water replenishment, and water consumption of the lake were not analyzed, nor were the reasons for the changes in the area and water level of Hulun Lake explained. The study only provided a description and analysis of the observation results.
Second, in terms of changes in water volume, Zheng et al. used satellite-altimetry data and Landsat images from 1992 to 2010 to monitor the changes in the water level and water volume of Hulun Lake [18]. Yuan et al. estimated the change in the quantity of water in Hulun Lake by using Jason and Landsat data from 2002 to 2017 and constructed a time series of the change in the water volume [19]. Liu and Yue used irregular ICESAT/Hydroweb and Landsat data from 1975 to 2015 to investigate the changes in the lake level and area and combined these two datasets to indirectly estimate the change in the water volume of Hulun Lake [20]. These studies did not use water depth or lake-bottom data, so the change in the lake’s storage capacity only depended on the change in the water level multiplied by the lake area, and the error in the influence of the structure of the lake bottom on the calculation of the lake’s water volume with the rise and fall of the water level was neglected. Similarly, the quantitative relationship between the water-replenishment and water-consumption components of the lake water was not analyzed in these studies, and the specific reasons behind the lake-water changes were not explained.
Third, in terms of water-balance calculations, Cai et al. used hydrological and climatic data, as well as satellite-based measurements and results from land-surface modelling, to develop a water-balance model to investigate the lake-water-level variations over the last five decades [21]. Li et al. analyzed the water balance from 1961 to 2002 using the evaporation calculated using the Penman model, the groundwater and slope confluence calculated using the two-parameter model, and measured data [22]. Wang et al. analyzed the water balance from 1961 to 2008 using the evaporation calculated using the Penman model [23], the water level cited from Li et al. [22], and measured data. Gao et al. investigated the water balance during 1981–2013 according to historical data, measured hydrogen- and oxygen-isotope data, and discussed the estimated proportion of the contribution of groundwater to the lake [24]. However, due to a lack of measured data, these studies either used excessive simulation data in the balance term, did not explicitly consider the difference between the measured value of the evaporation pan and the actual evaporation from the water surface when calculating the evaporation of the maximum water loss from Hulun Lake, or did not clearly explain the calculation of each component in the balance. Thus, the reliability and the credibility of the results of previous studies are limited, and further studies are needed.
The main differences between this study and other relevant studies are as follows. (1) Multi-source data were used, including data from hydrologic stations and a meteorological station, remote-sensing images, and data from previous studies, and as many measured data as possible were used to reduce the cumulative errors. (2) The evaporation-conversion coefficient was obtained using the lake-surface-evaporation test and a ground-evaporation pan, which reduced the error caused by the calculation of the maximum water consumption lost via evaporation from semi-arid lakes. (3) For years without measured water-level data, the lake-shoreline-displacement method with a fixed regular slope position was used to extrapolate the water-level data. (4) Although the calculation time step of the water-balance analysis used in this study was one year, the time-interval point was set to August every year, which was different from the 1 January date generally used by other researchers [21,24]. The influences of the expansion and hollow bulge of ice bodies in winter on the errors in the water-level and water-storage calculations was eliminated. Finally, in this study, a balance model was established to dynamically simulate the evolution of the water volume of Hulun Lake over the past 60 years, and the exact contribution of each component to the water volume of Hulun Lake was determined. The results of this study provide a basis for the protection of the water resources and water ecology of Hulun Lake.

2. Materials and Methods

2.1. Study Area and Water System

Hulun Lake (also called Dalai Lake) is the fifth largest lake in China (116°58′–117°48′E, 48°33′–49°20′N) (Figure 1). To the east are the Xing’anling Mountains, and to the west and south is the Mongolian Plateau. The lake has an irregular oblique rectangular shape, with a long northeast–southwest axis [25]. The lake has a maximum length of 93 km, a maximum width of 41 km, an annual average surface area of 2054 km2, and an average water depth of about 5 m. The area is located in the semi-arid continental temperate monsoon zone, which has an annual average precipitation of 233 mm and an annual average evaporation of 1446 mm.
Hulun Lake has a large water-surface area (nicknamed the Prairie Pearl) and is located on the Hulunbeir grassland in the Inner Mongolia Autonomous Region. Hulun Lake and the surrounding grasslands, about 7400 km2 in total, were designated a Provincial Nature Reserve in 1990, approved as a National Nature Reserve in 1992, listed by the United Nations as an International Important Wetland in January 2002, and nominated as a World Biosphere Reserve member by the United Nations Educational Scientific and Cultural Organization (UNESCO) and the Biosphere Program in November 2002 [26,27]. Along with the Hulunbeier grassland and the Daxinganling forest, Hulun Lake functions as an important ecological protection barrier in northern China and plays important roles in maintaining the regional biological diversity, protecting the ecological security of northern China and even the Huabei District, and increasing sustainable economic and social development.
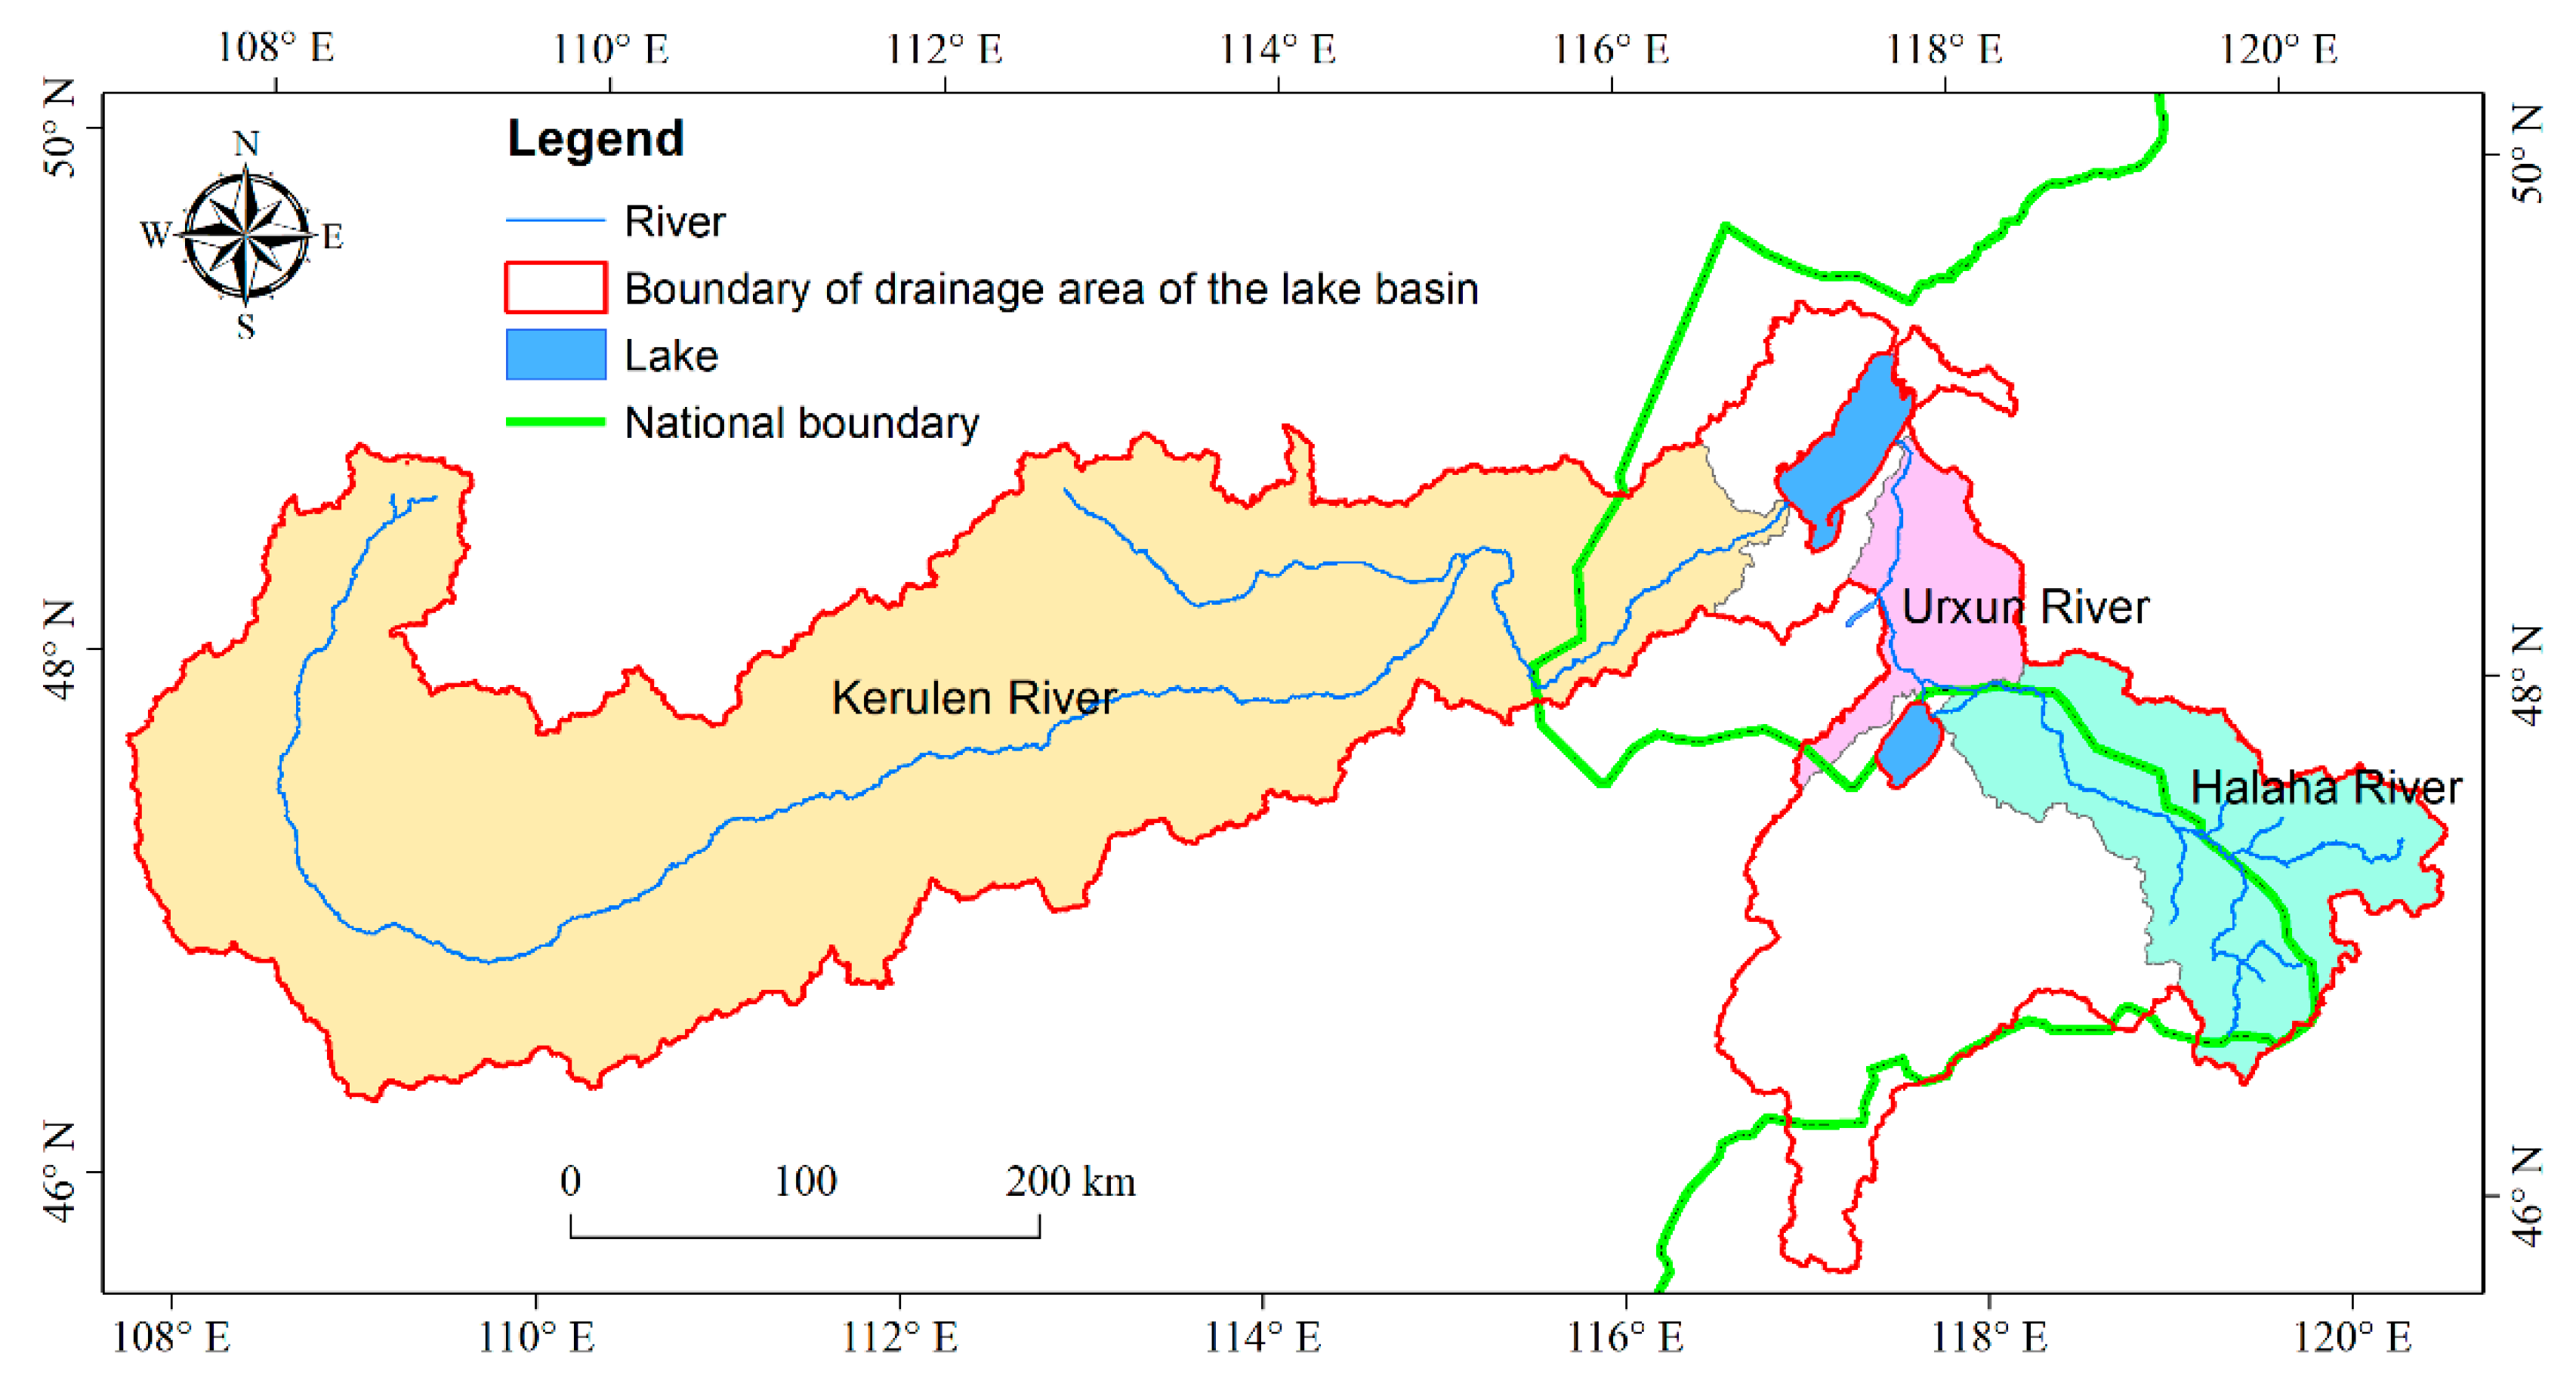
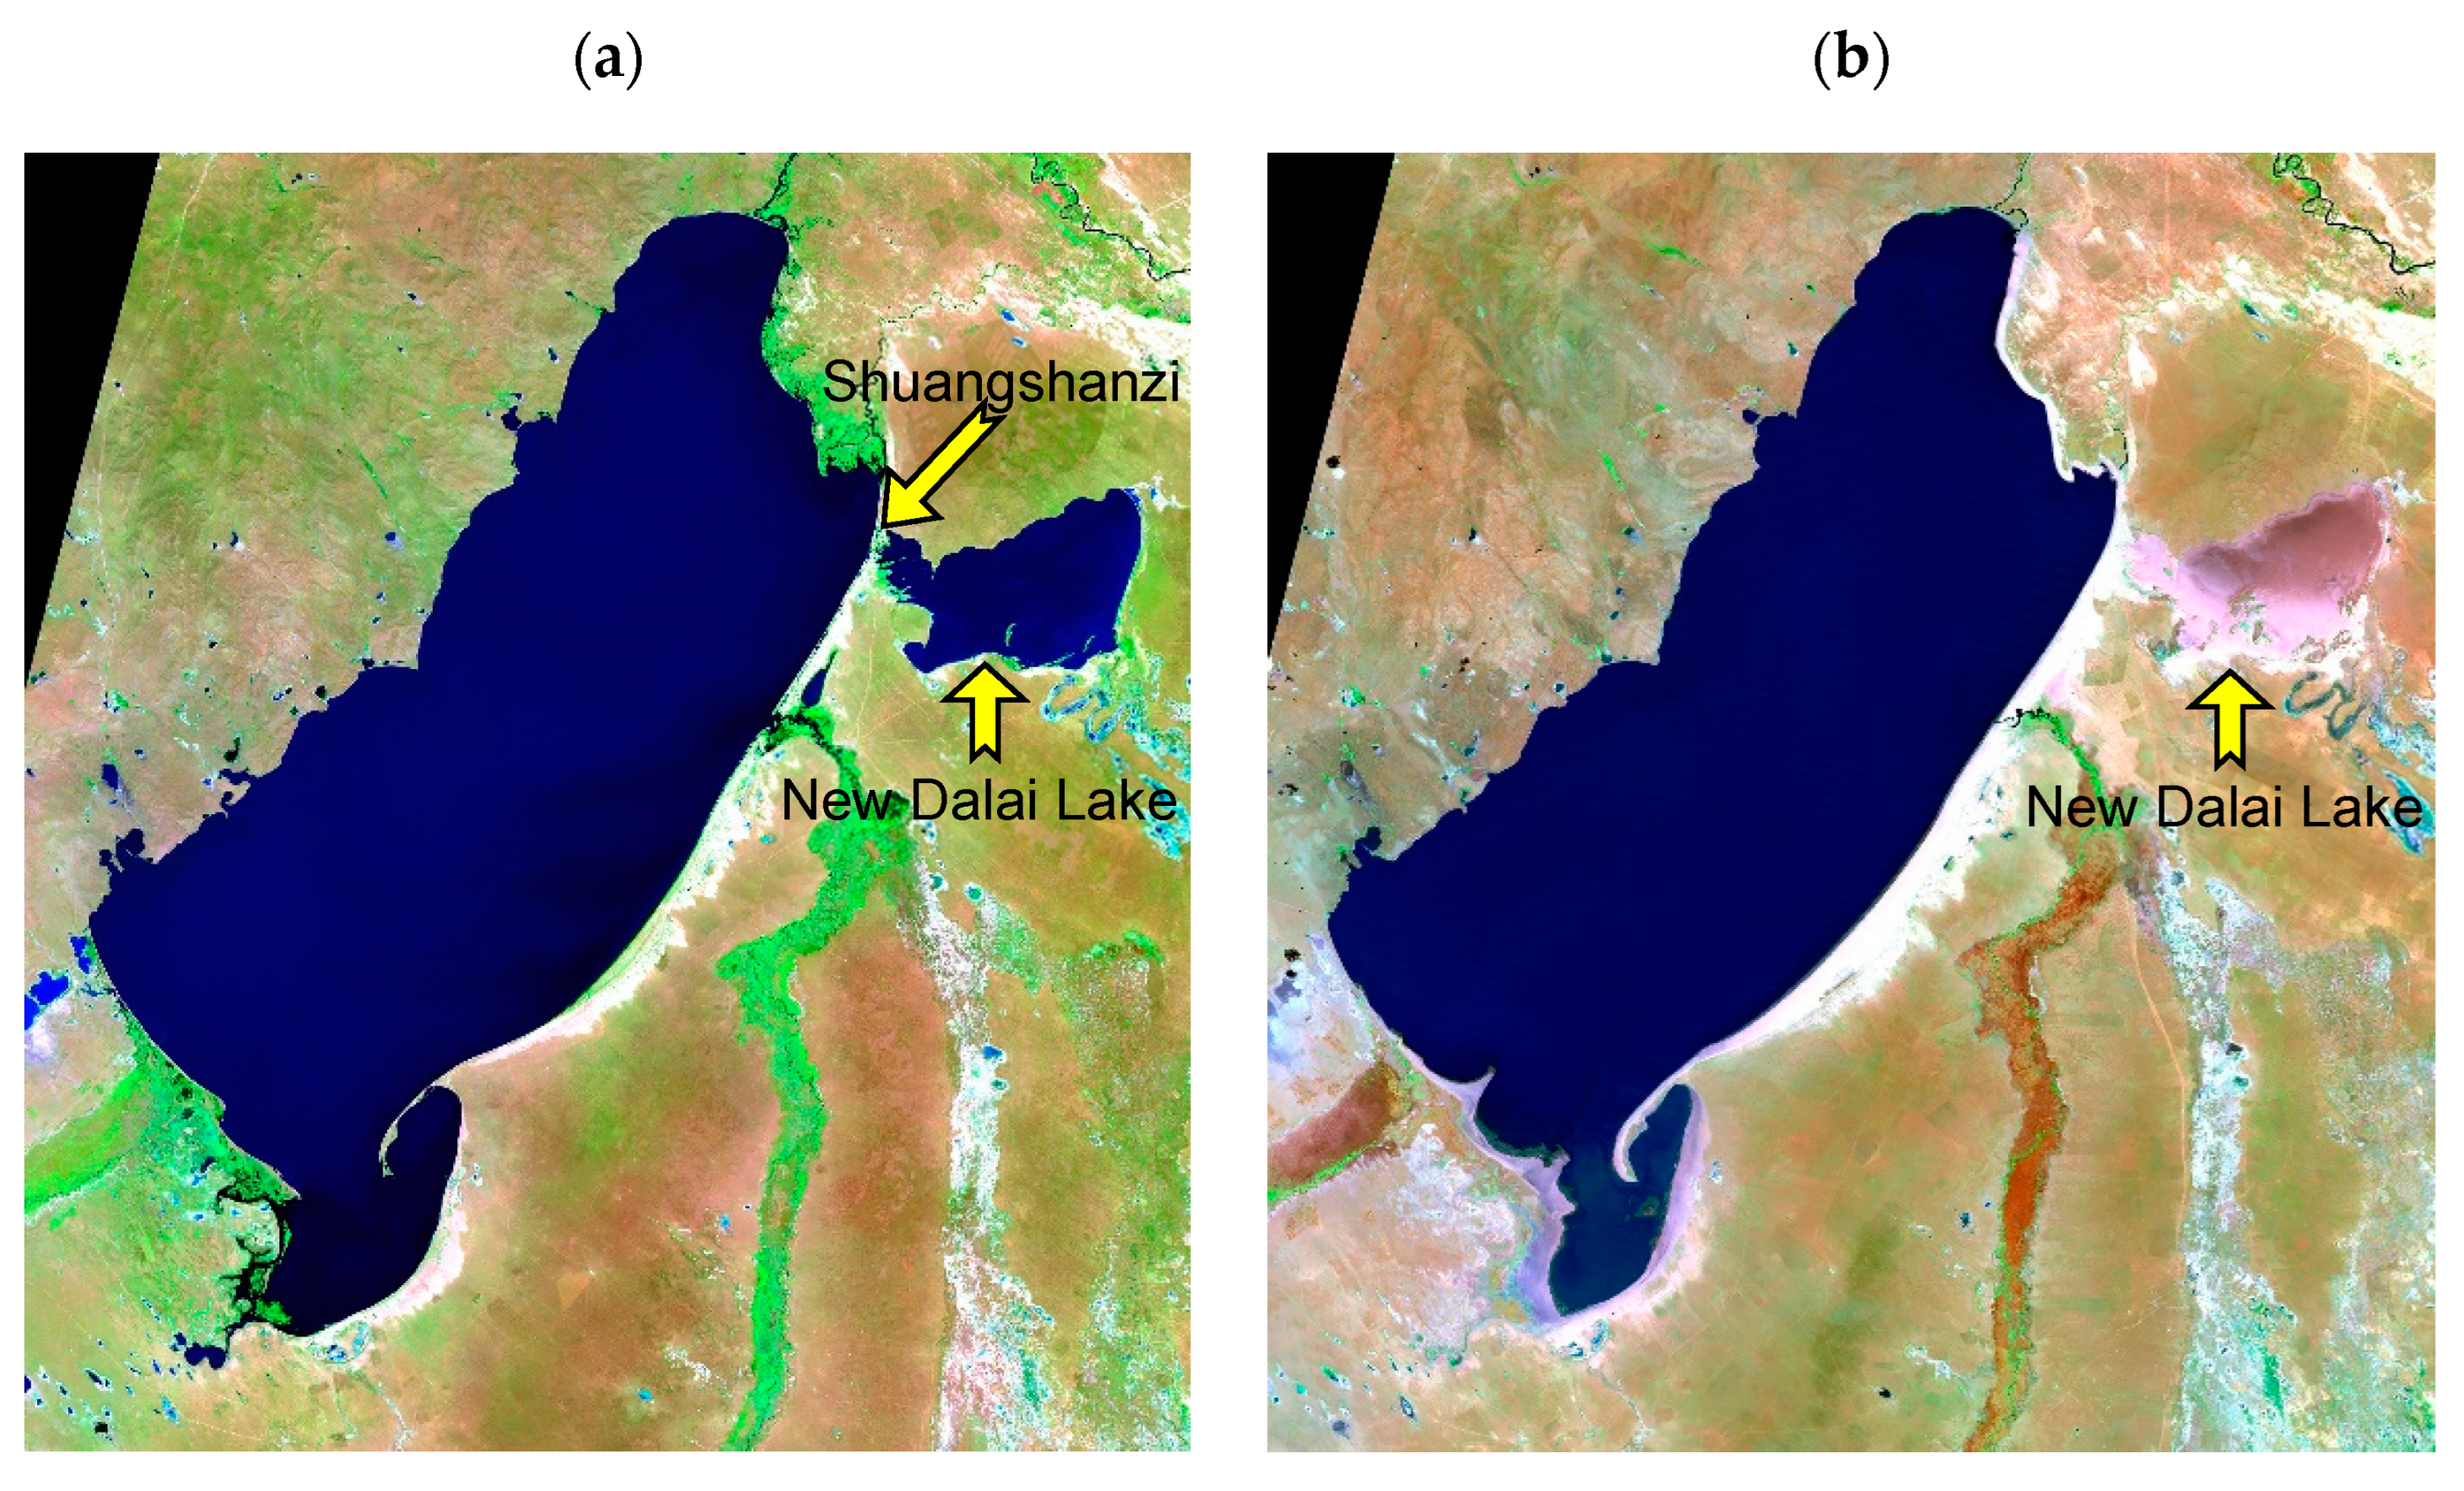
Hulun Lake is supplied by precipitation and by several rivers, including the Kerulen River, with headwaters in the Kent Mountains of the Mongolian People’s Republic and the Urxun River (Figure 2), which flows from the Halaha River and Buir Lake. These two rivers have large amounts of water and are the main water sources of Hulun Lake. The Dalaneluomu River, which is located to the northeast of Hulun Lake, is a dual-flow-direction river and has connected Hulun Lake with the Hailar River and the Erguna River for the last few hundred years. It flows towards Hulun Lake when the Hailar River has a higher water level and towards the Erguna River when Hulun Lake has a higher water level [22]. Around 1960, the water level of Hulun Lake rose sharply, which affected the production in the Zhalainuoer coal mine near the Dalaneluomu River, so a river-diversion project was conducted nearby, which was completed in 1971. The new artificial river channel is called the Xinkai River, and sluices were added at both ends of the river [28]. Since then, the connections between Hulun Lake and the Hailar River and the Erguna water system have been essentially cut off. Other than the rivers described above, Hulun Lake has no other discharge rivers. On the east side of Hulun Lake, there is a small lake, which the locals call New Dalai Lake (Figure 3). Due to the high water level of Hulun Lake in the 1960s, a breach was formed in Shuangshanzi (in 1965), and the water discharged eastward, forming the small lake. Since then, when the water level of Hulun Lake is higher than 544.8 m, the lake water is discharged into New Dalai Lake, and this has become the discharge direction for the water in Hulun Lake. In subsequent decades, New Dalai Lake changed in size, with a maximum area of 147 km2, and no water has flowed into it since it dried up completely in 2005.

2.2. Data Sources and Extrapolation

2.2.1. Hydrological-, Meteorological-, and Remote-Sensing-Data Sources

The hydrological and meteorological data in this paper were sourced from local hydrological-observation stations and meteorological-observation stations. The distributions of the meteorological and hydrological stations around Hulun Lake are shown in Figure 1. The remote-sensing-image data are Landsat-series data from the database of the Institute of Remote Sensing and Digital Earth, Chinese Academy of Sciences, and they can be downloaded for free (http://ids.ceode.ac.cn/Index.aspx, accessed on 12 September 2020). The downloaded image data were calibrated using the geographic coordinates, so that the lake area and the horizontal position of the lake’s shoreline could be accurately obtained. The details of the data sources are as follows: (i) the precipitation and evaporation were recorded at Manzhouli, Xinbaerhuzuoqi, and Xinbaerhuyouqi stations during 1960–2019; (ii) the runoff was recorded at Alatanemole and Kundulen stations during 1962–2019; (iii) the lake-water level was measured at Dalai station during 1960–1982 and was estimated from Landsat data for 1983–2019; and (iv) the lake area was estimated from Landsat data for 1973 and 1983–2019.

2.2.2. Extrapolation of Water-Level Data

The Dalai Hydrological Station is located on the western bank of Hulun Lake. It was built in October 1958 and was decommissioned in June 1984. The water-level-observation data are from 1960 to the end of 1982, and no water-level-observation data were collected after 1983. Since, in water-balance calculations, the water level is a very important observation datum, in this paper, the remote-sensing-image data and the field-survey water-level trace line of Hulun Lake were used for the data extrapolation in order to obtain the water level on the date of the remote-sensing image. The clear remote-sensing images without cloud cover were selected around August 1 every summer from 1983 to present. This water-level-data-extrapolation method is referred to as the lake-shoreline-displacement method with a fixed regular slope position in this paper, and the details of this method are as follows.
First, remote-sensing images were used to extract the lake shoreline of Hulun Lake from 1983 to 2016 and in 1973. The shoreline of Hulun Lake changed little from 1983 to 1999. The lake area shrank and the water level fell more severely from 2000 to 2009, and the lake shorelines during these ten years are superimposed in Figure 4a. As shown in Figure 4a, when the water level of Hulun Lake dropped, the lake’s shoreline did not change significantly in the images because of the cliff or steep slope of the geological-fault lakeshore on the western side of the lake. The main changes in the shoreline occurred on the southern and eastern sides of the lake, and the changes on the southern side were more disorderly and had no obvious rule. The eastern shoreline of the lake exhibited regular displacement due to the topography. The position of the box in Figure 4a is the partially enlarged area in Figure 4b. The right-most line is the position of the lake’s shoreline in August 2000, which is also the year when the lake was the largest in recent decades. The second line from the right is the position of the lake’s shoreline in August 1973. The third line from the right is the position of the lake’s shoreline in the summer from 2001 to 2009.
As shown in Figure 4b, the eastern shoreline of Hulun Lake receded regularly as the water level decreased. The main reason for this situation is that this area is composed of gently sloping lacustrine alluvial deposits, with a uniform slope and a large distribution range. According to the terrain characteristics and field investigations, the water-level data can be prolonged accurately. Figure 5 shows a comparison of photographs of a cultural attraction (i.e., the stone used to tie the horse for Genghis Khan) on the west bank of Hulun Lake in the summers of 2000 and 2007. It can be seen that the water level dropped significantly, and the highest water level made a mark at this site, which could be clearly identified in 2000. According to the field surveys conducted at this site in recent years, the water level in August 2007 was 3.33 m lower than the maximum water mark for 2000. According to the position of the lake’s shoreline extracted from the remote-sensing image, the distance between the horizontal position of the lake’s shoreline in the summers of 2000 and 2007 was 1901 m, which was obtained using the measuring tool in ArcGIS for the area shown in Figure 4b. In 2009, our team used surveying and mapping instruments to measure the topographic slope of this location, and the measured slope was 0.175%, which is consistent with the calculation results of the remote-sensing-image and field survey. Thus, the position of the lake’s shoreline in this region exhibited regular displacement with the change in the water level; that is, the lake’s shoreline at the position shown in Figure 4b receded by 570.9 m for every 1-m drop in the water level of Hulun Lake.
In conclusion, the water level measured at the hydrological observation stations in the summer of 1973 and the positions of the lake’s shoreline extracted from the remote-sensing images acquired in 1973 and 1983–2019 were used to extrapolate the water level of Hulun Lake in the summers of 1983–2019. First, the horizontal distance of the lake’s shoreline between the calculated year and 1973 was measured using ArcGIS. The distance multiplied by 0.175% (local slope) was the water-level difference between the calculated year and 1973. The water level in the calculated year was obtained by adding or subtracting the measured water-level value in 1973 and the water-level difference. If the lake’s shoreline was located outside the 1973 shoreline, the value was positive; and if the lake’s shoreline was located inside the 1973 shoreline, the value was negative. For example, the water level of Hulun Lake in the summer of 1973 was 544.3 m, the horizontal distance between the 2000 and 1973 shorelines measured using ArcGIS was 280 m, and the shoreline in 2000 was located outside the 1973 shoreline. Thus, 280 m × 0.175% (local slope) = 0.49 m was the water-level difference between 2000 and 1973, and the water level on the date the image was acquired in 2000 was about 544.3 m + 0.49 m = 544.79 m. The ground resolution of the Landsat-series images was 30 m, and according to the field topography of Hulun Lake, the water-level-extrapolation error of Hulun Lake was less than 0.05 m. The water-level value obtained using the lake-shoreline-displacement method with a fixed regular slope position is more reliable than the results of other studies [21,22] that used model-simulation values calibrated without measured data in the water-balance calculations to extrapolate the water level. This method can also be applied to similar lakes with fixed slopes and regular displacement of the shoreline, and the change in the water level can be used to interpolate and extrapolate the water-level data.

2.3. Establishment of the Water-Balance Equation

2.3.1. General Water-Balance Equation for the Lake

In order to better reveal the changes in the components of the lake water, it was necessary to establish the water-balance equation. For any lake, the general water-balance equation is as follows:
Δ V / Δ t = Q I n Q O u t
where ΔVt is the storage variable of the lake water during a given period, QIn is the amount of water that flows into the lake during a given period, and QOut is the amount of water that flows out of the lake during a given period.

2.3.2. Water-Balance Equation for Hulun Lake

No water is used for industry and agriculture around Hulun Lake, and the small amount of drinking water for livestock can be ignored. Therefore, the water-balance equation for Hulun Lake can be further refined and determined, as follows:
Δ V / Δ t = Q P + Q R - i n + Q o v e r l a n d + Q G - i n Q E Q R - o u t Q G - o u t
where ΔVt is the storage variable of Hulun Lake’s water during a given period, QP is the amount of precipitation received by the surface of Hulun Lake during a given period, QR-in is the amount of water running off into Hulun Lake during a given period, Qoverland is the amount of water flowing directly into Hulun Lake from the slope confluence during a given period, QG-in is the amount of groundwater recharge flowing into Hulun Lake during a given period, QE is the amount of water evaporated from the surface of Hulun Lake during a given period, QR-out is the amount of water outflow from Hulun Lake during a given period, and QG-out is the amount of water leakage from the Hulun Lake into the groundwater during a given period.

2.3.3. Correction of Equation Terms Based on the Actual Situation

Due to the limited data available for the study area, the accurate values of some of the terms in the balance equation cannot be determined. In particular, there may be underground runoff and groundwater recharge to Hulun Lake, but there is no effective measurement method or data accumulation for the amount of groundwater recharge into the lake, so QG-in cannot be determined. Similarly, QG-out cannot be determined because there is no effective measurement method or data accumulation for the leakage of water from Hulun Lake into the groundwater. In terms of the water discharge, QR-out cannot be determined because the overflow of the lake water and the outflow of water into the Xinkai River were not measured.
Therefore, the three equation items above without accurate values were combined into one term, as follows:
Q o t h e r = Q G - i n Q R - o u t Q G - o u t
where Qother is the amount of the combined term for the terms that cannot be determined for Hulun Lake during a given period.
Substituting Equation (3) into Equation (2) gives
Δ V / Δ t = Q P + Q R - i n + Q o v e r l a n d Q E + Q o t h e r
In Equation (4), except for Qother, which does not have a definite value, the other five terms can be calculated from the existing data. The accurate values of Qother can be obtained through the translocation of Equation (4), as follows:
Q o t h e r = Δ V / Δ t + Q E Q P Q R - i n Q o v e r l a n d

2.4. Exact Calculation of the Equation Terms

2.4.1. Selection of Δt

The calculation time step of the water balance (Δt) in this study was one year, but it was different from the calendar year used by other researchers (who used 1 January to 31 December as the calculation period) [21,24], and the starting and ending dates in this study were chosen as around 1 August of each year to around 1 August of the next year, similar to the water year defined by the United States Geological Survey (USGS) [29]. There were three main reasons for choosing starting and ending times of around 1 August. First, the water-level data since 1983 were extrapolated using remote-sensing images combined with the actual terrain, and there was only one value each year, which only reflects the water level value on the day of the image. All of the image dates were around 1 August, so the calculation’s starting and ending dates were chosen to correspond with the image date and, thus, the actual change in the water level during this period was accurately calculated. Second, it was not feasible to choose 1 January as the time of the image to deduce the water level. During this period, the lake surface and surrounding land were covered with snow most of the time, so it was difficult to distinguish between the land and water, and the location of the lake’s shoreline could not be effectively extracted. Third, there were daily water-level data before 1983, but the period for Hulun Lake was around 1 January, so there was a large error in the measured water level due to the expansion and hollow bulge of ice bodies during this period, which did not correspond well with the actual water inflow and outflow throughout the year. This error was eliminated by selecting the water levels in the summer.

2.4.2. Change in Lake’s Storage Capacity ΔVt

The change in the lake’s storage capacity was calculated by subtracting the previous year’s storage capacity from the current year’s storage capacity. That is, ΔVt = VcVp, where Vc is the current year’s storage capacity of Hulun Lake and Vp is the previous year’s storage capacity of Hulun Lake. The lake-storage-capacity data were calculated using the water levels measured up to and including 1 August in 1982. For 1983 and subsequent dates, they were calculated using the water levels from the remote-sensing-image extrapolation, and the time was the image date.
In this paper, the digital elevation model (DEM) for Hulun Lake was used to generate a three-dimensional model for 3D analysis in ArcGIS. The lake area and storage capacity were simulated by inputting the water-level data. In particular, the DEM established for the bottom of Hulun Lake was the result of the author’s previous research [30], which can be used to more accurately reflect the relationships between the water level and the storage capacity and the water level and the area of Hulun Lake.

2.4.3. Evaporation Volume from Lake Surface QE

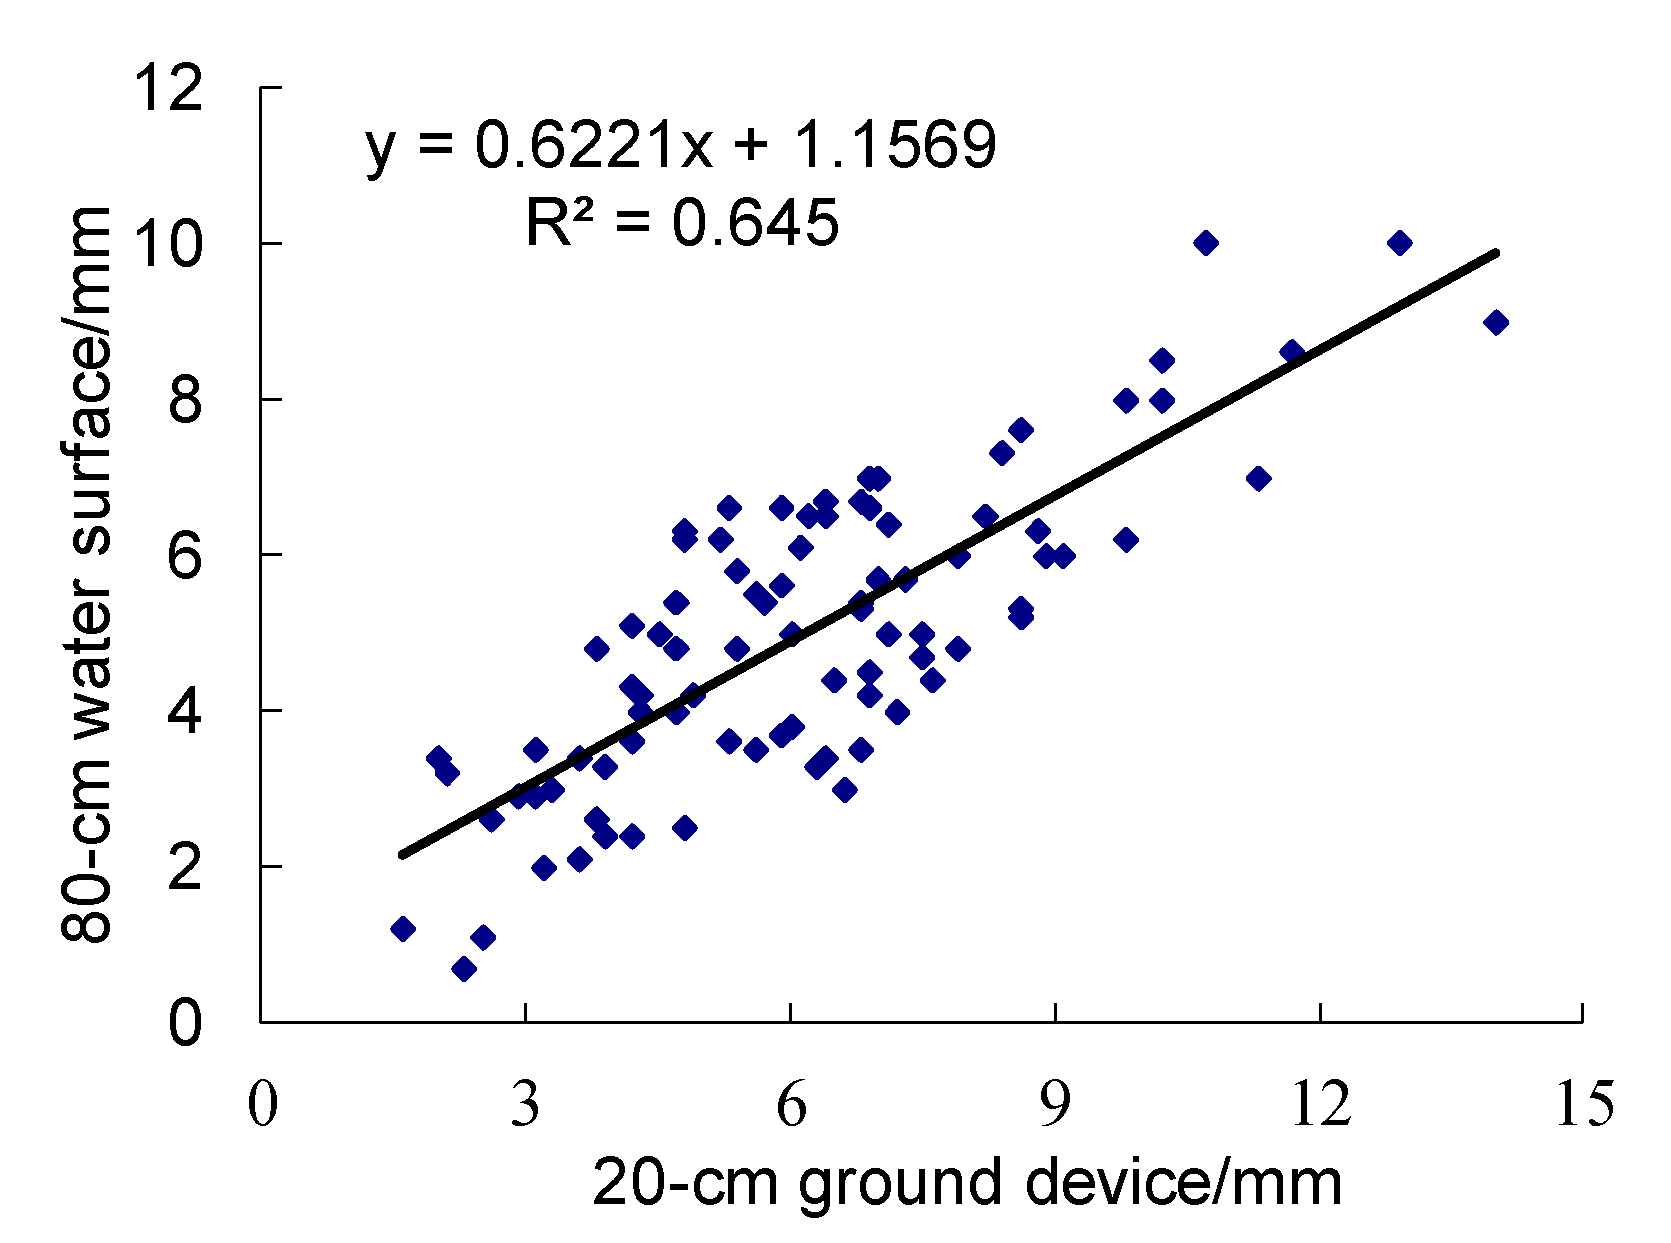
Lake-surface evaporation is a very important term in the lake-water-balance equation. The long series evaporation data for the Hulun Lake area, which were collected by the meteorological department using 20-cm ground-evaporation equipment, needed to be converted into the actual evaporation from the lake’s surface. In order to determine the relationship between the 20-cm ground-evaporation measurements and the actual lake-surface evaporation, the local hydrological department conducted a 4-month comparative experiment involving daily evaporation observations. An 80-cm-diameter evaporator was installed on the surface of the lake and fixed on a small stationary wooden raft on the lake’s surface. The relationship between the measured data is shown in Figure 6. As Figure 6 shows, there was a good correlation between the 20-cm ground evaporation and the evaporation at the water surface, and the evaporation value at the water surface was less than that of the 20-cm ground evaporation. In this study, the daily evaporation at the surface of the lake was converted from the daily observed 20-cm ground evaporation (y = 0.6221x + 1.1569).
The evaporation volume at the lake’s surface was calculated using QE = E × A × 10−6 (109 m3), where E is the cumulative evaporation (mm). The converted daily evaporation data (using equation y = 0.6221x + 1.1569) from the three meteorological stations in Manzhuli, Xinbaerhuyouqi, and Xinbaerhuzuoqi were obtained and the average value was calculated. The starting and ending date of the cumulative time before 1983 was 1 August for each year, the starting and ending dates for 1983 and later were the transit dates of the remote-sensing images, in order to better match the water-level data and the lake’s storage capacity. The A is the lake-surface area (km2) and represents the average of the two lake-area values on the starting and ending dates. The method used to select the starting and ending dates was the same as that described above, in which the lake’s surface area before 1983 was simulated using the three-dimensional model of the lake basin, and the lake’s surface area in 1983 and after was extracted from the remote-sensing images.

2.4.4. Amount of Precipitation Received by the Lake Surface QP

The precipitation received by the lake surface was calculated using QP = P × A × 10−6 (109 m3), where P is the cumulative precipitation. The daily precipitation data from the meteorological stations in Manzhouli, Xinbaerhuyouqi, and Xinbaerhuzuoqi around Hulun Lake were used to accumulate and calculate the average value (mm). The cumulative time was the same as in the evaporation calculation above. The A is the lake’s surface area (km2), and the calculation method used was the same as that in the evaporation calculation above.

2.4.5. Amount of Runoff Water QR-in

In this paper, QR-in was the total amount of water from the Kerulen River and the Urxun River entering the lake during the starting and ending dates (109 m3), and it was calculated using the daily accumulative flow data from the Alatanemole and Kunduleng hydrological stations on the two rivers. The selection of the starting and ending dates was the same as that above.

2.4.6. Amount of Slope-Confluence Flow into Lake Qoverland

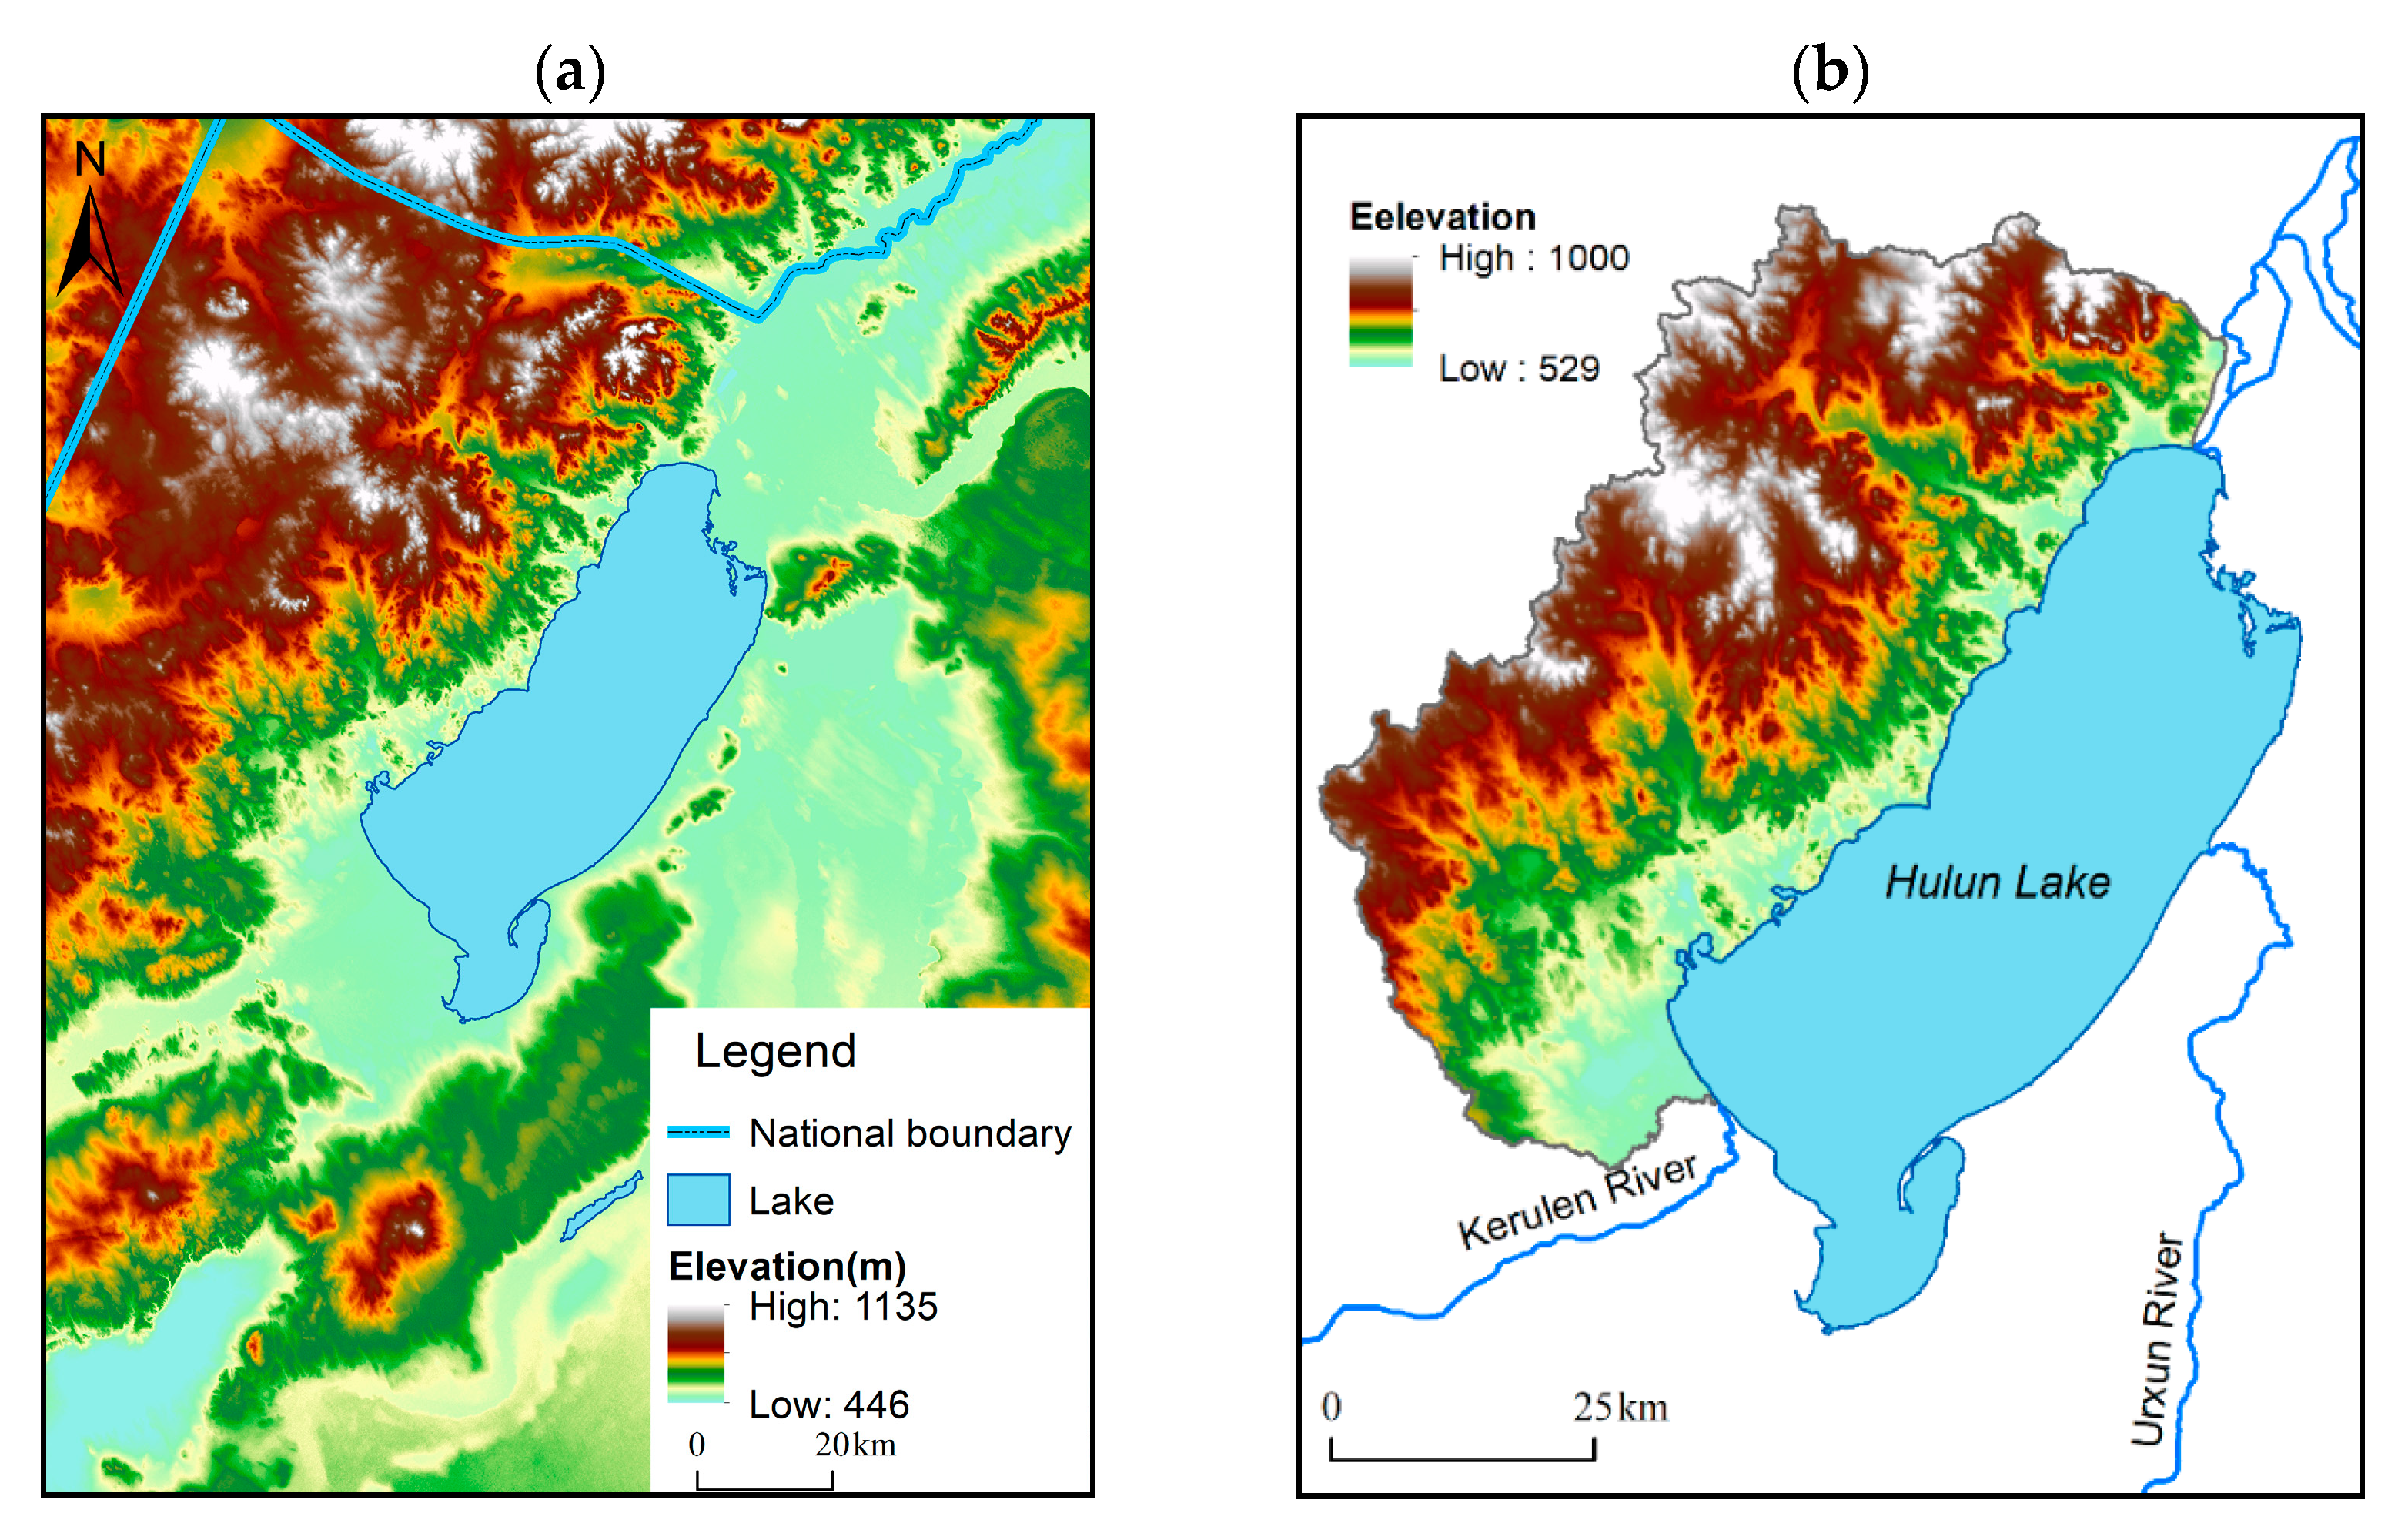
According to the surrounding topography of Hulun Lake (Figure 7a), the eastern, northern, and southern sides of the lake are relatively flat, and there is almost no slope-confluence flow into the lake under the local rainfall conditions. The western side of the lake is a low hilly area, and several seasonal ditches are distributed vertically along the lake’s shore. Water flows through the confluence into the ditches and enters the lake when the amount of rainfall is high. According to the author’s previous study on the distribution of Hulun Lake Basin [31], the distribution range of the slope-confluence area on the western side is shown in Figure 7b, with an area of about 3654.29 km2.
In this paper, the amount of slope-confluence flow into the lake Qoverland (109 m3) was calculated by multiplying the precipitation at the meteorological stations by the area of the slope confluence and the runoff coefficient. That is, Qoverland = P × 3654.29 × a × 10−6, where P is the cumulative precipitation (mm), and the calculation method was the same as that above. The a is the runoff coefficient, which was 0.1, based on previous studies of this area [32].

3. Results

3.1. Variations in the Lake’s Water Level, Surface Area, and Storage Capacity

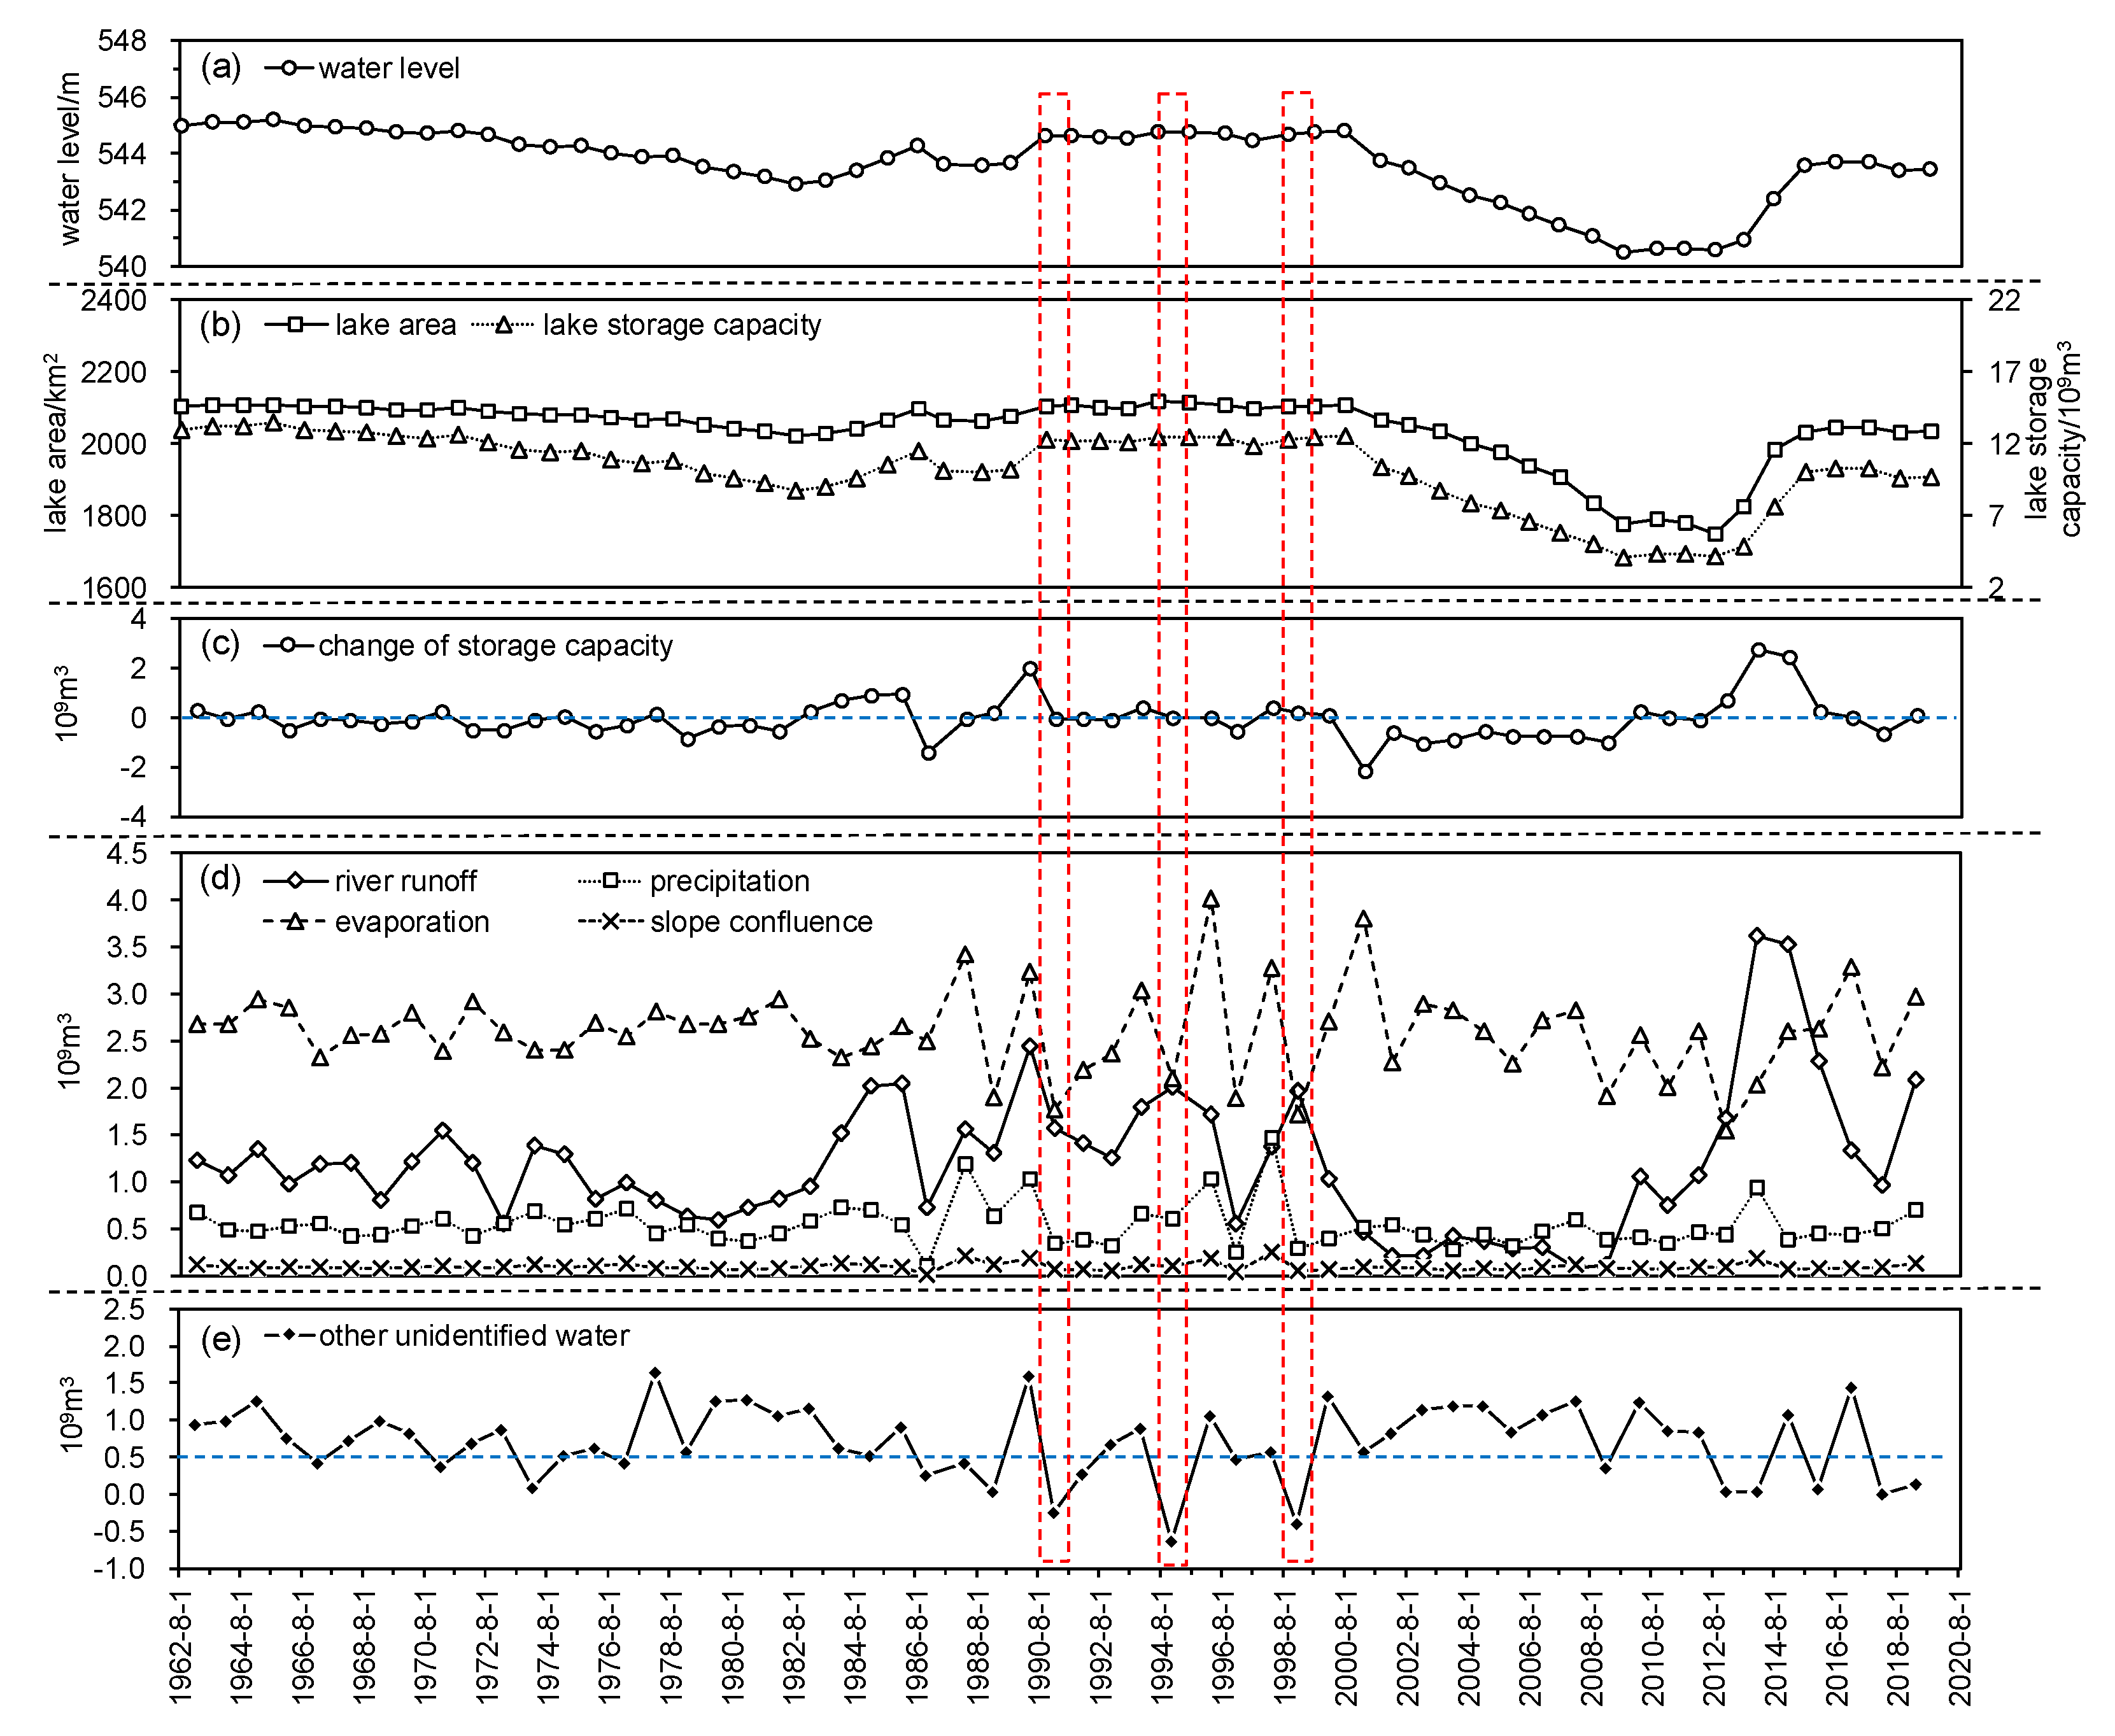
Figure 8a,b show the variations in the water level, lake surface area, and lake storage capacity of Hulun Lake at around 1 August every year over the past 60 years. Figure 8a,b show that the three terms exhibited the same variations, and the area and storage capacity changed with the water level of the lake. The following specific time periods are highlighted. From 1962 to 1982, the water level of Hulun Lake slowly decreased; the highest water level during this period was 545.21 m (the highest historical value) in 1965, and the corresponding surface area of the lake reached 2110 km2. The corresponding storage capacity of the lake was about 13.47 billion m3. During this period, the lowest water level was 542.92 m, in 1982, the corresponding surface area of the lake was about 2022.37 km2, and the corresponding storage capacity was about 8.722 billion m3. From 1982 to 1990, the volume of water in Hulun Lake exhibited a fluctuating trend of increase–decrease–increase. During the 10 years from 1990 to 2000, Hulun Lake continuously maintained a high water level, with the highest level, of 544.8 m, occurring in 2000. The corresponding storage capacity was about 12.58 billion m3, which was the highest level in nearly 30 years. From 2000 to 2009, the volume of water in Hulun Lake decreased rapidly, and the water level was 540.5 m in 2009. The area was about 1775.7 km2, and the storage capacity was less than 4.1 billion m3. About two-thirds of the water disappeared, and the maximum water depth of the lake was less than 4 m. From 2009 to 2012, the water level of Hulun Lake stopped falling and remained at a low level. From 2012 to 2015, the water volume of Hulun Lake recovered rapidly. From 2016 to 2019, the water level of Hulun Lake changed slightly and stabilized at about 543.5 m, with an area of about 2040 km2.

3.2. Variations in Change in Lake’s Storage Capacity

The water balance of Hulun Lake was calculated using Equation (5), and the variations in each equation term after the calculations are shown in Figure 8c–e. Specifically, ΔVt represents dynamic changes in the lake water, i.e., increases and/or decreases. A positive value indicates an increase in the total volume of lake water compared with the previous year, while a negative value indicates a decrease. The alternating positive and negative changes in the lake’s storage capacity reflect the quality of the state of the lake water. As shown in Figure 8c (the blue dotted line is the zero line), from 1962 to 2000, the changes in lake’s storage capacity ΔVt fluctuated between positive and negative, indicating that the water volume rose and fell; therefore, the lake appeared to be in a healthy state during this period. From 2000 to 2009, it remained negative for 10 years, reflecting an unhealthy state of continuous contraction. After 2010, it returned to alternating between positive and negative.

3.3. Variations in Lake-Surface Precipitation, Evaporation, and Slope Confluence

As shown in Figure 8d, the lake-surface precipitation, evaporation, and slope confluence flow fluctuated with the climate changes over the years, and the fluctuation after 1983 was also related to the inconsistency in the cumulative period caused by the slightly different dates of the remote-sensing images. The average annual precipitation received by the lake surface was about 540 million m3, the average annual evaporation was about 2.595 billion m3, and the average water from the slope-confluence flow into the lake was about 97 million m3. Evaporation loss was the main component of water loss in Hulun Lake, and it was about 4.8 times that of the direct precipitation supply.

3.4. Variations in River Runoff

Figure 8d shows that the average annual runoff from the river during the last 60 years was about 1.202 billion m3, and it fluctuated from 1962 to 2000, with an average annual value of about 1.254 billion m3, which was much higher than the precipitation directly received by the lake surface during the same period. From 1983 to 2000, a high-water period occurred, and the river-runoff recharge remained at a high level. From 2000 to 2009, the runoff supply from the river decreased significantly, i.e., only about 273 million m3 per year on average, which was 78.2% lower than previously. It was not as large as the precipitation directly received by the lake surface. From 2010, the river runoff recovered to a higher state, and in 2013 and 2014, it even reached the highest historical value and exceeded the evaporation loss in that year.

4. Discussion

4.1. Determination of Groundwater Recharge to Hulun Lake

According to the water-balance equation, Qother was obtained (Figure 8e). The positive and negative values of Qother indicate that the unknown water inflow (groundwater recharge) was greater than and less than, respectively, the unknown water outflow (discharge and leakage). Figure 8e (the blue dotted line is the zero line) shows that Qother was positive or close to zero, except for three obvious negative values in the 1990s. By comparing the timings of these three negative values with the runoff into the lake and the water level of the lake (see the position of the red dotted-line frame in Figure 8), it was found that the negative values corresponded to the high values of the runoff into the lake or to the second year in which the high runoff values occurred and the lake was in the high-water-level stage. As mentioned above, in the 1960s, the water level of Hulun Lake was high, a breach was formed in Shuangshanzi on the eastern side of the lake, and the lake water discharged eastward into a small lake, which became known as New Dalai Lake. Later, when the water level of Hulun Lake was higher than 544.8 m, the lake water discharged into New Dalai Lake through this breach. The location of New Dalai Lake is shown in Figure 3. Therefore, it can be inferred that in the 1990s, due to the continuously high water level of Hulun Lake, the water was discharged into New Dalai Lake through the eastern breach during the years with large river-runoff values. However, according to the written records of the Chronicles of Hulun Lake [28], the sluices on the Xinkai River were opened to release water into the Erguna River in the 1990s due to the high water level of Hulun Lake. There are no statistical data concerning the quantity of water that flowed out of the lake via the two pathways mentioned above, and the specific value is unknown. As a result, the unknown water outflow (discharge and leakage) was greater than the unknown water inflow (groundwater recharge) during this period; therefore, Qother had three negative values in the 1990s.
From 2001 to 2008, the values of Qother were all relatively high, mainly because the water level of Hulun Lake continued to decrease during this period, and the river-runoff value was also the lowest in nearly 60 years. The decrease in the water level of the lake increased the recharge head of the groundwater, which was consistent with the recharge characteristics of the groundwater. From 2013 to 2015, due to the sharp increase in the inflow from the rivers, the river runoff into Hulun Lake reached the highest value in nearly 60 years, and the water level of the lake also experienced a rapid rise back to 543.71 m. However, since it did not reach 544.8 m, the lake water was not released into New Dalai Lake; therefore, Qother was not negative during this period. Except for the three negative values of Qother, the average value in the other years was about 776 million m3, which indicates that there was groundwater recharge in Hulun Lake for a long period, and the multi-year average value of the groundwater recharge was about 776 million m3 (excluding leakage).
There are some differences between the groundwater recharge values calculated in this study and those in other studies. The main reasons for this are that the definitions of the water-balance equation terms, the calculation methods of the terms, the total calculation period, and the time step were different in these studies. There are also large differences between the calculation results obtained by the different scholars and the real values; that is, the errors are different. Therefore, when calculating the water-balance terms, the measured data or the simulated data after correction and inspection should be used as much as possible to minimize the cumulative errors in the water-balance equation. For example, Cai et al. [21] used the Noah 2.7.1 model to simulate the multi-year (1961–2014) average groundwater recharge and obtained a value of about 210 million m3 (including slope flow and excluding leakage). Next, they used this value as the known parameter of the balance term to calculate another water-level value without measured data. Li et al. [22] used the two-parameter model to simulate the multi-year (1961–2002) average groundwater recharge and obtained a value of about 596 million m3 (including the slope flow and excluding the leakage). The evaporation was simulated using the Penman model without using measured data, and the water level was also taken as the last calculation item in the equilibrium calculation, similar to the method presented by Cai et al. [21]. Wang et al. [23] used part of the measured water-level data combined with the water level calculated by Li et al. [22] and the evaporation simulated using the Penman model as the known items for their equilibrium calculation, and they obtained a multi-year (1961–2008) average groundwater recharge of about 683 million m3 (including the slope flow and excluding the leakage), which further magnified the errors.
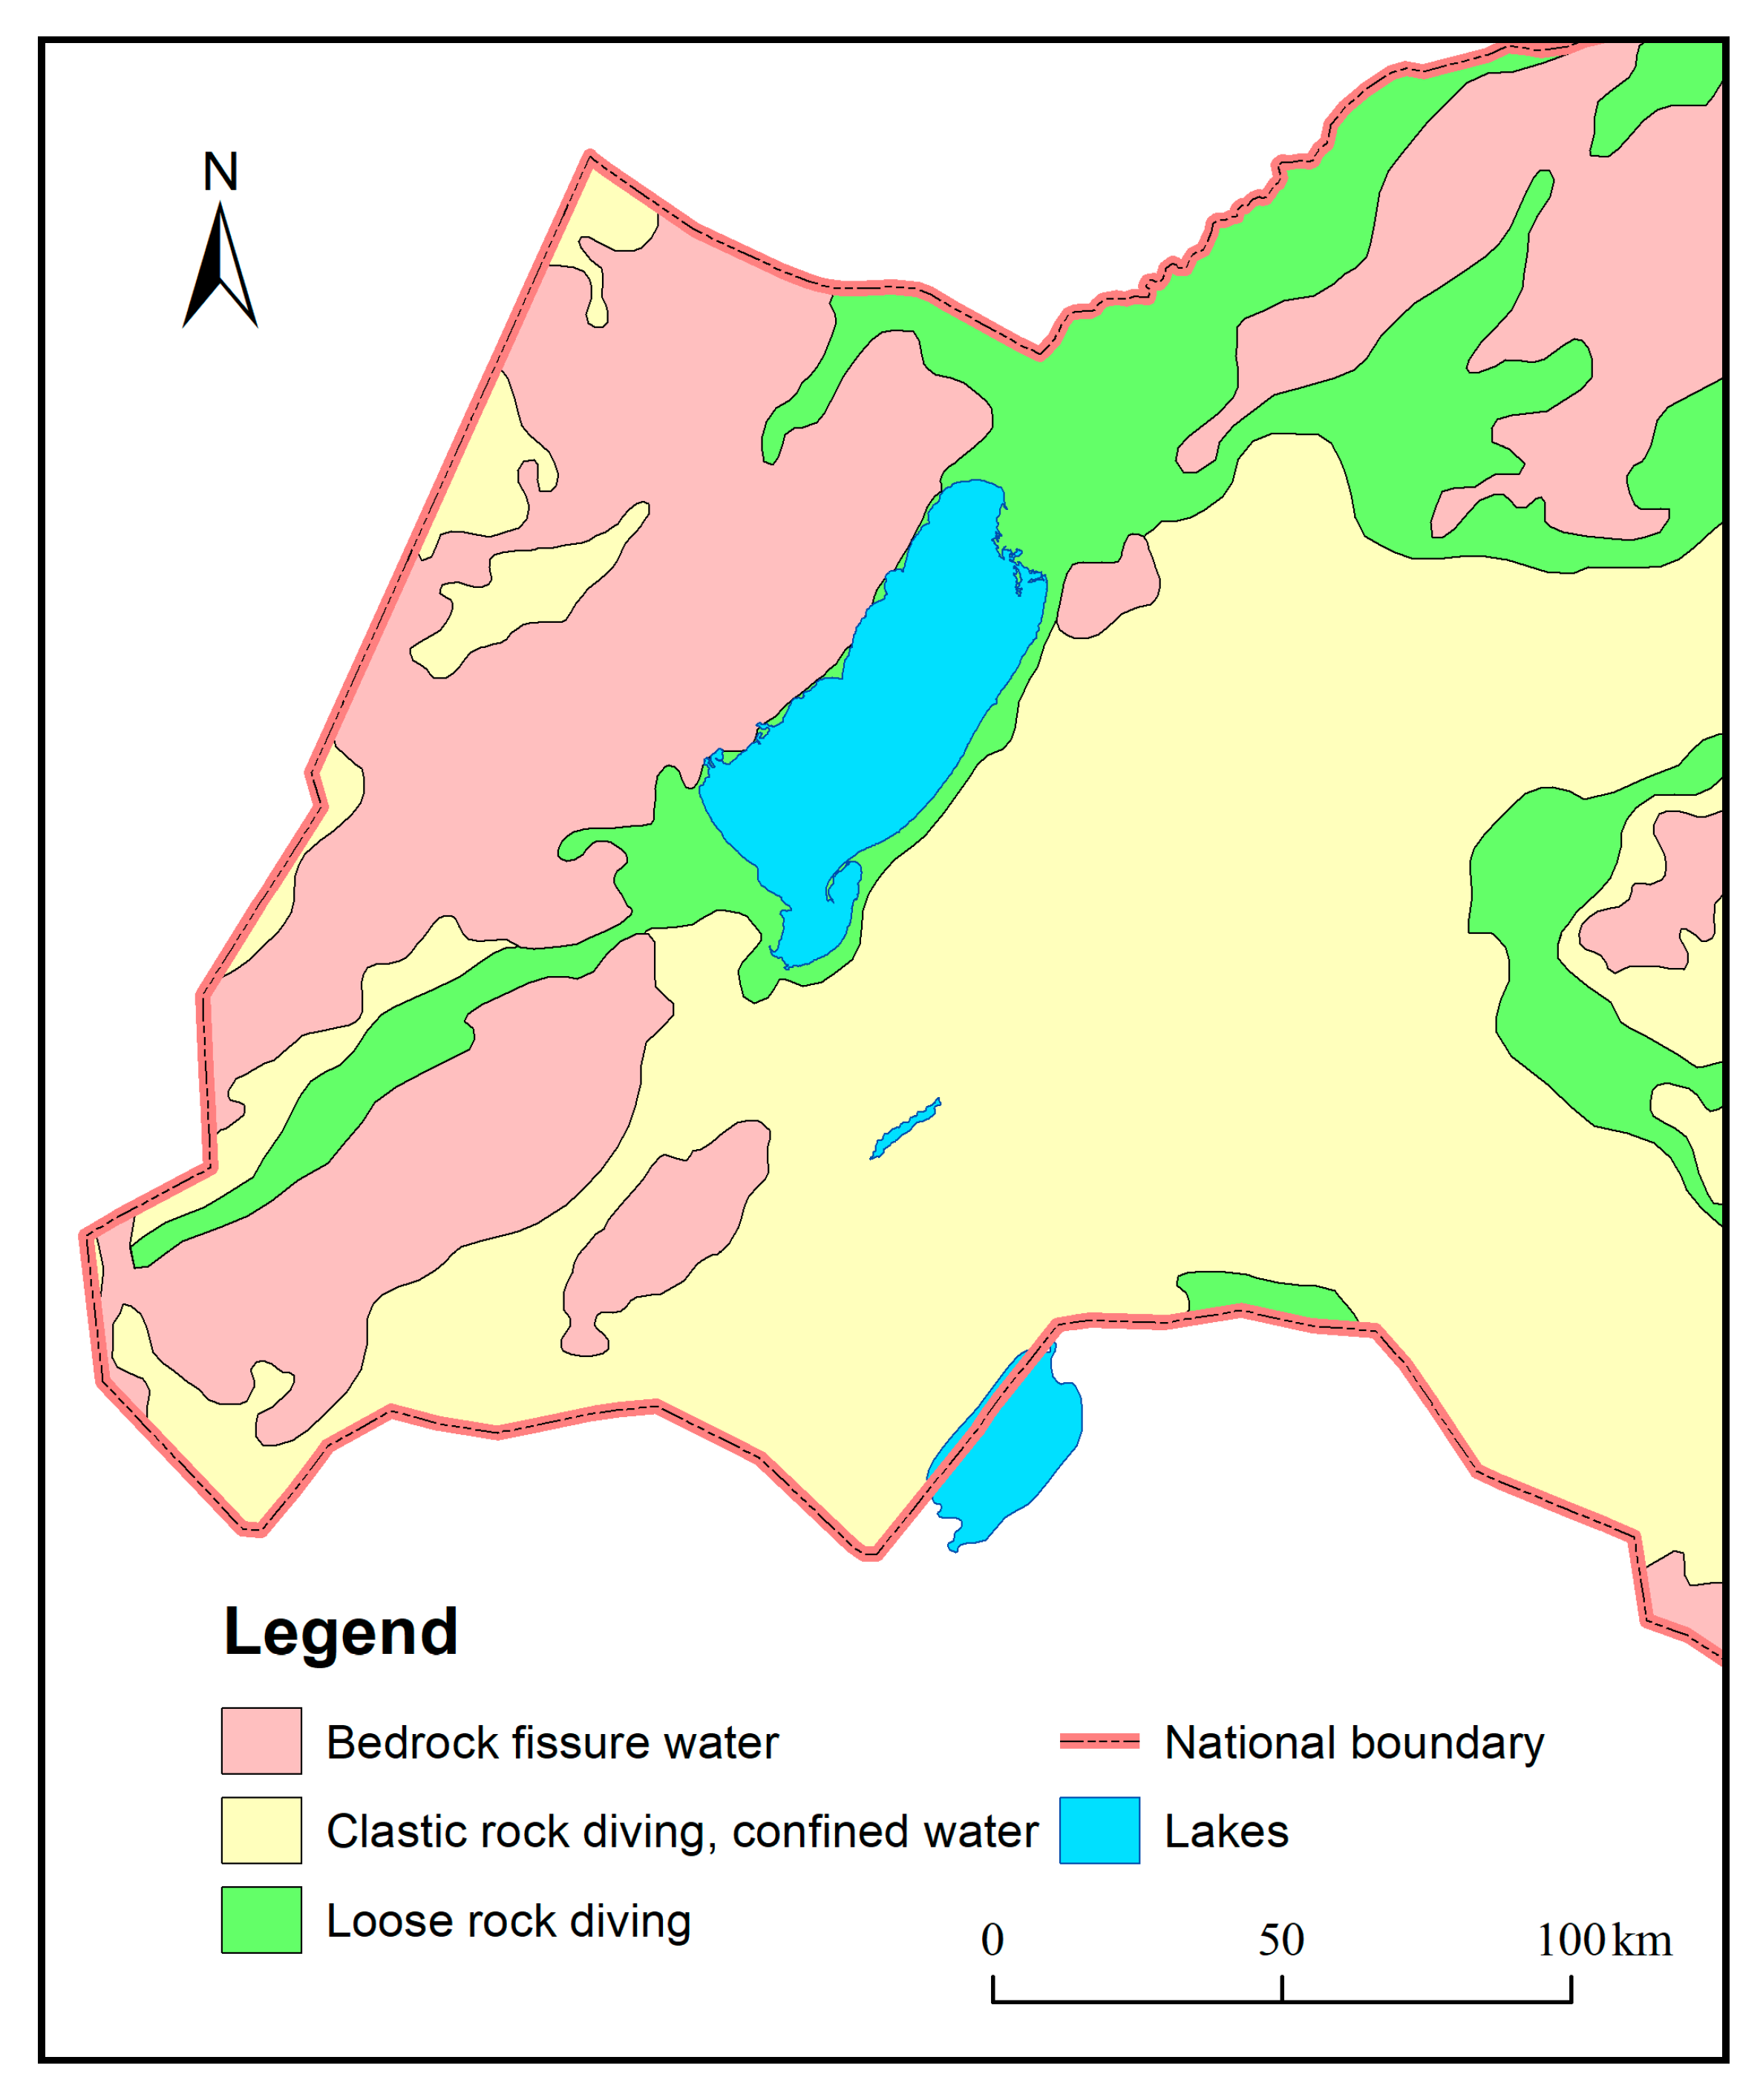
Since area data for Hulun Lake are lacking, it was difficult to use the hydrogeological-parameter method to accurately calculate the groundwater recharge, because this method requires long-term groundwater-level observation data and a hydrogeological-exploration experiment. The occurrence conditions of the groundwater around Hulun Lake are shown in Figure 9. Because Hulun Lake was at the lowest point in the region, both surface water and groundwater gathered there. Many studies have shown that Hulun Lake has been replenished by the surrounding groundwater for a long period [21,22,33,34,35]. The Geological Survey Institute of Inner Mongolia carried out a regional-groundwater-resource survey in this region [36,37]. Based on the survey results for the hydrological year from June 2010 to May 2011, they estimated that the underground water discharged from the surrounding area to Hulun Lake was about 193 million m3 per year, using the hydrogeological parameter method. However, this amount of water is only the lateral discharge into the lake in three directions around Hulun Lake (east, south, and north), and excludes the western region. The reason for this is that the occurrence condition of the groundwater in the hilly western area of Hulun Lake (Figure 7b) is the distribution area of the fractured bedrock water, and it is difficult to drill hydrogeological test wells in this area. Therefore, the Institute did not estimate the underground water discharged into the lake from the western area. According to their report, the aquifer to the west of Hurun Lake is composed of Proterozoic metamorphic rocks, Paleozoic metamorphic rocks, Mesozoic volcanic rocks, pyroclastic rocks, and Yanshanian granite. Rock fractures are present, the depth of the weathering zone is about 20 to 40 m, and the infiltration coefficient of the groundwater system receiving atmospheric precipitation is about 0.08. It can be seen in Figure 7 that the western area of Hulun Lake has the largest slope, and the groundwater is discharged into the lake through geological faults along the western lake shoreline (about 90 km) after receiving atmospheric precipitation recharge. Based on the average annual rainfall, the infiltration coefficient of the atmospheric precipitation and the area of the western hilly zone near Hulun Lake, it can be estimated that the average annual groundwater discharged from the bedrock fissure area into the lake is about 78 million m3.
In addition, some studies found that there are more than 30 spring mouths at the bottom of Hulun Lake [39,40], and it is estimated that the amount of water replenished by these springs to the lake is about 390 million m3 per year. This part of the spring-water influx may arise in the deep confined aquifer or outer basin through deeper channels, and some researchers believe that the groundwater of Hulun Lake includes exogenous trans-basin water [41]. The same phenomenon was identified in other lakes in northern China using isotope techniques. For example, the lake water in the Badain Jaran Desert in Inner Mongolia and the groundwater in the Zhangye Basin may be derived from snowmelt water in the Qilian Mountains through deep channels [42,43], the lake water in the Taklimakan Desert may be derived from the Altun Mountains and Kunlun Mountains [44], and the water in Daihai Lake in Inner Mongolia may also be replenished by remote deep circulating groundwater [45]. The sum of the lateral groundwater recharge and spring water from the bottom of the lake described above is about 661 million m3 per year, which is within roughly the same range as the groundwater recharge calculated using the water balance in this study. In conclusion, the groundwater-recharge source of Hulun Lake is relatively complex, and it requires further research and a significant scientific evidence.

4.2. Dominant Factor Determining the Water Volume of Hulun Lake

The aforementioned change in the lake’s storage capacity ΔVt represents the fluctuation in the quantity of lake water. In order to further analyze the causes of the dynamic evolution of the quantity of water in Hulun Lake, a correlation analysis was conducted between the terms in Equation (5) and ΔVt. The most significant correlation was the most important factor controlling the fluctuations in the quantity of water in Hulun Lake. Scatter plots illustrating the correlation analysis are shown in Figure 10.
As shown in Figure 10, the equation term with the best correlation with ΔVt is the river runoff into the lake, with an R2 value of 0.744, whereas the evaporation, precipitation, slope-confluence flow, and Qother terms are not significantly correlated with ΔVt. This indicates that the dominant factor controlling the change in the quantity of water in Hulun Lake is the change in the runoff into the lake. During 2000–2009, the decrease in the runoff was the main reason for the continuous decrease in the water level and the shrinkage of the lake’s surface. From 2009 to 2016, the lake’s surface stopped shrinking and began to recover rapidly, which was also caused by the sharp increase in the runoff into the lake; that is, the water fluctuations in Hulun Lake were controlled by the quantity of water from the rivers entering the lake. However, the Kerulen River and the Urxun River, i.e., the rivers that enter Hulun Lake, are both international rivers, and their runoff-producing areas are mainly distributed in the Kent Mountains of Mongolia and the mountainous areas on the border between China and Mongolia (the distributions of the Kerulen and Urxun river basins are shown in Figure 2); therefore, the rainfall in the Hulun Lake region in China has little impact on the runoff of these two rivers. As a result, the change in the quantity of water in Hulun Lake is affected by the climate in China and Mongolia, and the impact of the rainfall and runoff in Mongolia is more significant.

5. Conclusions

The average annual precipitation received by the surface of Hulun Lake is about 540 million m3, the average annual evaporation is about 2.595 billion m3, and the average annual slope-confluence water is about 97 million m3. Evaporation loss is the main component in the water loss in Hulun Lake, and it was about 4.8 times that of the direct precipitation supply from the surface. Over the last 60 years, the average annual runoff into the lake was about 1.202 billion m3, and it was the factor with the largest range of change. Based on an accurate water-balance analysis, it was found that there was groundwater recharge in Hulun Lake for a long period, and the average annual groundwater recharge was about 776 million m3 (excluding leakage). Groundwater was also an important recharge source for Hulun Lake. The contribution ratio of the river water, groundwater, and precipitation to the recharge in Hulun Lake was about 5:3:2.
The water volume of Hulun Lake decreased rapidly from 2000 to 2009. By 2009, the water level was 540.5 m, the area was about 1775.7 km2, the storage capacity was less than 4.1 billion m3, and about two-thirds of the water had disappeared compared with that in 2000. In addition, the change in the lake‘s storage capacity ΔVt was continuously negative, reflecting an unhealthy, continuously shrinkage state. According to the correlation analysis, the dominant factor affecting the change in the quantity of water in Hulun Lake was the change in the runoff into the lake. During 2000–2009, the runoff supply decreased by 78.2% compared with the average amount before 2000, and it returned to a higher state in 2010, remaining high thereafter. The rise and fall of Hulun Lake were determined by the sufficiency of the water inflow from the rivers.
Hulun Lake is a typical international lake. The important rivers that provide inflow into the lake, the Kerulen River and the Urxun River, are both international rivers, and their runoff-producing areas are mainly distributed in the Kent Mountains of Mongolia and the mountainous areas on the border between China and Mongolia. The changes in the quantity of water in Hulun Lake are affected by the climate in China and Mongolia, and the impact of the rainfall and runoff in Mongolia is highly significant. The protection of Hulun Lake should include strengthening the international co-operation between China and Mongolia and the rational allocation of water resources from the perspective of comprehensive basin management.
Evaporation is the largest water-loss pathway in lakes in arid and semi-arid areas. In the water-balance calculation, water-surface-evaporation experiments should be carried out to compare evaporation-pan data and to obtain more accurate local conversion coefficients; otherwise, large errors affect the reliability of results. For lakes that lack measured water-level data or for which only discontinuous measured water-level data are available, the lake-shoreline-displacement method with a fixed regular slope position proposed in this paper can be used to calculate the water level on the date of the remote-sensing image and to extrapolate the missing data in order to obtain more accurate water-balance calculations.

Author Contributions

Data curation, formal analysis, validation, writing—original draft, and writing–review and editing B.S.; investigation and validation, Z.Y.; investigation, validation, and visualization, S.Z.; project administration and funding acquisition, X.S.; investigation and methodology, Y.L.; conceptualization, methodology, and writing—review and editing, G.J.; writing—review and editing, J.H. All authors have read and agreed to the published version of the manuscript.

Funding

This research was funded by the National Key R&D Program of China (no. 2019YFC0409201, 2017YFE0114800), the National Natural Science Foundation of China (no. 51869020, 51779118, 52060022), the Natural Science Foundation of Inner Mongolia (no. 2019MS05032), and the Youth Science and Technology Talents Support Plan of the Colleges and Universities of Inner Mongolia (NJYT-19-B11).

Data Availability Statement

Not applicable.

Acknowledgments

We would like to thank the lakes research team of the Inner Mongolia Agricultural University for their persistent efforts in collecting and measuring the data used in this study.

Conflicts of Interest

The authors declare that there are no conflict of interest.

References

  1. Enríquez, M.J.; Recio, C.; Vega, J.C.; Garcés, B.V. Tracking climate change in oligotrophic mountain lakes: Recent hydrology and productivity synergies in Lago de Sanabria (NW Iberian Peninsula). Sci. Total Environ. 2017, 590, 579–591. [Google Scholar] [CrossRef]
  2. Song, B.; Kong, L.Y.; Hu, Z.J.; Wang, Q.; Yang, X.D. Pollen and diatom record of climate and environmental change over the last 170 years in Tingming Lake, Yunnan Province, SW China. Quat. Int. 2020, 536, 85–91. [Google Scholar] [CrossRef]
  3. Zhang, Z.X.; Chang, J.; Xu, C.Y.; Zhou, Y.; Wu, Y.H.; Chen, X.; Jiang, S.S.; Duan, Z. The response of lake area and vegetation cover variations to climate change over the Qinghai-Tibetan Plateau during the past 30 years. Sci. Total Environ. 2018, 635, 443–451. [Google Scholar] [CrossRef] [PubMed]
  4. Bai, J.H.; Guan, Y.N.; Liu, P.P.; Zhang, L.; Cui, B.S.; Li, X.W.; Liu, X.H. Assessing the safe operating space of aquatic macrophyte biomass to control the terrestrialization of a grass-type shallow lake in China. J. Environ. Manag. 2020, 266, 1–9. [Google Scholar] [CrossRef]
  5. Zhu, Y.H.; Luo, P.P.; Zhang, S.; Sun, B. Spatiotemporal Analysis of Hydrological Variations and Their Impacts on Vegetation in Semiarid Areas from Multiple Satellite Data. Remote Sens. 2020, 24, 4177. [Google Scholar] [CrossRef]
  6. Awange, J.L.; Saleem, A.; Sukhadiya, R.M.; Ouma, Y.O.; Kexiang, H. Physical dynamics of Lake Victoria over the past 34 years (1984–2018): Is the lake dying? Sci. Total Environ. 2018, 658, 199–218. [Google Scholar] [CrossRef] [PubMed]
  7. Bian, Y.; Zhao, Y.; Lyu, H.; Guo, F.; Li, Y.; Xu, J.; Liu, H.; Ni, S. Nineteen Years of Trophic State Variation in Large Lakes of the Yangtze River Delta Region Derived from MODIS Images. Remote Sens. 2021, 13, 4322. [Google Scholar] [CrossRef]
  8. Gross, M. The world’s vanishing lakes. Curr. Biol. 2017, 27, 43–46. [Google Scholar] [CrossRef]
  9. Kakade, A.; Salama, E.S.; Han, H.W.; Zheng, Y.Z.; Kulshrestha, S.; Jalalah, M.; Harraz, F.A.; Alsareii, S.A.; Li, X.K. World eutrophic pollution of lake and river: Biotreatment potential and future perspectives. Environ. Technol. Innov. 2021, 23, 1–23. [Google Scholar] [CrossRef]
  10. Feizizadeh, B.; Omarzadeh, D.; Alajujeh, K.M.; Blaschke, T.; Makki, M. Impacts of the Urmia Lake Drought on Soil Salinity and Degradation Risk: An Integrated Geoinformatics Analysis and Monitoring Approach. Remote Sens. 2022, 14, 3407. [Google Scholar] [CrossRef]
  11. Soja, G.; Züger, J.; Knoflacher, M.; Kinner, P.; Soja, A.M. Climate impacts on water balance of a shallow steppe lake in Eastern Austria (Lake Neusiedl). J. Hydrol. 2013, 480, 115–124. [Google Scholar] [CrossRef]
  12. Jiang, Z.; Wang, J.; Cai, X.; Zhao, J.; Zhang, H.; Zhang, Y.; Wang, C. Hydrological Characteristics Change of Hala Lake and Its Response to Climate Change, 1987–2018. Remote Sens. 2022, 14, 2886. [Google Scholar] [CrossRef]
  13. Hwang, C.; Peng, M.F.; Ning, J.; Luo, J.; Chung, H. Lake level variations in China from TOPEX/Poseidon altimetry: Data quality assessment and links to precipitation and ENSO. Geophys. J. Int. 2005, 161, 1–11. [Google Scholar] [CrossRef] [Green Version]
  14. Zhang, G.Q.; Xie, H.J.; Yao, T.D.; Kang, S.C. Water balance estimates of ten greatest lakes in China using ICESat and Landsat data. Chin. Sci. Bull. 2013, 58, 3815–3829. [Google Scholar] [CrossRef] [Green Version]
  15. Zhou, Y.; Dong, J.W.; Xiao, X.M.; Liu, R.G.; Zou, Z.H.; Zhao, G.S.; Ge, Q.S. Continuous monitoring of lake dynamics on the Mongolian Plateau using all available Landsat imagery and Google Earth Engine. Sci. Total Environ. 2019, 689, 366–380. [Google Scholar] [CrossRef] [PubMed]
  16. Li, C.L.; Filho, W.L.; Nagy, G.J.; Wang, J.; Ciani, A.; Sidsaph, H.; Fedoruk, M.; Yin, S.; Bao, Y.H.; Ayal, D.Y.; et al. Satellite imagery evidence for a multiannual water level decline in Hulun Lake, China, with suggestions to future policy making responses. J. Geogr. Soc. Berl. 2019, 150, 31–39. [Google Scholar] [CrossRef]
  17. Li, S.; Chen, J.P.; Xiang, J.; Pan, Y.; Huang, Z.Y.; Wu, Y.L. Water level changes of Hulun Lake in Inner Mongolia derived from Jason satellite data. J. Vis. Commun. Image R. 2019, 58, 565–575. [Google Scholar] [CrossRef]
  18. Zheng, J.J.; Ke, C.Q.; Shao, Z.D.; Li, F. Monitoring changes in the water volume of Hulun Lake by integrating satellite altimetry data and Landsat images between 1992 and 2010. J. Appl. Remote Sens. 2016, 10, 1–14. [Google Scholar] [CrossRef]
  19. Yuan, C.; Gong, P.; Liu, C.X.; Ke, C.Q. Water-volume variations of Lake Hulun estimated from serial Jason altimeters and Landsat TM/ETM+ images from 2002 to 2017. Int. J. Remote Sens. 2019, 40, 670–692. [Google Scholar] [CrossRef]
  20. Liu, Y.; Yue, H. Estimating the fluctuation of Lake Hulun, China, during 1975–2015 from satellite altimetry data. Environ. Monit. Assess. 2017, 189, 1–16. [Google Scholar] [CrossRef]
  21. Cai, Z.S.; Jin, T.Y.; Li, C.Y.; Ofterdinger, U.; Zhang, S.; Ding, A.Z.; Li, J.C. Is China’s fifth-largest inland lake to dry-up? Incorporated hydrological and satellite-based methods for forecasting Hulun lake water levels. Adv. Water Resour. 2016, 94, 185–199. [Google Scholar] [CrossRef] [Green Version]
  22. Li, C.; Ma, W.; Shi, X.X.; Liao, W.G. Reconstruction of the hydrology series and simulation of salinity in Lake Hulun. J. Lake Sci. 2006, 18, 13–20. [Google Scholar] [CrossRef] [Green Version]
  23. Wang, Z.J.; Li, C.Y.; Li, W.P.; Zhang, S. Calculation and analysis of water balance in Lake Hulun, Inner Mongolia. J. Lake Sci. 2012, 24, 273–281. [Google Scholar] [CrossRef] [Green Version]
  24. Gao, H.B.; Ryan, M.C.; Li, C.Y.; Sun, B. Understanding the Role of Groundwater in a Remote Transboundary Lake (Hulun Lake, China). Water 2017, 9, 363. [Google Scholar] [CrossRef] [Green Version]
  25. Zhao, H.Y.; Wu, L.J.; Hao, W.J. Influences of climate change to ecological and environmental evolvement in the Hulun Lake wetland and its surrounding areas. Acta Ecol. Sin. 2008, 28, 1064–1071. [Google Scholar]
  26. Yan, W.B.; Zhang, H.H.; Zhang, C.D. Hulun lake nature reserve wetland habitats protection. Terr. Nat. Resour. Stud. 2006, 28, 47–48. [Google Scholar]
  27. Zhao, H.Y.; Li, C.C.; Zhao, H.H.; Tian, H.C.; Song, Q.W.; Kou, Z.Q. The climate change and its effect on the water environment in the Hulun Lake wetland. J. Glaciol. Geocryol. 2007, 29, 795–801. [Google Scholar]
  28. Li, Z.G.; Zhang, Z.B.; Jiang, F.Y.; Wang, S.W.; Wang, F.J. Chronicles of Hulun Lake; Inner Mongolia Culture Press: Hohhot, China, 2008; pp. 1–33. (In Chinese) [Google Scholar]
  29. Water Resources of the United States. Available online: https://water.usgs.gov/nwc/explain_data.html (accessed on 10 January 2023).
  30. Li, C.Y.; Sun, B.; Jia, K.L.; Zhang, S.; Li, W.P.; Shi, X.H.; Cordovil, C.M.d.S.; Pereira, L.S. Multi-band remote sensing based retrieval model and 3D analysis of water depth in Hulun Lake, China. Math. Comput. Model. 2013, 58, 765–775. [Google Scholar] [CrossRef]
  31. Sun, B.; Li, C.Y.; Zhang, S.; Zhao, S.N. Analysis of Hulun digital basin based on spatial information technology. Environ. Pollut. Control 2010, 32, 5–9. [Google Scholar] [CrossRef]
  32. Lian, M.Q. Effect analysis of land use change on hydrology and water resources in Hulun lake water system. Water Resour. Hydropower Northeast China 2009, 27, 24–26. [Google Scholar] [CrossRef]
  33. Xu, Y.; Gun, Z.; Zhao, J.; Cheng, X. Variations in lake water storage over Inner Mongolia during recent three decades based on multi-mission satellites. J. Hydrol. 2022, 609, 127719. [Google Scholar] [CrossRef]
  34. Han, Z.; Shi, X.; Jia, K.; Sun, B.; Zhao, S.; Fu, C. Determining the Discharge and Recharge Relationships between Lake and Groundwater in Lake Hulun Using Hydrogen and Oxygen Isotopes and Chloride Ions. Water 2019, 11, 264. [Google Scholar] [CrossRef] [Green Version]
  35. Liang, L.; Li, C.; Shi, X.; Sun, B.; Wang, J.; Zhou, J. Characteristics of Hydrogen and Oxygen Isotopes of Surface and Ground Water and the Analysis of Source of Lake Water in Hulun Lake Basin, Inner Mongolia. Wetland Sci. 2017, 15, 73–79. [Google Scholar] [CrossRef]
  36. Ma, A.; Zhang, J.; Sui, C.; Meng, X.; Liu, F.; Liang, L.; Zheng, Q. Groundwater Resources Exploration and Regionalization Report in Xinbahuyouqi, Inner Mongolia; National Geological Archive: Beijing, China, 2014. (In Chinese)
  37. Wang, B.; Liu, B.; Yuan, N.; Chen, L.; Sui, C.; Liang, L.; Qin, D.; Li, X.; Meng, X.; Li, Y. Groundwater Resources Exploration and Regionalization Report in Xinbahuzuoqi, Inner Mongolia; National Geological Archive: Beijing, China, 2012. (In Chinese)
  38. Inner Mongolia Hydraulic Design Institute. Groundwater Resources Investigation and Evaluation Results Report of Inner Mongolia; National Scientific and Technological Achievements: Beijing, China, 2001. (In Chinese) [Google Scholar]
  39. Zhao, F. Hydrological characteristics of Hulun Lake. J. Chin. Hydrol. 1991, 36, 46–49. [Google Scholar] [CrossRef]
  40. Wang, F.; Liu, H.; Ding, K. Remote sensing survey in Hulun Lake: Extraction of lake feature and underground water supply information. Inn. Mong. Environ. Prot. 1996, 8, 22–24. [Google Scholar]
  41. Chen, J.; Chen, S.; Ma, F.; Chen, J. Analysis of water balance of Hulun Lake based on digital remote sensing images. Water Resour. Prot. 2020, 36, 73–79. [Google Scholar]
  42. Chen, J.S.; Li, L.; Wang, J.Y.; Barry, D.A.; Sheng, X.; Gu, W.Z.; Zhao, X.; Chen, L. Water resources: Groundwater maintains dune landscape. Nature 2004, 432, 459–460. [Google Scholar] [CrossRef] [PubMed]
  43. Chen, J.; Liu, X.; Sun, X.; Su, Z.; Yong, B. The origin of groundwater in Zhangye Basin, northwestern China, using isotopic signature. Hydrogeol. J. 2013, 22, 411–424. [Google Scholar] [CrossRef]
  44. Chen, J.; Wang, C.Y.; Tan, H.; Rao, W.; Liu, X.; Sun, X. New lakes in the Taklamakan Desert. Geophys. Res. Lett. 2012, 39, 1–5. [Google Scholar] [CrossRef]
  45. Chen, J.; Ji, B.; Liu, Z.; Zhang, Z.; Zhang, S. Isotopic and hydro-chemical evidence on the origin of groundwater through deep-circulation ways in Lake Daihai region, Inner Mongolia plateau. J. Lake Sci. 2013, 25, 521–530. [Google Scholar] [CrossRef] [Green Version]
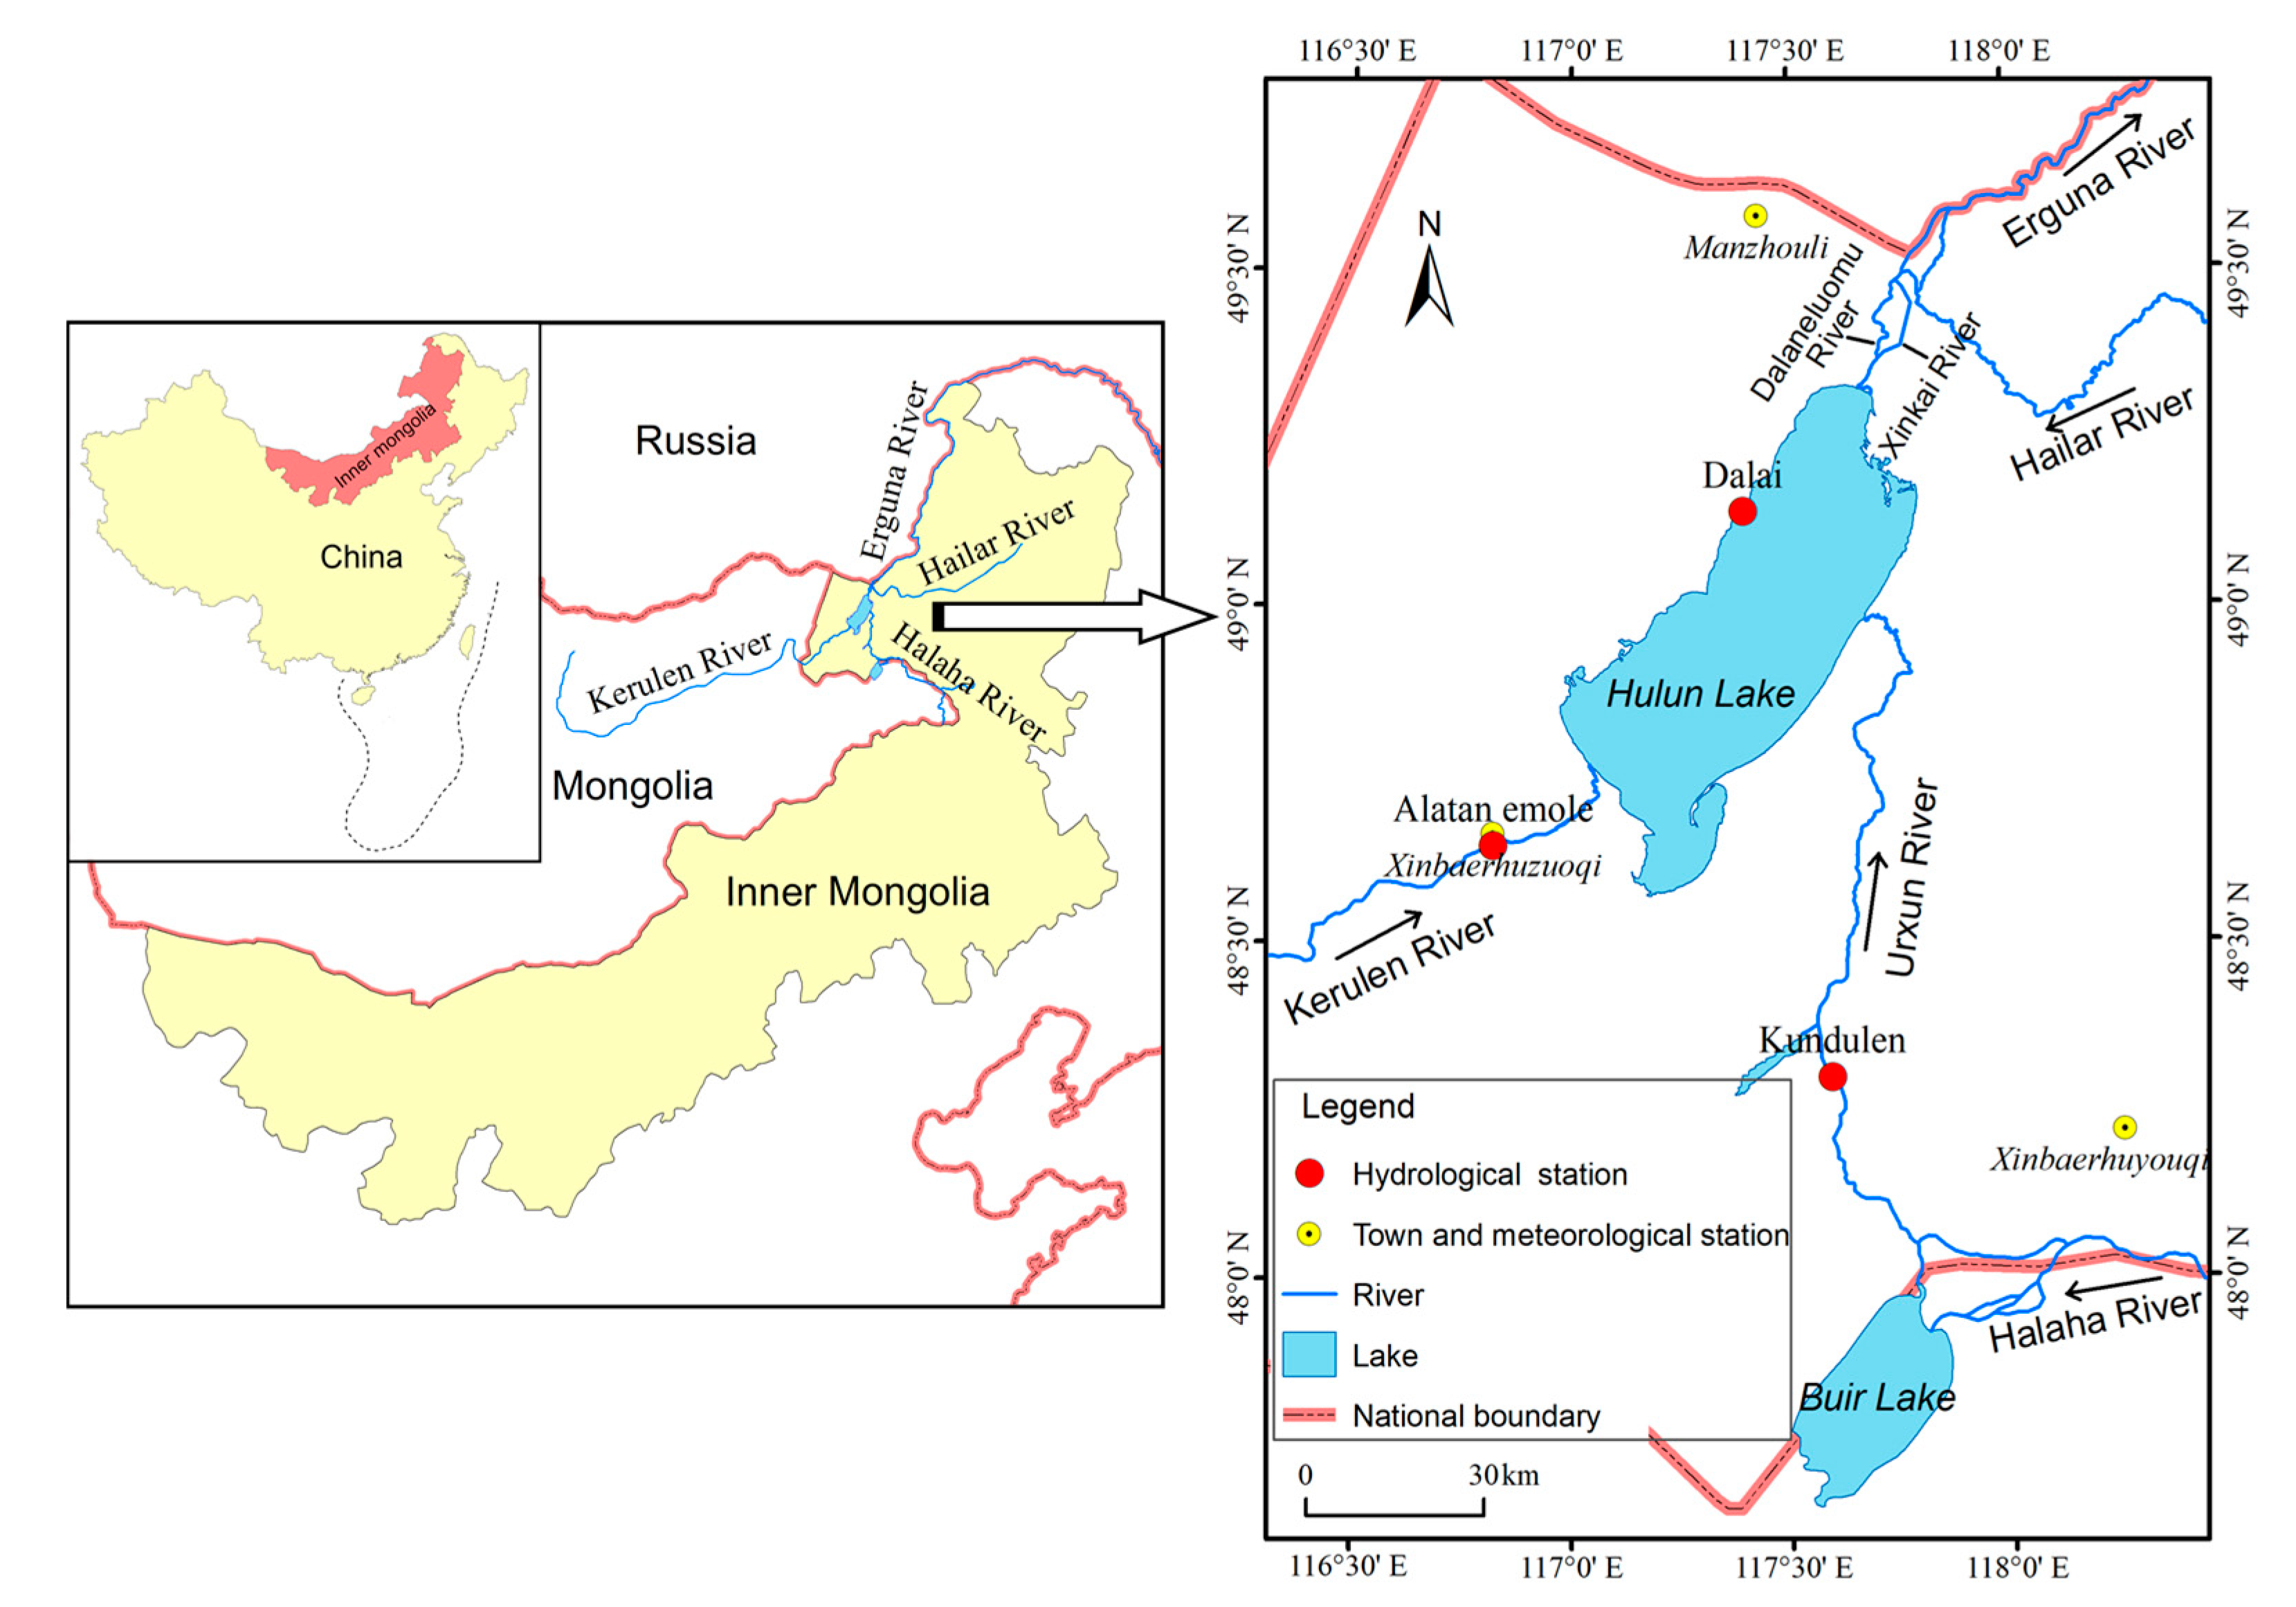
Figure 1. Geographic location of Hulun Lake and locations of monitoring stations.
Remotesensing 15 02028 g001
Figure 2. Distribution range of the drainage area of Hulun Lake.
Remotesensing 15 02028 g002
Figure 3. Location and status of New Dalai Lake in different periods (false color synthesis of remote-sensing images): (a) 2000, and (b) 2007.
Remotesensing 15 02028 g003
Figure 4. Lake shoreline superimposed on Hulun Lake: (a) the entire area of the lake, and (b) partial enlargement.
Remotesensing 15 02028 g004
Figure 5. Photographs of Hulun Lake taken at the same location at different times: (a) summer of 2000, and (b) summer of 2007.
Remotesensing 15 02028 g005
Figure 6. Comparison and correlation between the observed values at the 80-cm lake-surface and the 20-cm ground-evaporation measurements.
Remotesensing 15 02028 g006
Figure 7. The surrounding topography of Hulun Lake and the area where the slope confluence can flow into the lake. (a) Surrounding topography of Hulun Lake, and (b) distribution of slope confluence.
Remotesensing 15 02028 g007
Figure 8. Variations in the equation terms for Hulun Lake over the last 60 years. (a) water level, (b) area and lake storage capacity, (c) change of storage capacity, (d) river runoff, precipitation, evaporation and slope confluence, and (e) other unidentified water.
Remotesensing 15 02028 g008
Figure 9. Zones of groundwater-occurrence conditions around Hulun Lake [38].
Remotesensing 15 02028 g009
Figure 10. Analysis of the correlation between the change in the storage capacity and the other terms in the water-balance equation.
Remotesensing 15 02028 g010
Disclaimer/Publisher’s Note: The statements, opinions and data contained in all publications are solely those of the individual author(s) and contributor(s) and not of MDPI and/or the editor(s). MDPI and/or the editor(s) disclaim responsibility for any injury to people or property resulting from any ideas, methods, instructions or products referred to in the content.