Article

Study of Human Activity Intensity from 2015 to 2020 Based on Remote Sensing in Anhui Province, China

1
State Key Laboratory of Remote Sensing Science, Aerospace Information Research Institute, Chinese Academy of Sciences, Beijing 100101, China
2
University of Chinese Academy of Sciences, Beijing 100049, China
3
School of Hydro Science & Engineering, Taiyuan University of Technology, Taiyuan 030024, China
*
Author to whom correspondence should be addressed.
Remote Sens. 2023, 15(8), 2029; https://doi.org/10.3390/rs15082029
Submission received: 19 February 2023 / Revised: 7 April 2023 / Accepted: 9 April 2023 / Published: 11 April 2023

Abstract

:
The interactions between human activities and land cover have a significant impact on ecosystems. Therefore, studying human activity intensity based on land use or land cover is crucial for understanding the sustainable development of ecosystems. In this study, we selected Anhui Province as the study area and estimated the human activity intensity of land surface (HAILS) in 2015 and 2020 based on the ChinaCover datasets. We further analyzed the spatial, slope, and hydrological distribution characteristics of HAILS and explored the drivers of HAILS changes. The results show that the areas with higher HAILS were mainly located in the central part of Hefei, as well as along the Yangtze and the Huaihe rivers. The largest changes from 2015 to 2020 happened in the gentle slopes with the HAILS of 20–30%, and the percentage of HAILS > 20% decreased over the slope of 15°. In the riparian zone, the HAILS showed a clear decreasing trend after 2 km, while the HAILS in 2020 were higher than in 2015 in each flow-path distance belt, except for the Huaihe river. The HAILS index was strongly correlated with population density, rural population density, urban population density, average land GDP of primary industry, and nighttime light data. The rapid growth of the urban population and economy, as well as ecological protection policies, were identified as drivers of the above changes. Therefore, the HAILS in 2015 and 2020 of Anhui Province provide effective data support to address regional ecological conservation issues.

1. Introduction

From the perspective of the impact on the global surface system, human activities have a strong driving role in the development and evolution of the ecological environment [1,2,3,4]. Studies on the changes in human activities can provide insight into the changing characteristics and future direction of the ecological environment [5,6,7,8,9]. However, human activities are extremely complex and difficult to quantify [10,11,12,13]. Nowadays, remote sensing has become an important technology in ecological environment monitoring, providing an efficient tool for assessing and quantifying human activities [14,15,16,17,18].
Previous quantitative studies of human activities mainly focused on comprehensive evaluation methods based on statistical data or spatial data [19]. Li et al. screened the causes of desertification in the arid area of China as an important factor in quantifying human activity intensity on the basis of Wen’s research [19,20]. Huang et al. and Xu et al. further updated the quantification methods by selecting key factors from social, economic, and cultural data in different areas [20,21,22]. Furthermore, spatial indicators have been used in human activity intensity modeling in different study areas. Based on geographic auto-correlation theory, Hu et al. used weighted indicators, such as settlements, roads, and terrain factors, to achieve a quantitative spatial representation of human activity intensity in the upper reaches of the Minjiang River [23]. In addition, some scholars have used spatial statistical data factors directly related to human activities; for example, Lund et al. proposed an agent-based model based on the principle of analytically evaluating the simulated activity and location trajectories of each person within a large geographical area and validated it for a small area in Salt Lake City, USA [24]. Tranos et al. established a spatial–temporal explanatory model for the aggregation of human activity patterns developed by monitoring and modeling data on cell phone usage and validated the model using an extensive dataset from the city of Amsterdam [25]. However, these quantitative methods are very cumbersome and complicated, particularly since statistical data are limited by administrative regional units, which are often insufficient in characterizing the variations in the spatial distribution of human activities over a large scale. Moreover, these methods are mostly constructed based on subjective assessment, such as expert scoring, analytic hierarchy process, and visual interpretation, lacking indicators that can objectively reflect the spatial distribution of human activities [26].
Thus, based on the above methods, a series of indices have been developed to indirectly describe the human activity intensity. For example, Brown et al. proposed the Landscape Development Intensity Index (LDI) and applied it to evaluate the development intensity of watershed areas in Florida [27]. Xu et al. established the Human Activity Intensity Index on Land Surface (HAILS) [15] that has been applied in water source areas [17]. Wang et al. created the human development index (HDI) and explored the relationship between renewable economic growth, energy consumption, and HDI in Pakistan [28]. Chi et al. created the Human Activity Net Impact Index (HAI) applicable to Chongming Island, Shanghai [29], and Huang et al. established the Comprehensive Explicit–Hidden Human Activity Intensity Index (CHAI) used in the hinterland of Three Gorges Reservoir Area [30]. Most of these indexes adopted a subjective modeling-based approach, merely applied in specific regions or focused on other aspects related to human activities, making it difficult to be an indicator for assessing the human activity intensity at large scale and long time series. However, among them, the HAILS index, based on the mutual constraint mechanism between land cover and human activities, can efficiently quantify long time-series human activities [15] and has been well validated for its applicability at regional scales [17]. In particular, with the continuous development of remote sensing technology, the accuracy of land cover data is getting higher, which makes this index more reliable for obtaining high-precision quantitative spatial of human activity intensity.
Anhui Province plays an important role in population, agriculture, and ecological protection in China. In 2020, it ranked ninth in China in terms of the total population, eighth in arable land, and fourth in grain production [31]. The province has multiple key protected areas and national nature reserves with self-evident ecological significance. Particularly, Anhui Province has implemented ecological protection projects and established an ecological protection red line protection system to balance socioeconomic development with the ecological protection [32]. Therefore, studying the characteristics of human activity is important in understanding the spatial–temporal changes in the ecological environment in Anhui Province.
Quantification of human activity intensity can effectively reflect the spatial and temporal changes in the ecological environment, which has been a longstanding challenge and priority in the ecological research [33]. Our study objected to quantifying long time-series human activities in Anhui Province efficiently and accurately; thus, we chose HAILS index to quantify the human activity intensity with highly accurate and reliable ChinaCover datasets in 2015 and 2020. Based on the quantitative HAILS index, we analyzed the spatial patterns, changes, and driver factors. The main innovation of this study is that the combination of higher precision land cover data in the method makes the quantification of human activity intensity more accurate. In the analysis of the results, the spatial–temporal variability analysis HAILS is applied, especially for hydrological analysis. In the discussion, we use statistical data and spatial data to discuss the validity of large-scale HAILS. Our comprehensive analysis could provide insights into the sustainable development of regional social, economic, and ecological systems.

2. Materials and Methods

2.1. Study Area

Anhui Province is located in the middle and lower reaches of the Yangtze and Huaihe river (114°54′–119°37′E, 29°41′–34°38′N), with an area of about 14.02 × 10⁴ km2 (Figure 1). The Yangtze and Huaihe River take their basins as ridges, sloping to the southeast and north, with low-lying polder areas along the rivers [34]. The Qinling Mountains–Huaihe River Line runs through the whole Anhui province, making the climate, vegetation, and other ecological elements exhibit obvious north–south bi-directional transition characteristics. The north of the Qinling Mountains–Huaihe River Line belongs to the temperate semi-humid monsoon climate. The southern region has a humid subtropical monsoon climate with sufficient precipitation, and the northern region generally has less precipitation. As a result, most of the arable land in the north of Anhui Province is predominantly dry farmland, while in the south, it is mainly paddy fields [35]. The annual average rainfall is about 1300 mm [36]. The topography is quite undulating, with high elevations in the south and low elevations in the north. The province covers plains, low mountains, hills, and basins and is rich in soil types [37]. In addition, the population in the north of Anhui Province is significantly higher than the population in the south. This has resulted in the north of Anhui Province supporting a larger population with fewer water resources, with significant regional differences in water supply and demand. As a result, the economic development of Anhui Province also shows obvious north–south differences due to a variety of natural factors and population distribution [38].

2.2. Data and Materials

2.2.1. Land Cover

The ChinaCover 2015 and 2020 datasets used in this study were produced by the Aerospace Information Research Institute, Chinese Academy of Sciences [39]. The ChinaCover 2015 and 2020 classification system includes 10 primary classes and 55 secondary classes with a spatial resolution of 10 m, as shown in Table 1. The primary classes are consistent with the land cover classification system of the Intergovernmental Panel on Climate Change. The secondary classes follow the rules of categorization determined by the Land Cover Classification System of the Food and Agriculture Organization of the United Nations [35].
Remote sensing data is the main data source for the land cover mapping of the ChinaCover datasets. Chinese environmental satellite (HJ-1A/B) data, Sentinel data, and Gaofen support high-resolution land cover mapping. Landsat, China–Brazil earth resource satellite (CEBERS) data and the synthetic aperture radar (SAR) data of the European Remote Sensing satellite (ERS-2), the Advanced Spaceborne Thermal Emission, and Reflection Radiometer Global Digital Elevation Model (ASTER GDEM) were used as auxiliary data. ChinaCover employed an object-oriented multi-level classification methodology. Additionally, change detection methods of change vector analysis (CVA) and spectral angle mapping (SAM) were used to produce the year-on-year data. Accuracy assessment was performed by both map segment validation and regional quality verification. Based on ground samples, the average accuracy for the primary classes was 91% [39,40], and the secondary classes were used to calculate HAILS index.

2.2.2. Auxiliary Data

Statistics for Anhui Province in 2015 and 2020 were obtained from the official website of the Anhui Provincial Bureau of Statistics [31], including population density, rural and urban population density, as well as Gross Domestic Product (GDP), primary industry, secondary industry, and tertiary industry GDP. GDP generated per square kilometer of land (average land GDP) for the whole industry and three industries was calculated based on these data. Digital Elevation Model (DEM) data with a spatial resolution of 30 m were acquired from the Advanced Spaceborne Thermal Emission and Reflection Radiometer (https://search.earthdata.nasa.gov/search (accessed on 23 September 2022)). Slopes were derived from the DEM data to characterize the steepness of a slope in slope analysis. The day-by-day VIIRS/NPP nighttime light remote sensing data in 2015 and 2020 was accessed by Google Earth Engine (GEE), which has a spatial resolution of 500 m [41]. Nighttime light data can indicate the strength of the electrical infrastructure and energy development [42]. The nearest neighbor assignment method was used to resample nighttime light data to 1000m to match the HAILS results.

2.3. Methods

2.3.1. HAILS Estimation

According to the definition of the HAILS index, the different levels of use, modification, and exploitation of the natural land surface by human activities vary. These human activities are graded and defined in this way: use as a function of human utilization of the land surface only without the change of original natural cover, modification as when human activities transform the original natural cover of the land surface, and exploitation as when human activities not only modify the original cover of the land surface but also affect the function of the exchange of water, nutrients, air, and heat up and down the land surface. The construction land equivalent conversion factor (CI) is used to characterize the interrelationship between land cover type and human activity, and the HAILS index is calculated as follows [15,17]:
H A I L S = S C L E S × 100 %
S C L E = n 1 k S L n × C I n
where SCLE is the equivalent area of construction land, and S is the total area of a given area. SLn is the area of a certain type of land cover type. CIn is the construction land equivalent conversion factor for a certain type of land cover type; k is the number of land cover types within a certain study unit.
Based on the three levels of human activities on the natural land surface above, namely, use, modification, and exploitation, the algorithm of CI is defined as follows. The CI is set to 0 when there is no use to the natural land surface, which means that the natural properties of the natural cover surface are unchanged and not utilized. The algorithm of CI at the user level is divided into 3 equal parts between 0 and 0.2, namely, natural cover unmodified but utilized, natural cover modified—planted with perennials, and natural cover modified—planted with 1-year-old crops. The feature markers in this layer show a progressive relationship in terms of the degree of contribution to the natural cover features, and the maximum of three parts is taken as the value in this level. The modification level is defined to build an artificial barrier on the natural land surface with four separate natural exchange characteristics of the surface layer, including the natural exchange of water, nutrients, air, and heat. It splits this level into five independent parts, defining each part to correspond to a feature value of 0.2. The feature value in this layer can be accumulated, and the accumulation is a multiple of 0.2. The exploitation level means that the natural cover is built with artificial barriers, and the natural exchange of water, nutrients, air, and heat is blocked above and below the natural surface, with its CI value defined as 1 [15].
These three levels are the theoretical basis for calculating the equivalent area of construction land for different land cover types. In the use and modification level, the human activity intensity of natural cover change and natural cover modified-planted with 1-year-old crops is consistent and links the levels together with a feature value of 0.2. These three levels represent a gradual increase in the contribution of human activity to the natural cover surface, with each part in the user level being progressive in nature and calculated as a maximum, while each part in the modification level is independent and cumulative [26].
The years 2015 and 2020 were selected as the key study years with the high increase rate of urbanization and industrialization affected by significant human activities under the policy of the 13th Five-Year Plan. Thus, in this paper, we calculated HAILS of 2015 and 2020, in which ChinaCover datasets provide land cover with a higher resolution of 10 m. Then, a 100 × 100 land cover count was chosen as a single HAILS index unit to balance the resolution of land cover and the accuracy of the algorithm, and 16 prefecture-level cities were used as the other HAILS index unit to verify the validity of it.

2.3.2. Analysis Methods

A natural grading method was adopted to classify the HAILS; it was divided into 5 grades, including <2%, 2–10%, 10–20%, 20–30%, and >30%. The <2% part was defined as negligible human activity intensity [17]. In the slope analysis, the slope was divided into five grades to analyze the HAILS spatial distribution in different slope regions and their variation patterns from 2015 to 2020. Five grades were named flat slopes (<2°), gentle slopes (2–6°), slopes (6–15°), steep slopes (15–25°), and sharp slopes (>25°), according to the Technical Regulations for Current Land Use Survey promulgated in 1984.
The hydrological path analysis method was adopted to analyze the relationship between HAILS and flow-path distances of all rivers, Yangtze as well as Huaihe rivers [43]. The areas <20 km were defined as the riparian zone, which were divided into 50 buffer belts on average, and calculated the HAILS in each belt both in 2015 and 2020. Meanwhile, the curve-fitting method simulated the mathematical variation of HAILS with water flow-path distance, which was used to analyze the HAILS variation characteristics with the water flow-path distance [44].
The zonal statistics method was used to calculate population density, urban and rural population density, average land GDP, primary industry, secondary industry, and tertiary industry average land GDP, as well as the average nighttime light data. Pearson correlation method and significance test were adopted to discuss the correlation of the HAILS with population density, urban and rural population density, aver-age land GDP, primary industry, secondary industry, and tertiary industry average land GDP, as well as the average of nighttime light data [45]. The larger the absolute value of the correlation coefficient, the stronger the correlation, and the closer the absolute value of the correlation coefficient is to zero, the weaker the correlation. The correlation coefficients were classified as follows: 0.8–1.0 as a very strong correlation; 0.6–0.8 as a strong correlation; 0.4–0.6 as a moderate correlation; 0.2–0.4 as a weak correlation; and 0–0.2 as a very weak or no correlation. The p-value of significant results was expressed as follows: <0.001 as “***”; 0.001–0.01 as “**”; 0.01–0.05 as “*”; 0.05–0.1 as “^” [46,47].

3. Results

3.1. Spatial and Temporal Variations of HAILS

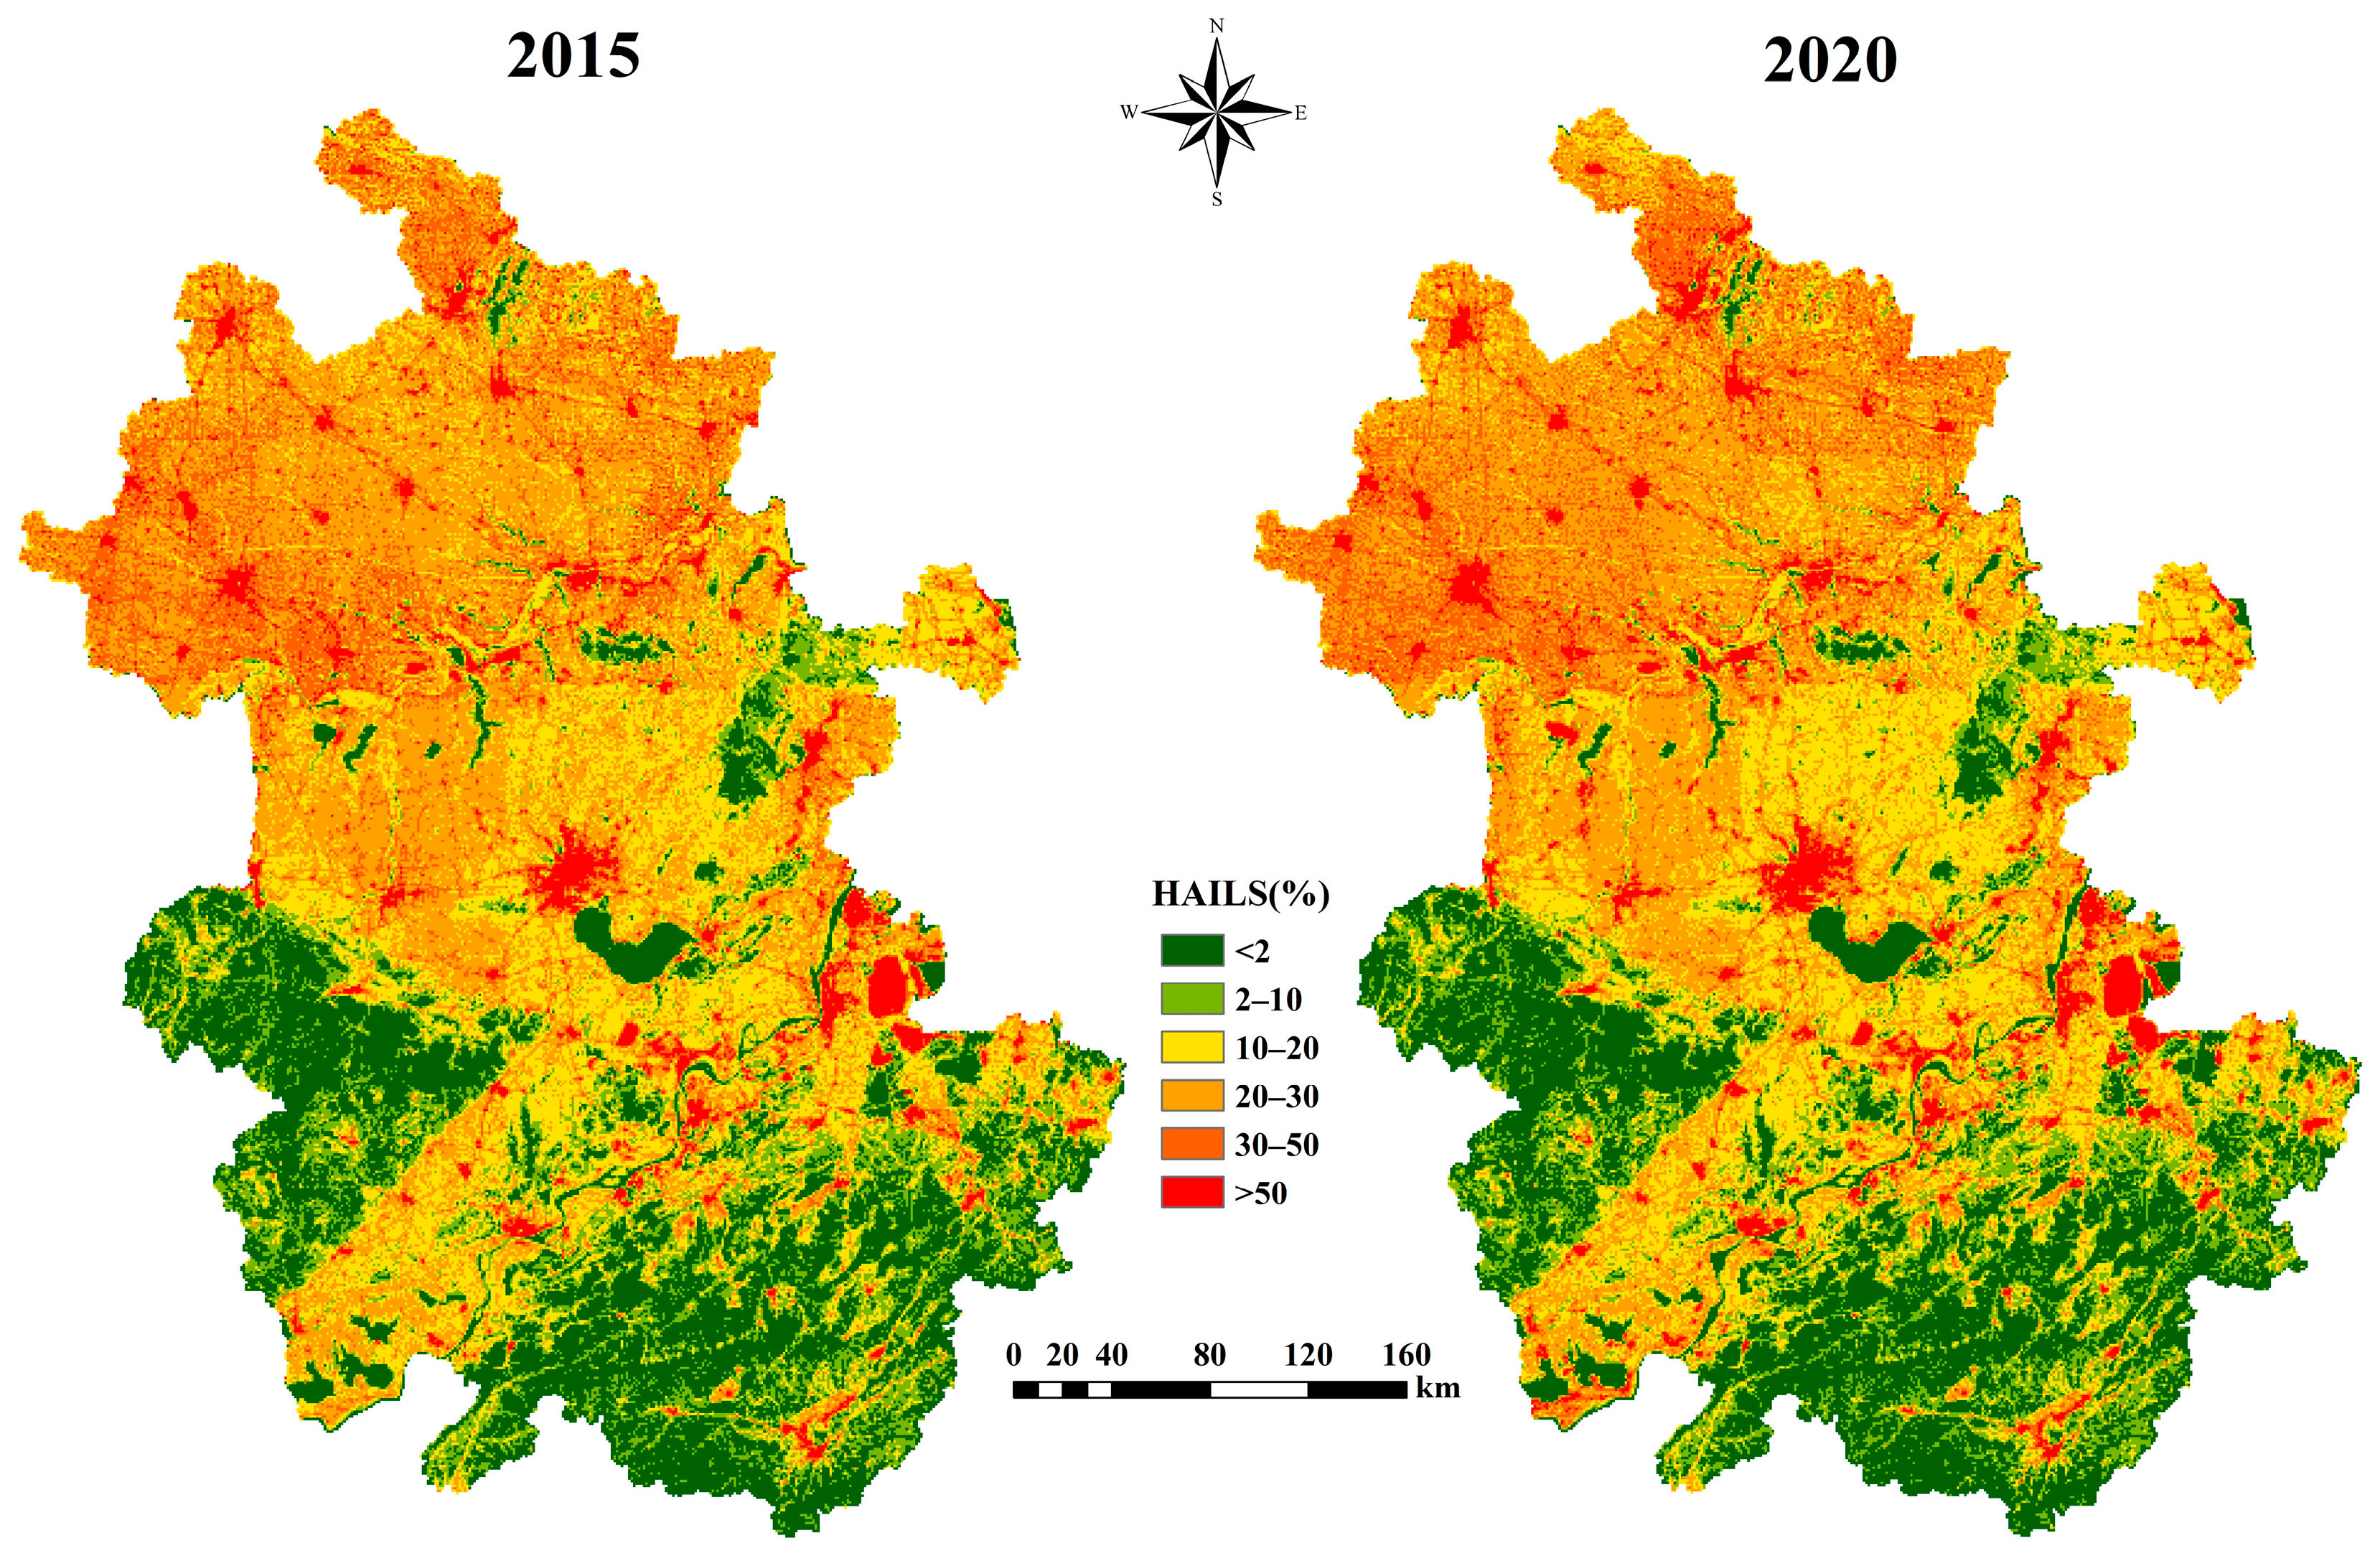
The spatial distribution of the HAILS in Anhui Province is shown in Figure 2. In terms of spatial distribution, it can be seen that the areas with higher HAILS were mainly distributed in the central part of Hefei city, as well as the densely populated areas of the Yangtze Plain and the Huaihe Plain. While in the western and southeastern mountainous areas covered mainly by forest lands, the HAILS values were relatively low and were mostly below 2%. Overall, the HAILS distribution was roughly higher in the north and lower in the south, which is basically consistent with the population distribution. From 2015 to 2020, the areas with increased HAILS accounted for 40.7% of the total area of Anhui Province, which was mainly the land to be developed, as well as the arable land around urban agglomerations and surrounding suburbs. These areas were affected by the rapid population growth and the demand for daily production and life for people living around the expanding or constructed buildings. The areas with decreased HAILS, accounting for 49.0%, were about 69,649 km2 and were mainly concentrated in the terraces with medium and low slopes. These regions were subject to a number of ecological and environmental protection policies that required reducing human development and the use of the land.
From 2015 to 2020, the mean HAILS in Anhui Province increased slightly by 0.4%, from 19.1% to 19.5%. Areas with HAILS less than 2% were defined as areas with negligible human activity intensity [17]. As can be seen from Table 2, the mean HAILS of 2015 and 2020 with HAILS less than 2% were both 0.4%, but the area had a small increase by 75 km2. When the HAILS were between 2% and 10%, the mean HAILS of the two years were also the same, with a value of 5.4%, while the area decreased from 18,151 km2 in 2015 to 18,074 km2 in 2020. When the HAILS were between 10% and 20%, the mean HAILS remained the same, but the area increased significantly by approximately 759 km2. When the HAILS were between 20% and 30%, the mean HAILS increased slightly from 23.7% to 23.9%, with a significant decrease area of approximately 2293 km2. Overall, from 2015 to 2020, there was little change in the mean value and area with HAILS of less than 10%. While the changes in the mean HAILS were most pronounced in areas with HAILS of greater than 30%, which showed a notable increase from 44.1% to 44.7%, as well as an increase in an area of 1536 km2.
Overall, it can be seen that higher HAILS were mainly located in the central part of Hefei, as well as along the Yangtze and the Huaihe rivers. Additionally, human activity intensity increased from 2015 to 2020, especially in the high human activity intensity region.

3.2. Slope Analysis of HAILS

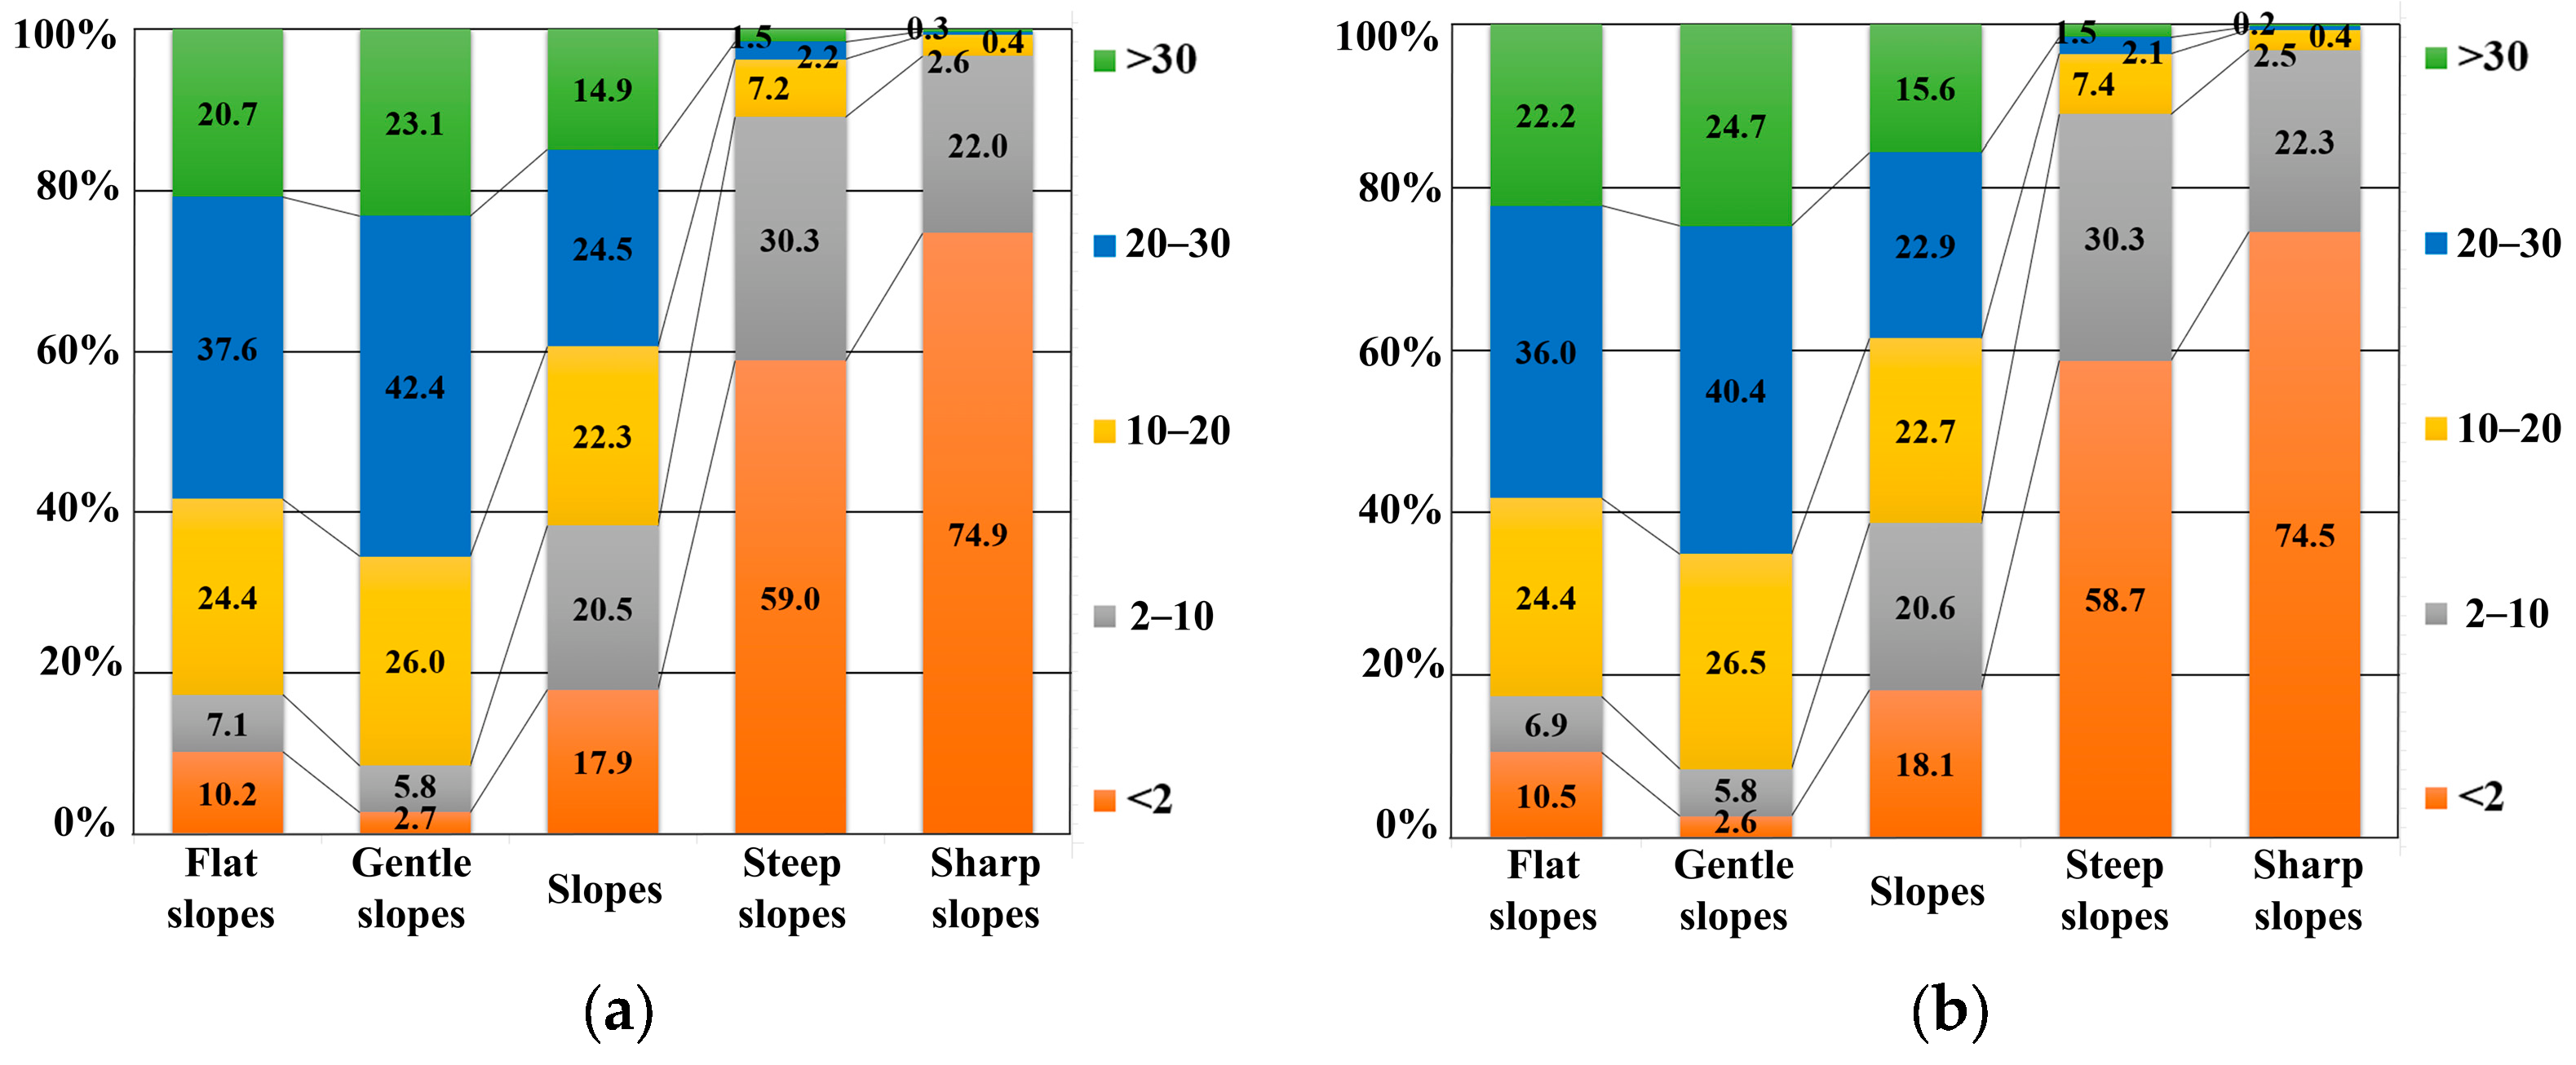
Five grades named flat slopes (<2°), gentle slopes (2–6°), slopes (6–15°), steep slopes (15–25°), and sharp slopes (>25°), were used to analyze the HAILS spatial distribution in different slope regions and their variation patterns from 2015 to 2020. As shown in Figure 3, comparing the percentage of HAILS on different slopes from 2015 to 2020 revealed that the largest changes happened in the gentle slopes, with the HAILS of 20–30% decreasing by 2.0%. The percentage of HAILS > 20% decreased in the slopes, gentle slopes, and sharp slopes, but with no more than 1.5% in other slope zones. From the variation of each slope zone, in the flat slopes, the largest changes over the five years were in the 20–30% and >30% intervals, with the former decreasing by 1.6% and the latter increasing by 1.5%, while the remaining three HAILS intervals all showed changes of no more than 0.3%. In the gentle slopes, the largest changes in HAILS were also in the 20–30% and >30% intervals, with the former decreasing by 2.0% and the latter increasing by 1.6%. The changes in slopes were more evenly distributed, with the largest changes in the 20–30% interval decreasing by 1.6% and also over 0.3% in the 10–20% and >30% intervals, both increasing by 0.4% and 0.7%, respectively. In the steep slopes and sharp slopes, the largest changes were in the <2% interval, with decreases of 0.3% and 0.4%, respectively, and smaller changes in the remaining HAILS intervals.
The slope distribution of the HAILS showed that in the flat slopes, the HAILS were mostly in the medium to a high-intensity range of 20–30%, which exceeded 36% of the area. In the gentle slopes, HAILS were also mainly distributed in the 20–30%, while in the slopes, the HAILS of five grades were distributed almost meanly with about a percentage of 20% individually. In the steep slopes, the HAILS were mainly <2%, accounting for over 58%. In the sharp slopes, the HAILS of <2% were also a major component, and the high HAILS of >20% accounted for less than 1%.
Thus, it can be seen that human activities were most intense in gentle slopes, as was the variation of the HAILS, while for mountainous areas with sharp slopes, human activities had the least degree of impact on natural resources.

3.3. HAILS Variation along the Flow-Path Distances

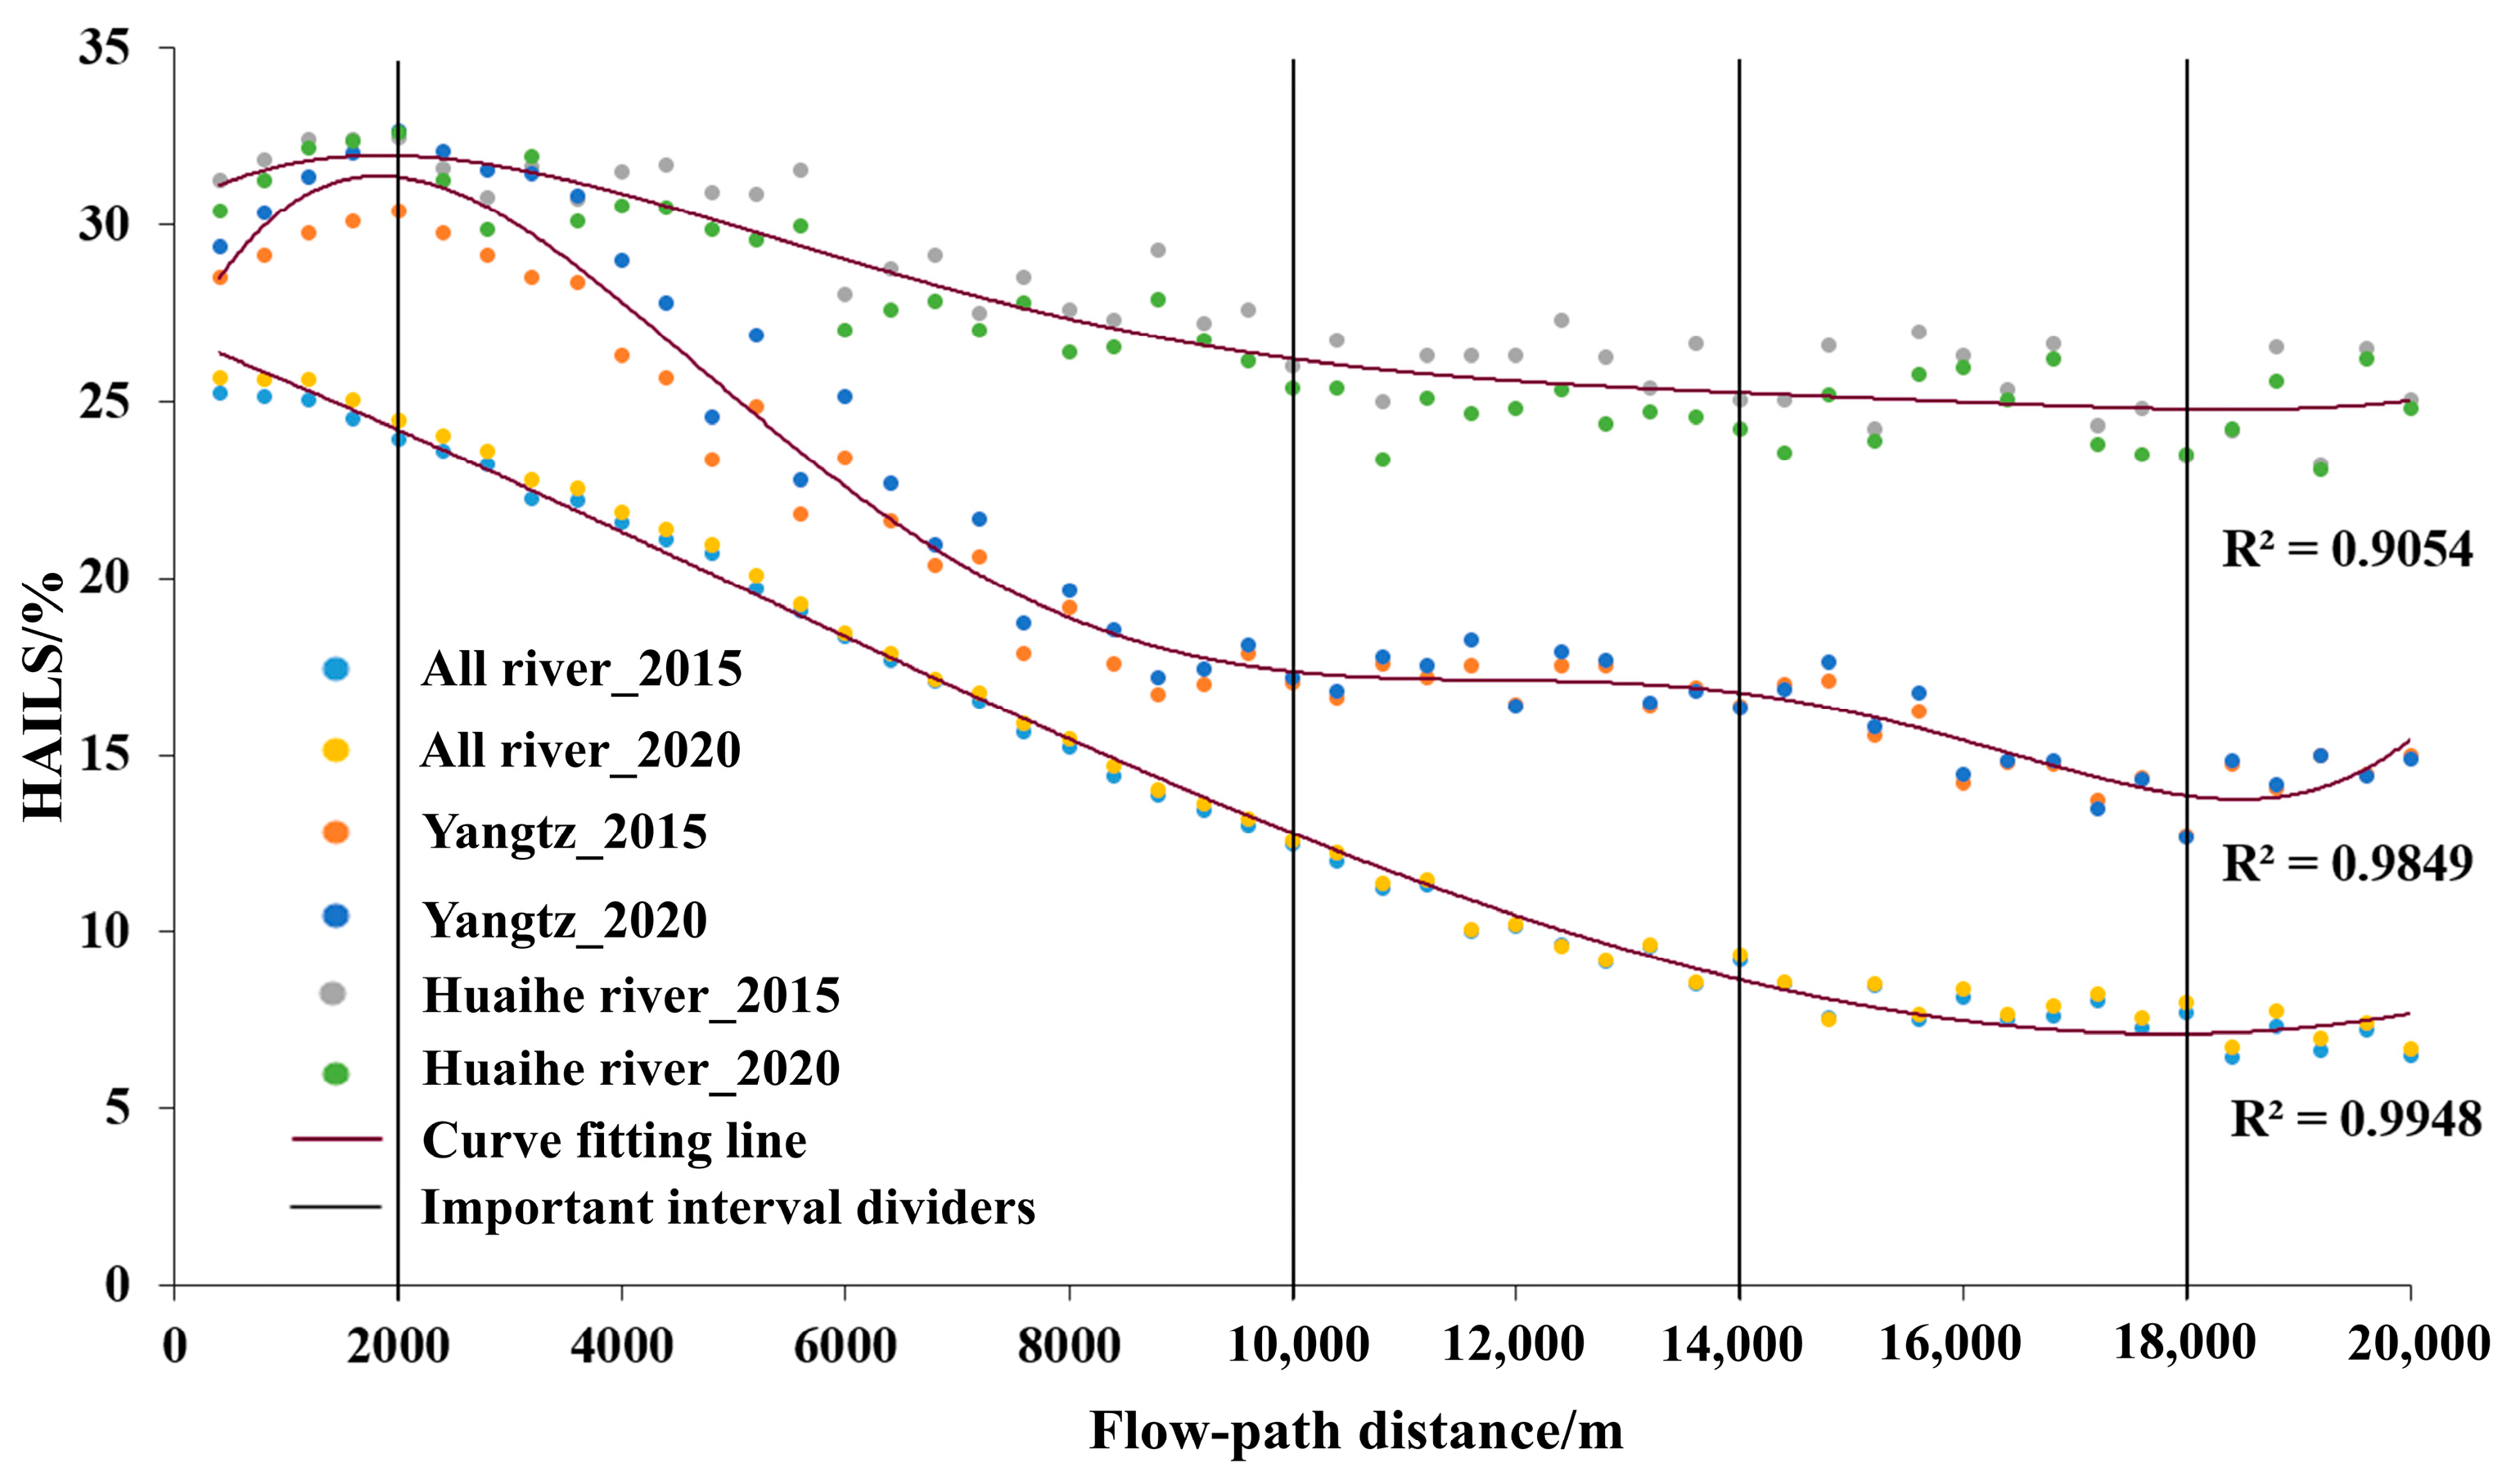
As shown in Figure 4, the HAILS changed with flow-path distances in 2015 and 2020, basically the same in the riparian zone. For all rivers, HAILS showed a clear and gentle decreasing trend with increasing distance, from a maximum of about 25.0% to about 6.5%. Before 10 km, HAILS showed almost no fluctuation with a generally consistent slope, especially between 2 km and 8 km. After 10 km, the HAILS fluctuated with a decreasing trend, and the fluctuation was more significant. The HAILS from the Yangtze and the Huaihe rivers both showed a trend of first increasing, then decreasing sharply, and finally fluctuating and changing gently. For the flow-path distance of Yangtze, HAILS increased before 2 km from about 29% to about 31%. Between 2 km and 10 km, HAILS values decreased rapidly, especially between 4 km and 8 km. Then, the HAILS showed a fluctuating trend and a small increase after 18 km. The variation from the Huaihe river was the least volatile of the three flow-path distances, with a slight increase followed by a slow fluctuation and gentle decrease. The inflection occurred at about 2 km when the HAILS turned from increasing to decreasing. In each flow-path distance belt, the HAILS in 2020 were higher than those in 2015, except for the Huaihe river. The HAILS in all rivers had the smallest changes between 2015 and 2020 compared to the HAILS differences between these two years for the Yangtze river and for the Huaihe river. For the Yangtze, the HAILS values between 2015 and 2020 showed the largest difference of about 2.9% at a 3 km distance. For the Huaihe river, the HAILS in 2020 were smaller than those in 2015, and the differences were obvious in the region from 4 km to 15 km, with a maximum difference of about 2.1%.
The Yangtze river meanders through the plains in Anhui Province with a little drop-off and is mainly used for shipping and domestic water production, making its riparian zone more densely populated with human activities and higher HAILS values. The Huaihe river is surrounded by a large number of plains, and its abundant water resources have promoted the development of agriculture in the riparian zone and more intense human activities. Therefore, HAILS values for the Huaihe river are higher than HAILS for all rivers. At the same time, the rivers, as part of water resources, tend to decrease in intensity as the distance increases, making it challenging to meet the daily production and livelihoods of large populations [35]. However, the Yangtze and Huaihe rivers were predominately wetlands within 2 km, and the closer to these rivers, the more unsuitable for human production and living, resulting in the HAILS values increasing with distance within 2 km.

4. Discussion

4.1. Validation of the HAILS Index

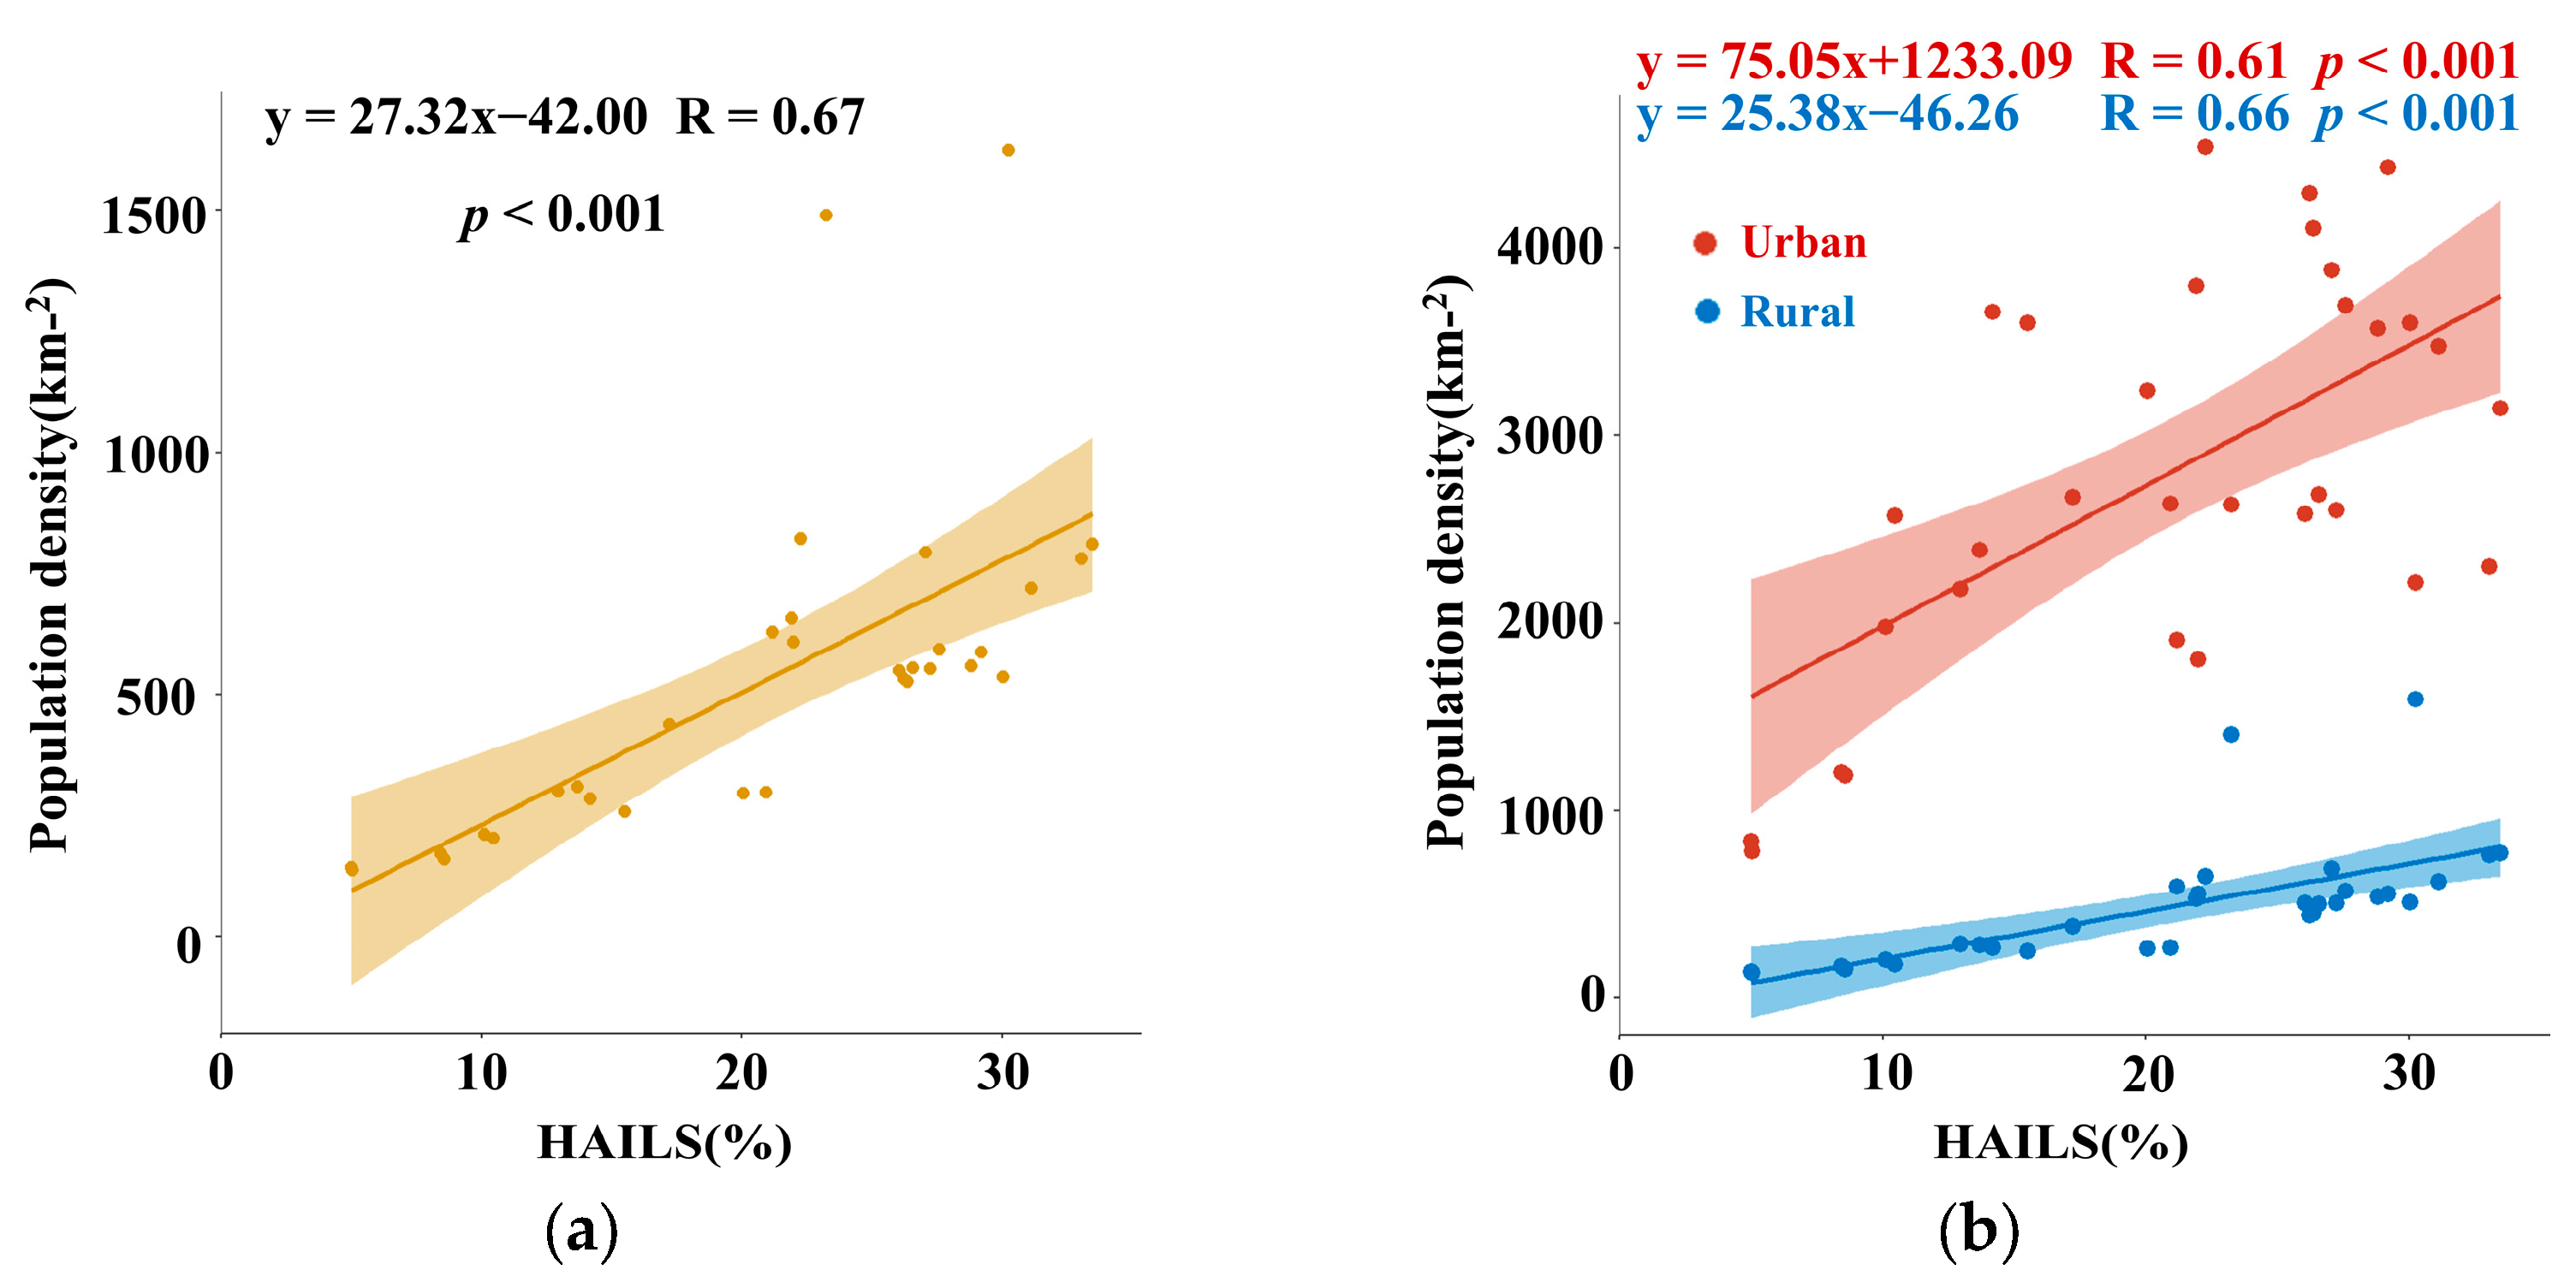
Population density represents the random distribution of human beings in the process of adaptation to survival and development, which can reflect the activity characteristics of the population [48,49], while GDP reveals the socioeconomic development of human beings [50]. This study used Pearson correlation coefficients to correlate the HAILS index with demographic and economic statistics in Figure 5 for 16 cities of Anhui Province separately. As shown in Figure 5a, the HAILS was correlated strongly (R = 0.67 ***) with the population density, showing a good characterization of the quantitative features of the population. As shown in Figure 5b, further analysis for rural and urban population densities showed that the HAILS correlated strongly with the rural population density (R = 0.66 ***) and the urban population density (R = 0.61 ***). Due to the fact that most human activities in rural areas were basic production and livelihoods such as agriculture, forestry, animal husbandry, and fishing. The global resources from the land surface used by these human activities can be easily reflected by the changes in land cover [33]. In addition, human activities in urban areas were mainly industry, commerce, and construction, and the changes could be reflected in the land surface. However, these human activity intensities of individual activities varied greatly, which could obviously affect the correlation results above [51].
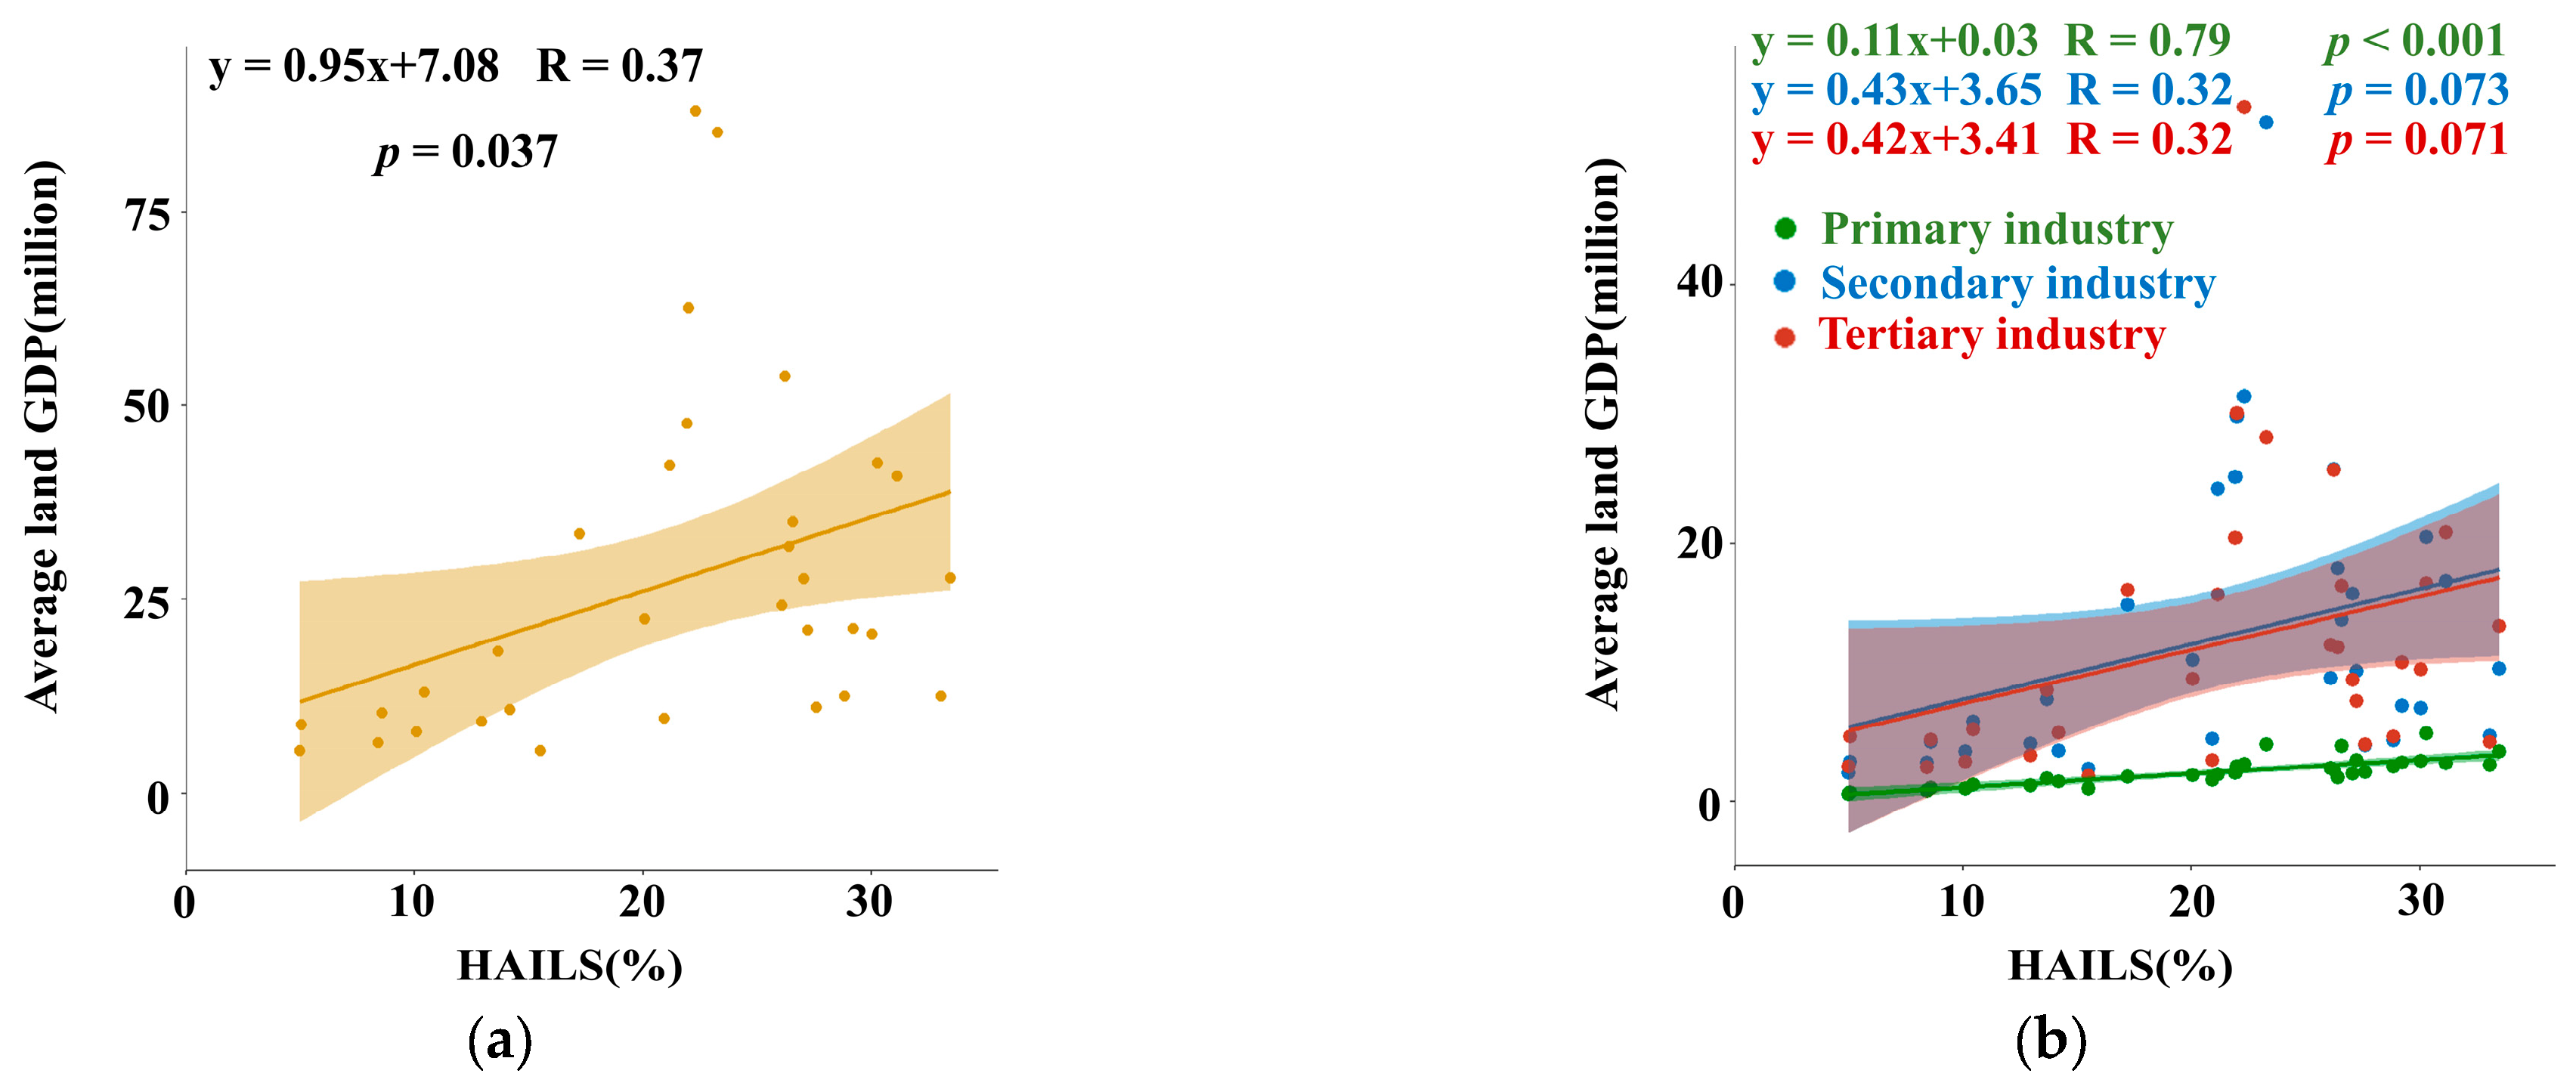
As shown in Figure 6a, the correlation between the HAILS and average land GDP was a weak correlation (R = 0.37 *). For further verification, the average land GDP of the three major industries was analyzed separately, as shown in Figure 6b. The results showed that the HAILS had a strong positive correlation with the primary industry (R = 0.79 ***) and a weak correlation with the secondary industry (R = 0.32 ^) and the tertiary industry (R = 0.32 ^).
The primary industry mainly includes daily human activities, such as planting, growing crops, cultivating, harvesting forests, and aquaculture, so changes in its GDP over a long time can be made evident from changes in land cover [52]. The secondary industry is mainly manufacturing and construction, and the tertiary industry is services, such as the power industry, mining, transport, finance, accommodation, and catering. Developments from the secondary and tertiary industry can be slightly reflected in land surface with land cover changes, such as the construction of new factories and urban buildings, the expansion of factory sites, as well as opencast coal mining [50]. These industries are strongly influenced by dominant firms, making the GDP development and spatial distribution of the 16 cities uneven, resulting in a weak correlation with HAILS. Moreover, the secondary industry and tertiary industry influence the overall GDP in Anhui Province heavily, with a large proportion of 90%, resulting in a weak correlation between the HAILS and average land GDP [31].
As shown in Figure 6, the average land GDP values of Hefei and Tongling were much higher than other cities, especially for the secondary and tertiary industries, affecting the correlation between the HAILS and average land GDP. For further study, we removed the cities of Hefei and Tongling and calculated the correlation coefficients between the HAILS and GDP of primary, secondary, and tertiary industries in the remaining 14 prefecture-level cities. As shown in Figure 7, it is found that the correlation between the HAILS index and GDP of secondary industry (R = 0.44 *) and GDP of tertiary industry (R = 0.48 **) has improved, but the correlation is still at a moderate level of correlation. That is because Hefei’s secondary and tertiary industries each accounted for more than a fifth of Anhui’s GDP, but its total population was only a tenth of Anhui’s based on the Anhui Statistical Yearbook for 2015 and 2020. Tongling was similar to Hefei in having a smaller total population but a higher share of GDP. The secondary and tertiary industries cannot adequately show the difference in the industrial economy in the form of the area on the land cover data, and the participation in HAILS calculation is somewhat limited, resulting in a weak correlation between HAILS index and GDP of secondary and tertiary industries, which is limited by the economic distribution. As a result, the over-concentrated economy reduced the correlation between the HAILS index and the secondary and tertiary industries.

4.2. Correlation between HAILS and Nighttime Light Data

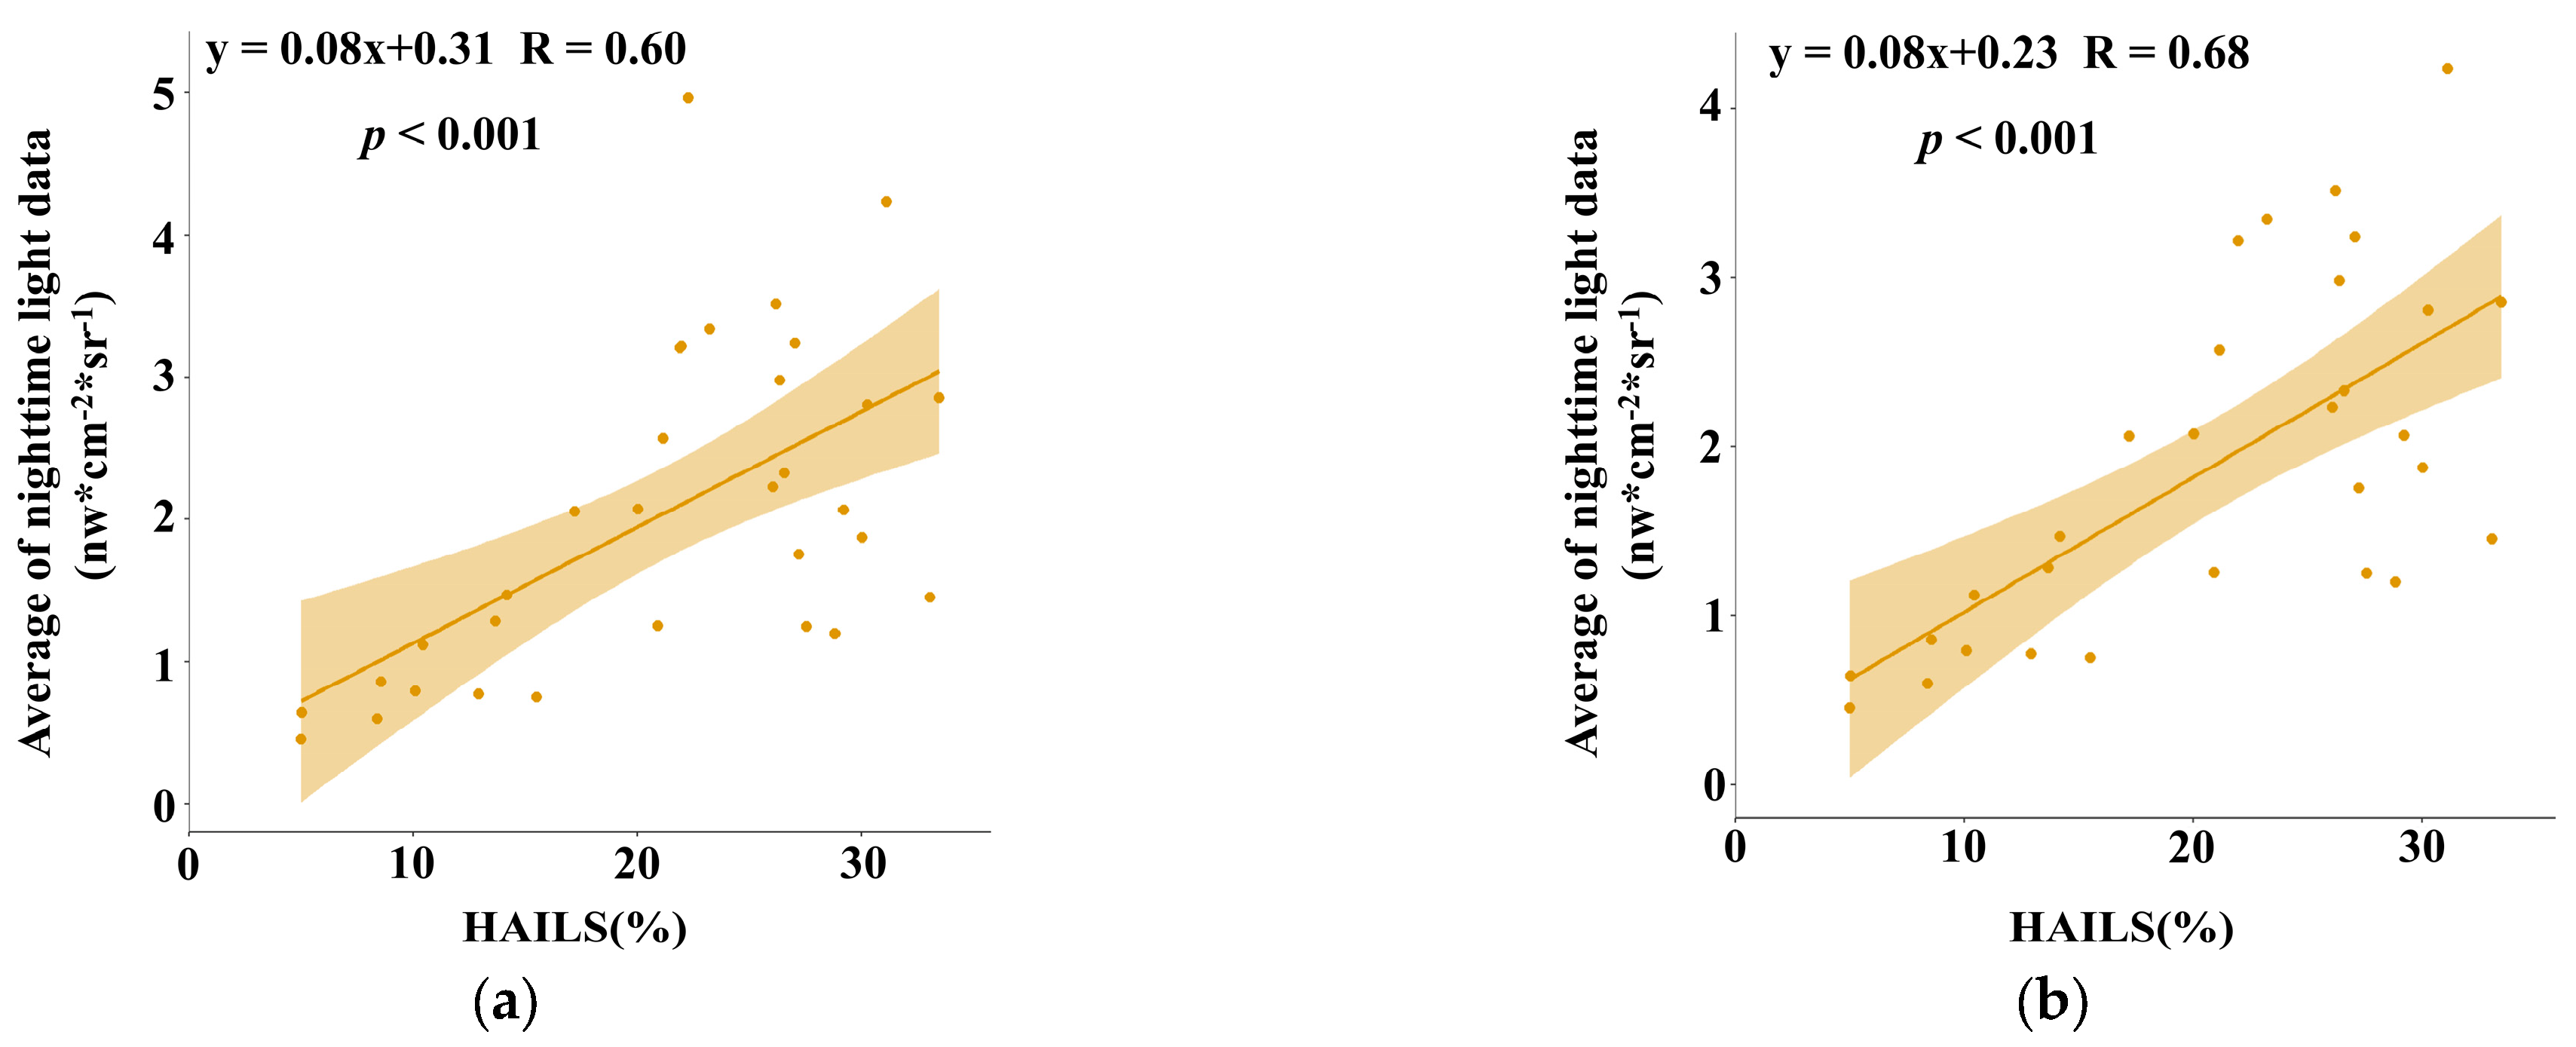
The nighttime light data obtains ground-level information related to light intensity through infrared spectroscopy, which includes light from city lights, small areas of residential land, and traffic detected by the sensor, while the dark countryside and backgrounds cannot be monitored [53]. Pearson correlation analysis was used to investigate the correlation between the HAILS and the corresponding average of nighttime light data in Figure 8 in every 16 cities of Anhui Province in 2015 and 2020. As shown in Figure 8a, there was a strong correlation between the HAILS and the average nighttime light data (R = 0.60 ***). The nighttime light data describes the information of human activities at night, making it strongly relevant to HAILS [54,55,56,57].
Hefei has a high proportion of urban streetlights in the province, with total electricity consumption reaching 14.5% and 15.8% of the province in 2015 and 2020, respectively, while the population of Hefei only accounts for 12.7% and 10.4% of the total province. This intense nighttime human activity showed a specific point in Figure 8a compared to other prefecture-level cities in Anhui Province. We removed Hefei and calculated the correlation coefficient again for the remaining 15 prefecture-level cities; the correlation between the HAILS index and the nighttime light data (R = 0.68 ***) has improved somewhat in Figure 8b.
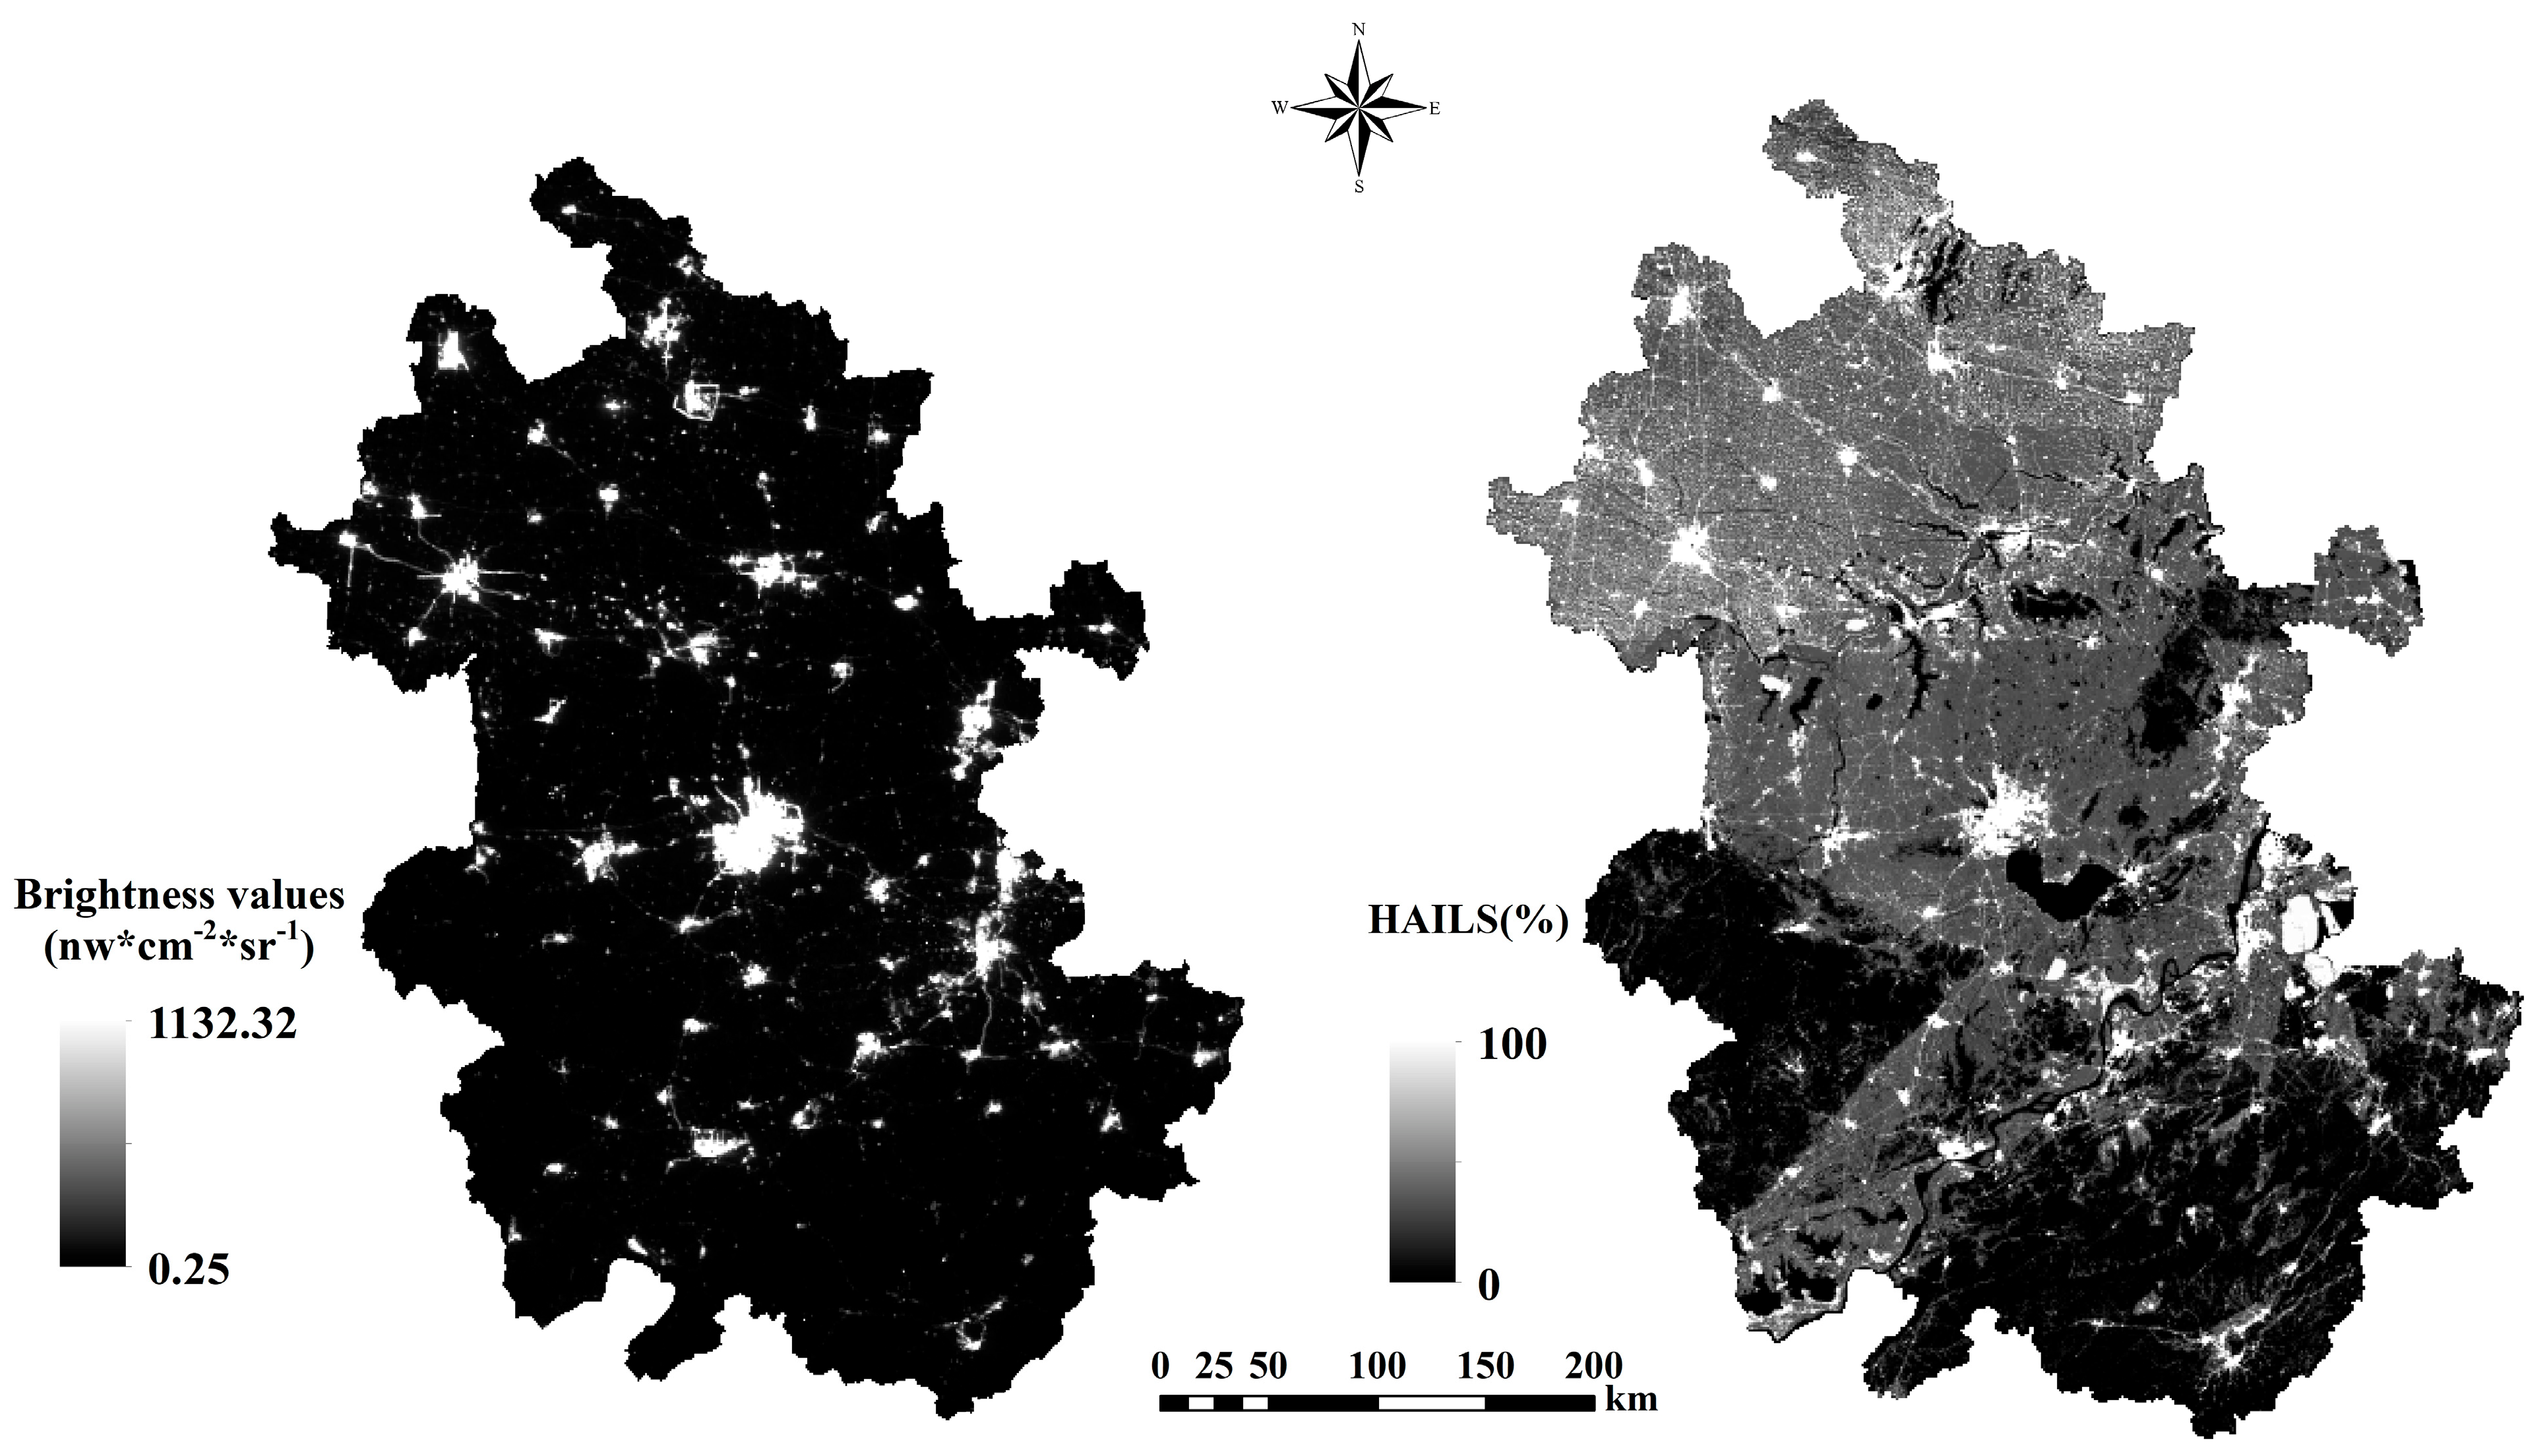
In order to visually compare the HAILS and nighttime light data for 2020, we adopted the same standard deviation stretching method (Figure 9). The results showed that in the central, northwest, north-central, and eastern Anhui Province, the area mainly distributing cities, their nighttime light data were stronger and more consistent with the higher HAILS distribution. However, the western and southern mountain areas, as well as the areas along the rivers, exhibited relatively low nightlight brightness values with only scattered bright spots. In these areas, the distribution of the darker nighttime light data was different from the smaller HAILS due to the absence of human activities and the limitations of the nighttime light data in only describing human activities at night.

4.3. Drivers for the Changes

The changes in HAILS of Anhui Province from 2015 to 2020 can be summarized in two main aspects, namely, the rapid growth of the urban population and economy, as well as ecological protection policies.
The rapid growth of the urban population and economy are major drivers of global human activities [58]. It has stimulated human activities in the expansion of urban land and the occupation of arable land around urban agglomerations, intensifying human modification of natural land surfaces and increasing human demand for land, work, and medical care [2,59,60]. As a result, the HAILS > 30%, high human activity intensity, showed a notable increase from 44.1% to 44.7%, as well as an increase in the area of 1536 km2. In addition, the rapid growth in the riparian zone led to busier shipping and an increase in the production of water. In recent years, these features became more apparent along the Yangtze, making its riparian zone more densely populated with human activity and higher HAILS, with an increase in HAILS from 20.6% to 21.4%.
In response to ecological issues, Anhui Province has implemented a series of ecological protection policies. The “Ten Million Mu Forest Growth Project”, launched in 2012, has increased forest lands in Anhui Province [59]. As can be seen from the HAILS distribution in 2015 and 2020, HAILS showed a low intensity in the southern mountainous areas (Figure 2). Meanwhile, this policy has resulted in tourism development under control in important ecological function areas such as Jinzhai Tianma Nature Reserve and Qingliangfeng Nature Reserve in southern Anhui [61]. The implementation of the “Grain for Green Project” has resulted in a cessation of land reclamation and exploitation of energy resources [62]. It led to HAILS > 20% with high-intensity decreases in the slopes, steep slopes, and sharp slopes. Moreover, the promotion of the “Beautiful Huaihe (Anhui) river ecological economic belt” reduced the human activity intensity in the riparian zone of the Huaihe river, resulting in a decrease of 0.8% in HAILS from 2015 to 2020.

5. Conclusions

Based on the ChinaCover datasets from 2015 to 2020, this study quantitatively estimated the spatial distribution of HAILS in Anhui Province and combined topographical, socio-economic, and nighttime light data to analyze the drivers of HAILS changes.
The results showed that the areas with higher HAILS were mainly located in the central part of Hefei, along the Yangtze and the Huaihe rivers, while most of the western and southern areas had low values. The area of decreased HAILS was slightly higher than the area that increased, while the mean HAILS in Anhui Province increased by 0.4% from 2015 to 2020. The largest changes from 2015 to 2020 happened in the gentle slopes with the HAILS of 20–30%, and the percentage of HAILS > 20% decreased in the slope over 15°. The HAILS showed a clear decreasing trend after 2 km in 2015 and 2020. Furthermore, the HAILS in 2020 were higher than in 2015 in each flow-path distance belt, except for the Huaihe river. Moreover, the HAILS index strongly correlated with population density, rural population density, urban population density, average land GDP of the primary industry, and nighttime light data. The nighttime light data and HAILS were highly correlated in areas with high brightness values and weak in areas with smaller luminance values. The rapid growth of the urban population and economy, as well as ecological protection policies, were drivers of change in human activity intensity.
The HAILS index can well reflect the human activity intensity in Anhui Province from 2015 to 2020. However, it should be noted that some changes in human activity intensity may not change the land cover type; for example, the discharge of effluent from industrial production into water systems, the upgrading of urban agglomerations instead of expansion, etc. These cases where the human activity intensity changes without a shift in land cover type make the HAILS calculations the same, resulting in a lack of some gradient change in the HAILS index. Using some indicators with a strong gradient in conjunction with land cover, such as some spatialized statistics data related to human activities, including population density, GDP, nighttime light data, grazing intensity, etc., may expand the description of human activity of the HAILS index. Likewise, objective modeling methods, such as factor analysis, principal component analysis, and entropy weighting, may solve the limitations of the algorithms of the HAILS index. Therefore, the HAILS can be updated, modified, and reconstructed to adapt to different regions.

Author Contributions

Conceptualization, W.G.; methodology, software, and validation, J.W. and W.G.; formal analysis, W.G., J.W., Y.Z. and D.Z.; data curation, W.G. and J.W.; writing—original draft preparation, J.W.; writing—review and editing, W.G., Y.Z., Z.Z. and D.Z.; visualization, J.W.; supervision, D.Z. and Z.Z.; project administration, Y.Z.; funding acquisition, W.G. and D.Z. All authors have read and agreed to the published version of the manuscript.

Funding

This research was funded by the Open Fund of State Key Laboratory of Remote Sensing Science, grant number OFSLRSS202109; Fundamental Research Program of Shanxi Province, grant number 202203021212273; Scientific and Technological Innovation Programs of Higher Education Institutions in Shanxi, grant number 2022L034.

Data Availability Statement

The authors declare that the data of this research are available from the corresponding author upon reasonable request.

Acknowledgments

The authors thank the team led by the Wu Bingfang from the Aerospace Information Research Institute, Chinese Academy of Sciences, for providing the ChinaCover datasets. Furthermore, we appreciate the editors and reviewers for their constructive comments and suggestions.

Conflicts of Interest

The authors declare no conflict of interest.

References

  1. Ouyang, Z.; Zheng, H.; Xiao, Y.; Polasky, S.; Liu, J.; Xu, W.; Wang, Q.; Zhang, L.; Xiao, Y.; Rao, E.; et al. Improvements in ecosystem services from investments in natural capital. Science 2016, 352, 1455–1459. [Google Scholar] [CrossRef] [PubMed]
  2. Ellis, E.C.; Ramankutty, N. Putting people in the map: Anthropogenic biomes of the world. Front. Ecol. Environ. 2008, 6, 439–447. [Google Scholar] [CrossRef] [Green Version]
  3. Hu, X.; Ma, C.; Huang, P.; Guo, X. Ecological vulnerability assessment based on AHP-PSR method and analysis of its single parameter sensitivity and spatial autocorrelation for ecological protection—A case of Weifang City, China. Ecol. Indic. 2021, 125, 107464. [Google Scholar] [CrossRef]
  4. Xiong, Y.; Xu, W.; Lu, N.; Huang, S.; Wu, C.; Wang, L.; Dai, F.; Kou, W. Assessment of spatial–temporal changes of ecological environment quality based on RSEI and GEE: A case study in Erhai Lake Basin, Yunnan province, China. Ecol. Indic. 2021, 125, 107518. [Google Scholar] [CrossRef]
  5. Fang, J.; Yu, G.; Liu, L.; Hu, S.; Chapin, F.S., 3rd. Climate change, human impacts, and carbon sequestration in China. Proc. Natl. Acad. Sci. USA 2018, 115, 4015–4020. [Google Scholar] [CrossRef] [Green Version]
  6. Mu, H.; Li, X.; Wen, Y.; Huang, J.; Du, P.; Su, W.; Miao, S.; Geng, M. A global record of annual terrestrial Human Footprint dataset from 2000 to 2018. Sci. Data 2022, 9, 176. [Google Scholar] [CrossRef]
  7. Xu, H.; Wang, Y.; Guan, H.; Shi, T.; Hu, X. Detecting Ecological Changes with a Remote Sensing Based Ecological Index (RSEI) Produced Time Series and Change Vector Analysis. Remote Sens. 2019, 11, 2345. [Google Scholar] [CrossRef] [Green Version]
  8. Santos, R.G.; Machovsky-Capuska, G.E.; Andrades, R. Plastic ingestion as an evolutionary trap: Toward a holistic understanding. Science 2021, 373, 56. [Google Scholar] [CrossRef]
  9. Wang, S.J.; Wei, Y.Q. Qinghai-Tibetan Plateau Greening and Human Well-Being Improving: The Role of Ecological Policies. Sustainability 2022, 14, 1652. [Google Scholar] [CrossRef]
  10. de la Torre, S.; Snowdon, C.T.; Bejarano, M. Effects of human activities on wild pygmy marmosets in Ecuadorian Amazonia. Biol. Conserv. 2000, 94, 153–163. [Google Scholar] [CrossRef]
  11. Quan, R.-C.; Wen, X.; Yang, X. Effects of human activities on migratory waterbirds at Lashihai Lake, China. Biol. Conserv. 2002, 108, 273–279. [Google Scholar] [CrossRef]
  12. Zhou, J.; Fan, Z.-y.; Ng, K.-T.; Tang, W.K.S. An attractiveness-based model for human mobility in all spatial ranges. N. J. Phys. 2019, 21, 123043. [Google Scholar] [CrossRef]
  13. Filazzola, A.; Xie, G.; Barrett, K.; Dunn, A.; Johnson, M.T.J.; Maclvor, J.S. Using smartphone-GPS data to quantify human activity in green spaces. PLoS Comput. Biol. 2022, 18, e1010725. [Google Scholar] [CrossRef]
  14. Song, W.; Song, W.; Gu, H.; Li, F. Progress in the Remote Sensing Monitoring of the Ecological Environment in Mining Areas. Int. J. Environ. Res. Public Health 2020, 17, 1846. [Google Scholar] [CrossRef] [PubMed] [Green Version]
  15. Xu, Y.; Xu, X.; Tang, Q. Human activity intensity of land surface: Concept, methods and application in China. J. Geogr. Sci. 2016, 26, 1349–1361. [Google Scholar] [CrossRef]
  16. Liu, S.; Liu, L.; Wu, X.; Hou, X.; Zhao, S.; Liu, G. Quantitative evaluation of human activity intensity on the regional ecological impact studies. Acta Ecol. Sin. 2018, 38, 6797–6809. [Google Scholar] [CrossRef]
  17. Gao, W.; Zeng, Y.; Liu, Y.; Wu, B. Human Activity Intensity Assessment by Remote Sensing in the Water Source Area of the Middle Route of the South-to-North Water Diversion Project in China. Sustainability 2019, 11, 5670. [Google Scholar] [CrossRef] [Green Version]
  18. Zhao, Y.; Qu, Z.; Zhang, Y.; Ao, Y.; Han, L.; Kang, S.; Sun, Y. Effects of human activity intensity on habitat quality based on nighttime light remote sensing: A case study of Northern Shaanxi, China. Sci. Total Environ. 2022, 851, 158037. [Google Scholar] [CrossRef]
  19. Wen, Y. Preliminary discussion on the method of quantitative assessment of human activity intensity. Sci. Soc. 1998, 4, 56–61. [Google Scholar]
  20. Li, X.; Wang, L.; Zhang, Y.; Zhang, H. Analysis of Roles of Human Activities in Land Desertification in Arid Area of Northwest China. Sci. Geogr. Sin. 2004, 24, 68–75. [Google Scholar]
  21. Huang, L.; Shen, B. Evaluation on Interference Intensity of Human Activities in Dry Area. J. Xi’an Univ. Technol. 2009, 25, 425–429. [Google Scholar]
  22. Xu, Z.; Zhuang, D.; Yang, L. Construction and Application of Regional Quantitative Model of Human Activity Intensity. Geo-inf. Sci. 2009, 11, 452–460. [Google Scholar] [CrossRef]
  23. Hu, Z.; He, X.; Li, Y.; Zhu, J.; Li, X. Human activity intensity and its spatial distribution pattern in upper reach of Minjiang River. Chin. J. Ecol. 2007, 26, 539–543. [Google Scholar]
  24. Lund, A.M.; Gouripeddi, R.; Facelli, J.C. STHAM: An agent based model for simulating human exposure across high resolution spatiotemporal domains. J. Expo. Sci. Environ. Epidemiol. 2020, 30, 459–468. [Google Scholar] [CrossRef] [PubMed]
  25. Tranos, E.; Nijkamp, P. Mobile phone usage in complex urban systems: A space–time, aggregated human activity study. J. Geogr. Syst. 2015, 17, 157–185. [Google Scholar] [CrossRef] [Green Version]
  26. Gao, W. Analysis on the Temporal and Spatial Pattern of Human Activities and the Effects of Soil and Water Loss at the Basin Scale --Taking the Water Source Area of the Middle Route of the South to North Water Transfer Project as an Example. Ph.D. Thesis, China Forestry Science Research Institute, Beijing, China, 2017. [Google Scholar]
  27. Brown, M.T.; Vivas, M.B. Landscape Development Intensity Index. Environ. Monit. Assess. 2005, 101, 289–309. [Google Scholar] [CrossRef] [PubMed]
  28. Wang, Z.; Danish; Zhang, B.; Wang, B. Renewable energy consumption, economic growth and human development index in Pakistan: Evidence form simultaneous equation model. J. Clean. Prod. 2018, 184, 1081–1090. [Google Scholar] [CrossRef]
  29. Chi, Y.; Liu, D.; Wang, J.; Wang, E. Human negative, positive, and net influences on an estuarine area with intensive human activity based on land covers and ecological indices: An empirical study in Chongming Island, China. Land Use Policy 2020, 99, 104846. [Google Scholar] [CrossRef]
  30. Huang, M.; Li, Y.; Xia, C.; Zeng, C.; Zhang, B. Coupling responses of landscape pattern to human activity and their drivers in the hinterland of Three Gorges Reservoir Area. Glob. Ecol. Conserv. 2022, 33, e01992. [Google Scholar] [CrossRef]
  31. Bureau of Statistics of Anhui Province. Available online: http://tjj.ah.gov.cn (accessed on 20 September 2022).
  32. Hu, S.; Chen, L.; Li, L.; Wang, B.; Yuan, L.; Cheng, L.; Yu, Z.; Zhang, T. Spatiotemporal Dynamics of Ecosystem Service Value Determined by Land-Use Changes in the Urbanization of Anhui Province, China. Int. J. Environ. Res. Public Health 2019, 16, 5104. [Google Scholar] [CrossRef] [Green Version]
  33. Vitousek, P.M.; Mooney, H.A.; Lubchenco, J.; Melillo, J.M. Human domination of Earth’s ecosystems. Science 1997, 277, 494–499. [Google Scholar] [CrossRef] [Green Version]
  34. Jin, J.; Ding, W.; Zhu, Z.; Zhou, J.; Shi, G.; Ma, Y.; Chen, Z. Construction of Ecological Network of Yangtze Huaihe River Diversion Project (Anhui) Based on Landscape Connectivity Index. Comput. Intel. Neurosci. 2022, 2022, 9945687. [Google Scholar] [CrossRef]
  35. Zhang, L.; Wu, B.; Li, X.; Xing, Q. Classification system of China land cover for carbon budget. Acta Ecol. Sin. 2014, 34, 7158–7166. [Google Scholar] [CrossRef] [Green Version]
  36. Hu, S.; Li, L.; Chen, L.; Cheng, L.; Yuan, L.; Huang, X.; Zhang, T. Estimation of Soil Erosion in the Chaohu Lake Basin through Modified Soil Erodibility Combined with Gravel Content in the RUSLE Model. Water 2019, 11, 1806. [Google Scholar] [CrossRef] [Green Version]
  37. Zhao, M.-S.; Qiu, S.-Q.; Wang, S.-H.; Li, D.-C.; Zhang, G.-L. Spatial-temporal change of soil organic carbon in Anhui Province of East China. Geoderma Reg. 2021, 26, e00415. [Google Scholar] [CrossRef]
  38. Zhou, R.; Jin, J.; Cui, Y.; Ning, S.; Zhou, L.; Zhang, L.; Wu, C.; Zhou, Y. Spatial Equilibrium Evaluation of Regional Water Resources Carrying Capacity Based on Dynamic Weight Method and Dagum Gini Coefficient. Front. Earth Sci. 2022, 9. [Google Scholar] [CrossRef]
  39. Wu, B.; Zeng, Y.; Yan, N.; Zeng, H.; Zhao, D.; Zhang, M. Remote sensing for ecosystem: Definition and prospects. J. Remote Sens. 2020, 24, 609–617. [Google Scholar] [CrossRef]
  40. Xiang, H.X.; Wang, Z.M.; Mao, D.H.; Zhang, J.; Zhao, D.; Zeng, Y.; Wu, B.F. Surface mining caused multiple ecosystem service losses in China. J. Environ. Manag. 2021, 290, 112618. [Google Scholar] [CrossRef]
  41. Yu, B.L.; Shi, K.F.; Hu, Y.J.; Huang, C.; Chen, Z.Q.; Wu, J.P. Poverty Evaluation Using NPP-VIIRS Nighttime Light Composite Data at the County Level in China. IEEE J. Sel. Top. Appl. Earth Obs. Remote Sens. 2015, 8, 1217–1229. [Google Scholar] [CrossRef]
  42. Yongxiu, S.; Shiliang, L.; Fangning, S.; Yi, A.; Mingqi, L.; Yixuan, L. Spatio-temporal variations and coupling of human activity intensity and ecosystem services based on the four-quadrant model on the Qinghai-Tibet Plateau. Sci. Total Environ. 2020, 743, 140721. [Google Scholar] [CrossRef]
  43. Hickey, R. Slope Angle and Slope Length Solutions for GIS. Cartography 2000, 29, 1–8. [Google Scholar] [CrossRef]
  44. Lifton, J.; Liu, T.; McBride, J. Non-linear least squares fitting of Bézier surfaces to unstructured point clouds. AIMS Math. 2021, 6, 3142–3159. [Google Scholar] [CrossRef]
  45. Tang, L.; Bai, Z.; Ji, K.; Zhu, Y.; Chen, R. Correlations of external social capital in social organizations providing integrated eldercare services with medical care in China. BMC Health Serv. Res. 2022, 22, 101. [Google Scholar] [CrossRef] [PubMed]
  46. Liu, C.; Zhang, C.; Zhao, X. Effects of Disturtance by Thinning on Productivity Stability of Conifer-Broadleaf Mixed Forest in Jiaohe, Jilin Province. Sci. Silvae Sin. 2022, 58, 1–9. [Google Scholar] [CrossRef]
  47. Greenland, S. Valid P-Values Behave Exactly as They Should: Some Misleading Criticisms of P-Values and Their Resolution With S-Values. Am. Stat. 2019, 73, 106–114. [Google Scholar] [CrossRef] [Green Version]
  48. Huning, S.; Bens, O.; Huttl, R.F. Demographic Change beyond the Urban-Rural Divide: Re-Framing Spatial Differentiation in the Context of Migration Flows and Social Networks. ERDE 2012, 143, 153–172. [Google Scholar]
  49. Klasen, S.; Nestmann, T. Population, population density and technological change. J. Popul. Econ. 2006, 19, 611–626. [Google Scholar] [CrossRef] [Green Version]
  50. Chen, Y.H.; Wu, G.H.; Ge, Y.; Xu, Z.K. Mapping Gridded Gross Domestic Product Distribution of China Using Deep Learning with Multiple Geospatial Big Data. IEEE J. Sel. Top. Appl. Earth Obs. Remote Sens. 2022, 15, 1791–1802. [Google Scholar] [CrossRef]
  51. Luan, Y.; Huang, G.; Zheng, G.; Wang, Y. Correlation between Spatio-Temporal Evolution of Habitat Quality and Human Activity Intensity in Typical Mountain Cities: A Case Study of Guiyang City, China. Int. J. Environ. Res. Public Health 2022, 19, 14294. [Google Scholar] [CrossRef]
  52. Baker, D.; Dizyee, K.; Parker, W.; Scrimgeour, F.; Griffith, G. Primary Industry Chains and Networks: Analysis for Public and Private Interests. Syst. Res. Behav. Sci. 2017, 34, 699–709. [Google Scholar] [CrossRef]
  53. Gibson, J.; Olivia, S.; Boe-Gibson, G.; Li, C. Which night lights data should we use in economics, and where? J. Dev. Econ. 2021, 149, 102602. [Google Scholar] [CrossRef]
  54. Zhao, X.Z.; Yu, B.L.; Liu, Y.; Yao, S.J.; Lian, T.; Chen, L.J.; Yang, C.S.; Chen, Z.Q.; Wu, J.P. NPP-VIIRS DNB Daily Data in Natural Disaster Assessment: Evidence from Selected Case Studies. Remote Sens. 2018, 10, 1526. [Google Scholar] [CrossRef] [Green Version]
  55. Shi, K.F.; Huang, C.; Yu, B.L.; Yin, B.; Huang, Y.X.; Wu, J.P. Evaluation of NPP-VIIRS night-time light composite data for extracting built-up urban areas. Remote Sens. Lett. 2014, 5, 358–366. [Google Scholar] [CrossRef]
  56. Chen, Z.Q.; Yu, B.L.; Song, W.; Liu, H.X.; Wu, Q.S.; Shi, K.F.; Wu, J.P. A New Approach for Detecting Urban Centers and Their Spatial Structure with Nighttime Light Remote Sensing. IEEE Trans. Geosci. Remote Sens. 2017, 55, 6305–6319. [Google Scholar] [CrossRef]
  57. Zhou, Y.Y.; Smith, S.J.; Elvidge, C.D.; Zhao, K.G.; Thomson, A.; Imhoff, M. A cluster-based method to map urban area from DMSP/OLS nightlights. Remote Sens. Environ. 2014, 147, 173–185. [Google Scholar] [CrossRef]
  58. Zhang, Y.; Li, X.; Wang, S.; Yao, Y.; Li, Q.; Tu, W.; Zhao, H.; Zhao, H.; Feng, K.; Sun, L.; et al. A global North-South division line for portraying urban development. iScience 2021, 24, 102729. [Google Scholar] [CrossRef]
  59. Gu, Z.; Zhang, Z.; Yang, J.; Wang, L. Quantifying the Influences of Driving Factors on Vegetation EVI Changes Using Structural Equation Model: A Case Study in Anhui Province, China. Remote Sens. 2022, 14, 4203. [Google Scholar] [CrossRef]
  60. Ah, R.; Yu, T.; Dong, Z.; Tong, B. Spatiotemporal Variations in the Intensity of Human Activity in Inner Mongolia and the Identification of Influencing Forces. Sustainability 2022, 14, 6252. [Google Scholar] [CrossRef]
  61. Wang, X.; Yao, X.; Jiang, C.; Duan, W. Dynamic monitoring and analysis of factors influencing ecological environment quality in northern Anhui, China, based on the Google Earth Engine. Sci. Rep. 2022, 12, 20307. [Google Scholar] [CrossRef]
  62. Feng, W.; He, S. Problems and Countermeasures of Forestry Ecological Construction in Anhui Province. Anhui Agric. Sci. 2019, 47, 142–143,215. [Google Scholar] [CrossRef]
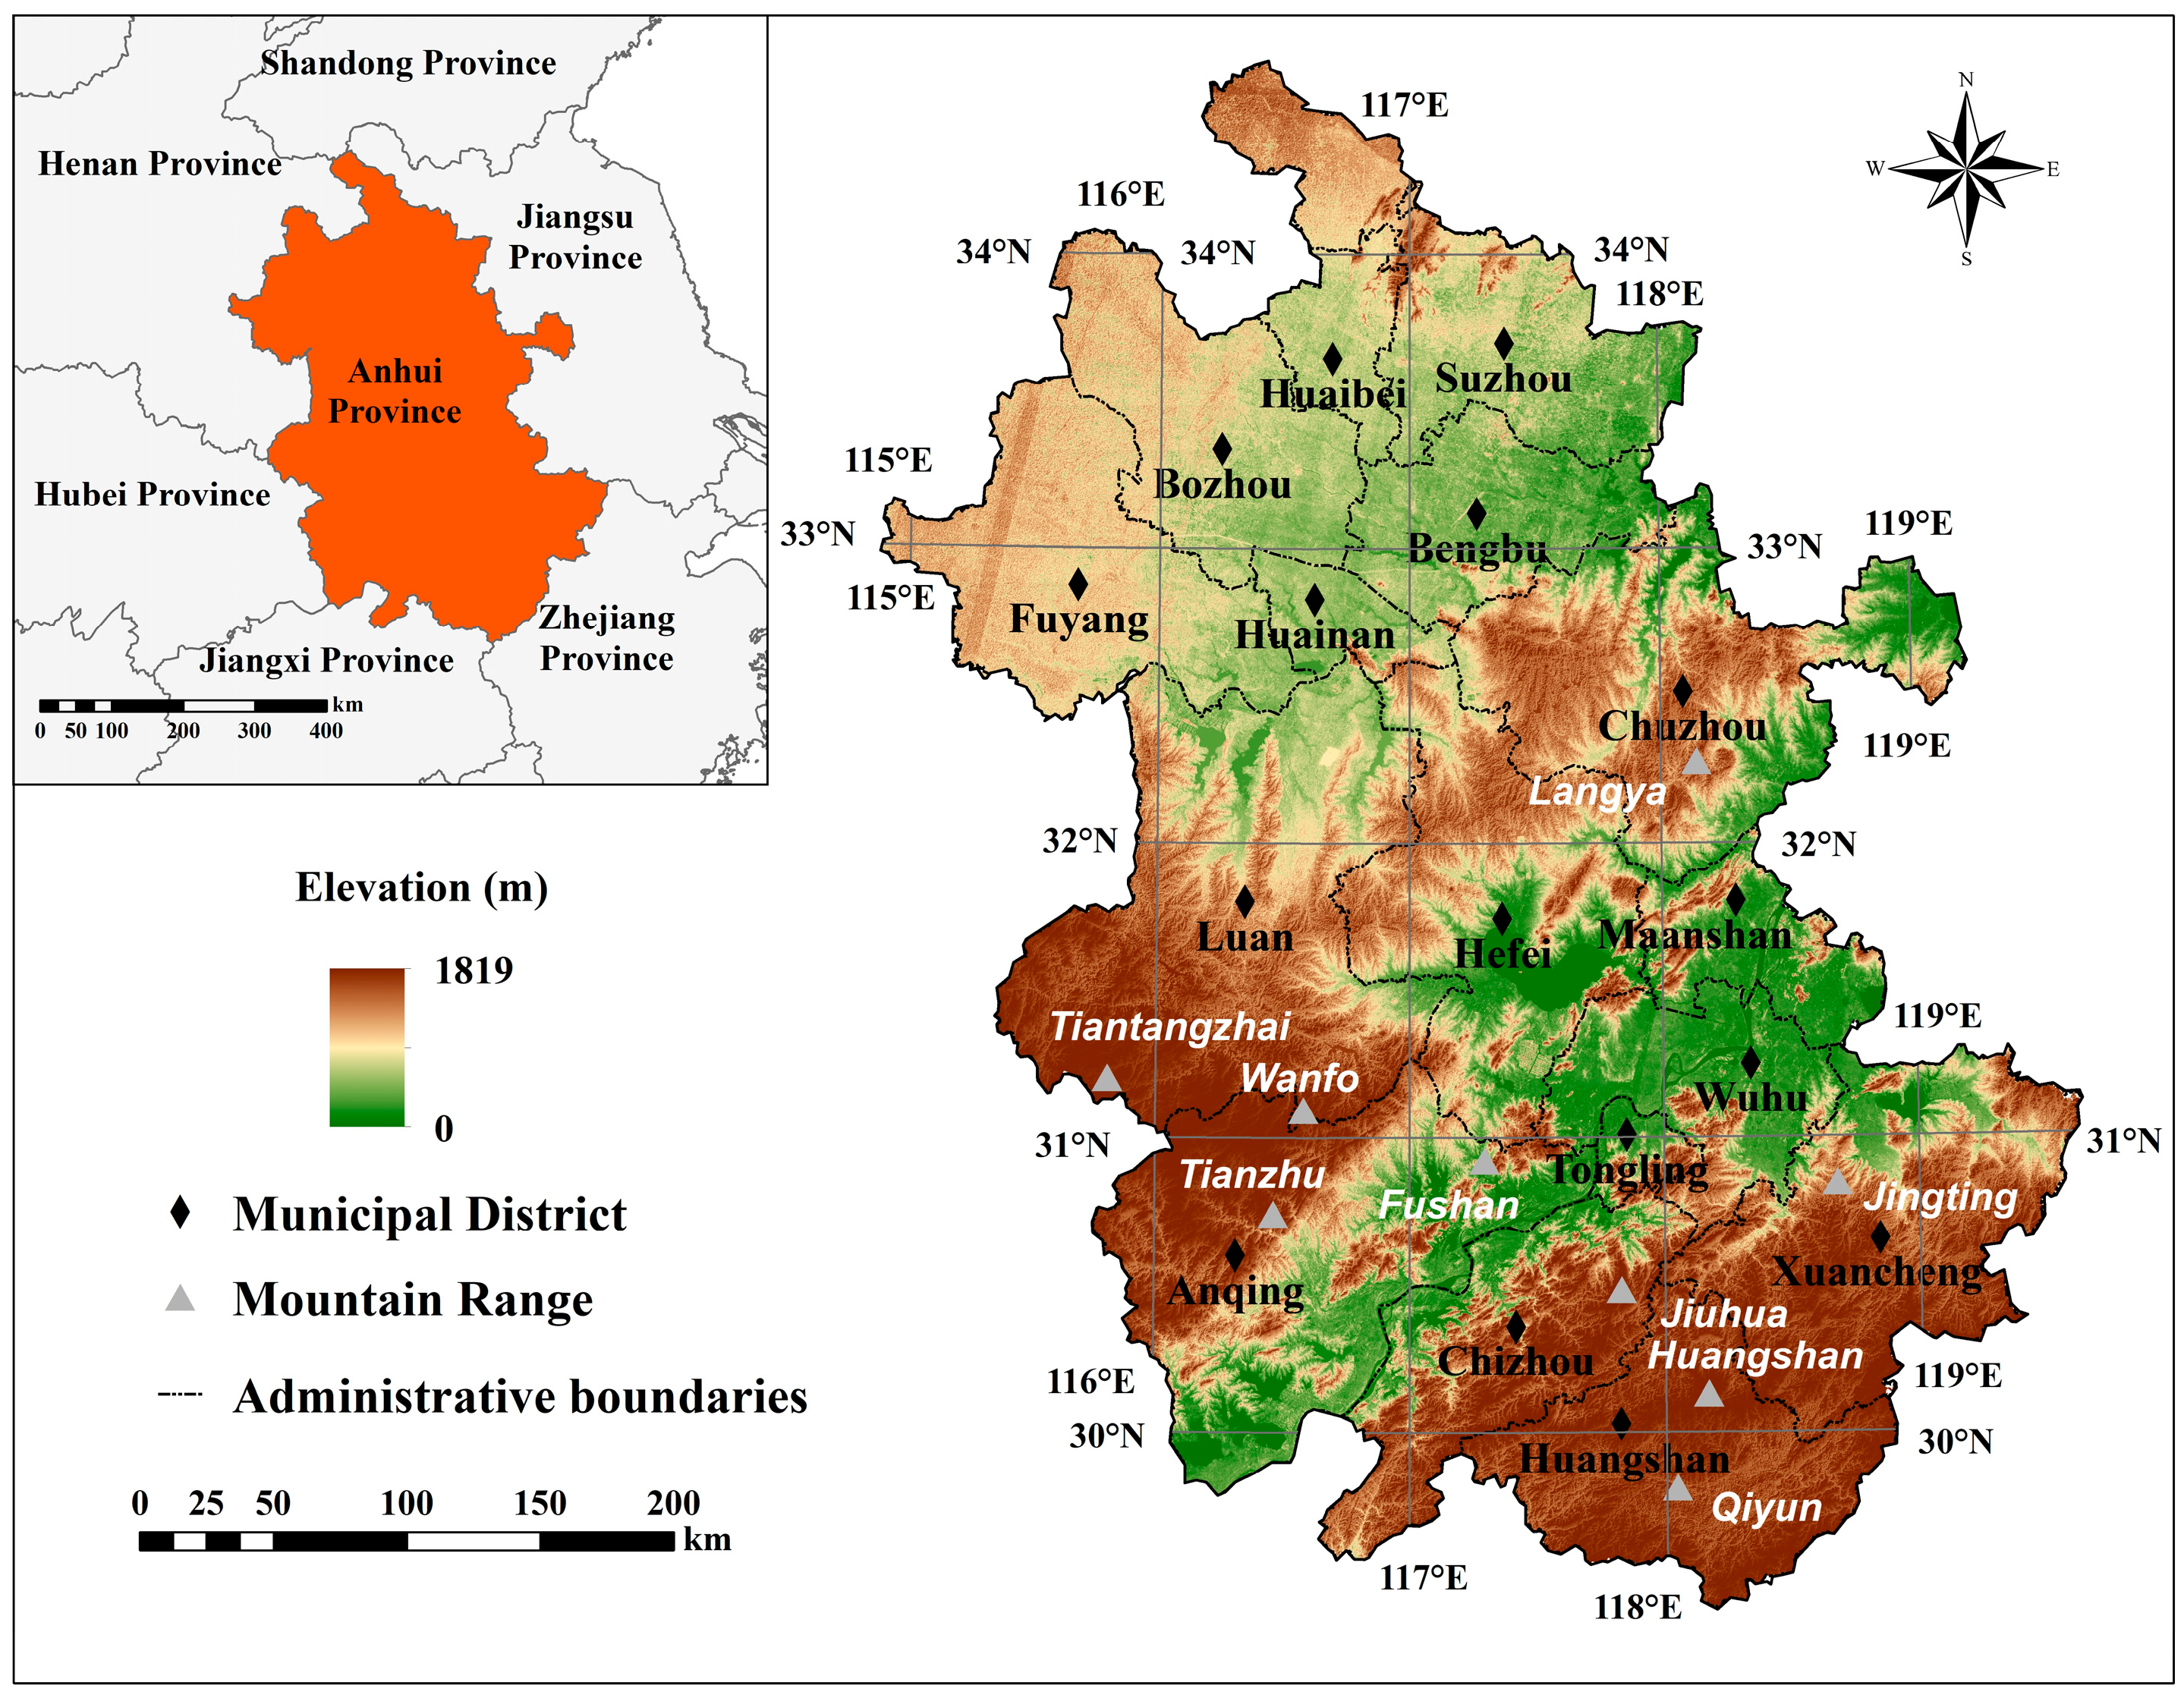
Figure 1. Location of Anhui Province.
Remotesensing 15 02029 g001
Figure 2. Spatial distribution of HAILS in 2015 (left) and 2020 (right) of Anhui Province.
Remotesensing 15 02029 g002
Figure 3. Percentage distribution of HAILS in different slopes: (a) 2015; (b) 2020.
Remotesensing 15 02029 g003
Figure 4. HAILS variation along the flow-path distances in 2015 and 2020.
Remotesensing 15 02029 g004
Figure 5. Correlation between population density and the HAILS: (a) population density; (b) rural and urban population densities.
Remotesensing 15 02029 g005
Figure 6. Correlation between average land GDP and the HAILS: (a) average land GDP; (b) average land GDP of primary industry, secondary industry, and tertiary industry.
Remotesensing 15 02029 g006
Figure 7. Correlation between average land GDP of primary industry, secondary industry, as well as tertiary industry and the HAILS without Hefei and Tongling.
Remotesensing 15 02029 g007
Figure 8. Correlation between average of nighttime light data and HAILS: (a) all 16 prefecture-level cities; (b) 15 prefecture-level cities without Hefei.
Remotesensing 15 02029 g008
Figure 9. Nighttime light data (left) and HAILS (right) of Anhui Province in 2020.
Remotesensing 15 02029 g009
Table 1. ChinaCover land cover classification system and description.
Primary ClassesSecondary ClassesDescription
Forest landsEvergreen broadleaf forest; Deciduous broadleaf forest; Evergreen needleleaf forest; Deciduous needleleaf forest; Evergreen broadleaf shrubland; Deciduous broadleaf shrubland; Evergreen needleleaf shrubland; Bamboo; Sparse forest; Sparse shrubland; Burned or logging forestNatural or seminatural vegetation
GrasslandsTemperate meadow steppe; Temperate typical steppe; Temperate desert steppe; Alpine meadow; Alpine steppe; Alpine desert steppe; Thermal tussock; Warm tussockNatural or seminatural vegetation
WetlandsForested wetland; Shrub wetland Herbaceous Wetland; Salt marshesNatural or seminatural vegetation
CroplandsPaddy field; Dry farmland; Artificial Tame Pastures; Aquaculture land; Facility agricultural landArtificial vegetation or artificial land
Horticulture landsShrub–grass green; Lawn; Wetland green; Woody horticulture land; Vine horticulture land; Herb horticulture land; Aquatic horticulture land; Nursery gardenArtificial vegetation
Built-up landsSettlement; Transportation land; Mining field; Salt ponds; Undeveloped landArtificial construction land
WaterPerennial water; Seasonal water; BeachesNatural or artificial water
DesertDesert shrubland; Salt desertNatural land surface
TundraPermanent ice/snow; TundraNatural land surface
Barren landsBare rock; Gobi; Bare soil; Desert; Sandy land; Cold desert; SalinaNatural land surface
Table 2. Grading analysis of HAILS data from 2015 to 2020.
HAILS<2%2–10%10–20%20–30%>30%
Mean
(%)
Area
(km2)
Mean
(%)
Area
(km2)
Mean
(%)
Area
(km2)
Mean
(%)
Area
(km2)
Mean
(%)
Area
(km2)
20150.426,4285.418,15116.728,56523.745,03444.124,155
20200.426,5035.418,07416.729,32423.942,74144.725,691
Disclaimer/Publisher’s Note: The statements, opinions and data contained in all publications are solely those of the individual author(s) and contributor(s) and not of MDPI and/or the editor(s). MDPI and/or the editor(s) disclaim responsibility for any injury to people or property resulting from any ideas, methods, instructions or products referred to in the content.