Abstract
The new generation of spaceborne laser altimeter, the Ice, Cloud, and Land Elevation Satellite-2 (ICESat-2), which can simultaneously generate laser reflections on the water surface and underwater, is a potential data source for exploring water depth in nearshore environments. To achieve this scientific goal, accurate bathymetric photon extraction is needed. This study proposed a pre-pruning quadtree isolation (PQI) method with changing threshold. Firstly, the pre-pruning step is introduced. Photons are transformed into different levels in the isolated quadtree structure according to spatial density. Then, the frequency histogram of photon elevation and isolated level (IL) is generated, the IL thresholds in different depth ranges are calculated by the Otsu method, and the bathymetric photons are extracted. The results in the Culebra archive show that this method achieved a 92.71% F1 score. Noise rate and water depth are the main factors affecting the extraction of sounding photons. When the photon density gradually increases from 2–4 pts/m to 6–8 pts/m, the F1 score of PQI decreases by no more than two percent. In different depth ranges, the extraction results of PQI are also better than those of comparison methods. Therefore, PQI can provide reliable theoretical support for nearshore areas lacking water depth data.
1. Introduction
Surveying the shallow water topography in lakes, reservoirs, and other coastal zones helps research in hydrology, fishery, coastal erosion, terrestrial water resource planning, and water body protection [1], which is of great significance to the sustainable terrestrial water resource development of human society [2]. Researchers usually use shipborne sonar systems [3,4] or airborne LiDAR systems [5,6] to collect accurate bathymetric data. The limitations of these two approaches in surveyed efficiency and range lead to the fact that most shallow water areas still need to be mapped, and the data around the coastal zones on bathymetric maps still need to be completed. The critical gap between the lack of fine shallow water bathymetric data and its vast demand must be filled.
The Ice, Cloud, and Land Elevation Satellite-2 (ICESat-2) is the new generation of spaceborne laser altimeter. The onboard Advanced Topographic Laser Altimeter System (ATLAS) equips six laser beams arranged in three pairs [7]. The energy of each laser pulse emitted by strong beams is 0.12 mJ, and the ratio of the pulse energy of strong beam to weak beam is about 4:1. ATLAS emits 10,000 laser pulses every second, while the diameter of the footprints formed by these pulses is 11 m, and the distance between adjacent footprints is 0.7 m, much higher than that of its predecessor, ICESat [8]. Compared with the near-infrared laser, the 532 nm blue-green laser emitted by ATLAS delves deeper into the water. Although the primary goal of ICESat-2 is to monitor the changes in glaciers, sea levels, and forests, its strong pulses can penetrate up to ~40 m in clear water [7]. Therefore, ICESat-2 is regarded as an effective bathometer in satellite-derived bathymetry (SDB) [9,10,11]. The coordination of bathymetric photons can be used as prior results to participate in bathymetry, thus replacing in situ data acquired by shipborne or airborne platforms and improving efficiency [12,13,14,15].
However, due to the high sensitivity of the photon-counting LiDAR [16], many noise photons are recorded in the ICESat-2 Level 2 datasets. These noise photons caused by solar background, atmospheric scattering, and water scattering flooded the original data, challenging the extraction of bathymetric photons. In bathymetric data, the spatial distribution of water surface bathymetric photons is dense, while the spatial distribution of underwater bathymetric photons is related to water depth. Because of the absorption and scattering of pulse energy by water, the density of underwater bathymetric photons decreases with the increase of water depth. When reaching the extreme depth measured by ICESat-2, it is difficult to distinguish the underwater bathymetric photons from the noise photons.
At the beginning of the launch, the scientific team did not expect the performance of ICESat-2 in bathymetry [13], so they did not develop a special method for extracting bathymetric photons in nearshore environments. Nevertheless, ATL03 still provided a confidence label for extracting signal photons from ocean data [17] (after this, referred to as CONF). Photons in the original data are labeled with 0–4 categories, corresponding to noise, buffer, weak, medium, and strong signals. Photons with are the basis for producing advanced marine product ATL12, which can be used for global sea level detection [18]. Besides, the existing bathymetric photon extraction methods usually use elevation frequency histograms [12,19,20,21] to divide the data into three parts: above the water surface, the water surface, and under the water surface, then remove the noises, respectively. Density-based noise removal methods have been proven to extract water surface photons [22,23]. The Joint North Sea Wave Project (JONSWAP) wave spectrum has also been introduced to describe the undulating shape of the water surface photons and extract them [22,24]. Density-based spatial clustering method of applications with noise (DBSCAN) [21,25,26], which has been widely used in the noise removal of land data, has been improved for underwater bathymetric photon extraction. To deal with the characteristics of photon density changing with water depth, DBSCAN is improved in two ways: an improved adaptive variable ellipse filtering bathymetric method (AVEBM) increases the size of the filter kernel with water depth [19]. Alternatively, by decreasing the density threshold with water depth, the underwater bathymetric photons can be identified by reducing the requirement on the adaptive minimum number of photons (AMNP) in the filter kernel [12,20]. However, the direction of the improved DBSCAN filter kernel is fixed, and it cannot adapt to the fluctuation of the underwater terrain. With the increase of water depth, the photon distribution becomes sparser, and the distinction between underwater bathymetric photons and noise photons becomes blurred. Special steps are needed to distinguish the underwater bathymetric photons from discrete noise clusters, especially when processing data acquired during the daytime.
Zhang et al. proposed the quadtree isolation (QI) method [27], which converted photon coordination into a quadtree hierarchical structure by iterative space segmentation to remove noise. It is not affected by terrain fluctuation and does not need input parameters, so it has potential in bathymetric photon extraction. However, the original QI lacks the consideration of photon density changing with water depth, and the total threshold used in QI cannot wholly extract underwater bathymetric photons. Besides, QI cannot identify noise clusters around underwater bathymetric photons.
In this research, we proposed pre-pruning quadtree isolation (PQI) with changing threshold, which can be used to extract bathymetric photons. The improvement is mainly concentrated in two aspects. Firstly, the spatial distribution of photons is judged before each layer of isolated quadtree grows to avoid extracting noise clusters. Secondly, considering the underwater bathymetric photon density decreases with water depth, the frequency histogram of isolated level (IL, that is the photon level in isolated quadtree) and photon elevation is calculated. The relationship between IL and water depth is quantitatively described, which is helpful to determine the threshold of IL in different depth ranges.
2. Materials
2.1. Study Site
Culebra Archipelago, Puerto Rico (65.15°–65.35°W, 18.25°–18.35°N) is located on the southeast edge of the Caribbean Sea. The sandy coral beach extends outward from the intricate coastline, and the water depth ranges from 0 m to ~40 m. As shown in Figure 1, the trajectories of the ICESat-2 data, represented by the solid green lines, cover the whole experimental area, which shows that the experimental data is sufficient. The lower left corner shows the relative position of the Culebra Archipelago in Puerto Rico, and the legend and scale are given in the lower right corner. The optical clarity of the water and the rivers and coastal lakes makes it an ideal site to test the performance of the ICESat-2 bathymetric photon extraction approach.
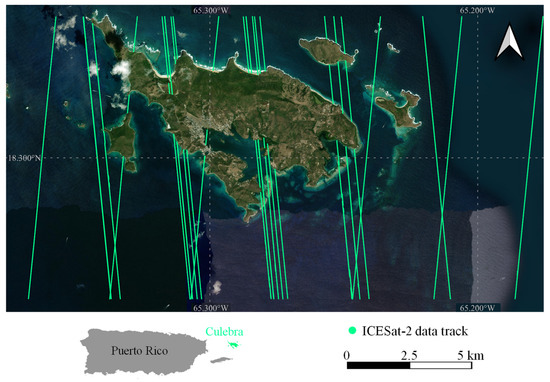
Figure 1.
Study site in Culebra, Puerto Rico. The bottom right corner shows its location.
2.2. ICESat-2 ATL03 Data
Although absorbed by the water, the strong beams of ATLAS can still penetrate the water to ~35 m in the study site. The longitude, latitude, and elevation of these bathymetric photons are recorded in the ATL03 data product according to the configuration of the ATLAS laser beams [17]. Nine pieces of data from 2018 to 2022 that passed through the Culebra Archipelago were selected, among which the photons recorded by the strong beams were numbered according to ground track and used. Their trajectories are shown by the green lines in Figure 1, and their details are shown in Table 1.

Table 1.
The detail of ICESat-2 ATL03 datasets used in the study.
3. Methods
The spatial distribution of signal photons is denser than that of noise photons, but the noise removal methods are still challenged in processing ICESat-2 bathymetric data. Affected by the fluctuation of the water surface, the noise removal methods without directional adaptive ability cannot extract whole water surface photons. Under the water surface, the density of underwater bathymetric photons decreases with water depth, so IL also needs to change with photon elevation. The spatial segmentation of noise clusters distributed around underwater bathymetric photons will overestimate the density of these noise photons, leading to potential errors. Therefore, PQI with changing threshold, shown in Figure 2, is proposed, which includes two main steps: pre-pruning quadtree isolation and isolated level threshold determination.
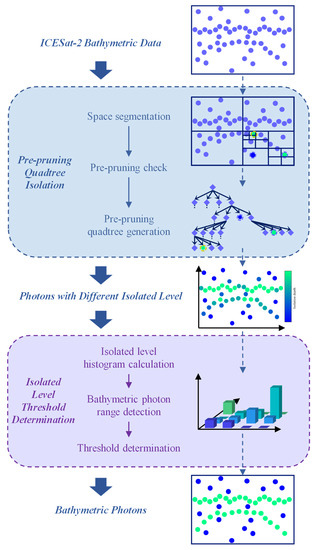
Figure 2.
Flowchart of bathymetric photon extraction using PQI with changing threshold. The solid arrow on the right side indicates the main steps in the process. In contrast, the dashed arrow on the left side connects the raw ICESat-2 bathymetric data, spatial segmentation results, pre-pruning quadtree, photon results of different isolated levels, histogram generated by isolated levels, and final extraction results, respectively.
3.1. Pre-Pruning Quadtree Isolation
QI removes noise photons by iterative quad space segmentation. The space of photon distribution is divided into four subspaces, and it is required that each subspace can only contain one photon or not. If this limit is exceeded, four subspaces will be further segmented until the requirement is met. This process of spatial segmentation is regarded as photon isolation, which can correspond to the growth process of the isolated quadtree, and the density of photons affects their level in the quadtree. Since the spatial distribution of signal photons is denser than noise photons, isolating signal photons requires more spatial segmentation, and their ILs are larger than the noise photons. Comparing the ILs can remove the noise photons contained in the raw data.
QI has strong adaptability to the fluctuation of signal photons along with terrain or water surface and does not need to be provided user-defined parameters, which has an advantage in signal photon extraction [27]. However, when processing the bathymetric data shown in Figure 3c, the IL of the noise photon marked by the purple dotted line is 4, the IL of the signal photon marked by the yellow dotted line is 4, and the IL of the signal photon marked by the purple dotted line is 3. The IL of the noise photon is greater than or equal to the IL of the signal photon. QI has an error.
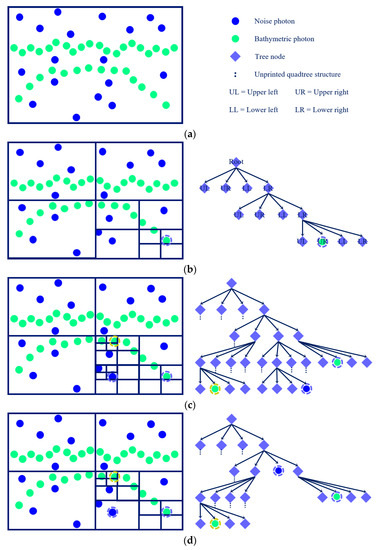
Figure 3.
The illustration of QI. (a) Initial state. Suppose we already know the bathymetric photons and noise photons in the data. (b) An isolated photon and the corresponding quadtree. The photon is grouped into the corresponding subspaces until after three space segmentations, and the final subspace only contains the photon itself. Therefore, the IL of the photon is 3. (c) The result of QI. The local density of photons marked with dotted circles determines the level of photons in the quadtree. (d) The result of PQI. The pre-pruning step avoids excessive spatial segmentation.
Although the spatial distribution of noise photons is generally more dispersed than signal photons, the noise clusters formed by the aggregation of noise photons make this assumption inaccurate locally. As shown in Figure 3c, the noise photon marked by the purple dotted line is close to the noise photon on its left. To isolate them, QI made an extra space segmentation, which overestimated the IL of the noise photon. QI does not consider the local photon density anomaly caused by noise clusters, but the backscattering of water makes noise clusters ubiquitous in bathymetric data.
Further analysis of the results in Figure 3c shows that the noise photon marked by the purple dotted line cannot be separated from the noise photon on its left by the second and third space segmentation. The noise photon is isolated only after the fourth space segmentation. This means that the second and third space segmentation are meaningless, which leads to the photon being overestimated by two levels in the quadtree.
To avoid excessive space segmentation, the pre-pruning step is proposed to optimize the quadtree structure. The core idea of pre-pruning is to check whether photons are further isolated before and after space segmentation. If photons are still in the same subspace before and after segmentation, these photons are not further isolated. The growth of the quadtree will cause overestimations of IL, so this part of the quadtree needs to be cut off. Therefore, when PQI processes bathymetric data, the whole space of photon distribution is taken as the root node in the quadtree, the non-leaf nodes represent the divided subspace, and each non-empty leaf node contains isolated photons. With the introduction of the pre-pruning step, the following conditions will cause the quad tree to stop growing:
(1) The growth of quadtree stops naturally. In this condition, space segmentation further isolates photons, and the number of photons contained in subspaces does not exceed one.
(2) The overgrown quadtree is cut off. In this condition, the pre-pruning step finds that photons are not further isolated before and after space segmentation and are still in the same subspace. The quadtree structure grown by this segmentation will be cut off, and the quadtree growth will stop to avoid excessive space segmentation.
The result of PQI is shown in Figure 3d. Before the third spatial segmentation, the pre-pruning step found that the noise photon marked by the purple dotted line was not further isolated from its surrounding photon, so the quadtree stopped growing, and the noise photon was in the second level of the quadtree. Therefore, the pre-pruning step can avoid excessive segmentation caused by local spatial photon aggregation, limit the influence of underwater noise clusters on bathymetric photon extraction, and enlarge the difference between bathymetric photons and noise photons in the quadtree.
3.2. Isolated Level Threshold Determination
After using PQI to obtain ILs of the photons, it is necessary to calculate the elevation range of bathymetric photons and determine the appropriate IL threshold. The water absorption of pulse energy makes IL decrease with the water depth (as shown in Figure 4a). The IL of water surface photons and some shallow underwater bathymetric photons is the largest, while noise photons have the smallest ILs. In the same elevation range, bathymetric photons are denser than noise photons. Using the same IL threshold cannot wholly extract bathymetric photons. According to Equation (1) to Equation (4), the photon space is divided, and the frequency histogram with elevation and IL as the plane is constructed to quantify the change of IL with elevation, realizing range demarcation and automatic extraction of bathymetric photons.
where and are the elevation and IL of each photon, and are the interval of the histogram in the elevation direction and the IL direction, and are the segment number in the elevation direction and the IL direction, and and define the center position in the elevation direction and IL direction, respectively, which together determine the grid coordinates of the histogram.
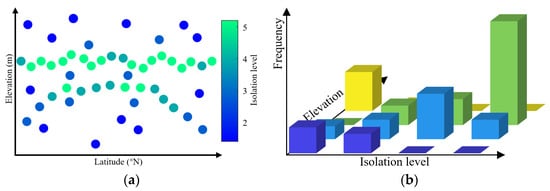
Figure 4.
The illustration of the changes and distribution of IL. (a) The ILs of the photons obtained by PQI. The maximum value of IL is five, and the corresponding photons are distributed on the water surface and the shallow underwater terrain, while the minimum value of IL is two, and the corresponding photons are the noise photons distributed in the air and water. The distribution of IL has an obvious pattern in the elevation direction. (b) Frequency histogram with elevation and IL as the plane. The histogram shows the photon density in the elevation range when the elevation is constant. When the IL is constant, the histogram shows the variation of photon density in the elevation direction.
The generated histogram is shown in Figure 4b, and the IL distribution in different elevation ranges shows pattern. The upper and lower boundaries of bathymetric photon are defined according to the histogram, and the data are divided into noise photons in the air (), bathymetric photons, and noise photons in the water ().
The elevation range corresponding to the position with the highest frequency in the histogram (assuming , where is the lower bound of the range and is the upper bound of the range) is regarded as the elevation range where the water surface photons are located, and its upper bound represents the upper bound of bathymetric photons. Photons with elevation higher than the upper bound are marked as the . Since the difference in IL between the deeper underwater bathymetric photons and the surrounding noises is fuzzy, it is difficult to determine the lower elevation bound of bathymetric photons by using the same threshold. Therefore, the mean IL of the noise photons in the air is calculated. When the mean IL of photons in a certain elevation range (assuming , where is the lower bound of the range and is the upper bound of the range) is less than or equal to , the photon density is considered to be close to the . Photons with elevation smaller than the upper bound are marked as the . Both AP and WP are removed.
With the increase of water depth, the IL of photons decreases, and the threshold of IL in different elevation ranges also changes. The Otsu method [28] is introduced to calculate the optimal thresholds in different elevation ranges. It calculates the threshold by maximizing the inter-class variance of IL between bathymetric photons and noise photons and has been applied to the noise removal of photon-counting LiDAR data [23]. The Otsu method is used to calculate the variance between classes in different elevation ranges, as shown in Equation (5):
where is the inter-class variance, is the proportion of potential bathymetric photons, is the proportion of potential noise photons, is the mean IL of bathymetric photons, is the mean IL of potential noise photons, and is the mean IL of all photons, as shown in Equation (6) to Equation (10):
In each elevation range, by changing , and are recalculated, and is renewed. Finding the largest , the corresponding IL is selected as the threshold, and the photons with an IL greater than the threshold are extracted as bathymetric photons.
3.3. Performance Verification
Bathymetric photons include water surface and underwater bathymetric photons, which record the underwater topography of shallow water environments. However, the lack of reference data makes evaluating the method’s performance challenging. Because ATL03 data does not provide the confidence label of bathymetric photons, some studies have conducted refraction correction of underwater bathymetric photons and compared the corrected results with high-precision underwater topography [19,29]. This method cannot measure the completeness of underwater bathymetric photon extraction results. Therefore, in this study, the reference data of bathymetric photons are obtained by visual interpretation. All bathymetric photons used as reference are selected through human-computer interaction. The extraction results of bathymetric photons are compared with reference data, and precision , recall rate , and F1 score are calculated.
In ATL03 data, photons with are introduced as a comparison, and this method is marked as CONF in the results [17]. AVEBM [19] and AMNP [12,20], two widely used bathymetric photon extraction methods, are also introduced as comparison methods. In addition, the extraction results are divided according to the elevation to evaluate the method’s performance in extracting water surface and underwater bathymetric photons, respectively.
where indicates the number of correctly extracted photons, indicates the number of incorrectly extracted photons, and indicates the number of unextracted bathymetric photons.
4. Results
4.1. Pre-Pruning Quadtree Isolation
The pre-pruning step is introduced into quadtree isolation and can distinguish the noise clusters from bathymetric photons. Figure 5 shows the IL values of photons at different noise rates and their corresponding histograms. In Figure 5a,c,e, the greener a photon is, the bigger its IL value is and the denser its spatial distribution is, while the bluer a photon is, the smaller its IL value is and the sparser its spatial distribution is. The photon density in the lower left corner in Figure 5a,c,e illustrates that these data have different noise rates. The results show that bathymetric photons are greener than noise photons. More spatial segmentations are needed to isolate bathymetric photons within the same depth range. Therefore, the bathymetric photons have a larger IL value than noise photons. Further observation shows that the color of photons gradually changes from green to blue with the increase of water depth, which indicates that the density of photons decreases, and the IL value decreases continuously with the increase of water depth.
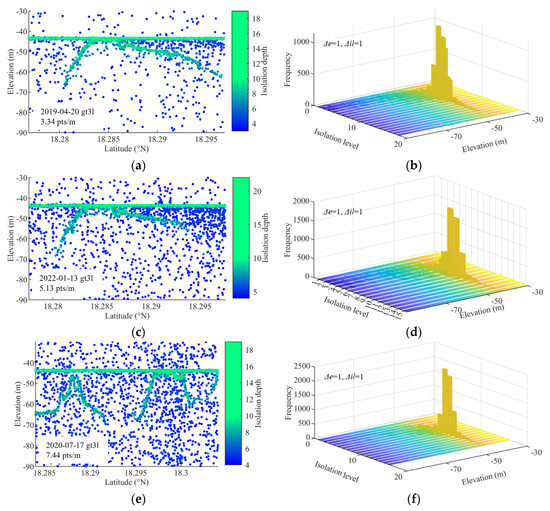
Figure 5.
The IL results and corresponding histograms. (a) The IL result at a low noise rate. (b) The IL histogram at a low noise rate. (c) The IL result at a medium noise rate. (d) The IL histogram at a medium noise rate. (e) The IL result at a high noise rate. (f) The IL histogram at a high noise rate.
Since it is impossible to know the depth of shallow water in advance before extracting bathymetric photons, photon elevation is used instead of depth, and frequency histograms based on elevation and IL value are generated. The and of these histograms are set to one to avoid missing the details of photon distribution. Figure 5b,d,f corresponds to the frequency histogram at a low noise rate, medium noise rate, and high noise rate, respectively. These histograms get the maximum value when the elevation is about −45 m, and then the photon frequency decreases rapidly as the elevation decreases. The results show that most photons are on the water surface, and the photon frequency on the underwater terrain decreases with elevation. Most of the laser pulses are reflected after encountering the water surface, and only a few laser pulses can penetrate the water and be reflected by the underwater terrain. In addition, the increase in noise rate increases the maximum frequency of the histogram and its corresponding IL value. The maximum frequency of the histogram at a low noise rate is less than 1000, the maximum frequency at a medium noise rate is close to 1500, and the maximum frequency at a high noise rate is over 1500. The corresponding IL value also increases from six at a low noise rate to eight at a high noise rate. The results show that the increased data noise rate makes PQI need additional spatial segmentation, and the histogram can reflect the change in the data noise rate.
Therefore, PQI can measure the distribution of photons, and the water surface photons obtained the maximum IL value, while the IL value of underwater bathymetric photons is larger than that of noise photons at the same depth. The frequency histograms based on photon elevation and IL value can describe the spatial distribution difference, making it possible to extract bathymetric photons automatically.
4.2. Extraction Results
The Otsu method is used to calculate the thresholds in different elevation ranges, and the photons whose IL value is greater than the threshold are extracted as bathymetric photons. The results obtained by PQI, and their local amplifications are shown in Figure 6. In the figure, the green dots represent extracted bathymetric photons, the blue dots represent noise photons, and the yellow box marks the amplificated display area. In addition, Figure 6 also indicates the extraction method and precision index of the displayed results. It can be found that PQI performs well in processing data with different noise rates. The bathymetric photons extracted by PQI are complete and continuous, especially since there are almost no wrongly labeled photons in the extracted water surface photons.
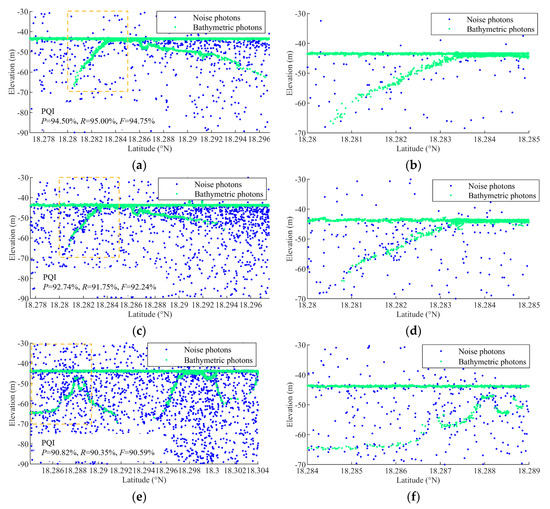
Figure 6.
The bathymetric photon extraction results. (a) Result at a low noise rate obtained by PQI. (b) Local amplification of PQI result at a low noise rate. (c) Result at a medium noise rate obtained by PQI. (d) Local amplification of PQI result at a medium noise rate. (e) Result at a high noise rate obtained by PQI. (f) Local amplification of PQI result at a high noise rate.
The evaluation indexes of PQI and comparison methods are shown in Table 2. The F1 score of PQI when extracting all bathymetric photons is 92.71%, while CONF processing the same data is 90.72%, AVEBM is 88.95% and AMNP is 86.66%. The results show that PQI has a better performance in extracting bathymetric photons. The evaluation indexes of the four methods when extracting water surface photons are all over 90.15%. Most of the water surface photons can be extracted fully and accurately. The spatial density of underwater bathymetric photons varies with the water depth, which makes it more challenging to extract them than water surface photons. The performance of the methods decreases when extracting underwater bathymetric photons. However, PQI’s performance is still better than the other methods. The change in photon recall rate makes the F1 score of both methods decrease. When extracting underwater bathymetric photons, PQI has the highest recall rate of 76.47%, while the other three algorithms’ recall rates are below 60%. The performance of methods in extracting underwater bathymetric photons, showing the omission of underwater bathymetric photons, is shown in Figure 7. The low recall rate illustrates that the other methods’ performance in extracting underwater bathymetric photons still need to be improved.

Table 2.
The overall evaluation indexes for bathymetric photon extraction results.
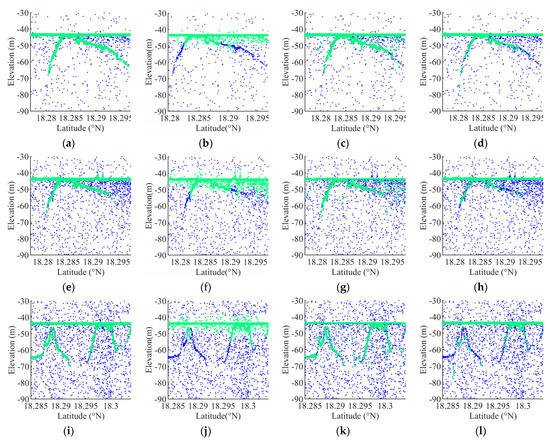
Figure 7.
Comparison of different methods for extracting bathymetric photons. Among them, (a,e,i) are the results of PQI at low noise rate, medium noise rate, and high noise rate, respectively. (b,f,j) are the results of CONF. (c,g,k) are the results of AVEBM. (d,h,l) are the results of AMNP.
Figure 7 further analyzes the performance of the algorithm based on Table 2. In the figure, the green dots represent the extracted sounding photons, while the blue dots are the removed noise photons. The sounding photons extracted by PQI are relatively sufficient on the water surface and underwater. These photons can effectively restore the nearshore area’s water surface and underwater topography at the time of ICESat-2 measurement. In contrast, CONF is not specially designed for extracting sounding photons, so it has a good effect on extracting water photons and a poor effect on extracting underwater photons. Only the shallow underwater photons will be extracted when the photon with confidence label is taken as the extraction object. CONF is sufficient to extract water surface photons, but it should be noted that many noise photons near the water surface are also extracted in Figure 7b,f,j. This conclusion is proved in Table 2. The high recall rate of CONF in extracting sounding photons makes it achieve an F1 score of 90.72%, but the accuracy of CONF is the lowest among all algorithms. In contrast, the performance of AVEBM and AMNP are acceptable. Both of these methods remove the noises in the air and completely extract the water surface photons, but underwater noise photons and missing bathymetric photons are common in their processing results.
Although the density of underwater bathymetric photons decreases with elevation, PQI still extracts continuously distributed underwater bathymetric photons, and the extracted results contain fewer noises than the other results. It can depict the undulations of the underwater topography. On the other hand, other extraction results on the underwater terrain are fragmentary, the noise clusters close to the bathymetric photons are wrongly extracted, and the underwater bathymetric photons in the steep area are omitted. The poor ability of AVEBM and AMNP to extract underwater bathymetric photons may be related to the lack of directional adaptability of the filter kernel. PQI avoids the use of filter kernel through spatial segmentation. The IL value of a bathymetric photon is only related to its local density but not underwater topography. This feature makes PQI more effective at obtaining accurate and continuous bathymetric photon extraction results.
5. Discussion
In this part, we first identify the factors that affect the extraction of bathymetric photons by analyzing the results and then discuss the laws of the noise rate and water depth influencing the methods. Finally, we evaluate the performance of PQI for extracting bathymetric photons.
5.1. Analysis of Influencing Factors
As shown in Figure 7, when different algorithms extract bathymetric photons in the same scenario, PQI performs best. However, when comparing the processing results of the same method in different scenarios, it is difficult to directly understand the influence of factors on the performance of the bathymetric photon extraction method.
The change in noise rate will lead to a change in photon density, and the number of noise clusters close to bathymetric photons will increase. Therefore, a higher noise rate usually makes it more challenging to extract bathymetric photons accurately. Take the results of PQI and AVEBM in Figure 7 as an example. The results in Figure 7a,b,e,f are obtained in adjacent areas at different times, which allows us to analyze the results of the bathymetric photon extraction method under different noise rates. By comparison, the increase in noise rate does not affect the extraction of water surface photons, and both methods can obtain water surface photons entirely and accurately. During the extraction of underwater bathymetric photons, it is found that with the increase in noise rate, the noise clusters around underwater bathymetric photons increase. PQI effectively eliminates these noise clusters, and the noise rate has no apparent influence on performance, while AVEBM is affected by surrounding noise clusters.
The box diagram of the F1 scores of the calculations of PQI and AVEBM when processing data with different noise rates is shown in Figure 8. It can be found that the F1 score of PQI and AVEBM will decrease with the increase in photon density. With the increase of noise photons, the median value of PQI’s F1 score decreased slowly from 94% to 92%. This result shows that although noise influences quad space segmentation, this influence is weak with the help of the pre-pruning step. The performance of AVEBM decreases more obviously with the increase of noise rate, but even when processing data of 6–8 pts/m, it can still achieve more than 85% F1 score, which is good performance. Comparing the trend of the box diagram between PQI and AVEBM, it is found that the boxes of PQI are narrower than those of AVEBM under the same noise rate. Therefore, the performance of PQI is less affected by the change in noise rate, and the results obtained by PQI have a better consistency.
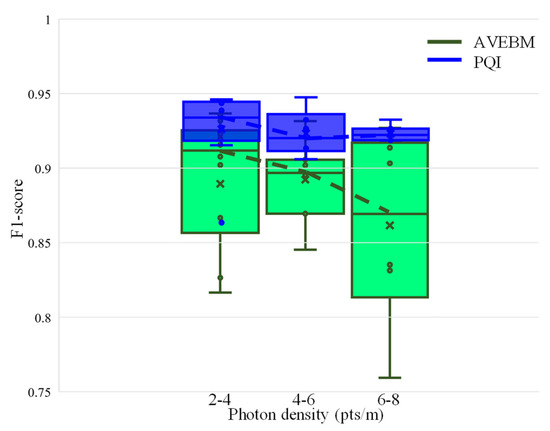
Figure 8.
F1 scores of PQI and AVEBM under different photon densities.
The extraction of underwater bathymetric photons is more challenging. Compared with water surface photons, the number of underwater bathymetric photons is smaller, and the spatial density of underwater bathymetric photons decreases with the increase of water depth. Take the results of PQI and AVEBM as an example. Therefore, underwater bathymetric photons are divided into four parts, namely 0–10 m, 10–20 m, 20–30 m, and 30–40 m. Figure 9 shows the box diagram of PQI and AVEBM at different water depths. The performance of PQI and AVEBM decreases with the increase in water depth, and PQI is better than AVEBM in different water depth ranges. Specifically, the F1 score of PQI in 0–30 m water depth decreases slowly with the increased water depth. When the water depth exceeds 30 m, the change in the F1 score corresponding to PQI is not apparent. The pre-pruning step can still effectively identify and remove noise clusters around bathymetric photons in the deep-water environment. The F1 score corresponding to AVEBM decreases with the increase in water depth. When the water depth is 30–40 m, the median F1 score of AVEBM is lower than 40%, which indicates that AVEBM has failed at this time.
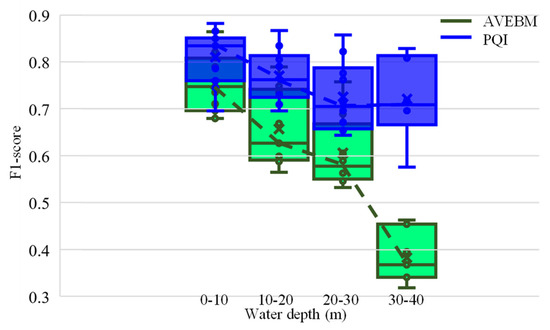
Figure 9.
F1 scores of PQI and AVEBM under different water depths.
The analysis shows that noise rate and water depth are the main factors affecting the performance of the bathymetric photon extraction methods. Whether the noise rate increases or the water depth increases, the extraction algorithm’s performance will decline to vary degrees. In addition, we also found that the influence of the change of influencing factors on different methods is inconsistent, and PQI is not as affected by noise rate and water depth as AVEBM. In order to understand the influence of noise rate and water depth change on PQI and the performance of the comparison methods, more detailed analyses were designed and carried out.
5.2. The Influence of Noise Rate
Table 3 divides the bathymetric data into 2–4 pts/m (low noise rate), 4–6 pts/m (medium noise rate), and 6–8 pts/m (high noise rate). The evaluation indexes obtained by the four methods when dealing with data with different noise rates are calculated. PQI achieves a 93.17% F1 score when dealing with data at a low noise rate, a 92.40% F1 score when dealing with data at a medium noise rate, and a 92.28% F1 score when dealing with data at a high noise rate. With the increase in noise rate, the performance of PQI decreases by 1% at maximum. The results show that it is insensitive to the change in noise rate. The pre-pruning step can make PQI effectively identify the noise clusters around the bathymetric photons. Although these noise clusters may be adjacent to the bathymetric photons in space, their differences at the quadtree level are apparent. In addition, as can be known from the analysis in Section 4.1, PQI can feel the change in noise rate. More dense photons will cause each photon to be isolated after more times of spatial segmentation. Therefore, the change in noise rate will be reflected in the histogram generated by PQI, and the isolation threshold will be different with different noise rates. The performance of other methods under different noise rates is inferior to PQI’s. AVEBM’s F1 score decreases with the increase in noise rate; however, the decrease rate is not more than 3%, which shows that the noise rate has no apparent influence on it. The adaptability of the two methods to the noise rate makes them have no requirement for data acquisition time. Even if the data to be processed contains more noise, the performance of the two methods will remain relatively high.

Table 3.
The influence of noise rate on the bathymetric photon extraction results.
5.3. The Influence of Water Depth
The indexes of underwater bathymetric photon extraction at different water depths are shown in Table 4. PQI achieved a higher F1 score in the water depth range of 0–10 m, 10–20 m, 20–30 m, and 30–40 m. PQI has the highest F1 score (83.92%) when extracting underwater bathymetric photons at 0–10 m and the lowest F1 score (77.35%) when extracting underwater bathymetric photons at 30–40 m. CONF did not extract underwater bathymetric photons with a water depth of more than 10 m, and the extraction results of bathymetric photons from 0 to 10 m were unsatisfactory. AVEBM’s F1 score decreases with water depth, gradually decreasing from 74.52% to 61.75%. The performance of all methods decreased with the increase in water depth. Although the difference between underwater bathymetric photons and noise photons gradually decreased with the increase of water depth, PQI’s performance was still better than AVEBM and AMNP in the same water depth range. The increased water depth also led to a more noticeable difference between the methods. When extracting underwater bathymetric photons with a water depth of 0–10 m, PQI’s F1 score is 9.20% higher than AVEBM’s F1 score, and the difference increases to 15.60% when processing data with a water depth of 30–40 m. We can reach the same conclusion by comparing the results of PQI and AMNP. Therefore, PQI’s performance in extracting underwater bathymetric photons is better than AVEBM’s and AMNP’s, and PQI has more robust adaptability to the spatial distribution changes of photons caused by the increase in water depth. Considering that ICESat-2 can penetrate about 40 m into deep water at most, Table 4 enables us to fully understand the changes in PQI, AVEBM, and AMNP performance with water depth.

Table 4.
The influence of water depth on the underwater bathymetric photon extraction results.
5.4. Evaluation of PQI Performance
Since the 532 nm blue-green laser emitted by ICESat-2 was found to penetrate water and measure the underwater topography, it has provided thousands of transit data for remote islands and reefs in America, Europe, and Asia. Before the launch of ICESat-2, it was not easy to obtain the in situ measurement data of these remote islands and reefs. However, different ocean conditions, water quality, data acquisition time, and seabed sediment will cause data changes. The density of underwater bathymetric photons decreases with water depth, making it challenging to extract them efficiently. The noise removal methods used in the land system are no longer applicable, and extracting bathymetric photons from nearshore data needs to be developed urgently.
Quadtree isolation is proposed to calculate the spatial distribution of photons through quadtree segmentation, thus avoiding the dependence on the shape and size of the filter kernel in the density-based noise removal methods from the design. Signal photon extraction without input parameters is realized. In order to extract bathymetric photons from the ICESat-2 ATL03 data acquired in the coastal environment, the pre-pruning step was introduced into the quadtree isolation method for the first time, and the isolation level threshold was automatically obtained in different depth ranges with the help of the generated isolation level histogram. The results show that PQI with changing threshold can measure the difference in spatial density between bathymetric photons and noises and accurately extract bathymetric photons from the raw data. Noise rate and water depth are the main factors affecting the performance of photon extraction. The influence of noise rate and water depth on PQI is limited. In different environments, PQI has achieved better performance than the comparison methods.
The bathymetric photons obtained by PQI record the underwater topography of shallow bathymetric areas, which may have taken a long time to obtain in the past. Through the results obtained in this study, we have every reason to believe that the automatic bathymetric photon extraction is effective in most areas. This extraordinary ability allows PQI to improve the automation level of ICESat-2 data processing and help hydrology, geology, and other research.
6. Conclusions
ICESat-2, which uses blue-green lasers, can penetrate the water, measure the underwater topography, and is a potential space-borne bathymetric platform. In this study, we propose PQI to extract bathymetric photons from the original data accurately. This method isolates photons through spatial segmentation and transforms the photon space into a pre-pruning quadtree structure to measure the spatial distribution of photons. With the help of a frequency histogram with photon elevation and IL value as the plane, the optimal thresholds of photons in different depth ranges are calculated. To comprehensively evaluate the performance of PQI, CONF, AVEBM, and AMNP are selected for comparison, and the results of bathymetric photon extractions are analyzed. The noise rate and water depth are found to be the main influencing factors. Compared with the comparison methods, PQI has achieved better results in extracting bathymetric photons with a 92.71% F1 score. In future research, we plan to conduct more experiments with ICESat-2 datasets in a wide range of shallow water areas to make up for the current global coastal areas.
Author Contributions
Conceptualization, G.Z. and S.X.; methodology, G.Z. and S.X.; software, G.Z. and P.L.; validation, G.Z., S.X., and Q.X.; formal analysis, D.W.; data curation, D.W.; writing—original draft preparation, G.Z.; writing—review and editing, S.X., Q.X. and P.L. All authors have read and agreed to the published version of the manuscript.
Funding
This research was funded by the National Natural Science Foundation of China Projects (Grant No. 41876105, 41371436), Henan Province (No. 202300410535), and the Joint Fund of Collaborative Innovation Center of Geo-Information Technology for Smart Central Plains, Henan Province and Key Laboratory of Spatiotemporal Perception and Intelligent Processing, Ministry of Natural Resources (No. 212108).
Data Availability Statement
ICESat-2/ATLAS datasets provided in the article are available at https://search.earthdata.nasa.gov, accessed on 15 February 2023.
Acknowledgments
We thank the National Aeronautics and Space Administration (NASA) for providing the ICESat-2 data used in the article.
Conflicts of Interest
The authors declare no conflict of interest.
References
- Hoegh-Guldberg, O.; Mumby, P.J.; Hooten, A.J.; Steneck, R.S.; Greenfield, P.; Gomez, E.; Harvell, C.D.; Sale, P.F.; Edwards, A.J.; Caldeira, K.; et al. Coral reefs under rapid climate change and ocean acidification. Science 2007, 318, 1737–1742. [Google Scholar] [CrossRef]
- Dong, Y.; Liu, Y.; Hu, C.; Xu, B. Coral reef geomorphology of the Spratly Islands: A simple method based on time-series of Landsat-8 multi-band inundation maps. ISPRS J. Photogramm. Remote Sens. 2019, 157, 137–154. [Google Scholar] [CrossRef]
- Demoustier, C. State of the Art in Swath Bathymetry Survey-Systems. Int. Hydrogr. Rev. 1988, 65, 25–54. [Google Scholar]
- Fonseca, L.; Mayer, L. Remote estimation of surficial seafloor properties through the application Angular Range Analysis to multibeam sonar data. Mar. Geophys. Res. 2007, 28, 119–126. [Google Scholar] [CrossRef]
- Lowell, K.; Calder, B. Extracting shallow-water bathymetry from lidar point clouds using pulse attribute data: Merging density-based and machine learning approaches. Mar. Geod. 2021, 44, 259–286. [Google Scholar] [CrossRef]
- Mandlburger, G.; Pfennigbauer, M.; Schwarz, R.; Floery, S.; Nussbaumer, L. Concept and Performance Evaluation of a Novel UAV-Borne Topo-Bathymetric LiDAR Sensor. Remote Sens. 2020, 12, 986. [Google Scholar] [CrossRef]
- Parrish, C.E.; Magruder, L.A.; Neuenschwander, A.L.; Forfinski-Sarkozi, N.; Alonzo, M.; Jasinski, M. Validation of ICESat-2 ATLAS Bathymetry and Analysis of ATLAS’s Bathymetric Mapping Performance. Remote Sens. 2019, 11, 1634. [Google Scholar] [CrossRef]
- Markus, T.; Neumann, T.; Martino, A.; Abdalati, W.; Brunt, K.; Csatho, B.; Farrell, S.; Fricker, H.; Gardner, A.; Harding, D.; et al. The Ice, Cloud, and land Elevation Satellite-2 (ICESat-2): Science requirements, concept, and implementation. Remote Sens. Environ. 2017, 190, 260–273. [Google Scholar] [CrossRef]
- Thomas, N.; Lee, B.; Coutts, O.; Bunting, P.; Lagomasino, D.; Fatoyinbo, L. A Purely Spaceborne Open Source Approach for Regional Bathymetry Mapping. IEEE Trans. Geosci. Remote Sens. 2022, 60, 1–9. [Google Scholar] [CrossRef]
- Le, Y.; Hu, M.; Chen, Y.; Yan, Q.; Zhang, D.; Li, S.; Zhang, X.; Wang, L. Investigating the Shallow-Water Bathymetric Capability of Zhuhai-1 Spaceborne Hyperspectral Images Based on ICESat-2 Data and Empirical Approaches: A Case Study in the South China Sea. Remote Sens. 2022, 14, 3406. [Google Scholar] [CrossRef]
- Le Quilleuc, A.; Collin, A.; Jasinski, M.F.; Devillers, R. Very High-Resolution Satellite-Derived Bathymetry and Habitat Mapping Using Pleiades-1 and ICESat-2. Remote Sens. 2022, 14, 133. [Google Scholar] [CrossRef]
- Ma, Y.; Xu, N.; Liu, Z.; Yang, B.; Yang, F.; Wang, X.H.; Li, S. Satellite-derived bathymetry using the ICESat-2 lidar and Sentinel-2 imagery datasets. Remote Sens. Environ. 2020, 250, 112047. [Google Scholar] [CrossRef]
- Voosen, P. Ice monitor delivers a bonus: Seafloor maps. Science 2020, 368, 224. [Google Scholar] [CrossRef]
- Xu, N.; Zheng, H.; Ma, Y.; Yang, J.; Liu, X.; Wang, X. Global Estimation and Assessment of Monthly Lake/Reservoir Water Level Changes Using ICESat-2 ATL13 Products. Remote Sens. 2021, 13, 2744. [Google Scholar] [CrossRef]
- Xu, N.; Ma, Y.; Yang, J.; Wang, X.H.; Wang, Y.; Xu, R. Deriving Tidal Flat Topography Using ICESat-2 Laser Altimetry and Sentinel-2 Imagery. Geophys. Res. Lett. 2022, 49, e2021GL096813. [Google Scholar] [CrossRef]
- Jasinski, M.F.; Stoll, J.D.; Cook, W.B.; Ondrusek, M.; Stengel, E.; Brunt, K. Inland and Near-Shore Water Profiles Derived from the High-Altitude Multiple Altimeter Beam Experimental Lidar (MABEL). J. Coast. Res. 2016, 76, 44–55. [Google Scholar] [CrossRef] [PubMed]
- Neumann, T.; Brenner, A.; Hancock, D.; Robbins, J.; Saba, J.; Harbeck, K.; Gibbons, A.; Lee, J.; Luthcke, S.; Rebold, T. Method Theoretical Basis Document (ATBD) for Global Geolocated Photons ATL03. Available online: https://icesat-2.gsfc.nasa.gov/sites/default/files/page_files/ICESat2_ATL03_ATBD_r005.pdf (accessed on 1 March 2023).
- Neumann, T.A.; Martino, A.J.; Markus, T.; Bae, S.; Bock, M.R.; Brenner, A.C.; Brunt, K.M.; Cavanaugh, J.; Fernandes, S.T.; Hancock, D.W.; et al. The Ice, Cloud, and Land Elevation Satellite-2 mission: A global geolocated photon product derived from the Advanced Topographic Laser Altimeter System. Remote Sens. Environ. 2019, 233, 111325. [Google Scholar] [CrossRef] [PubMed]
- Chen, Y.; Le, Y.; Zhang, D.; Wang, Y.; Qiu, Z.; Wang, L. A photon-counting LiDAR bathymetric method based on adaptive variable ellipse filtering. Remote Sens. Environ. 2021, 256, 112326. [Google Scholar] [CrossRef]
- Ma, Y.; Xu, N.; Sun, J.; Wang, X.H.; Yang, F.; Li, S. Estimating water levels and volumes of lakes dated back to the 1980s using Landsat imagery and photon-counting lidar datasets. Remote Sens. Environ. 2019, 232, 111287. [Google Scholar] [CrossRef]
- Zhang, W.; Xu, N.; Ma, Y.; Yang, B.; Zhang, Z.; Wang, X.H.; Li, S. A maximum bathymetric depth model to simulate satellite photon-counting lidar performance. ISPRS J. Photogramm. Remote Sens. 2021, 174, 182–197. [Google Scholar] [CrossRef]
- Ma, Y.; Zhang, W.; Sun, J.; Li, G.; Wang, X.H.; Li, S.; Xu, N. Photon-Counting Lidar: An Adaptive Signal Detection Method for Different Land Cover Types in Coastal Areas. Remote Sens. 2019, 11, 471. [Google Scholar] [CrossRef]
- Xie, H.; Sun, Y.; Xu, Q.; Li, B.; Guo, Y.; Liu, X.; Huang, P.; Tong, X. Converting along-track photons into a point-region quadtree to assist with ICESat-2-based canopy cover and ground photon detection. Int. J. Appl. Earth Obs. Geoinf. 2022, 112, 102872. [Google Scholar] [CrossRef]
- Ma, Y.; Liu, R.; Li, S.; Zhang, W.; Yang, F.; Su, D. Detecting the ocean surface from the raw data of the MABEL photon-counting lidar. Opt. Express 2018, 26, 24752–24762. [Google Scholar] [CrossRef]
- Xu, X.W.; Ester, M.; Kriegel, H.P.; Sander, J. A distribution-based clustering method for mining in large spatial databases. In Proceedings of the IEEE Computer-Society 14th International Conference on Data Engineering (ICDE 98), Orlando, FL, USA, 23–27 February 1998; IEEE Computer Society: Washington, DC, USA, 1998; pp. 324–331. [Google Scholar]
- Zhang, J.; Kerekes, J. An Adaptive Density-Based Model for Extracting Surface Returns from Photon-Counting Laser Altimeter Data. IEEE Geosci. Remote Sens. Lett. 2015, 12, 726–730. [Google Scholar] [CrossRef]
- Zhang, G.; Xu, Q.; Xing, S.; Li, P.; Zhang, X.; Wang, D.; Dai, M. A Noise-Removal Method Without Input Parameters Based on Quadtree Isolation for Photon-Counting LiDAR. IEEE Geosci. Remote Sens. Lett. 2022, 19, 1–5. [Google Scholar] [CrossRef]
- Liao, P.S.; Chew, T.S.; Chung, P.C. A fast method for multilevel thresholding. J. Inf. Sci. Eng. 2001, 17, 713–727. [Google Scholar]
- Chen, B.; Pang, Y.; Li, Z.; Lu, H.; Liu, L.; North, P.R.J.; Rosette, J.A.B. Ground and Top of Canopy Extraction From Photon-Counting LiDAR Data Using Local Outlier Factor With Ellipse Searching Area. IEEE Geosci. Remote Sens. Lett. 2019, 16, 1447–1451. [Google Scholar] [CrossRef]
Disclaimer/Publisher’s Note: The statements, opinions and data contained in all publications are solely those of the individual author(s) and contributor(s) and not of MDPI and/or the editor(s). MDPI and/or the editor(s) disclaim responsibility for any injury to people or property resulting from any ideas, methods, instructions or products referred to in the content. |
© 2023 by the authors. Licensee MDPI, Basel, Switzerland. This article is an open access article distributed under the terms and conditions of the Creative Commons Attribution (CC BY) license (https://creativecommons.org/licenses/by/4.0/).