Article

Quantifying the Contribution of Driving Factors on Distribution and Change of Net Primary Productivity of Vegetation in the Mongolian Plateau

1
College of Geographical Science, Inner Mongolia Normal University, Hohhot 010022, China
2
Inner Mongolia Key Laboratory of Remote Sensing and Geographic Information Systems, Inner Mongolia Normal University, Hohhot 010022, China
*
Author to whom correspondence should be addressed.
These authors contributed equally to this work.
Remote Sens. 2023, 15(8), 1986; https://doi.org/10.3390/rs15081986
Submission received: 28 February 2023 / Revised: 3 April 2023 / Accepted: 7 April 2023 / Published: 9 April 2023
(This article belongs to the Special Issue Remote Sensing in Mountainous Vegetation)

Abstract

:
In recent years, multiple disturbances have significantly altered terrestrial ecosystems in arid and semi-arid regions, particularly on the Mongolian Plateau (MP). Net primary productivity (NPP) of vegetation is an essential component of the surface carbon cycle. As such, it characterizes the state of variation in terrestrial ecosystems and reflects the productive capacity of natural vegetation. This study revealed the complex relationship between the natural environment and NPP in the ecologically fragile and sensitive MP. The modified Carnegie–Ames–Stanford Approach (CASA) model was used to simulate vegetation NPP. Further, the contributions of topography, vegetation, soils, and climate to NPP’s distribution and spatiotemporal variation were explored using the geographic detector model (GDM) and structural equation model (SEM). The study’s findings indicate the following: (1) NPPs for different vegetation types in the MP were in the order of broad-leaved forest > meadow steppe > coniferous forest > cropland > shrub > typical steppe > sandy land > alpine steppe > desert steppe. (2) NPP showed an increasing trend during the growing seasons from 2000 to 2019, with forests providing larger vegetation carbon stocks. It also maintained a more stable level of productivity. (3) Vegetation cover, precipitation, soil moisture, and solar radiation were the key factors affecting NPP’s spatial distribution. NPP’s spatial distribution was primarily explained by the normalized difference vegetation index, solar radiation, precipitation, vegetation type, soil moisture, and soil type ( q -statistics = 0.86, 0.71, 0.67, 0.67, 0.57, and 0.57, respectively); the contribution of temperature was small ( q -statistics = 0.26), and topographic factors had the least influence on NPP’s distribution, as their contribution amounted to less than 0.20. (4) A SEM constructed based on the normalized difference vegetation index (NDVI), solar radiation, precipitation, temperature, and soil moisture explained 17% to 65% of the MP’s NPP variations. The total effects of the MP’s NPP variations in absolute values were in the order of NDVI (0.47) > precipitation (0.33) > soil moisture (0.16) > temperature (0.14) > solar radiation (0.02), and the mechanisms responsible for NPP variations differed slightly among the relevant vegetation types. Overall, this study can help understand the mechanisms responsible for the MP’s NPP variations and offer a new perspective for regional vegetation ecosystem management.

1. Introduction

Terrestrial ecosystems are important parts of the Earth’s ecosystems. They contribute considerably to the global carbon balance, as they perform the role of carbon sinks [1,2,3]. As an essential component of the terrestrial ecosystem, vegetation helps with carbon fixation, thanks to photosynthesis, which may be said to be the starting point of the carbon cycle [4]. The net primary productivity (NPP) of vegetation is the amount of total organic compounds accumulated in vegetation per unit area and time. NPP is usually expressed in terms of the gross carbon fixed as a result of vegetation photosynthesis minus that which is consumed for vegetation respiration [5,6]. Vegetation NPP effectively reflects the productivity of vegetation under natural conditions and is inextricably linked to the status of vegetation growth, which may characterize the quality of terrestrial ecosystems. NPP is often used as an indicator of carbon sources and carbon sinks [7]. Currently, despite the combined effect of global warming and anthropogenic disturbances, vegetation has recovered globally, and the number of carbon sinks has increased [8]. The factors affecting vegetation variation are more complex [9]. Therefore, investigating NPP’s spatiotemporal evolution characteristics and complex driving mechanisms can provide empirical evidence for optimizing ecosystem management and protection, as well as improving the adaptive capacity of vegetation to climate change.
Currently, the data generated using remote sensing technology are extensively utilized in several disciplines, especially ecology and meteorology. Thus, it is obvious that the data generated/collected by using remote sensing technology/tools provide rapid, accurate, and comprehensive descriptions concerning the structure of the terrestrial ecosystem. No wonder then that such data play an increasingly important role in the model estimation of vegetation NPP, such as in climate-related models [10], plant physiological and ecological processes models [11], and light-use efficiency models [11,12]. The use of remotely sensed products enhances the potential for the development of large spatial-scale NPP observations. The Carnegie–Ames–Stanford Approach (CASA) model, based on maximum light–use efficiency, has become the most widely used model for NPP estimation, as it fully considers the environment-related conditions of an ecosystem as well as vegetation’s influence on NPP estimation [13,14,15].
Some scholars have tried to use and modify the CASA model to investigate vegetation NPP in different areas. For example, Sun et al. [12] used Moderate Resolution Imaging Spectroradiometer (MODIS) data to drive the CASA model for estimating vegetation NPP on the Tibetan Plateau and concluded that the estimation accuracy would be more than adequate if this approach were adopted. Luo et al. [16] modified the CASA model by considering the time-lag effect of meteorological factors on NPP simulations; the model was then applied to simulate vegetation NPP of the Tibetan Plateau. In combination with their research on the MP’s vegetation characteristics, Bao et al. [17] modified the maximum light-use efficiency parameter to devise a more applicable CASA model for estimating the MP’s vegetation NPP.
Research methods and contents on the interaction between vegetation and the natural environment have also grown in sophistication as NPP estimation models have been enhanced and statistical models have been enriched. By utilizing statistical models such as the geographic detector model (GDM), a large number of studies have been conducted concerning the NPP’s spatial patterns and variations and their driving variables [18]. The GDM created by Wang et al. [19] has been widely used to describe how different variables affect the spatial pattern of vegetation NPP from a spatial perspective. The GDM has also helped determine the combined effect of meteorological elements, soil type, topography, geomorphologic type, vegetation type, and human activities (for example, population density and number of livestock) on the spatial heterogeneity of vegetation NPP [20,21]. For example, Guo et al. [22] investigated the causes of the spatiotemporal NPP patterns on the Tibetan Plateau based on the GDM; they discovered that the primary drivers of vegetation NPP varied depending on the study periods and ecological zones. Yin et al. [10] used multiple regression and the partial correlation method to analyze the relative effects of climate change and human activities on NPP at spatial scales in the Hengduan Mountain region. However, there is no consensus about the role and importance of each of these factors that affect NPP’s regional spatial distribution at various scales. In terms of precipitation and temperature (as vital components of the natural environment) also being drivers of NPP’s dynamics, it is widely acknowledged that they are the primary climatic variables determining NPP variations [23]. Additionally, several studies have demonstrated that evapotranspiration and vegetation cover impact NPP dynamics [24]. The processes determining NPP dynamics, however, are intricate, and each contributing element has the potential to not only function on its own but also interact with other factors. Traditional correlation analysis has only taken into account how certain factors directly affect NPP, which might occasionally vary from the situation on the ground. Hence, it is critical to measure both the direct and indirect effects of different variables on NPP dynamics to assess the total impact.
Fortunately, the widespread application of the structural equation model (SEM) in ecology provides a new perspective for investigating the relationship between NPP’s variables and changes. This method allows for not only the accurate quantification of the combined effects of the many factors influencing NPP variations, but also the identification of direct and indirect causal relationships between these factors [9,12]. Using a SEM, Sun et al. [12] investigated the relationship between NPP on the one hand and soil types, vegetation phenology, and climate change on the other, indicating a potential driving mechanism for NPP variations. The SEM constructed by Yang et al. [9] showed that vegetation dynamics were linked to continuous climate change and human activities and that fundamental environmental variables, such as topography, may indirectly influence vegetation change given that they affect human activities.
The Mongolian Plateau (MP), located in the northeastern part of Asia, is a typical arid and semi-arid climate region. This region is ecologically vulnerable and sensitive to climate change [25,26]. Undeniably, climate change and frequent drought episodes that have altered ecosystems’ carbon cycles have also altered the MP’s vegetation dynamics in recent years [27]. How the MP’s vegetation dynamics, characterized by the Normalized Difference Vegetation Index (NDVI), respond to the natural environment there has attracted more attention because of the unique characteristics of this ecosystem. Previous studies in this regard have used the linear regression method to explain the relationship between vegetation dynamics and their different drivers [28,29]. The effects of vegetation phenology on NPP variations were also investigated by Bao et al. [14]. They used the partial correlation analysis method for this purpose. The MP’s vegetation NPP has, however, changed recently because of various disturbances. Additionally, the GDM and SEM have seldom been used together in previous studies that examined the interaction between these drivers and vegetation NPP. For this study, it was decided that the GDM and SEM should be combined to fully explain the response mechanisms of NPP’s spatial patterns and changes in it owing to complex natural environments.
With this background in mind, this study aimed to quantify the driving forces of variations in NPP’s distribution and dynamics in the MP. This study used a modified CASA model to calculate NPP during the growing season (from April to October) for different vegetation types; the contributions of various environmental factors to NPP’s spatial patterns and dynamics were further evaluated by using the GDM and SEM. The specific objectives of this study were to achieve the following: (1) simulate the MP’s NPP by using the improved CASA model and explore its spatiotemporal variations; (2) explore the influence of topography (elevation, slope, aspect), vegetation (NDVI, vegetation type), soil types, and climate (solar radiation, precipitation, temperature, and soil moisture) on NPP’s spatial pattern; (3) reveal the direct and indirect effects of NDVI, solar radiation, precipitation, temperature, and soil moisture on NPP variations in different vegetation types.

2. Study Area and Materials

2.1. Study Area

The MP (87°43′–126°04′E, 37°22′–53°23′N), consisting of Mongolia and the Inner Mongolia Autonomous Region of China (hereafter Inner Mongolia), is an inland plateau in the northeastern part of Asia. Its total area is 2.75 million km2, and its altitude ranges from 92 m to 3971 m [26]. The MP’s terrain is complex; it has relatively flat hills in the middle and is mostly surrounded by mountains; it has the Gobi Desert to its southwest, the Altai and Hangay Mountains to its northwest, the Sajan and Kente Mountains to its north, the Greater Khingan Mountains to its east, and the Yin Shan to its south (Figure 1a). The MP falls in the typical temperate continental climate zone; it has cold and dry winters and hot and humid summers. The average annual temperature there ranges from −10 °C to 11 °C. Precipitation in most areas is less than 200 mm, and in some northern and northeastern mountainous parts, it is relatively abundant. The hydrothermal conditions have led to a diverse range of ecosystems across the MP. These include the meadow steppe, typical steppe, desert steppe, alpine steppe, sandy land, desert, broad-leaved forest, coniferous forest, shrub, cropland, and water body (Figure 1b).

2.2. Data Sources and Preprocessing

2.2.1. Topographic Dataset

To investigate the impact of topography on NPP’s spatial heterogeneity during the growing season, the Advanced Spaceborne Thermal Emission and Reflection Radiometer Global Digital Elevation Model (ASTER GDEM) topographic dataset, adopted by the National Aeronautics and Space Administration (NASA), was used for this study (Table 1). This topographic dataset has a spatial resolution of 30 m. The slope and aspect were also calculated by drawing on this dataset.

2.2.2. MODIS Datasets

The NDVI and NPP datasets were obtained from the MODIS products of MOD13A1 and MOD17A3, respectively, and they were downloaded from NASA’s Land Processes Distributed Active Archive Center (https://lpdaac.usgs.gov/products/mod17a2hgfv006/ (accessed on 8 August 2022)). MOD13A1 data have spatial and temporal resolutions of 500 m and 16 days, and the maximum value composite method was adopted to generate annual growing seasons’ time series data, which effectively reduced the influence of atmosphere, solar zenith angle, and cloud pollution on the data. Additionally, the MOD17A3 NPP dataset with a spatial and temporal resolution of 500 m and one year were used for this study as validation products for comparison with the modified CASA model-simulated NPP values.

2.2.3. Reanalysis Dataset

It is difficult to describe the spatiotemporal condition of the various meteorological elements as the MP has limited meteorological stations. Therefore, the monthly temperature, precipitation, and soil moisture (7–28 cm) data regarding the growing seasons were derived from the fifth-generation European Center for Medium-Range Weather Forecasts’ (ECMWF) atmospheric reanalysis dataset of the global climate (ERA5). These data have a spatial resolution of 0.1°, and the high accuracy and good application foundation of this dataset in arid and semi-arid areas have been verified [30].

2.2.4. Breathing Earth System Simulator Solar Radiation

Solar radiation data, with a spatiotemporal resolution of 0.05°/day, were generated by the Breathing Earth System Simulator (BESS). Ryu et al. [31] have validated the product against measured data on a global scale with an R2 of 0.94, which had high application accuracy.

2.2.5. Vegetation Type

Data concerning vegetation types were obtained from a digitized vegetation map that has a spatial resolution of 500 m [17]. It was rasterized from the National Atlas of Mongolia (Institute of Geography, Mongolian Academy of Science, 2009, Ulaanbaatar, Mongolia) and the 1:1,000,000 Inner Mongolia vegetation map. Based on this map, the vegetation types were further divided into meadow steppe, typical steppe, desert steppe, alpine steppe, sandy land, broad-leaved forest, coniferous forest, shrub, and cropland.

2.2.6. Soil Type

As soil type determines vegetation changes to a certain extent [21], the soil type data with a spatial resolution of 1 km maintained by the Food and Agriculture Organization (FAO) of the United Nations in the Harmonized World Soil Database (FAO-HWSD) were used to explore the relationship between soils’ and vegetation’s spatial distributions. This dataset contains mainly the FAO-74, FAO-85, and FAO-90 soil classification systems. This study divided the soil types into 19 categories by adopting the FAO-90 soil classification system.

3. Methods

3.1. Data Preprocessing

The collected data, with different temporal and spatial resolutions (Table 1), were preprocessed by format conversion, projection transformation, and clipping, and they were further resampled or interpolated to 0.05°. In addition, the monthly NDVI was generated by the maximum value composite method. The monthly precipitation and solar radiation were generated from the sum composite method, and the monthly temperature and soil moisture were generated from the mean value composite method. Meanwhile, the multi-annual average values within the growing season from April to October of NDVI, precipitation, temperature, soil moisture, and solar radiation data were extracted (Figure S1) and the data were classified to generated attribute values that were suitable for GDM analysis.

3.2. Modified CASA Model

The monthly vegetation NPP in the MP was estimated using the modified CASA model from 2000 to 2019 [14], which has been widely applicable to arid and semi-arid regions. This model was driven by NDVI, solar radiation, precipitation, temperature, and vegetation type data, etc. The following equations were applied:
NPP x , t = S O L x , t × F P A R x , t × 0.5 × ε x , t
F P A R x , t = m i n 1 + NDVI x , t 1 NDVI x , t 1 + NDVI x , t 1 NDVI x , t m i n ( 1 + NDVI x , t 1 NDVI x , t ) m a x 1 + NDVI x , t 1 NDVI x , t m i n , 0.95
where S O L x , t and F P A R x , t represent the total solar radiation and the proportion of photosynthetically active radiation absorbed by vegetation, respectively. S O L x , t was substituted using the sum of BESS solar radiation and F P A R x , t was calculated based on MODIS NDVI data. ε x , t represents the actual light-use efficiency of pixel x at moment t, stated as follows:
ε x , t = T ε 1 x , t × T ε 2 x , t × W ε x , t × ε m a x
where T ε 1 x , t and T ε 2 x , t reflect the effect of temperature on light-use efficiency at low and high temperatures, W ε x , t represents the stress of moisture on vegetation, and ε m a x is the maximum light-use efficiency that can be achieved by vegetation under ideal circumstances.

3.3. Theil–Sen Trend and Mann–Kendall Test

The Theil–Sen trend analysis method is a stable methodology of non-parametric statistics which is computationally efficient and less affected by outliers [32]. Hence, it is frequently used to calculate the trend of change in long-term series data. Thus, it was adopted for this study to calculate the trend of variation in NPP. The relevant equation is as follows:
β = M e d i e n [ x j x i ) / j i ,     j > i
where x i and x j are the NPP’s pixel values in the growth season of year i and year j, respectively, with NPP increasing for β > 0 and decreasing for β < 0.
The Mann–Kendall test is a non-parametric statistical test that does not rely on measured values to follow a normal distribution or linear trend of change; as such it is not affected by either missing values or outliers. It is usually used in combination with the Theil–Sen trend analysis method [32]. The pertinent statistical tests are as follows:
Z = S V a r S           ( S > 0 ) 0                                 S = 0 S + 1 V a r S           ( S < 0 )
S = i = 1 n 1 j = i + 1 n s i g n x j x i
s i n g x j x i = 1                 ( x j x i > 0 ) 0               x j x i = 0 1           ( x j x i < 0 )
V a r S = n n 1 2 n + 5 18
where n represents the length of the time series, and the test statistic S is approximately normally distributed when n 8 . For the present study, the significance of the changing trend of vegetation NPP was tested at a confidence level of 0.05. The time series passed the significance test if |Z| > 1.96, and the opposite, (|Z| ≤ 1.96), did not pass the significance test. The results of the Theil–Sen trend analysis and the Mann–Kendall test classified NPP’s spatial changes as a significant increase (β > 0, |Z| > 1.96), an insignificant increase (β > 0, |Z| ≤ 1.96), a significant decrease (β < 0, |Z| > 1.96), and an insignificant decrease (β < 0, |Z| ≤ 1.96).

3.4. GDM

The GDM, as a tool for detecting the spatial heterogeneity of geographical variables, can properly quantify the relationship between the spatial distribution of the independent and dependent variables [19,30]. The GDM can determine the explanatory power of the independent variables on the spatial differentiation of the dependent variable on the one hand and assess whether the interaction between factors strengthens or diminishes the explanatory power of the dependent variables on the other hand. In this study, therefore, we applied the GDM to quantify the main driving factors of the spatial distribution of NPP in the MP in order to reveal the influencing mechanisms behind the distribution of NPP. The extent to which the influence factor explained the NPP distribution was expressed as the q statistics:
q = 1 h = 1 l N h σ h 2 / N σ 2
where h = 1 ,   2 , ,   l is the classification or partition of the NPP or driving factors, N h and N denote the number of pixels in layer h and in the region, respectively, and σ h 2 and σ 2 represent the total variance of NPP values in layer h and in the region. The q value reflects the strength of the factor’s explanation of NPP’s spatial distribution, ranging from 0 to 1. The greater the q statistic, the more the explanatory power of the factor on NPP’s spatial distribution.
Interaction detection is used to identify whether the two factors acting together enhance or diminish NPP’s explanatory power or whether the factors act independently of each other. There were five types of detecting results based on the interaction detection, including nonlinear weakening, single-factor nonlinear weakening, bivariate enhancement, nonlinear enhancement, and independent relationship. The results were calculated by comparing every single factor’s q -statistics with the interaction q -statistics [ q (X1 ∩ X2)], such as bivariate enhancement { q (X1 ∩ X2) > max[ q (X1), q (X2)]} or the non-linear enhancement { q (X1 ∩ X2) > [ q (X1) + q (X2)]} effect. An R version of the GDM was used for this study, based on the “GD” package in R 4.1.0.

3.5. SEM

The SEM is a complex multivariate modeling approach of nested regressions; it includes path analysis, factor analysis, and maximum likelihood analysis [33], and it has been widely used in ecology, psychology, and management [34]. The SEM’s advantages are that it can determine the interactions between complex multiple variables and identify direct and indirect causal effects of independent and dependent variables quantitatively [35,36].
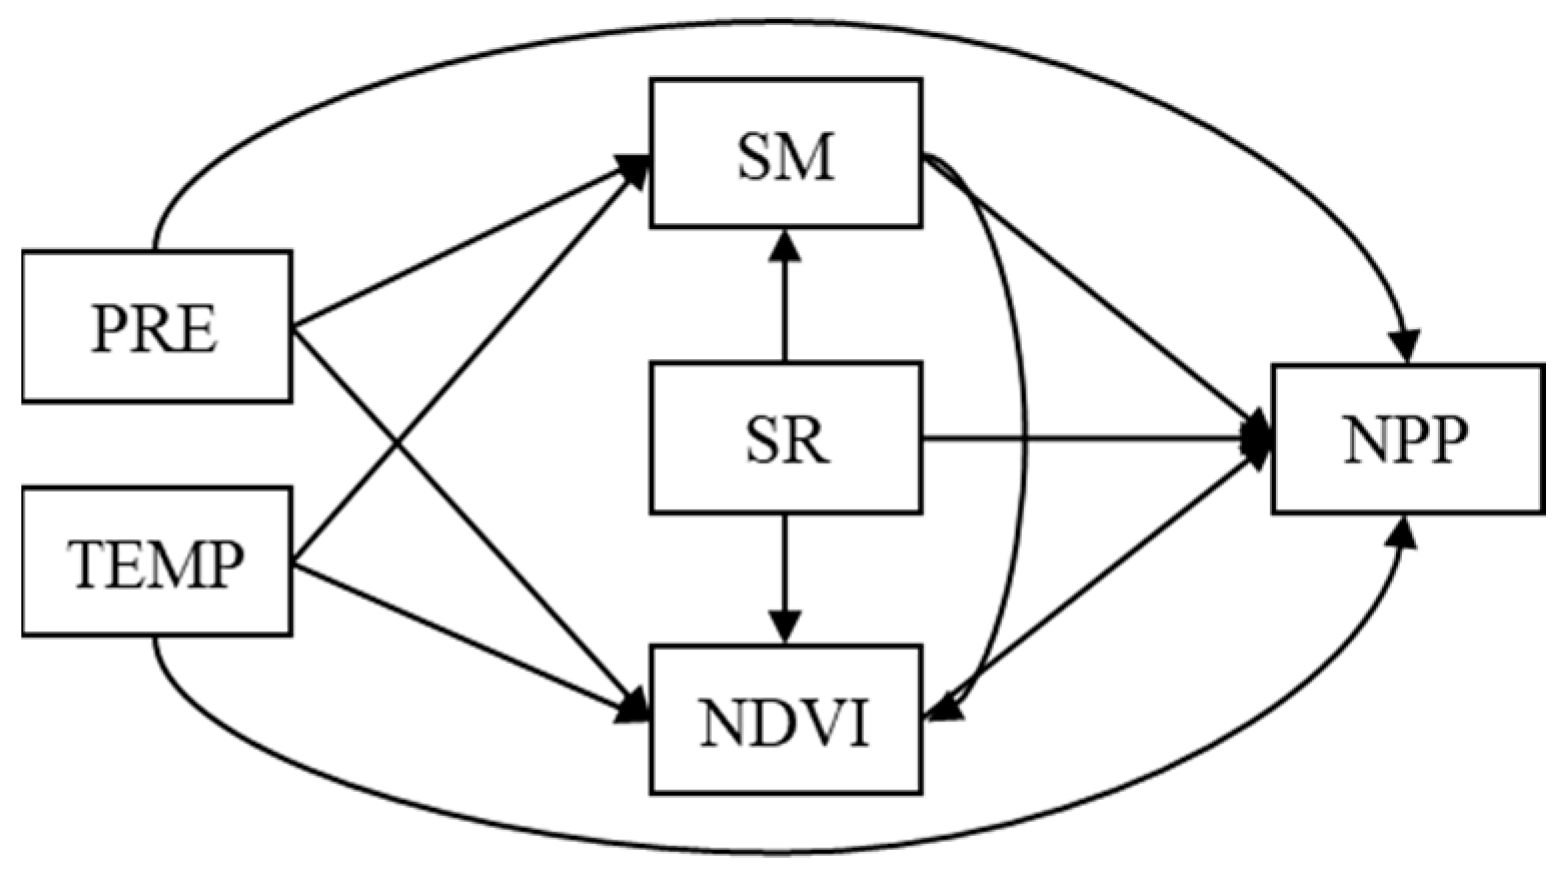
The objective variable for this study was NPP’s variations in the MP from 2000 to 2019. Based on the knowledge of the mechanisms that drive NPP variations, this study’s main hypotheses were as follows: (1) With the MP’s NPP as a starting point, it was hypothesized that the NDVI, solar radiation, temperature, precipitation, and soil moisture would cause NPP variations directly. (2) Precipitation, temperature, and solar radiation could have indirect effects on NPP variations with soil moisture and the NDVI as intermediate variables. (3) Soil moisture influences NDVI changes, which in turn influence NPP variations indirectly. These hypotheses were converted into a graphical conceptual model describing the interactive relationships between NPP variations and their driving factors (Figure 2). The goodness-of-fit index (GFI), comparative fit index (CFI) > 0.9, and standardized root mean square residual (SRMR) < 0.08 were used to determine the optimal model to explain NPP variations. It was notable that the SEM model was saturated with GFI = CFI = 1 and SRMR = 0. The fitted coefficients were not focused on as the model saturated; instead, only the significance and sizes of normalized path coefficients of the model were emphasized [37]. All SEM-driven analyses were carried out using the package “lavaan” in R 4.1.0.

4. Results

4.1. Spatial Distribution of Vegetation NPP in the MP

The simulated yearly NPP and the MODIS NPP product were analyzed through correlation to verify the accuracy of the modified CASA model (Figure 3). The simulated NPP was highly correlated with the MODIS NPP, with the coefficient of determination being 0.78 (p < 0.001) and the mean relative error (MRE) being 0.27, which indicated that the simulation accuracy of the modified CASA model was 73%. The root mean square error (RMSE) and mean absolute error (MAE) between simulated NPP values and MODIS NPP products were 83.33 g·C·m−2 and 63.00 g·C·m−2, respectively. The results indicate that the simulated NPP, based on the modified CASA model, reflected the real condition of the MP’s vegetation NPP. Although there is a propensity to overestimate when simulated NPP is compared with MODIS NPP, the coefficient of 1.06 was within a reasonable range and can be used for further studies.
The average NPP in the growing season showed obvious spatial heterogeneity from 2000 to 2019, with an average value of 256.20 g·C·m−2. Spatially, the MP’s long-term average NPP ranged from 30.99 g·C·m−2 to 689.40 g·C·m−2, with an increasing trend from the southwest to northeast (Figure 4a), and it showed high consistency with the distribution of vegetation types. High values (>330.14 g·C·m−2) of NPP were concentrated in the forested and meadow steppe-covered regions in the MP’s northern and northeastern areas, while low values (<136.30 g·C·m−2) were found in sparsely vegetated areas along the boundary of non-vegetated regions. As for different vegetation types, the NPP of broad-leaved forests (515.23 g·C·m−2) was the highest, followed by those of meadow steppe (440.13 g·C·m−2) and coniferous forests (344.12 g·C·m−2). The remainder of the six vegetation types’ NPPs, ranked from largest to smallest, were as follows: cropland (297.52 g·C·m−2), shrub (291.30 g·C·m−2), typical steppe (222.97 g·C·m−2), sandy land (210.85 g·C·m−2), alpine steppe (208.14 g·C·m−2), and desert steppe (86.99 g·C·m−2) (Figure 4b).

4.2. Spatiotemporal Variations of NPP in the MP

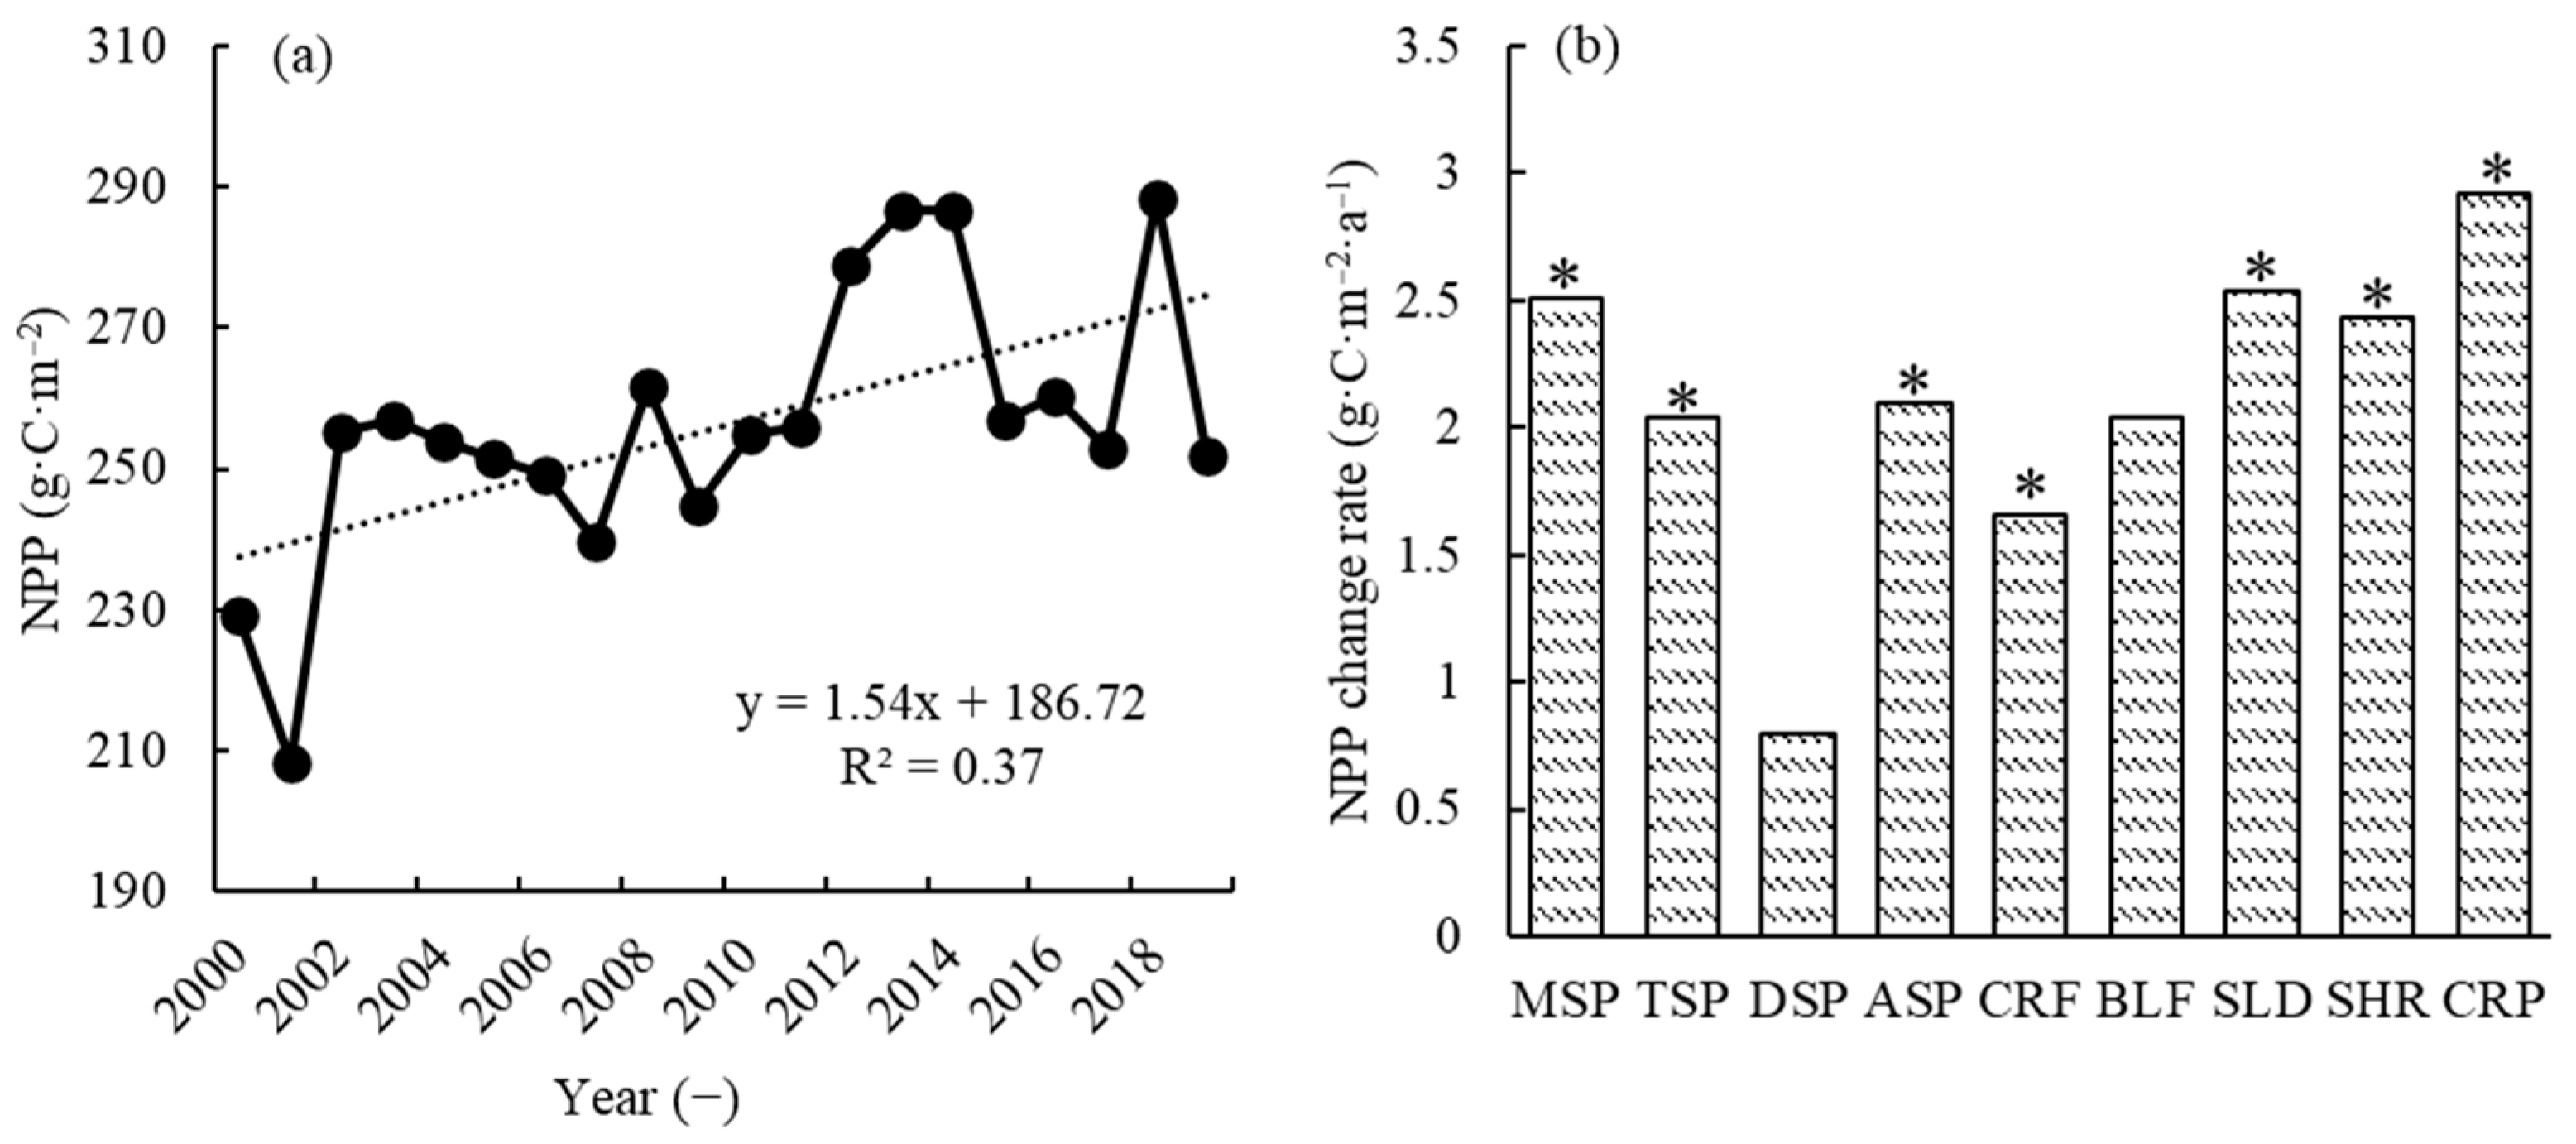
During the study period, the vegetation NPP in the MP increased from 229.15 g·C·m−2 in 2000 to 251.84 g·C·m−2 in 2019, with a significant rate of increase, i.e., 1.54 g·C·m−2·a−1 (p < 0.05; Figure 5a). As for different vegetation types, all of them showed an increasing trend in their NPP. Cropland had the highest NPP increase rate (2.92 g·C·m−2·a−1), followed by sandy land (2.54 g·C·m−2·a−1), meadow steppe (2.51 g·C·m−2·a−1), shrub (2.43 g·C·m−2·a−1), alpine steppe (2.10 g·C·m−2·a−1), broad-leaved forest (2.04 g·C·m−2·a−1), typical steppe (2.04 g·C·m−2·a−1), and coniferous forest (1.66 g·C·m−2·a−1). The NPP of desert steppe was the lowest (0.80 g·C·m−2·a−1) (Figure 5b). Except for the NPP of desert steppe and broad-leaved forest, the increasing NPP trends of other vegetation types passed the significance test. Similarly, the changing rate of NPP showed an obvious spatial heterogeneity in the MP, with the changing rates ranging from −13.85 g·C·m−2·a−1 to 11.87 g·C·m−2·a−1 (Figure 6a). The increasing trend concerning vegetation NPP prevailed in 95.56% of the plateau’s vegetated area. Of this, 23.52% of the area passed the significance test (p < 0.05), mainly being distributed near the Altai Mountains, the Hangay Mountains, and south of the Yin Shan. Only 0.08% and 4.36% of the vegetated area showed trends of significant decrease and insignificant decrease, respectively, and these regions were sporadically distributed in the northern and eastern localized regions of Inner Mongolia (Figure 6b). These results indicate that vegetation areas with increasing NPP are greater in number than those with decreasing NPP and that the carbon sequestration capacity of vegetation in the MP has increased over twenty years.

4.3. Main Factors Affecting NPP’s Spatial Pattern

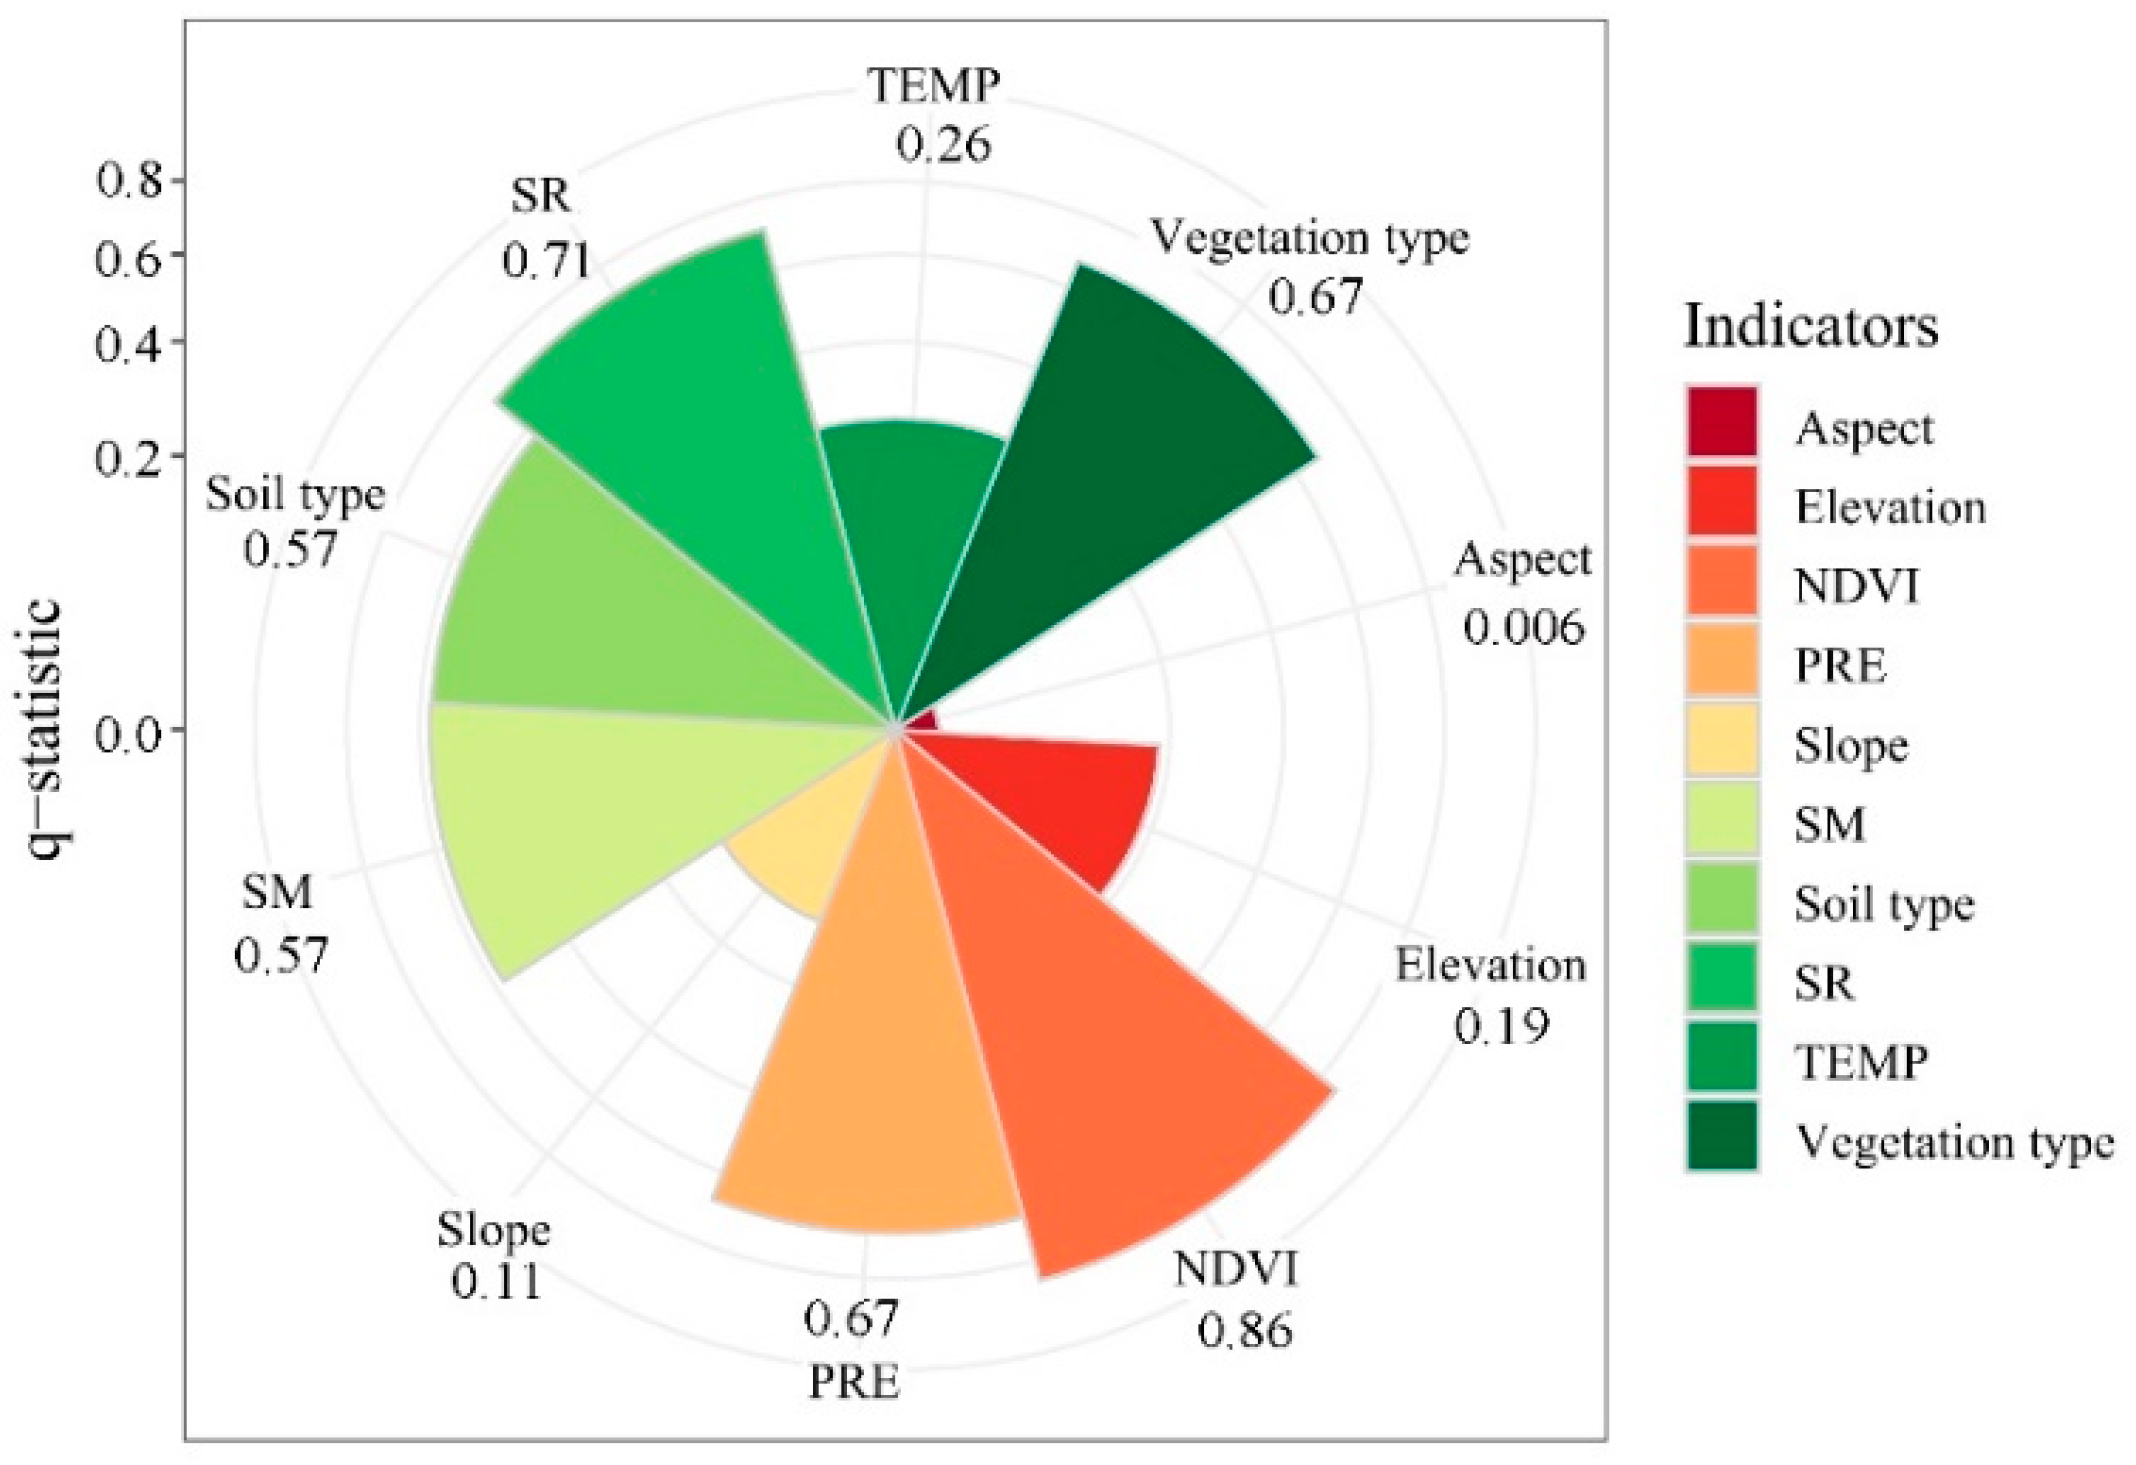
To investigate the influence of different environmental factors on the spatial distribution of NPP in the MP, the q -statistics of ten drivers were calculated using the GDM. As shown in Figure 7, all these factors had significant effects on the spatial heterogeneity of NPP in the MP (Figure 7). This result suggests that the NDVI, precipitation, soil moisture, and solar radiation play a dominant role in the spatial heterogeneity of NPP, with q -statistics higher than 0.50. The NDVI (0.86) has the highest q -statistics for the spatial heterogeneity of NPP, followed by solar radiation (0.71), precipitation (0.67), vegetation type (0.67), soil moisture (0.57), and soil type (0.57). Notably, temperature and topography affected NPP’s spatial distribution to some extent, with a q -statistic less than 0.30. This indicates that their contribution to NPP’s spatial distribution was relatively weak. Among the topographic elements, the q -statistic of elevation (0.19) was significantly higher than that of slope (0.11) and aspect (0.006).
The interaction of the bi-factors enhanced the explanatory power of different environmental factors on NPP’s spatial distribution (Figure 8). The q -statistics for the interaction between the NDVI and other factors happened to be greater than those of most other interactions, indicating that the NDVI, as the dominant factor in the distribution of NPP, has the greatest influence on NPP when interacting with the other factors. It was clear that precipitation, soil moisture, and solar radiation were the essential determinants for the productivity of vegetation. Thus, all of the interactions between the variables, where solar radiation, precipitation, and soil moisture have a greater influence, were bivariate enhancements. The explanatory power of elevation, slope, and aspect for NPP was no more than 0.20, with single-factor effects. Further, even for these interactions, the effect on NPP’s distribution was low and showed more non-linear enhancements.

4.4. Spatio-Temporal Variations of Different Driving Factors

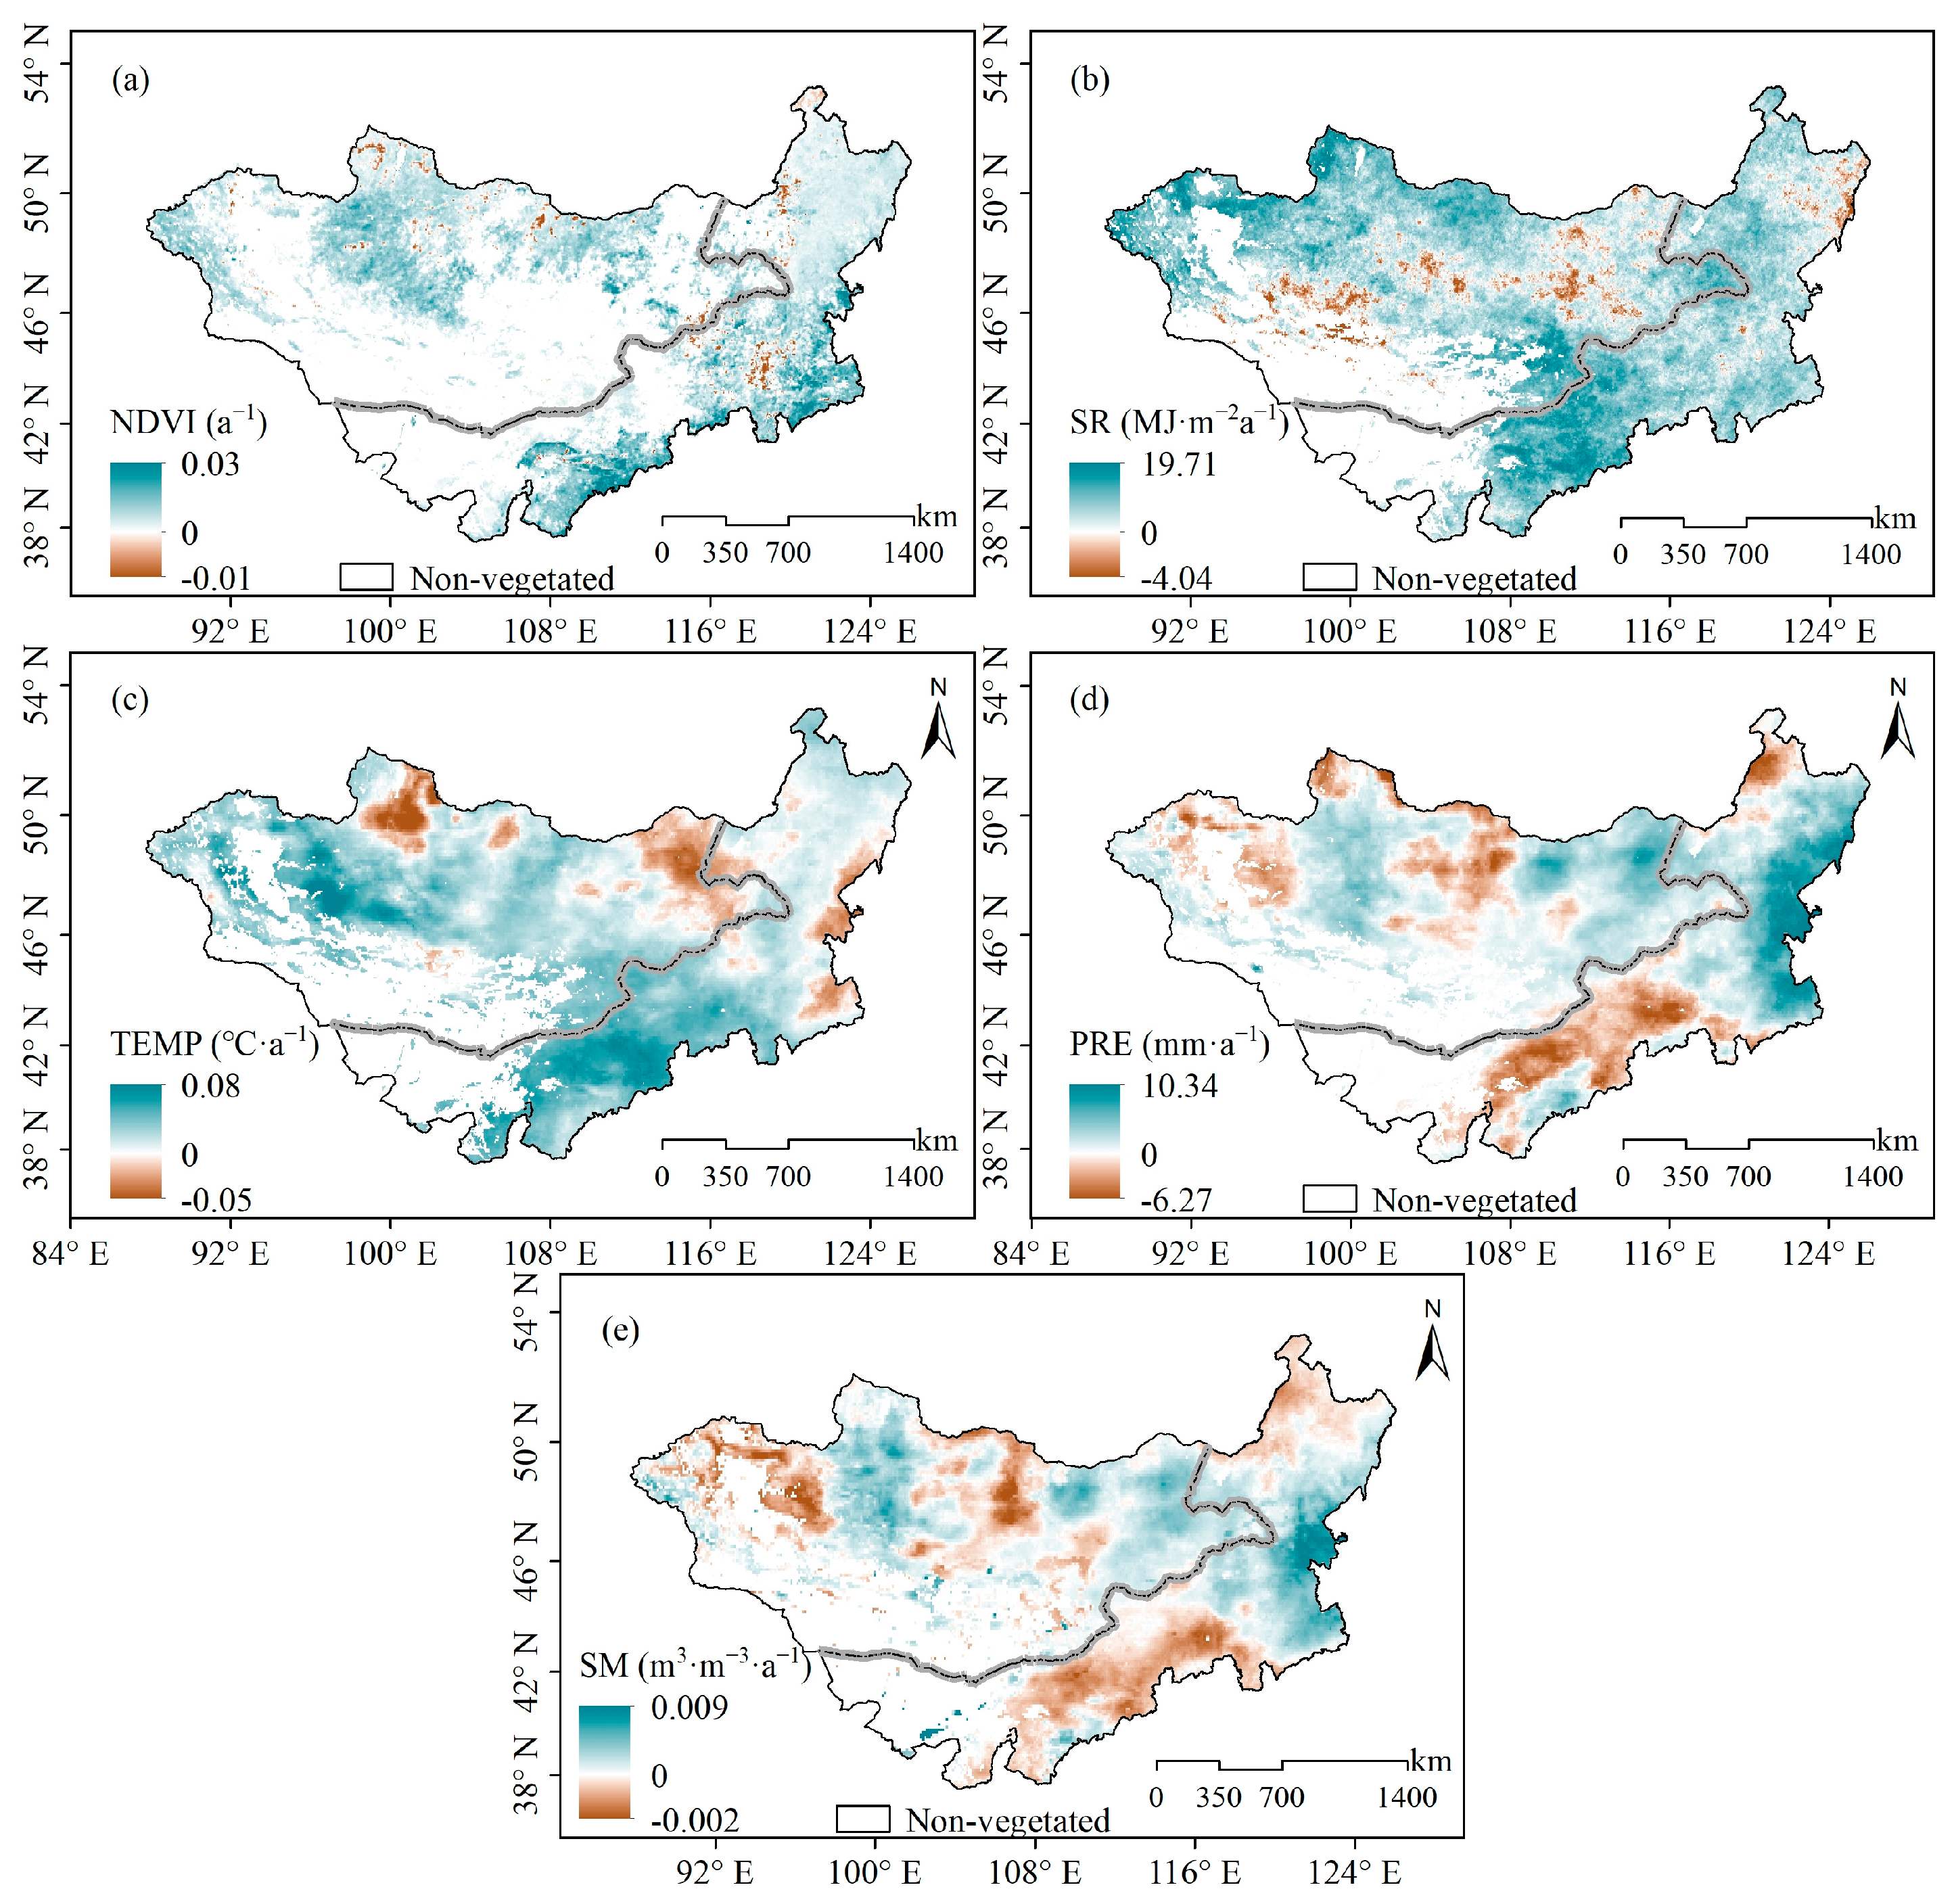
Figure 9 shows the spatial variations of the NDVI, solar radiation, precipitation, temperature, and soil moisture during the growing seasons from 2000 to 2019 in the MP. In general, an increasing trend of the NDVI prevailed in the MP, and the areas of increase and decrease were similar to NPP variations’ regional distributions, with these areas showing increased and decreased NDVI values that account for 67.63% and 32.37% of the whole vegetated areas, respectively (Figure 9a). Almost the entire plateau showed an increase in solar radiation (90.81%), while only 9.19% exhibited a reduction in solar radiation (Figure 9b). Decreased solar radiation was mainly located to the south and north of the Hangay Mountains and on the eastern side of the Sajan and Greater Khingan Mountains. Further, increased and decreased temperature accounted for 83.11% and 16.89% of the vegetated area, respectively. Temperature decreased near the Sajan Mountains to the east of Mongolia and the eastern areas of Inner Mongolia (Figure 9c). Similar spatial variations existed in precipitation and soil moisture, with an obvious spatial heterogeneity. This is consistent with the fact that soil moisture is closely related to precipitation. Precipitation and soil moisture decreased in the Altai Mountains, the Sajan Mountains, the Yin Shan, and areas north of the Greater Khingan Mountains as well as in the elevated areas of the Kente Mountains, and the proportions were 33.63% in precipitation and 42.97% in soil moisture. The changing rates of precipitation and soil moisture ranged from −6.27 mm·a−1 to 10.34 mm·a−1 and from −0.002 m3·m−3·a−1 to 0.009 m3·m−3·a−1, respectively (Figure 9d,e). In general, NDVI restoration was reported in the MP, with an overall warmer and humid trend. However, the moisture content decreased in Mongolia’s central and western regions and Inner Mongolia’s central-western and northeastern regions.
As for different vegetation types, NDVI values increased significantly for each one of them, with the increasing rate ranging from 0.002 to 0.005 (Figure S2). As for solar radiation, desert steppe received the most solar radiation and showed high variability, while solar radiation in broad-leaved forests remained at a relatively stable level. It was also found that there has been a continuous increase in solar radiation over the years; however, no significant upward trend was observed except in alpine steppe’s case (Figure S3). Similarly, temperature showed an insignificant increasing trend for different vegetation types in the MP (Figure S4). Except for desert steppe, precipitation and soil moisture displayed an upward trend for the vegetation types (Figures S5 and S6).

4.5. Pathway Analysis of the Impact of Driving Factors on NPP Changes

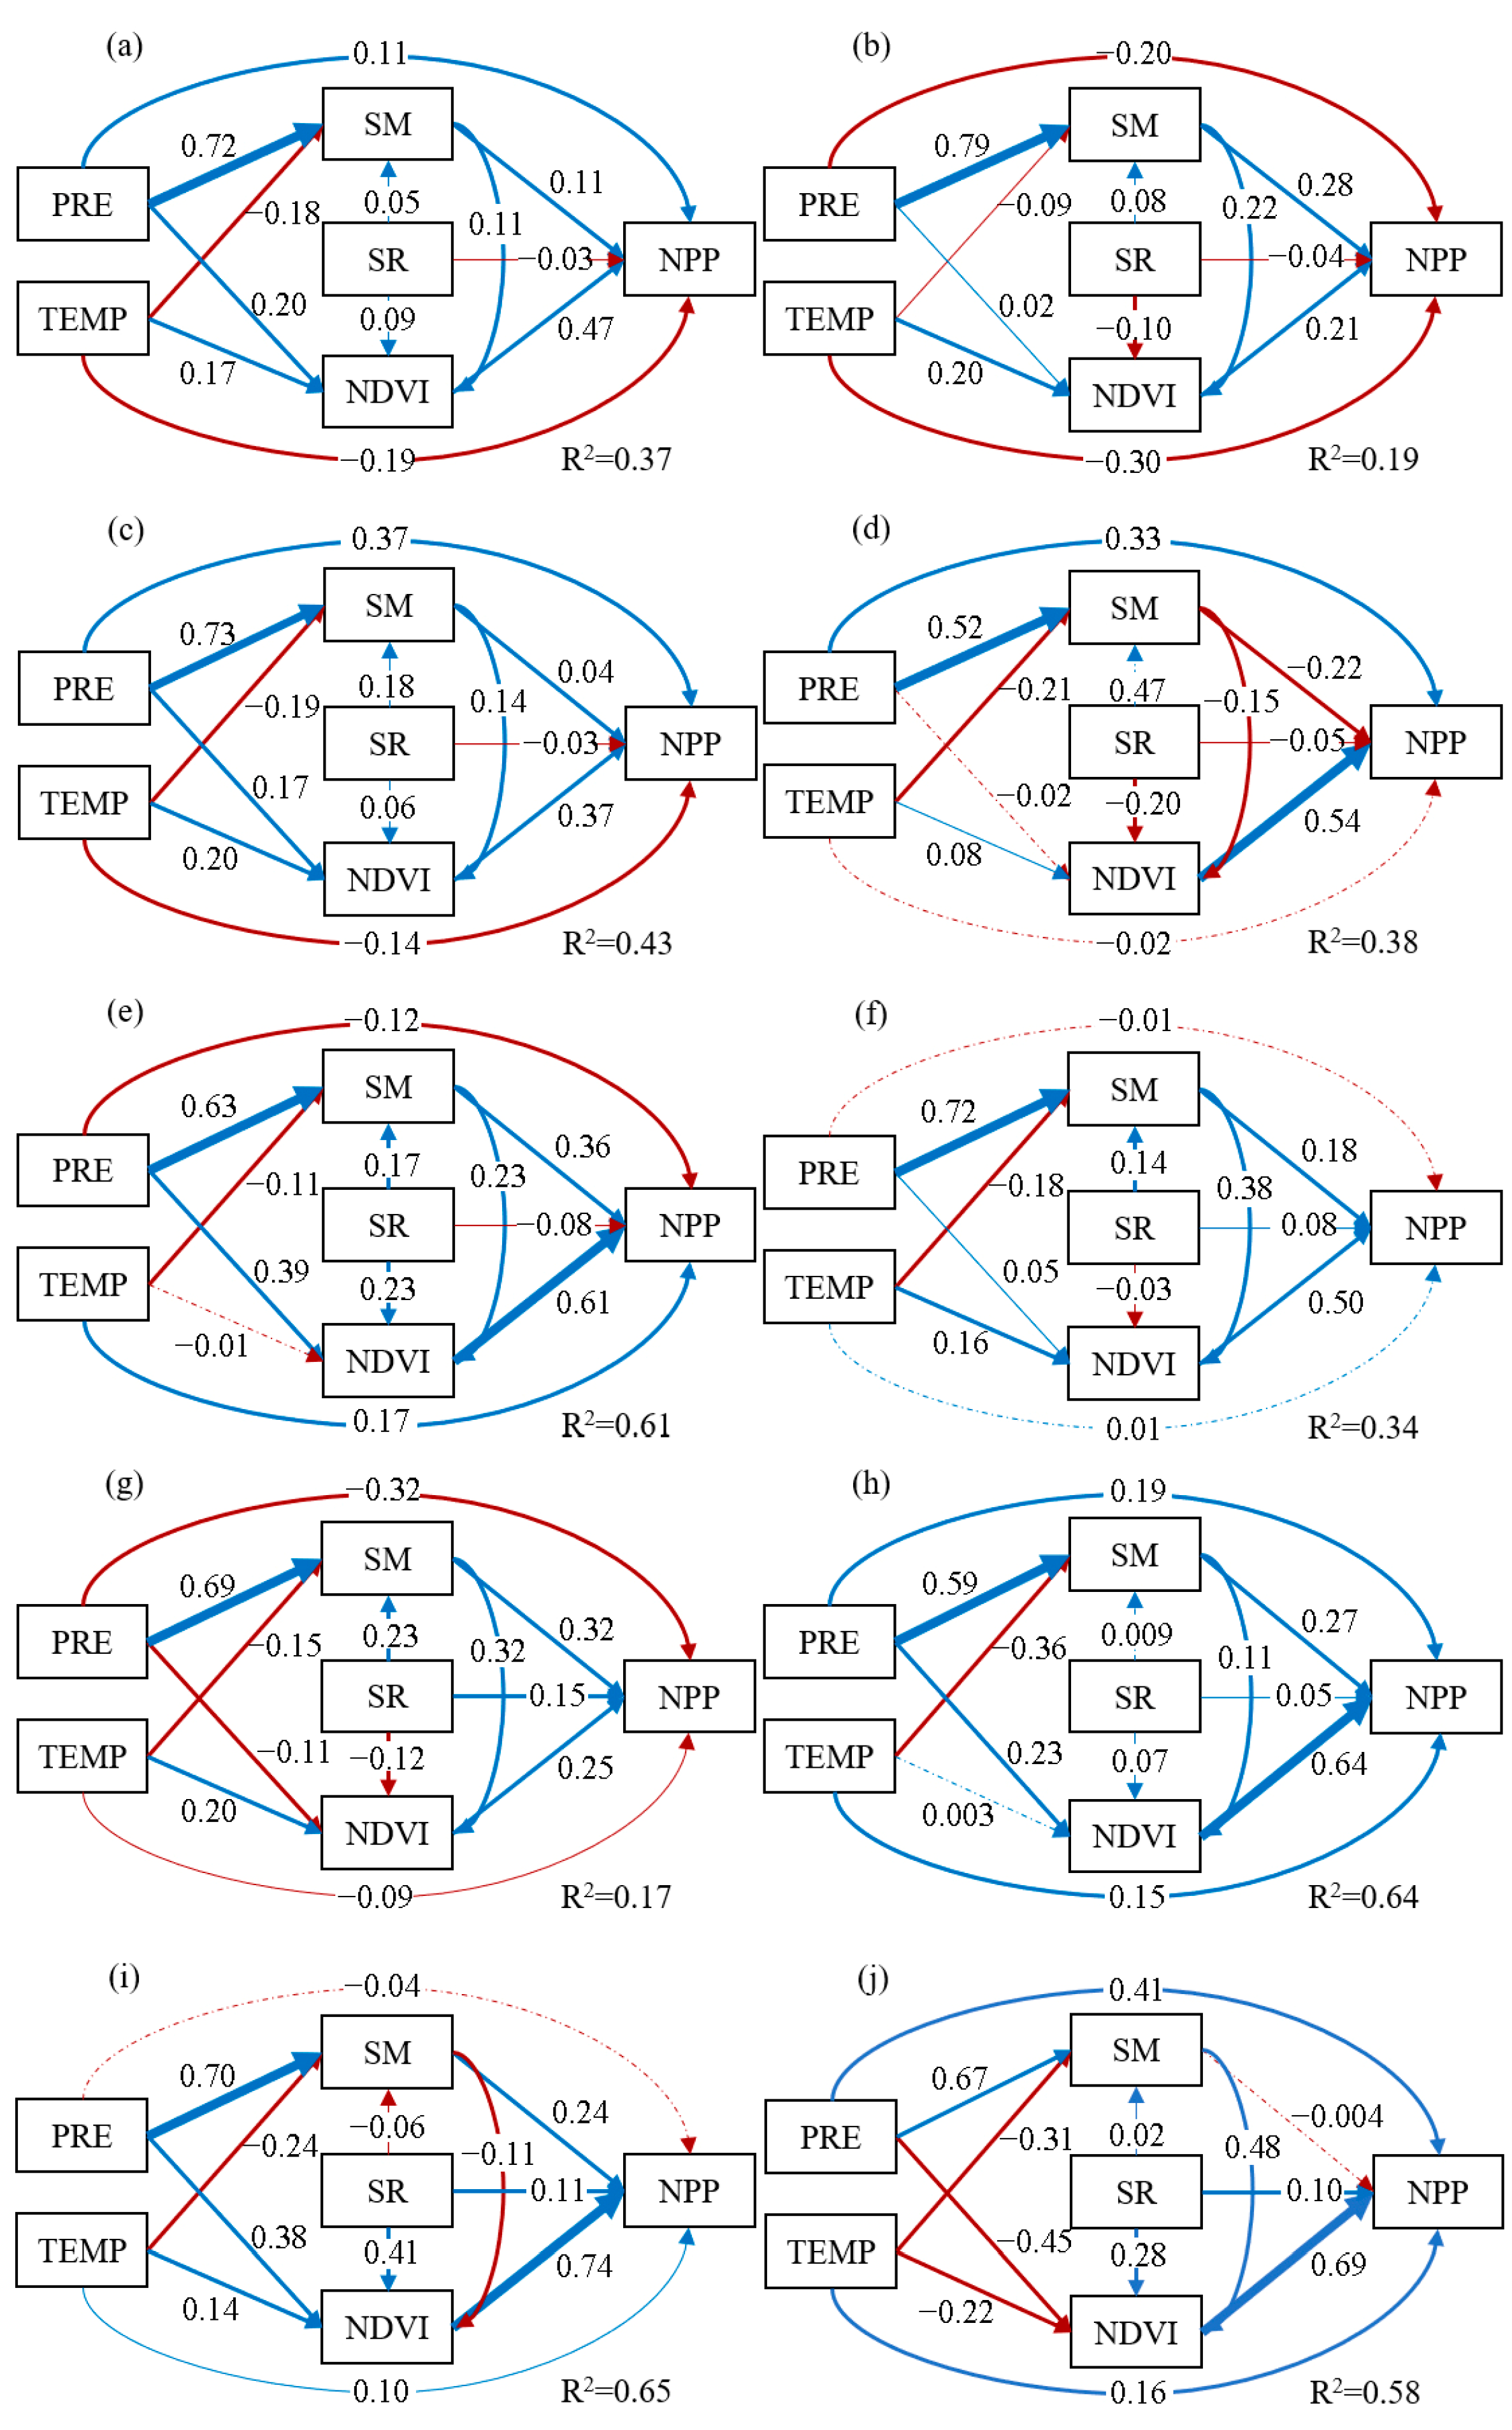
To better understand the influence of climate change on NPP in the MP, a pathway analysis of the impact of the changes of environmental factors on NPP was carried out (Table 2). The finally fitted SEM for the MP is presented in Figure 9a. The performance of the fitted model was satisfactory, with CFI = GFI = 1 and SRME = 0. The SEM that was constructed with the selected variables (NDVI, solar radiation, temperature, precipitation, and soil moisture) explained 37% of the MP’s NPP variations (R2 = 0.37). Generally, the NDVI was the natural variable that best reflected NPP change, with its total effect being 0.47. As an intermediary variable, all other driving factors had an indirect effect on NPP given their influence on the NDVI. Solar radiation’s indirect effect through the NDVI (0.04) on NPP change (solar radiation → NDVI → NPP) was even higher than the direct effect (−0.03). Precipitation was also highly related to NPP change, with a total influence coefficient of 0.33. Other than precipitation’s direct effect, it also indirectly affected NPP change through the NDVI and soil moisture, with the influence coefficients being 0.09 and 0.08, respectively. Temperature displayed a negative effect on NPP change, with a total influential coefficient of −0.14, indicating that the continuously warming climate is not conducive to the enhancement of vegetation’s carbon sequestration capacity.
As for different vegetation types, all of the predictor variables together explained 19%, 43%, 38%, and 61% of NPP variation in the four steppe types: meadow steppe, typical steppe, desert steppe, and alpine steppe (Figure 10b–e). Different steppe types responded varyingly to all of the factors. It is clear that precipitation directly affects NPP negatively in meadow steppe (−0.20) and alpine steppe (−0.12), where relatively abundant precipitation in the environment resupplied soil moisture for vegetation growth (precipitation → soil moisture → NPP), with coefficients of 0.22 and 0.23, respectively. For desert steppe, however, the direct and indirect effects of soil moisture on NPP were both negative. Similarly, there was a negative direct effect of solar radiation on NPP accumulation for different steppe types, with the direct influence coefficients being −0.04, −0.03, −0.05, and −0.08 for meadow steppe, typical steppe, desert steppe, and alpine steppe, respectively. Temperature had an insignificant direct effect in the case of desert steppe and a significant direct effect in the case of meadow steppe, typical steppe, and alpine steppe. Except for alpine steppe, temperature was directly and negatively related to NPP in other steppe types.
About 34% and 17% of NPP variations in coniferous forests and broad-leaved forests were explained by the constructed SEM (Figure 10f,g, CFI = GFI = 1, and SRME = 0). Precipitation and temperature mainly and indirectly contributed to the NPP change in coniferous forests. The direct contribution of precipitation and temperature to NPP changes in coniferous forests was not significant, with path coefficients of −0.01 and 0.01. This was not consistent with broad-leaved forests’ influential pathway, which was directly affected by precipitation and temperature, with influence coefficients of 0.32 and −0.09. The increase in solar radiation and the NDVI directly resulted in increased NPP in forests. While controlling for other variables, temperature had an indirect effect on NPP changes in coniferous forests and broad-leaved forests, mainly by affecting the NDVI. In comparison to precipitation, forests in the MP were more sensitive to soil moisture changes. Especially for NPP in broad-leaved forests, soil moisture was the most dominant driving factor, and the total effect was 0.40. Soil moisture was the second dominant driving factor for NPP in coniferous forests (0.37), which is less than the effect of the NDVI (0.50) on it.
For sandy land, shrub, and cropland, the SEM explained the relatively high degree of NPP variation of 64%, 65%, and 58%, respectively (Figure 10h,j, CFI = GFI = 1, and SRME = 0). The most significant responses of increased NPP to changed NDVI values were found for sandy land, shrub, and cropland with coefficients of 0.64, 0.74, and 0.69, respectively. Solar radiation had a significant indirect effect on NPP variations through the NDVI for these types. Temperature and precipitation indirectly affected NPP variations, on the one hand by promoting the change of NDVI values and on the other by affecting soil moisture. It was found that precipitation was the primary moisture factor for NPP variations in sandy land, shrub, and cropland, with total effects of 0.57, 0.33, and 0.43, respectively.

5. Discussion

5.1. Interpretation of the Spatial Distribution Characteristics of the MP’s Vegetation NPP

The present study found that a strong spatial heterogeneity existed in vegetation NPP from 2000 to 2019 in the MP, showing an increasing trend from southwest to northeast, which was consistent with the conclusions of previous studies [14,38]. The vegetation types having more complex ecosystems and soil types with higher nutrient contents were consistent with the distribution of regions with high NPP values. This phenomenon was inseparable from regional differences in the natural environment. The results of the GDM showed that the geographical distribution of NPP was mainly influenced by the vegetation’s NDVI, climate, soil type, and topography. Meanwhile, the various natural factors often did not work alone; instead, two or more factors acted together. Both factors interacted with each other to enhance the explanatory power of NPP’s driving factors such that the distribution of NPP was determined by the interaction of different drivers.
The NDVI had the largest contribution (86%) to the distribution of NPP, and explained the spatial pattern of NPP by interacting with other driving factors to a greater extent ( q -statistics). For one thing, a high NDVI frequently results in vegetation’s high photosynthetic efficiency during the growing season, better vegetation growth status, and higher carbon sequestration capacity, thereby accumulating more NPP [23]. Specifically, the NDVI reflects vegetation greenness, and the photosynthetic efficiency of vegetation enhances with the increase in greenness [25], thus increasing the accumulation of NPP. For another, the NDVI could somewhat reflect the amount of vegetation biomass and influence the distribution of NPP, as it is the best indicator of vegetation growth status and spatial distribution density. The results of this study were in agreement with the findings of Yang et al. [39], who discovered that the greater values of NPP were distributed in regions with more vegetation cover. Moreover, a certain connection between the NDVI and NPP was identified, as the former was the main parameter for calculating the latter in the modified CASA model.
The intensity of solar radiation contributed to 71% of NPP distribution by affecting the photosynthesis of vegetation. Solar radiation is the major driving force maintaining surface temperature and promoting vegetation activity, and its interaction with other factors should not be neglected since solar radiation usually affects NPP distribution by influencing vegetation growth and hydrothermal conditions. Vegetation coverage is typically linked to the amount of solar radiation an area receives, which means that areas with scant vegetation have less area available for photosynthesis, leading to lower levels of vegetation productivity despite higher levels of solar radiation. In contrast, in rich vegetation areas sufficient solar radiation interception by vegetation stimulates vegetation to photosynthesize and produce more organics [40].
Water condition is one of the most critical factors affecting the growth of vegetation in arid zones [41]. The primary water exchange channels, precipitation and soil moisture, as well as their interplay, affected surface evaporation and vegetation transpiration, which altered regional water balance. Vegetation only flourishes in the presence of enough water content, particularly in arid and semi-arid regions [42]. Precipitation and soil moisture explained 67% and 57% of the NPP‘s distribution, respectively. As the main water resource for the MP, precipitation affected NPP by causing direct effects on vegetation photosynthesis and respiration on the one hand and by providing additional water for vegetation growth through soil moisture on the other. In addition, soil moisture was often replenished from the melting of snow and permafrost in the MP. The moisture condition created by the combination of precipitation and soil moisture facilitated the vegetation growth and productivity accumulation.
Further, it was found that vegetation type, another significant component, accounted for 67% of the spatial distribution of NPP. The northern MP’s broad-leaved forest and meadow steppe were determined to have the highest NPP, whereas sandy land and high-elevation alpine steppe had the lowest NPP. This finding was consistent with that of a previous study, which found that locations with high concentrations of forests see the highest NPP [23]. This result may be caused by the various vegetation types displaying varying sensitivities to general climatic and environmental conditions [21]. Additionally, some studies have pointed to a strong correlation between NPP and the physiological traits of the vegetation itself [43,44]. Forests and meadow steppe have higher vegetation cover compared to other vegetation types, which can lessen the loss of soil moisture, owing to evapotranspiration, thus improving the conditions for vegetation to develop and carbon sequestration to take place.
About 57% of NPP’s geographic difference was explained by soil type. The function of soil is to hold water, retain heat, and store nutrients, thus fostering the growth of vegetation [21]. Nutrient soils were often found in the MP’s northern and northern-eastern regions. These soils support the growth of vegetation and offer the necessary conditions for NPP augmentation [2]. Temperature was also one of the important conditions for vegetation growth, but its explanatory strength for NPP’s distribution in the MP is only 26%. Topographic elements may affect NPP distribution by altering the availability of hydrothermal conditions for vegetation growth [36]. For the different topographic factors, the impact of elevation on NPP was far more significant than that of slope and aspect, but topography was not the main factor contributing to NPP’s spatial pattern.

5.2. Effect Pathways of Different Driving Factors on NPP Changes

Except for desert steppe and broad-leaved forest, NPP’s interannual variation showed a significant increasing trend for different vegetation types from 2000 to 2019 in the MP (Figure 4b). This phenomenon is inseparable from the changes in climate and vegetation cover. For instance, various forest ecosystems have a complex ecosystem structure and strong capacity to cope with climate change. This provides large vegetation carbon stocks and helps maintain a more stable productivity level when compared with other vegetation types [45]. The largest interannual variation in NPP of cropland can probably be attributed to the intensity of productivity increases maintained by long-term anthropogenic irrigation activities [45]. NPP of different vegetation types experienced different responses, depending on the environmental factors. The NDVI, solar radiation, temperature, precipitation, and soil moisture were directly affected by NPP changes, while the NDVI and soil moisture served as intermediary variables that indirectly affected NPP changes, according to the SEM. The variables that affect variations in NPP interact, as was expected.
For the MP, on the whole, precipitation and soil moisture were highly related to NPP variations, with increased moisture benefiting vegetation growth [36]. Possibly, increased temperature had a negative direct and total effect on the MP. It was shown that soil moisture was increasing in the plateau, which was strongly correlated with the increase of precipitation. Increased precipitation rapidly replenishes soil moisture to a large extent during the growing season (Figure 9 and Figure 10a); the negative correlation between soil moisture and temperature can be explained by the fact that increased temperature promotes vegetation transpiration and soil evapotranspiration, resulting in loss of soil moisture. Therefore, even though an increase in temperature would probably encourage vegetation growth and positively affect NDVI values, it could also result in soil moisture loss and raise the possibility of local drought, which could negatively affect vegetation carbon sequestration with continuous rising temperatures [46]. In contrast with the hydrothermal conditions, solar radiation variation contributes less to NPP variations. However, increased solar radiation promotes changes in vegetation NDVI values, which act on vegetation photosynthetic utilization efficiency, thereby enhancing vegetation carbon sequestration.
For different vegetation types, precipitation mostly provided water for NPP accumulation, indirectly through soil moisture, for meadow steppe, alpine steppe, coniferous forest, broad-leaved forest, and cropland. Even in relatively humid and vulnerable ecosystems (such as meadow steppe, alpine steppe, coniferous forest, and shrub) where the direct effect of increased precipitation promoted carbon assimilation and stimulated ecosystem respiration, it could result in carbon loss [24]. However, the increased precipitation was converted to soil moisture utilized by vegetation for carbon assimilation; the NPP’s increased trend in these vegetation types made this indirect effect of precipitation on vegetation critical as a means of compensation for potential carbon loss [41]. The capacity of vegetation to photosynthesize strengthened with increased solar radiation (Figure S3), if other conditions were maintained [47]. Nevertheless, for the four steppe types, the inherently more intense solar radiation may result in the closure of vegetation stomata during increased solar radiation (Figure S3) so that photosynthesis would weaken or discontinue, causing directly negative effects on NPP accumulation [48].
NDVI values increased in large areas of the MP, and all vegetation types showed a significant increase in NDVI values (Figure 9 and Figure S2). In the past years, NDVI variation has been affected by precipitation, temperature, soil moisture, and solar radiation to different extents. It had greater influence on NPP when it was the intermediate variable of precipitation and soil moisture, which further illustrates the importance of moisture on vegetation in arid and semi-arid areas. Furthermore, the previous study showed that the NDVI was well-correlated with the biomass and leaf area index, which could indirectly reflect vegetation activity and productivity [20]. NDVI variation expressed the change in the intensity of vegetation’s photosynthesis, and its total effect was in the top position among different vegetation types. Similarly, in addition to directly contributing to NPP because of improved photosynthesis, increased NDVI values also added surface area for vegetation transpiration, thereby acting on vegetation carbon sequestration by altering the water vapor content of the vegetation’s growing environment [46].
Although temperature increases can enhance carbon sequestration by strengthening vegetation photosynthesis, the consequent excessive evaporation and increased vegetation respiration in a growing season may negatively affect NPP variations [24,49], such as in the case of meadow steppe, typical steppe, broad-leaved forest, and coniferous forest. While increased temperature reduced the amount of soil moisture, the supplementation of soil moisture by increased precipitation properly compensated for this moisture loss (Figure 10). However, in desert steppe, which was deficient in precipitation, soil moisture loss caused by increased temperatures was not supplemented by precipitation (Figure S6). Similarly, vegetation primarily absorbed soil moisture through the root system for vegetation growth and development [41], while the increased soil moisture of different vegetation types provided moisture for vegetation growth.
The SEM constructed for this study explained 17–65% of the NPP variations because the factors that influence NPP variations are not limited to those discussed in this study. It was concluded that the lower the degree to which the model explained NPP changes in a certain vegetation type, the greater the possibility that other driving factors existed in the areas in question. For instance, grazing activities may disturb the changes that would have taken place in vegetation’s carbon sequestration capacity in meadow steppe and typical steppe [29]. While forests constitute the main carbon reservoir of terrestrial ecosystems, the weakening impact of climate change on them in recent years underlines the role of ecological restoration projects concerning carbon sequestration [50]. It was interesting to note that some of the indirect effects of the influences on NPP changes had the opposite direct effects. One explanation for this phenomenon is that there may have been a reduction in the direct effect of the variables concerned with NPP change through other indirect pathways [51].
Previous studies have shown that shifting land-use types were most likely influenced by human activities [52]. From 2000 to 2019, desert to grassland, grassland to forest, and forest to grassland shifts accounted for 39.60%, 17.29%, and 16.05% of the land-use conversion in the MP, respectively (Figure S7a), which increased the NPP of land-use type shifting areas by 38.36%, 16.29%, and 14.40% based on the MCD12Q1 vegetation classification [52]. The result further demonstrates that a series of ecological management policies such as sandy land management, afforestation, and return of cropland to grass in Mongolia and Inner Mongolia have achieved initial success in alleviating soil erosion and enhancing the carbon sequestration capacity of vegetation during the 21st century [53]. While the grassland to cropland shift accounted for 15.10% of the area, 14.57% of the increase in NPP was probably caused by anthropogenic irrigation activities. Although city expansion may lead to a decrease in NPP, it does not account for the main effect. The livestock population reflected the trajectory of human activities to a certain extent, and the areas with high livestock density were mainly located in central Mongolia and most parts of Inner Mongolia (Figure S7b). It has been shown that livestock population can increase vegetation productivity by providing nutrients for vegetation growth; however, this phenomenon only occurred during the transition from light grazing to moderate grazing intensity [38,54]. Therefore, the development of appropriate grazing policies for the region is an issue that should not be neglected in improving the ecology and productivity of vegetation in pastoral areas.
To clarify the mechanisms influencing vegetation NPP’s accumulation, future studies on this subject should not limit their assessment to the study of climate change alone. Further, the association of factors in nature may not be explained clearly by correlation analysis alone, and more complex relationships (e.g., causal relation) also need to be constructed to describe such interactions. In the near future, quantification of the impact of human activities on nature and coming up with a better explanation of SEM impact pathways could also be some of the focus areas in the exploration of vegetation carbon sequestration.

6. Conclusions

This study used the modified CASA model to analyze vegetation NPP during the growing season in the MP and explore the contributions of topography, soil type, climate, and vegetation cover on NPP’s spatial distribution. Accordingly, the direct and indirect effects of climate change and variation of the NDVI on NPP changes were revealed. The main conclusions are as follows:
(1)
NPP’s spatial distribution in the MP during the growing season showed a decreasing trend from the northeast to the southwest. For different vegetation types covered by this study, NPP ranked as follows: broad-leaved forest > meadow steppe > coniferous forest > cropland > shrub > typical steppe > sandy land > alpine steppe > desert steppe.
(2)
The NPP during the growing season showed an increasing trend in different vegetation types, with significant variations in NPP for different vegetation types except for desert steppe and broad-leaved forest. In addition to providing larger vegetation carbon stocks, forest ecosystems also maintain more stable productivity levels.
(3)
Vegetation cover, moisture condition, and solar radiation were the dominant factors in NPP’s spatial distribution, followed by temperature and topographic elements. These factors contributed to the spatial distribution of NPP in descending order of explanation: the NDVI (0.86), solar radiation (0.71), precipitation (0.67), vegetation type (0.67), soil moisture (0.57), soil type (0.57), temperature (0.26), elevation (0.19), slope (0.11), and aspect (0.006).
(4)
The SEM constructed for this study explained 17% to 65% of the NPP variations, and the NPP change was dominated by the direct effects of the NDVI and moisture condition (precipitation and soil moisture). The total effects of NPP variations in the MP in absolute value were as follows: NDVI (0.47) > precipitation (0.33) > soil moisture (0.16) > temperature (0.14) > solar radiation (0.02). The effects of the NDVI and climate change on NPP varied by different vegetation types, with soil moisture being the dominant moisture factor for steppes and forests in determining NPP variations, while precipitation was the dominant moisture factor in sandy land, shrub, and cropland. Additionally, NPP variations were less influenced by the temperature variations for different vegetation types.
Overall, this study discovered that vegetation in the MP has improved and the vegetation’s carbon sequestration capacity has increased since 2000. Moreover, the application of the GDM and SEM could in part explain the mechanisms that contribute to NPP’s distribution and changes. This facilitated a better understanding of the causes of vegetation variations and the interactions among different driving factors. This study also found that the management of moisture may be the main problem to be addressed in ecological restoration processes in the MP.

Supplementary Materials

The following supporting information can be downloaded at: https://www.mdpi.com/article/10.3390/rs15081986/s1, Figure S1: The spatial distribution of different environmental factors in the Mongolian Plateau (MP). Note: precipitation (PRE), temperature (TEMP), soil moisture (SM), solar radiation (SR), and normalized difference vegetation index (NDVI); Figure S2: Long-term (2000–2019) NDVI trends for different vegetation types in the MP: alpine steppe (ASP), broad-leaved forest (BLF), coniferous forest (CRF), cropland (CRP), desert steppe (DSP), meadow steppe (MSP), shrub (SHR), sandy land (SLD), typical steppe (TSP); Figure S3: Long-term (2000–2019) trend of SR for different vegetation types in the MP; Figure S4: Long-term (2000–2019) trend of TEMP for different vegetation types in the MP; Figure S5: Long-term (2000–2019) trend of PRE for different vegetation types in the MP; Figure S6: Long-term (2000–2019) trend of SM for different vegetation types in the MP; Figure S7: Distribution of land use type shift (a) and livestock population (b) in the MP.

Author Contributions

Conceptualization, methodology, writing—original draft, funding acquisition, C.Y.; review, editing, validation, X.C.; conceptualization, supervision, review, editing, funding acquisition, M.L.; review, editing, funding acquisition, F.M.; investigation, validation, C.S.; investigation, funding acquisition, S.B.; investigation, validation, Z.Y.; investigation, X.Z.; investigation, Y.B. All authors have read and agreed to the published version of the manuscript.

Funding

This research was funded by the National Natural Science Foundation of China (42101030, 42261079, 41961058), the Talent Project of Science and Technology in Inner Mongolia (NJYT22027, NJYT23019), Fundamental Research Funds for the Inner Mongolia Normal University (2022JBBJ014, 2022JBQN093, CXJJS21150), the Natural Science Foundation of Inner Mongolia (2020BS04009, 2020BS03042), the graduate student education innovation program fund of the Inner Mongolia Autonomous Region (S20210276Z), and the graduate students’ research and innovation fund of Inner Mongolia Normal University (CXJJS21150).

Data Availability Statement

Not applicable.

Conflicts of Interest

The authors declare no conflict of interest.

References

  1. Luo, M.; Sa, C.; Meng, F.; Duan, Y.; Liu, T. Assessing extreme climatic changes on a monthly scale and their implications for vegetation in Central Asia. J. Clean. Prod. 2020, 271, 122396. [Google Scholar] [CrossRef]
  2. Xu, L.; Yu, G.; He, N.; Wang, Q.; Gao, Y.; Wen, D.; Li, S.; Niu, S.; Ge, J. Carbon storage in China’s terrestrial ecosystems: A synthesis. Sci. Rep. 2018, 8, 2806. [Google Scholar] [CrossRef] [PubMed] [Green Version]
  3. Minshu, Y.; Qiuan, Z.; Jiang, Z.; Jinxun, L.; Huai, C.; Changhui, P.; Peng, L.; Mingxu, L.; Meng, W.; Pengxiang, Z. Global response of terrestrial gross primary productivity to climate extremes. Sci. Total Environ. 2021, 750, 142337–142350. [Google Scholar]
  4. Du, L.; Gong, F.; Zeng, Y.; Ma, L.; Qiao, C.; Wu, H. Carbon use efficiency of terrestrial ecosystems in desert/grassland biome transition zone: A case in Ningxia province, northwest China. Ecol. Indic. 2021, 120, 106971–106981. [Google Scholar] [CrossRef]
  5. Teng, M.; Zeng, L.; Hu, W.; Wang, P.; Yan, Z.; He, W.; Zhang, Y.; Huang, Z.; Xiao, W. The impacts of climate changes and human activities on net primary productivity vary across an ecotone zone in Northwest China. Sci. Total Environ. 2020, 714, 136691. [Google Scholar] [CrossRef]
  6. Liu, H.; Jia, J.; Lin, Z.; Wang, Z.; Gong, H. Relationship between net primary production and climate change in different vegetation zones based on EEMD detrending—A case study of Northwest China. Ecol. Indic. 2021, 122, 107276. [Google Scholar] [CrossRef]
  7. Gu, X.; Zhao, H.; Peng, C.; Guo, X.; Lin, Q.; Yang, Q.; Chen, L. The mangrove blue carbon sink potential: Evidence from three net primary production assessment methods. For. Ecol. Manag. 2022, 504, 119848. [Google Scholar] [CrossRef]
  8. Chi, C.; Taejin, P.; Xuhui, W.; Shilong, P.; Baodong, X.; Chaturvedi, R.K.; Richard, F.; Victor, B.; Philippe, C.; Rasmus, F.; et al. China and India lead in greening of the world through land-use management. Nat. Sustain. 2019, 2, 122–129. [Google Scholar]
  9. Yang, L.; Shen, F.; Zhang, L.; Cai, Y.; Yi, F.; Zhou, C. Quantifying influences of natural and anthropogenic factors on vegetation changes using structural equation modeling: A case study in Jiangsu Province, China. J. Clean. Prod. 2021, 280, 124330. [Google Scholar] [CrossRef]
  10. Yin, L.; Dai, E.; Zheng, D.; Wang, Y.; Ma, L.; Tong, M. What drives the vegetation dynamics in the Hengduan Mountain region, southwest China: Climate change or human activity? Ecol. Indic. 2020, 112, 106013–106024. [Google Scholar] [CrossRef]
  11. Sun, Q.; Li, B.; Zhou, C.; Li, F.; Zhang, Z.; Ding, L.; Zhang, T.; Xu, L. A systematic review of research studies on the estimation of net primary productivity in the Three-River Headwater Region, China. J. Geog. Sci. 2017, 27, 161–182. [Google Scholar] [CrossRef]
  12. Sun, H.; Chen, Y.; Xiong, J.; Ye, C.; Yong, Z.; Wang, Y.; He, D.; Xu, S. Relationships between climate change, phenology, edaphic factors, and net primary productivity across the Tibetan Plateau. Int. J. Appl. Earth Obs. Geoinf. 2022, 107, 102708–102718. [Google Scholar] [CrossRef]
  13. Liu, Y.; Yang, Y.; Wang, Q.; Muhammad, K.; Zhang, Z.; Tong, L.; Jianlong, L.I.; Shi, A. Assessing the Dynamics of Grassland Net Primary Productivity in Response to Climate Change at the Global Scale. Chin. Geogr. Sci. 2019, 29, 725–740. [Google Scholar] [CrossRef] [Green Version]
  14. Bao, G.; Chen, J.; Chopping, M.; Bao, Y.; Bayarsaikhan, S.; Dorjsuren, A.; Tuya, A.; Jirigala, B.; Qin, Z. Dynamics of net primary productivity on the Mongolian Plateau: Joint regulations of phenology and drought. Int. J. Appl. Earth Obs. Geoinf. 2019, 81, 85–97. [Google Scholar] [CrossRef]
  15. Guo, D.; Song, X.; Hu, R.; Cai, S.; Zhu, X.; Hao, Y. Grassland type-dependent spatiotemporal characteristics of productivity in Inner Mongolia and its response to climate factors. Sci. Total Environ. 2021, 775, 145644. [Google Scholar] [CrossRef]
  16. Luo, Z.; Wu, W.; Yu, X.; Song, Q.; Yang, J.; Wu, J.; Zhang, H. Variation of Net Primary Production and Its Correlation with Climate Change and Anthropogenic Activities over the Tibetan Plateau. Remote Sens. 2018, 10, 1352. [Google Scholar] [CrossRef]
  17. Bao, G.; Bao, Y.; Qin, Z.; Xin, X.; Bao, Y.; Bayarsaikan, S.; Zhou, Y.; Chuntai, B. Modeling net primary productivity of terrestrial ecosystems in the semi-arid climate of the Mongolian Plateau using LSWI-based CASA ecosystem model. Int. J. Appl. Earth Obs. Geoinf. 2016, 46, 84–93. [Google Scholar] [CrossRef]
  18. Lei, T.; Feng, J.; Lv, J.; Wang, J.; Song, H.; Song, W.; Gao, X. Net Primary Productivity Loss under different drought levels in different grassland ecosystems. J. Environ. Manag. 2020, 274, 111144–111155. [Google Scholar] [CrossRef]
  19. Wang, J.F.; Li, X.H.; Christakos, G.; Liao, Y.L.; Zhang, T.; Gu, X.; Zheng, X.Y. Geographical Detectors-Based Health Risk Assessment and its Application in the Neural Tube Defects Study of the Heshun Region, China. Int. J. Geog. Inf. Sci. 2010, 24, 107–127. [Google Scholar] [CrossRef]
  20. Kang, Y.; Guo, E.; Wang, Y.; Bao, Y.; Bao, Y.; Mandula, N. Monitoring Vegetation Change and Its Potential Drivers in Inner Mongolia from 2000 to 2019. Remote Sens. 2021, 13, 3357. [Google Scholar] [CrossRef]
  21. Huo, H.; Sun, C. Spatiotemporal variation and influencing factors of vegetation dynamics based on Geodetector: A case study of the northwestern Yunnan Plateau, China. Ecol. Indic. 2021, 130, 108005–108014. [Google Scholar] [CrossRef]
  22. Guo, B.; Han, B.; Yang, F.; Chen, S.; Liu, Y.; Yang, W. Determining the contributions of climate change and human activities to the vegetation NPP dynamics in the Qinghai-Tibet Plateau, China, from 2000 to 2015. Environ. Monit. Assess. 2020, 192, 663–680. [Google Scholar] [CrossRef] [PubMed]
  23. Bao, G.; Tuya, A.; Bayarsaikhan, S.; Dorjsuren, A.; Mandakh, U.; Bao, Y.; Li, C.; Vanchindorj, B. Variations and climate constraints of terrestrial net primary productivity over Mongolia. Quat. Int. 2020, 537, 112–125. [Google Scholar] [CrossRef]
  24. Dong, G.; Zhao, F.; Chen, J.; Zhang, Y.; Shao, C. Non-climatic component provoked substantial spatiotemporal changes of carbon and water use efficiency on the Mongolian Plateau. Environ. Res. Lett. 2020, 15, 095009. [Google Scholar] [CrossRef]
  25. Guo, E.; Wang, Y.; Wang, C.; Sun, Z.; Bao, Y.; Mandula, N.; Jirigala, B.; Bao, Y.; Li, H. NDVI Indicates Long-Term Dynamics of Vegetation and Its Driving Forces from Climatic and Anthropogenic Factors in Mongolian Plateau. Remote Sens. 2021, 13, 688. [Google Scholar] [CrossRef]
  26. Luo, M.; Meng, F.; Sa, C.; Duan, Y.; Bao, Y.; Liu, T.; De Maeyer, P. Response of vegetation phenology to soil moisture dynamics in the Mongolian Plateau. Catena 2021, 206, 105505. [Google Scholar] [CrossRef]
  27. Zhang, R.; Zhao, X.; Zuo, X.; Degen, A.A.; Li, Y.; Liu, X.; Luo, Y.; Qu, H.; Lian, J.; Wang, R. Drought-induced shift from a carbon sink to a carbon source in the grasslands of Inner Mongolia, China. Catena 2020, 195, 104845–104855. [Google Scholar] [CrossRef]
  28. Liu, Y.; Yang, P.; Zhang, Z.; Zhang, W.; Wang, Z.; Zhang, Z.; Ren, H.; Zhou, R.; Wen, Z.; Hu, T. Diverse responses of grassland dynamics to climatic and anthropogenic factors across the different time scale in China. Ecol. Indic. 2021, 132, 108341. [Google Scholar] [CrossRef]
  29. Wang, J.; Brown, D.G.; Chen, J. Drivers of the dynamics in net primary productivity across ecological zones on the Mongolian Plateau. Landsc. Ecol. 2013, 28, 725–739. [Google Scholar] [CrossRef]
  30. Meng, F.; Luo, M.; Sa, C.; Wang, M.; Bao, Y. Quantitative assessment of the effects of climate, vegetation, soil and groundwater on soil moisture spatiotemporal variability in the Mongolian Plateau. Sci. Total Environ. 2022, 809, 152198. [Google Scholar] [CrossRef]
  31. Ryu, Y.; Jiang, C.; Kobayashi, H.; Detto, M. MODIS-derived global land products of shortwave radiation and diffuse and total photosynthetically active radiation at 5km resolution from 2000. Remote Sens. Environ. Interdiscip. J. 2018, 204, 812–825. [Google Scholar] [CrossRef]
  32. PZ, S.; KV, J. Comparative study of innovative trend analysis technique with Mann-Kendall tests for extreme rainfall. Arab. J. Geosci. 2021, 14, 536–550. [Google Scholar]
  33. Fan, Y.; Chen, J.; Shirkey, G.; John, R.; Wu, S.R.; Park, H.; Shao, C. Applications of structural equation modeling (SEM) in ecological studies: An updated review. Ecol. Process. 2016, 5, 19. [Google Scholar] [CrossRef] [Green Version]
  34. Kline, R.B. Principles and Practice of Structural Equation Modeling; The Guilford Press: New York, NY, USA, 2022. [Google Scholar]
  35. Li, Y.; Bao, W.; Bongers, F.; Chen, B.; Chen, G.; Guo, K.; Jiang, M.; Lai, J.; Lin, D.; Liu, C.; et al. Drivers of tree carbon storage in subtropical forests. Sci. Total Environ. 2019, 654, 684–693. [Google Scholar] [CrossRef]
  36. Gu, Z.; Zhang, Z.; Yang, J.; Wang, L. Quantifying the Influences of Driving Factors on Vegetation EVI Changes Using Structural Equation Model: A Case Study in Anhui Province, China. Remote Sens. 2022, 14, 4203. [Google Scholar] [CrossRef]
  37. Steeger, C.M.; Gondoli, D.M. Mother-adolescent conflict as a mediator between adolescent problem behaviors and maternal psychological control. Dev. Psychol. 2013, 49, 804–814. [Google Scholar] [CrossRef] [Green Version]
  38. Schönbach, P.; Wan, H.; Gierus, M.; Bai, Y.; Müller, K.; Lin, L.; Susenbeth, A.; Taube, F. Grassland responses to grazing: Effects of grazing intensity and management system in an Inner Mongolian steppe ecosystem. Plant Soil 2010, 340, 103–115. [Google Scholar] [CrossRef]
  39. Yang, S.; Bai, Y.; Alatalo, J.M.; Wang, H.; Tong, J.; Liu, G.; Zhang, F.; Chen, J. Spatial–temporal pattern of cultivated land productivity based on net primary productivity and analysis of influencing factors in the Songhua River basin. Land Degrad. Dev. 2022, 33, 1917–1932. [Google Scholar] [CrossRef]
  40. Li, S.; He, S. The variation of net primary productivity and underlying mechanisms vary under different drought stress in Central Asia from 1990 to 2020. Agric. For. Meteorol. 2022, 314, 108767. [Google Scholar] [CrossRef]
  41. Li, W.; Migliavacca, M.; Forkel, M.; Denissen, J.M.C.; Reichstein, M.; Yang, H.; Duveiller, G.; Weber, U.; Orth, R. Widespread increasing vegetation sensitivity to soil moisture. Nat. Commun. 2022, 13, 3959–3967. [Google Scholar] [CrossRef]
  42. Sun, Y.; Yang, Y.; Zhao, X.; Tang, Z.; Wang, S.; Fang, J. Global patterns and climatic drivers of above- and belowground net primary productivity in grasslands. Sci. China Life Sci. 2021, 64, 739–751. [Google Scholar] [CrossRef] [PubMed]
  43. Zhu, L.; Meng, J.; Zhu, L. Applying Geodetector to disentangle the contributions of natural and anthropogenic factors to NDVI variations in the middle reaches of the Heihe River Basin. Ecol. Indic. 2020, 117, 106545–106556. [Google Scholar] [CrossRef]
  44. Wu, L.; Ma, X.; Dou, X.; Zhu, J.; Zhao, C. Impacts of climate change on vegetation phenology and net primary productivity in arid Central Asia. Sci. Total Environ. 2021, 796, 149055–149069. [Google Scholar] [CrossRef] [PubMed]
  45. Groisman, P.; Shugart, H.; Kicklighter, D.; Henebry, G.; Tchebakova, N.; Maksyutov, S.; Monier, E.; Gutman, G.; Gulev, S.; Qi, J. Northern Eurasia Future Initiative (NEFI): Facing the challenges and pathways of global change in the twenty-first century. Prog. Earth Planet. Sci. 2017, 4, 41. [Google Scholar] [CrossRef] [Green Version]
  46. Li, Z.; Chen, Y.; Wang, Y.; Fang, G. Dynamic changes in terrestrial net primary production and their effects on evapotranspiration. Hydrol. Earth Syst. Sci. 2016, 20, 2169–2178. [Google Scholar] [CrossRef] [Green Version]
  47. Ge, W.; Deng, L.; Wang, F.; Han, J. Quantifying the contributions of human activities and climate change to vegetation net primary productivity dynamics in China from 2001 to 2016. Sci. Total Environ. 2021, 773, 145648–145658. [Google Scholar] [CrossRef]
  48. Baligar, V.C.; Elson, M.; He, Z.; Li, Y.; Paiva, A.D.Q.; Almeida, A.-A.; Ahnert, D. Light Intensity Effects on the Growth, Physiological and Nutritional Parameters of Tropical Perennial Legume Cover Crops. Agronomy 2020, 10, 1515. [Google Scholar] [CrossRef]
  49. Shi, Y.; Xu, L.; Zhou, Y.; Ji, B.; Zhou, G.; Fang, H.; Yin, J.; Deng, X. Quantifying driving factors of vegetation carbon stocks of Moso bamboo forests using machine learning algorithm combined with structural equation model. For. Ecol. Manag. 2018, 429, 406–413. [Google Scholar] [CrossRef]
  50. Chen, Y.; Feng, X.; Tian, H.; Wu, X.; Gao, Z.; Feng, Y.; Piao, S.; Lv, N.; Pan, N.; Fu, B.-J. Accelerated increase in vegetation carbon sequestration in China after 2010: A turning point resulting from climate and human interaction. Glob. Chang. Biol. 2021, 27, 5848–5864. [Google Scholar] [CrossRef]
  51. MacKinnon, D.; Krull, J.; Lockwood, C. MacKinnon DP, Krull JL, Lockwood CM. Equivalence of the mediation, confounding and suppression effect. Prev. Sci. Off. J. Soc. Prev. Res. 2001, 1, 173–181. [Google Scholar] [CrossRef]
  52. Yin, C.; Luo, M.; Meng, F.; Sa, C.; Yuan, Z.; Bao, Y. Contributions of Climatic and Anthropogenic Drivers to Net Primary Productivity of Vegetation in the Mongolian Plateau. Remote Sens. 2022, 14, 3383. [Google Scholar] [CrossRef]
  53. Zhang, Y.; Wang, Q.; Wang, Z.; Yang, Y.; Li, J. Impact of human activities and climate change on the grassland dynamics under different regime policies in the Mongolian Plateau. Sci. Total Environ. 2020, 698, 134304. [Google Scholar] [CrossRef] [PubMed]
  54. Miao, L.; Sun, Z.; Ren, Y.; Schierhorn, F.; Müller, D. Grassland greening on the Mongolian Plateau despite higher grazing intensity. Land Degrad. Dev. 2020, 32, 792–802. [Google Scholar] [CrossRef]
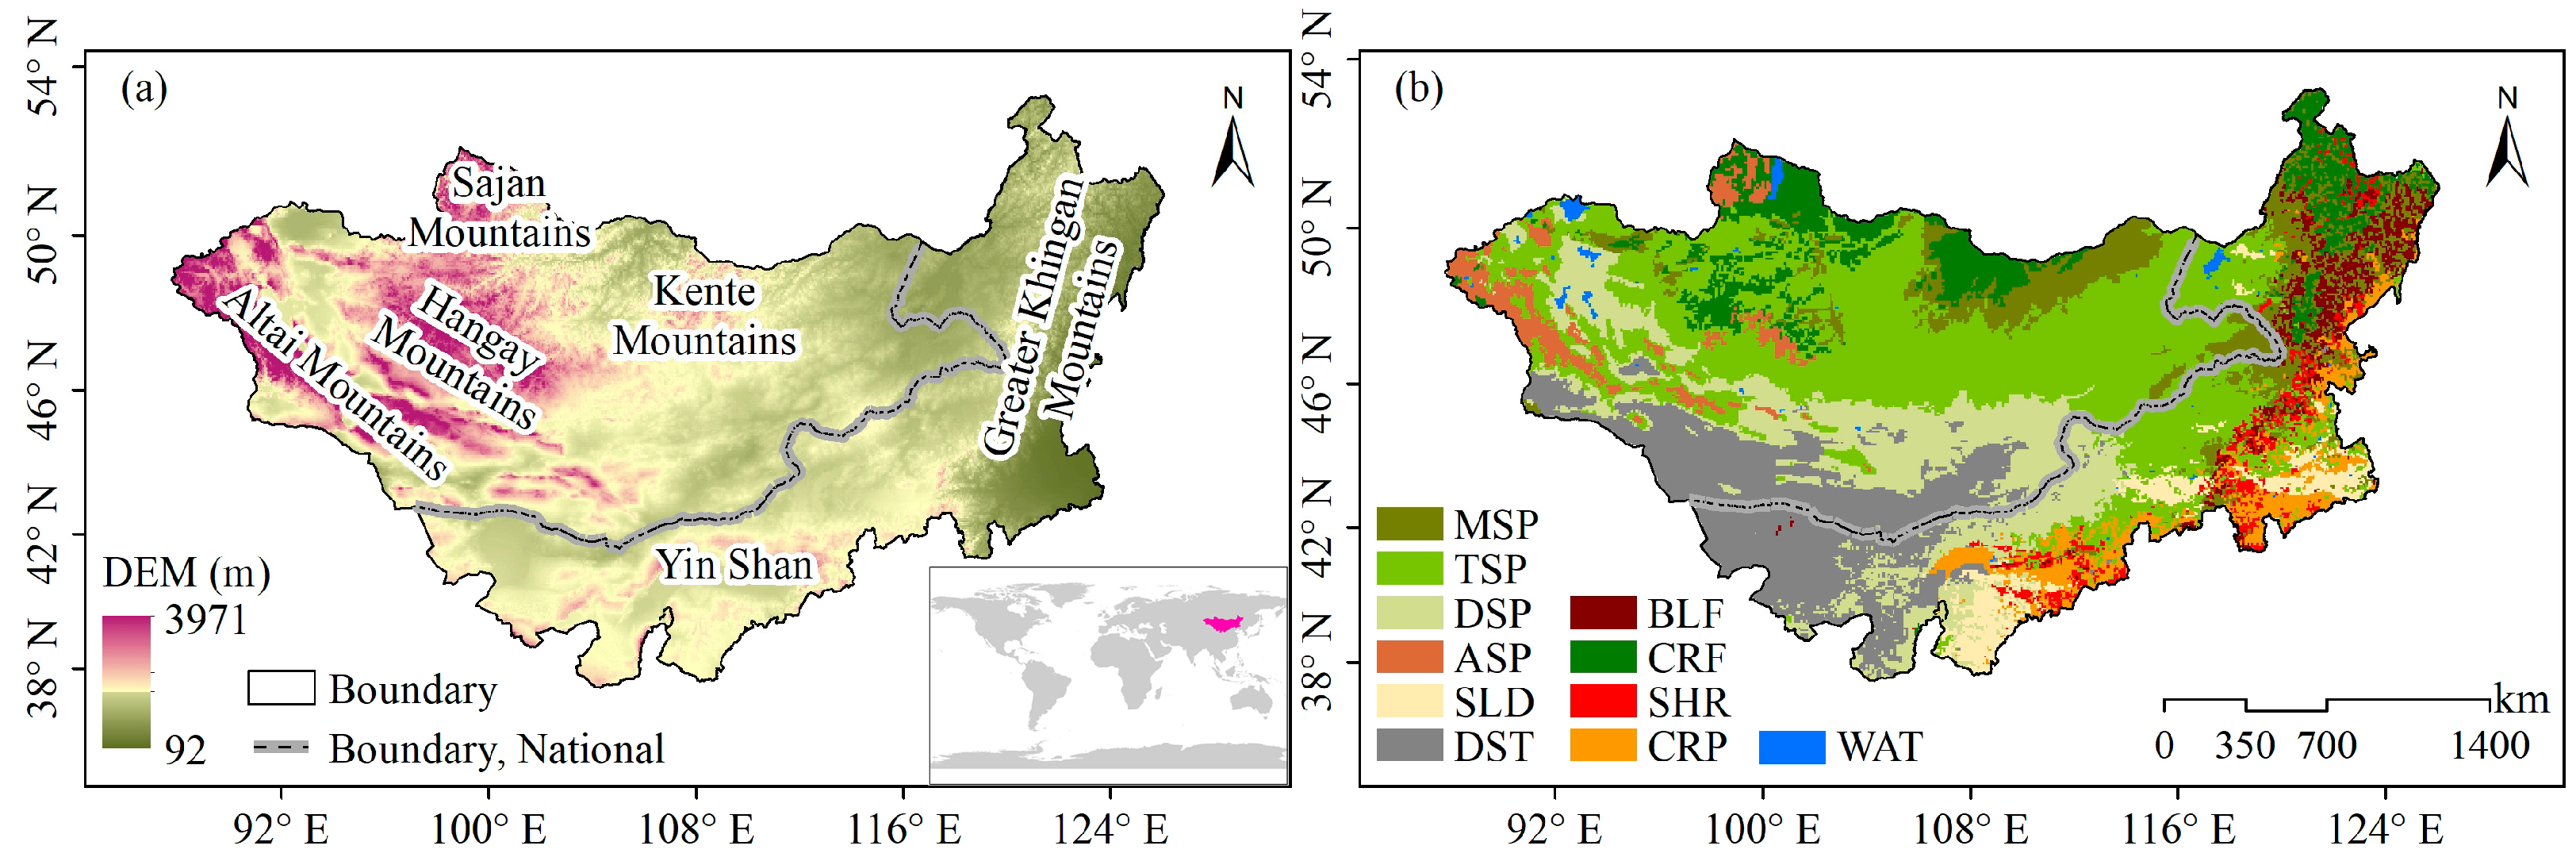
Figure 1. The MP’s topographic map (a) and the distribution of surface cover type (b). Note: MSP (meadow steppe), TSP (typical steppe), DSP (desert steppe), ASP (alpine steppe), SLD (sandy land), DST (desert), BLF (broad-leaved forest), CRF (coniferous forest), SHR (shrub), CRP (cropland), and WAT (water body).
Remotesensing 15 01986 g001
Figure 2. Conceptual structural equation mode. Note: Arrows between variables to NPP identified the cause and effect relations. Note: precipitation (PRE), temperature (TEMP), soil moisture (SM), and solar radiation (SR).
Remotesensing 15 01986 g002
Figure 3. Comparison between the simulated NPP using the CASA model and MODIS NPP.
Remotesensing 15 01986 g003
Figure 4. Spatial distribution (a) and the average value of different vegetation types (b) of NPP during the growing seasons from 2000 to 2019 in the MP.
Remotesensing 15 01986 g004
Figure 5. The temporal variations of the MP’s NPP (a) for different vegetation (b) from 2000 to 2019 during the growing seasons (The * mark on the graph represents p < 0.05).
Remotesensing 15 01986 g005
Figure 6. The spatial distribution of NPP’s changing trend during the growing seasons from 2000 to 2019 in the MP ((a) NPP’s spatial change rate; (b) the classification of the significance of the changing trend).
Remotesensing 15 01986 g006
Figure 7. The q-statistics of driving factors influencing NPP’s spatial pattern in the MP.
Remotesensing 15 01986 g007
Figure 8. Explanatory power of the interaction of various factors influencing NPP’s spatial pattern in the MP (The * mark on the graph represents non-linear enhancement; unmarked indicates bivariate enhancements).
Remotesensing 15 01986 g008
Figure 9. Spatial variations of NDVI (a); SR (b); TEMP (c); PRE (d); and SM (e) during the growing seasons from 2000 to 2019 in the MP.
Remotesensing 15 01986 g009
Figure 10. The established SEM for NPP in the MP (a) and different vegetation types ((b): MSP; (c): TSP; (d): DSP; (e): ASP; (f): CRF; (g): BLF; (h): SLD; (i): SHR; (j): CRP). Note: The thickness of the arrows was proportional to the standardized path coefficients shown on each arrow. Blue lines represent positive effects; red lines represent negative effects; solid lines represent significant paths (p < 0.05); dotted lines represent insignificant paths.
Remotesensing 15 01986 g010
Table 1. List of datasets used for this study.
DataTemporal ResolutionSpatial ResolutionPeriodDataset NameSource
Elevation, slope, and aspect-30 m × 30 m-ASTER GDEMhttp://Ipdaac.usgs.gov/products/ (accessed on 8 August 2022)
NDVI16-day500 m × 500 m2000–2019MOD13A1https://lpdaacsvc.cr.usgs.gov/appeears/ (accessed on 8 August 2022)
NPPyearly500 m × 500 m2000–2019MOD17A2https://lpdaacsvc.cr.usgs.gov/appeears/ (accessed on 8 August 2022)
Temperature, precipitation, and soil moisturedaily0.1° × 0.1°2000–2019ERA5-landhttps://cds.climate.copernicus.eu/cdsapp#!/search?Type=dataset (accessed on 8 August 2022)
Solar radiationdaily0.05° × 0.05°2000–2019BESShttps://www.environment.snu.ac.kr/bess-rad (accessed on 8 August 2022)
Vegetation type-500 m × 500 m2009Vegetation typeNational Atlas of Mongolia and 1:1,000,000 Inner Mongolia vegetation map [17] (accessed on 8 August 2022)
Soil type-1 km-FAO-HWSDhttp://www.fao.org/soils-portal/soil-survey/soil-maps-and-databases/harmonized-world-soil-database-v12/en/ (accessed on 8 August 2022)
Table 2. The direct, indirect, and total effects of PRE, SR, TEMP, NDVI, and SM on NPP variations in the MP based on the SEM.
PathwayMPMSPTSPDSPASPCRFBLFSLDSHRCRP
PREPRE → NPP0.11 **−0.20 **0.37 **0.33 **−0.12 **−0.01−0.32 **0.19 **−0.040.41 **
PRE → NDVI → NPP0.09 **0.010.06 **−0.010.24 **0.02 **−0.03 **0.15 **0.28 **−0.31 **
PRE → SM → NPP0.08 **0.22 **0.02 **−0.11 **0.23 **0.13 **0.22 **0.16 **0.17 **0.00
PRE → SM → NDVI → NPP0.05 **0.05 **0.05 **−0.08 **0.14 **0.19 **0.08 **0.07 **−0.08 *0.33 **
Total0.33 **0.08 **0.50 **0.13 **0.49 **0.33 **−0.050.57 **0.33 **0.43 **
SRSR → NPP−0.03 **−0.04 **−0.03 **−0.05 **−0.08 **0.07 **0.15 **0.05 **0.11 **0.10 **
SR → NDVI → NPP0.04 **−0.02 **0.02 **−0.11 **0.09 **−0.02 **−0.03 **0.04 **0.30 **0.19 **
SR → SM → NPP0.01 **0.02 **0.000.000.06 **0.03 **0.07 **0.00−0.01 **0.00
SR → SM → NDVI → NPP0.00 **0.000.000.000.02 **0.03 **0.02 **0.000.01 *0.01 **
Total0.02 **−0.04 **−0.01−0.16 **0.09 **0.11 **0.21 **0.09 **0.41 **0.30 **
TEMPTEMP → NPP−0.19 **−0.30 **−0.14 **−0.02 **0.17 **0.01−0.09 **0.15 **0.10 **0.16 **
TEMP → NDVI → NPP0.08 **0.04 **0.08 **0.04 **−0.010.08 **0.05 **0.000.10 **−0.15 **
TEMP → SM → NPP−0.02 **−0.02 **−0.01 **0.05 **−0.04 **−0.03 **−0.05 **−0.10 **−0.06 **0.00
TEMP → SM → NDVI → NPP−0.01 **0.00−0.01 **0.02 **−0.02 **−0.03 **−0.01 **−0.03 **0.02 *−0.10 **
Total−0.14 **−0.28 **−0.08 **0.09 **0.10 **0.03 *−0.10 **0.020.16 **−0.09 **
NDVINDVI → NPP0.47 **0.21 **0.38 **0.54 **0.61 **0.50 **0.25 **0.64 **0.74 **0.69 **
SMSM → NPP0.11 **0.28 **0.04 **−0.22 **0.36 **0.18 **0.32 **0.27 **0.24 **0.00
SM → NDVI → NPP0.05 **0.05 **0.05 **−0.08 **0.14 **0.19 **0.08 **0.07 **−0.08 *0.33 **
Total0.16 **0.33 **0.09 **−0.30 **0.50 **0.37 **0.40 **0.34 **0.16 **0.33 **
Note: Significant effects are at p < 0.05 (*) and p < 0.001 (**).
Disclaimer/Publisher’s Note: The statements, opinions and data contained in all publications are solely those of the individual author(s) and contributor(s) and not of MDPI and/or the editor(s). MDPI and/or the editor(s) disclaim responsibility for any injury to people or property resulting from any ideas, methods, instructions or products referred to in the content.