


Terrestrial Laser Scanning for Non-Destructive Estimation of Aboveground Biomass in Short-Rotation Poplar Coppices


Abstract
1. Introduction
2. Materials and Methods
2.1. Experimental Sites
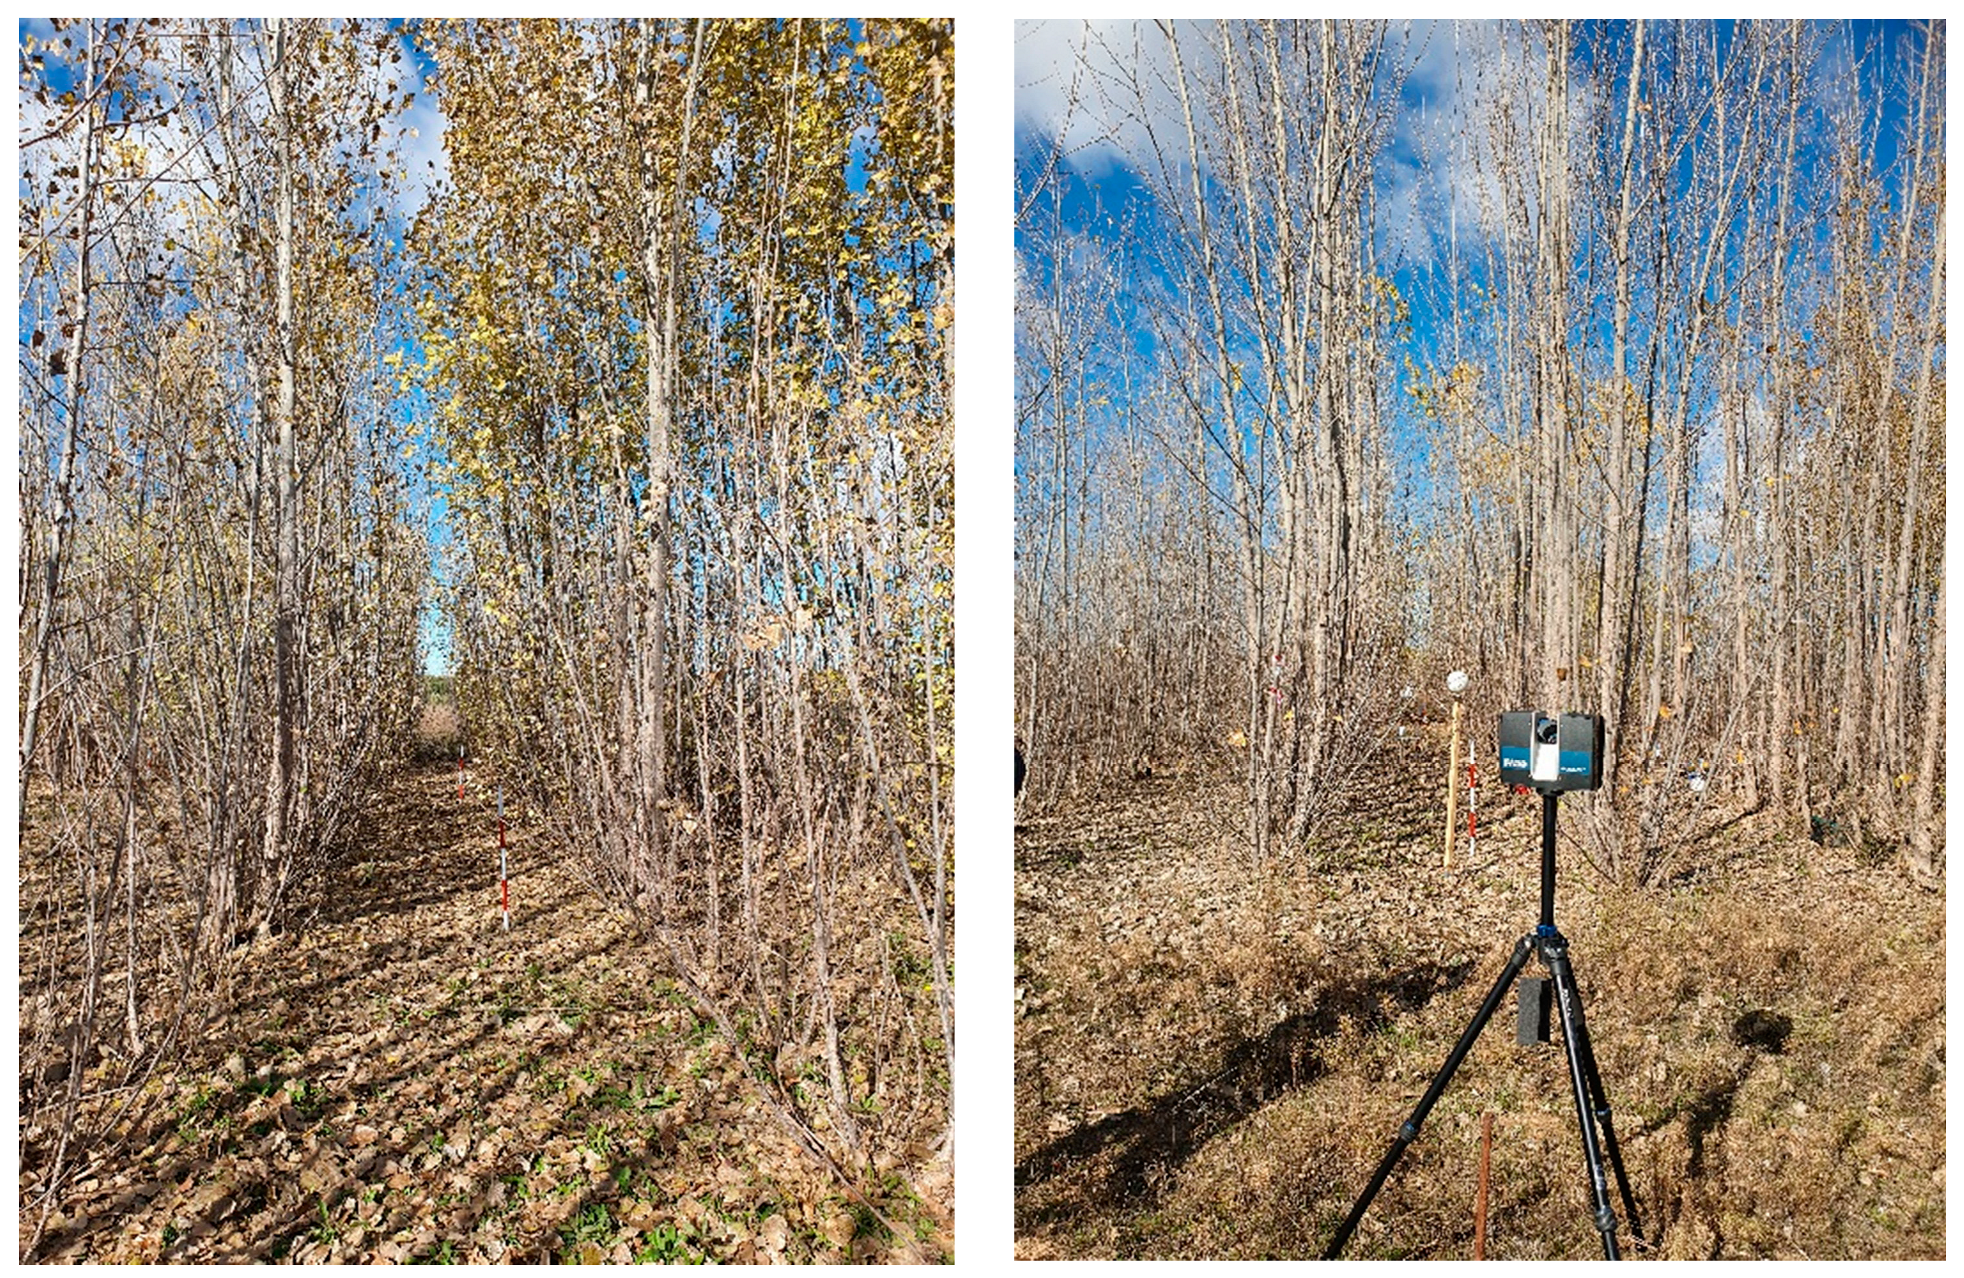
2.2. Laser Scanning
2.3. Field Measurements, Destructive Measurements, and Biomass Estimation
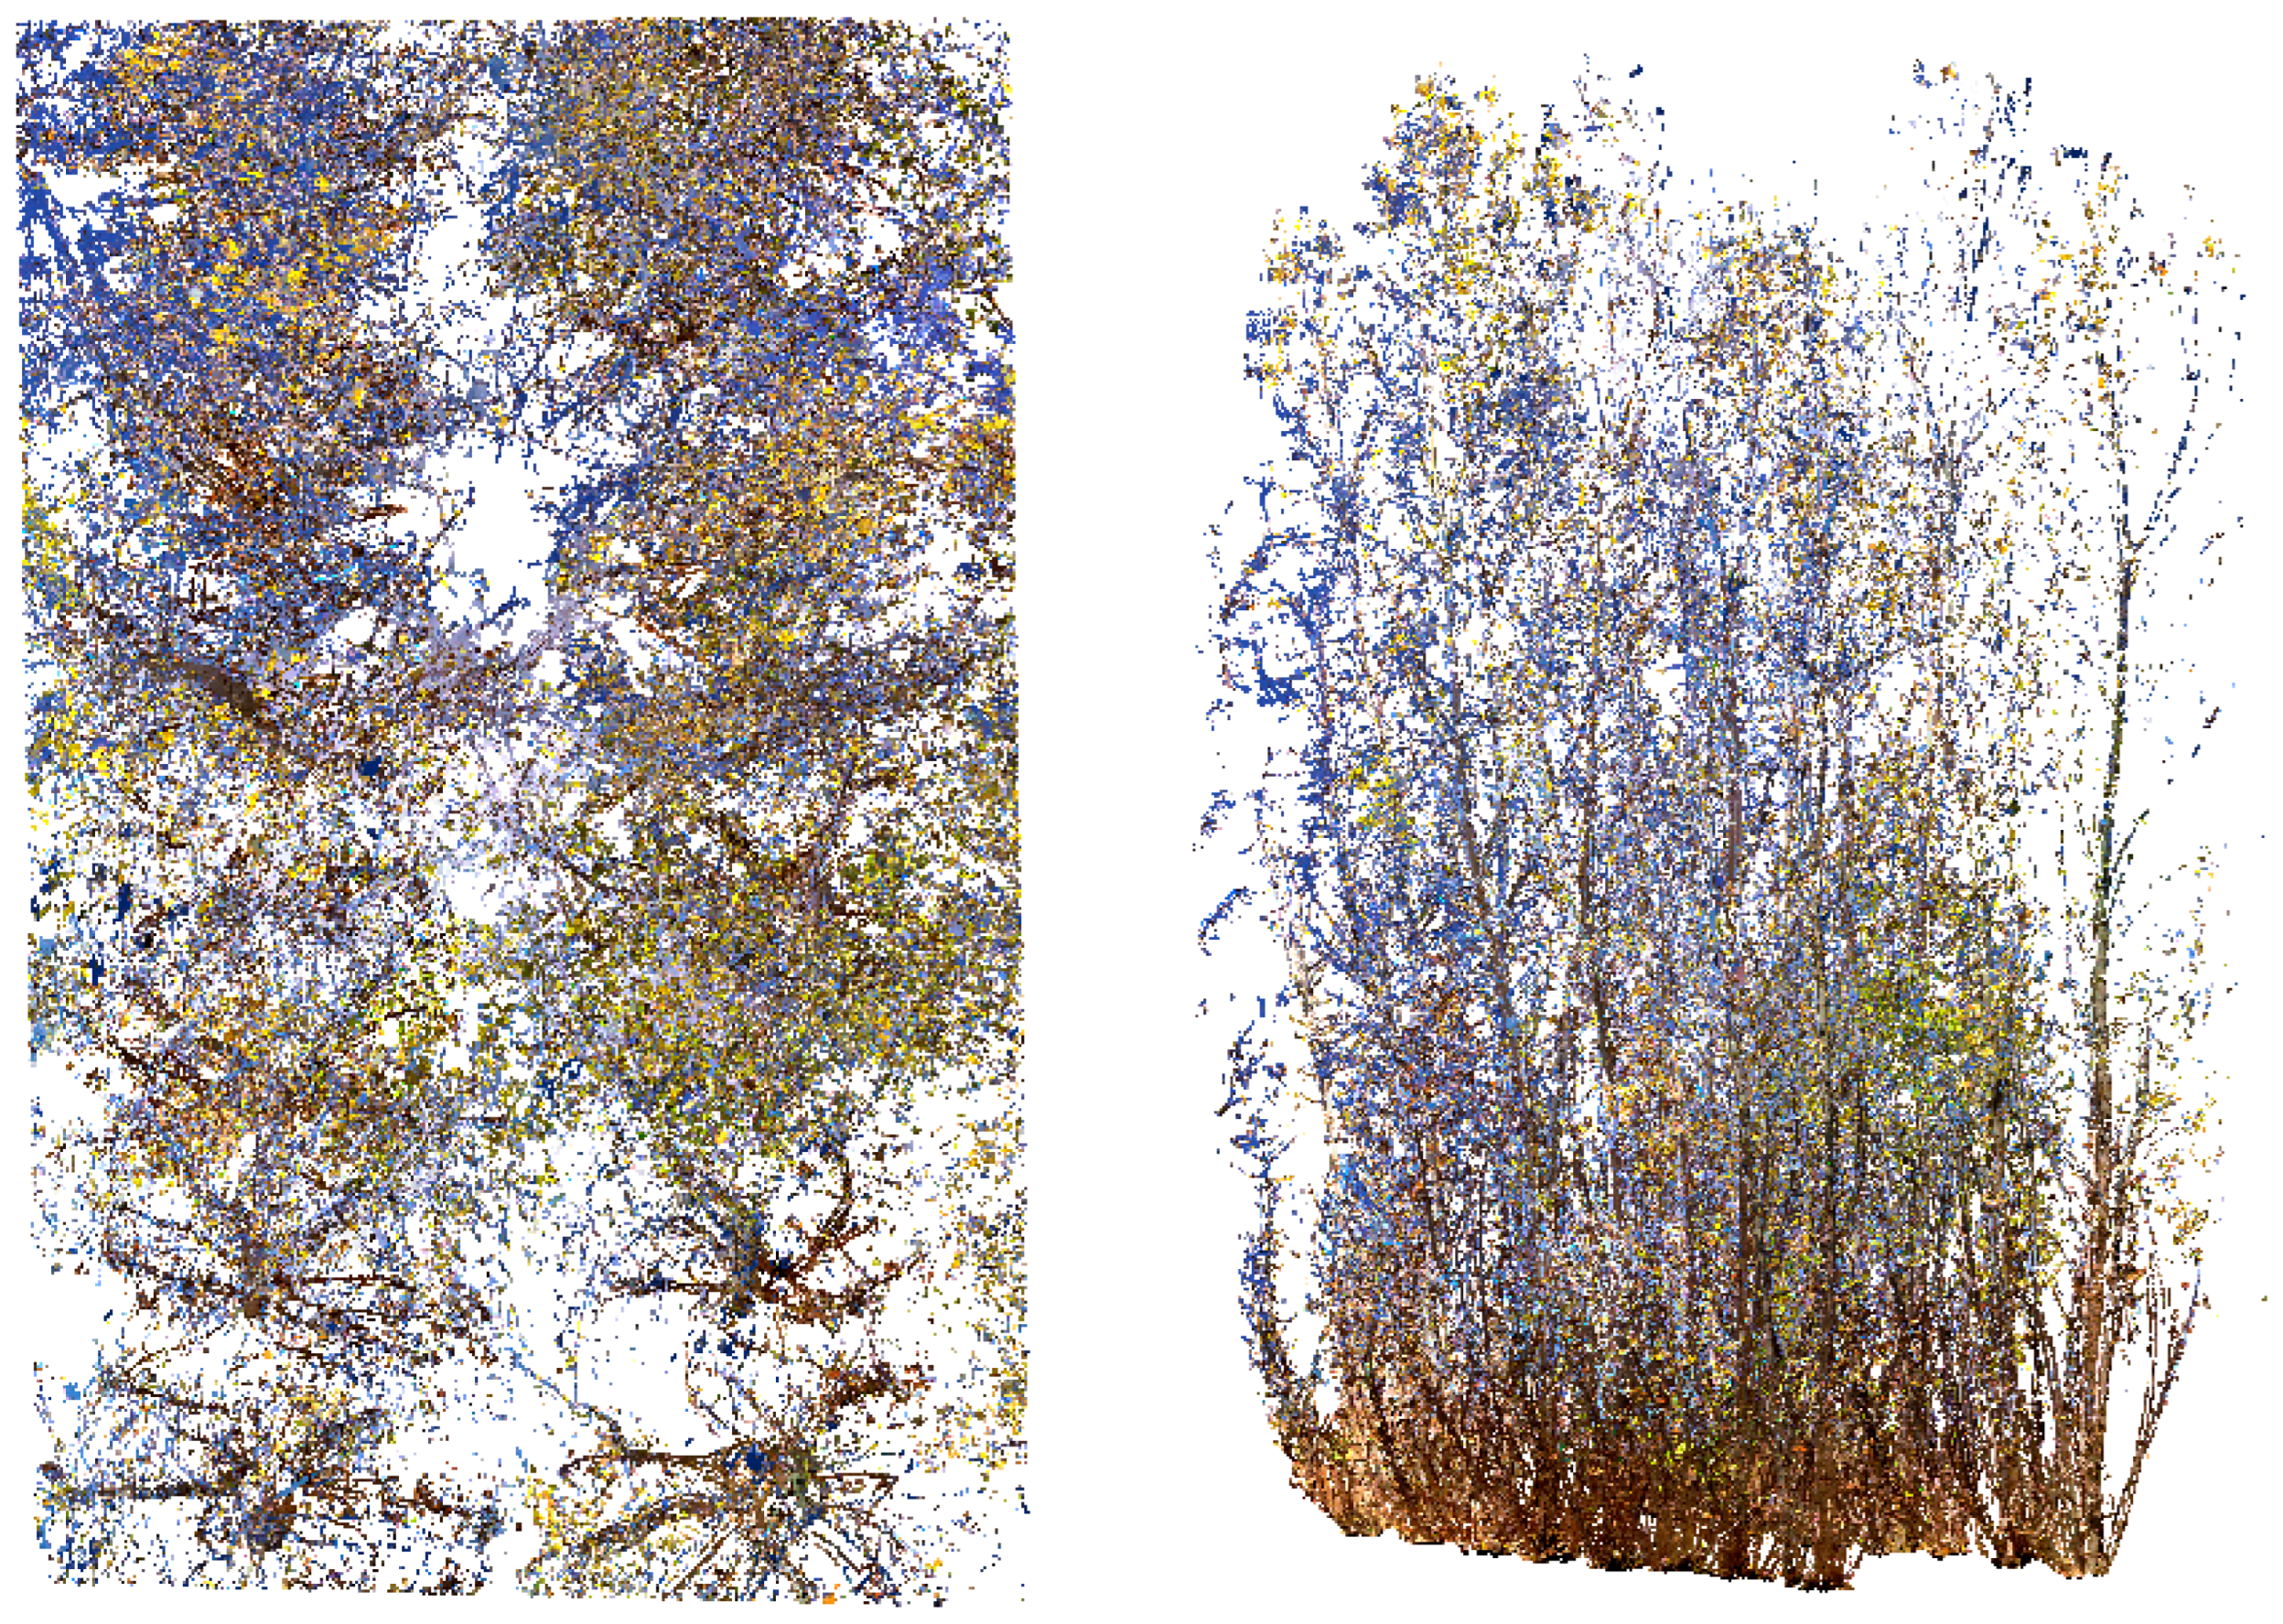
2.4. Point Cloud Processing
2.5. Analysis at Stool Level
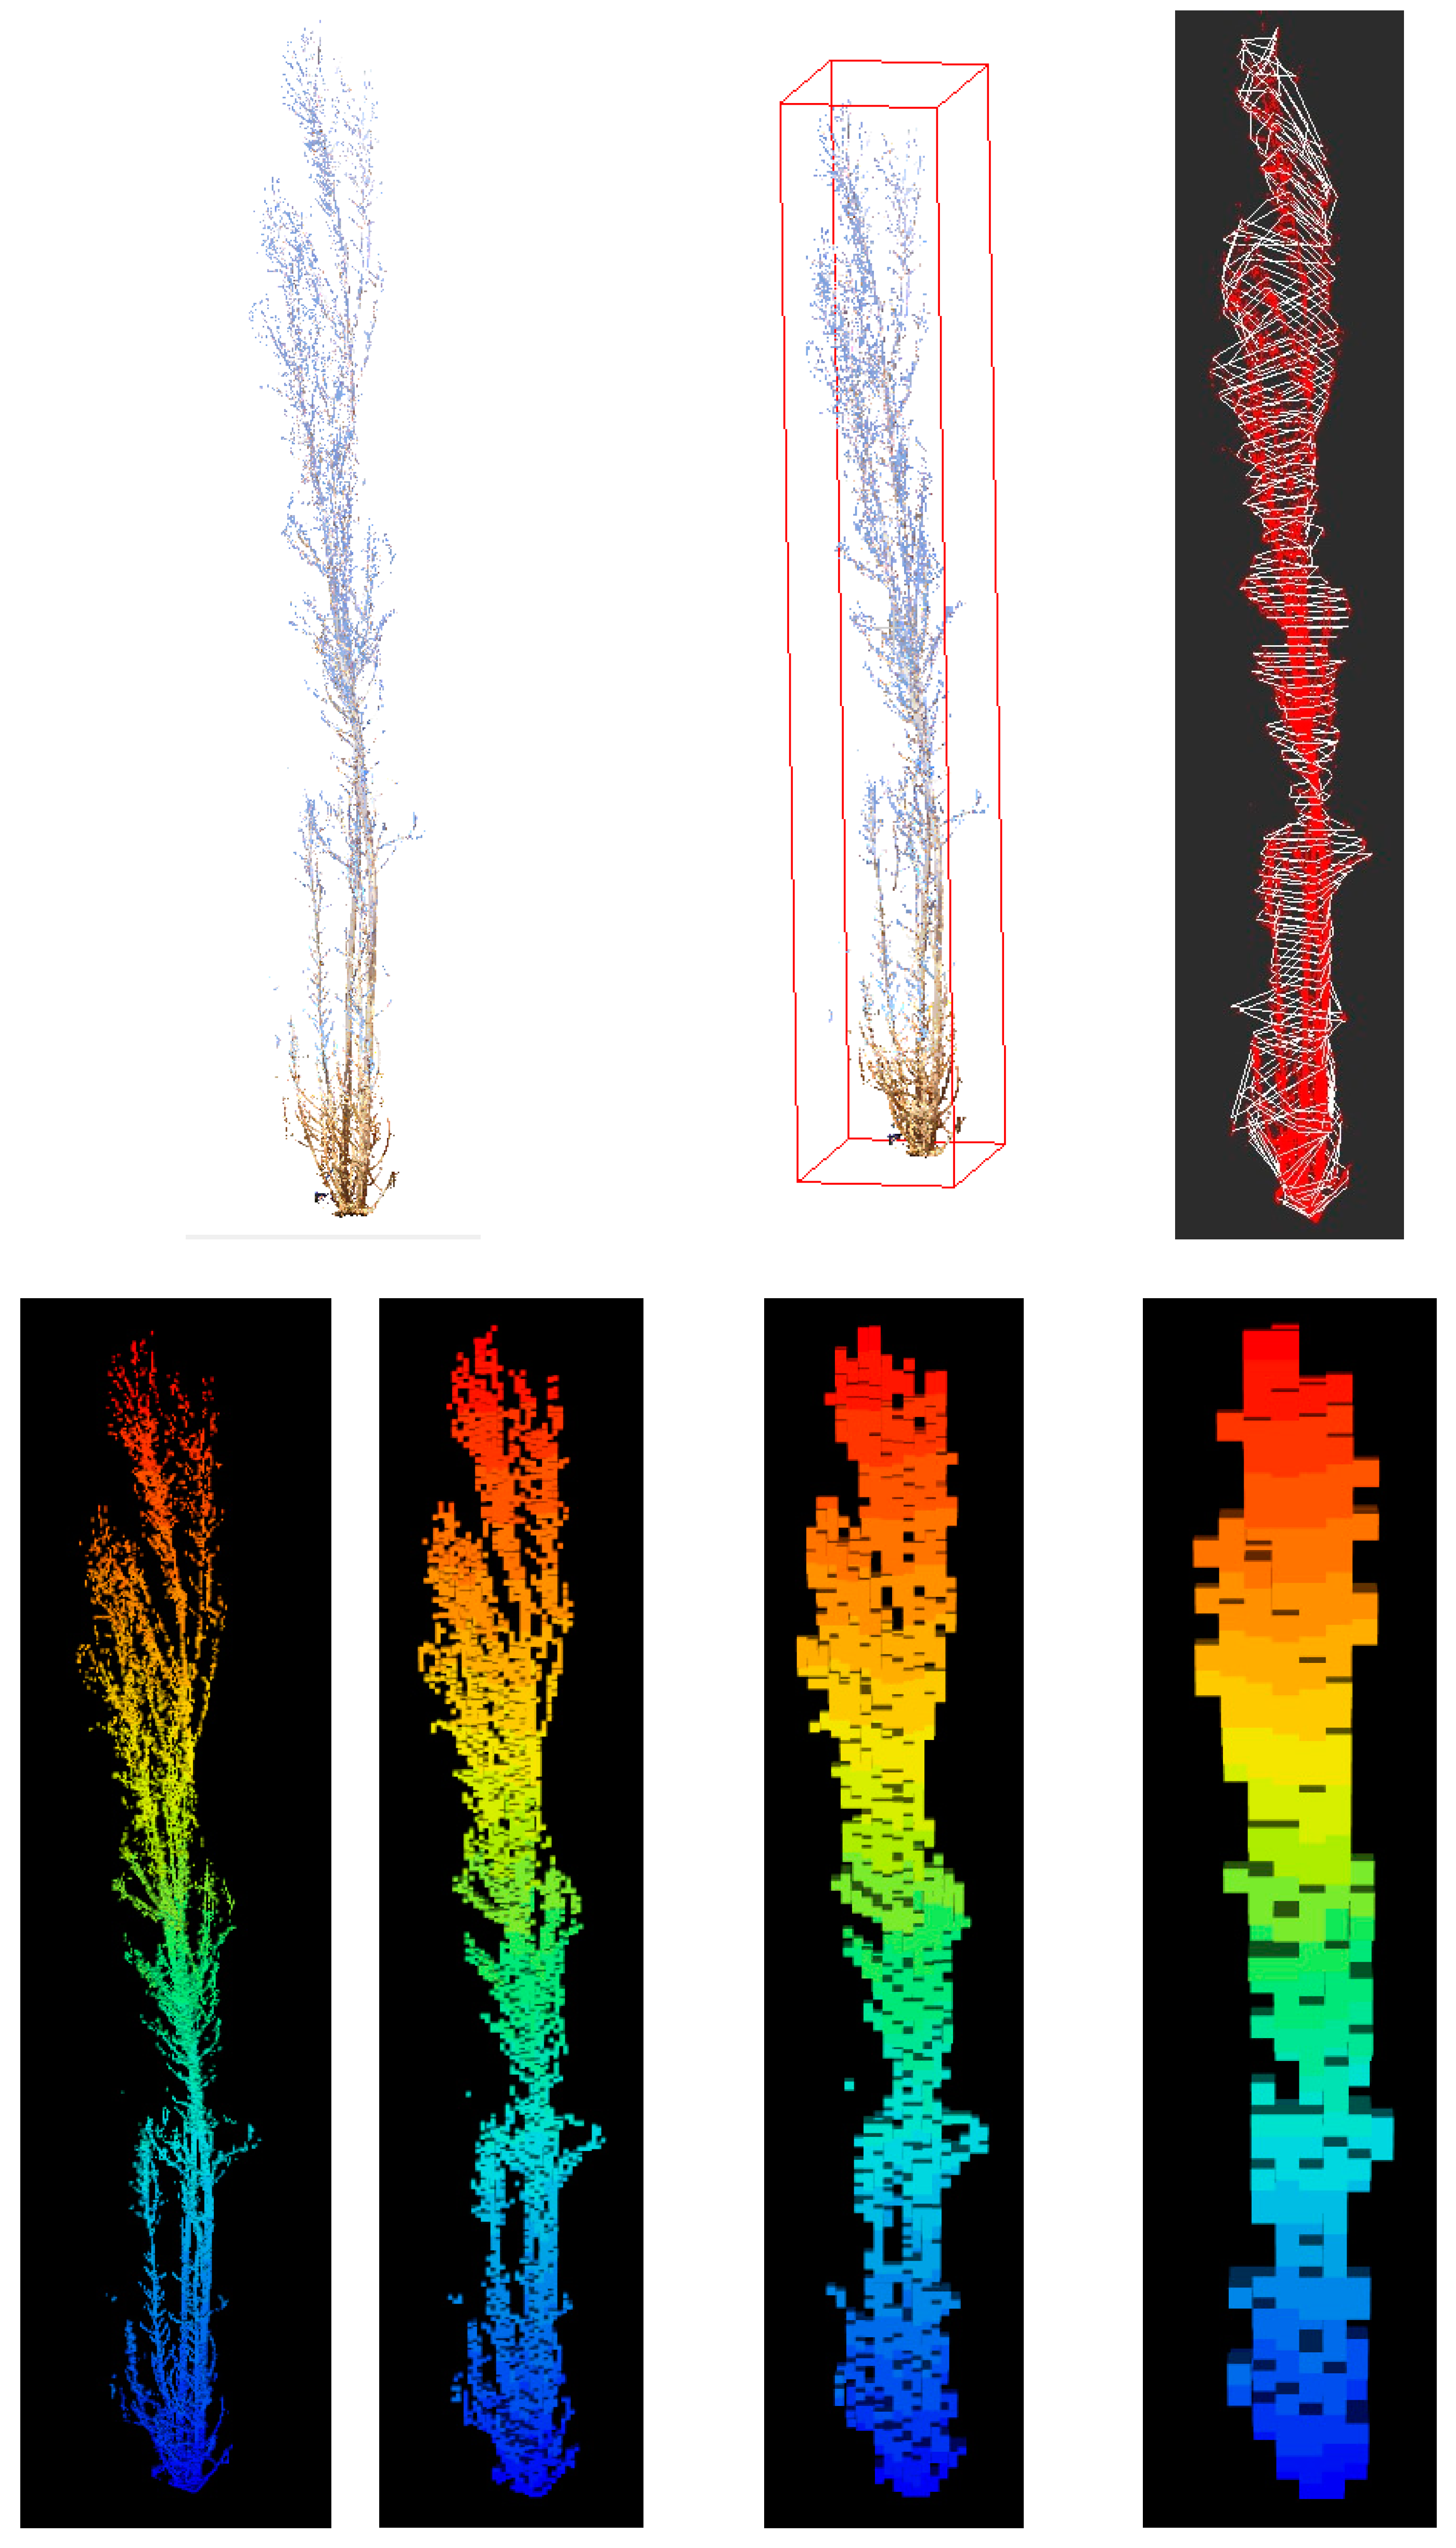
2.5.1. Stool Segmentation
2.5.2. Stool Volume Computation
- Bounding box assignment. Bounding box volume was estimated as the volume of the smallest box that encompassed the entire tree point cloud. The dimensions of the bounding box can be found by calculating the difference between the maximum and minimum coordinates on each axis. This is performed automatically in CloudCompare (CloudCompare v2.1), so we used the box dimensions reported for the individual stool point cloud. This is an application of the study by [59], who developed methods to use bounding box volume as a predictor for peatland shrub aboveground biomass.
- Individual stool slicing. The stool was divided into slices of 10 cm in height using CompuTree software (Version 5.0, Computree Group, 2017). In a first step, we defined a horizontal plane with this algorithm by selecting the lowest point of the stool. From this value, all points within a slice of 2 cm in height were selected and considered to be in the same plane by ignoring their Z coordinate. The Delaunay triangulation was then applied to the points considered in the same horizontal plane, and the area of the section was calculated. This step was repeated for every 10 cm of stool height. The volume of each slice from consecutive sections was calculated by:where S1 and S2 are the areas of the consecutive sections, and h is the separation between sections (10 cm). The total volume of the stool is the sum of all the single volumes between two sections. Stool height is computed as the difference between the height of the upper slice and the height of the stool slice. We also considered the area of the maximum section generated, the areas of both the stump (0.10 cm) and breast height (1.30 m) sections, the volume of these sections, and combinations among them as relevant variables.
- Rasterization in voxels (voxelization). According to [60], a volumetric pixel, also known as a voxel, is the minimum discrete volume that can be processed in a tridimensional object. The basis of this method is the organization of the point cloud on a tridimensional regular grid where each cell with at least one point inside is a voxel. We tested four different grids depending on the size of the voxels (2 cm, 5 cm, 10 cm, and 25 cm) using the R package “lidR” (Version 4.0.1, available online at: https://cran.r-project.org/web/packages/lidR/index.html, accessed on 13 January 2023). Once the stool had been voxelized, we needed to approximate the occupancy of the space by classifying each voxel as empty/not empty based on the number of returns within each voxel. In order to consider the potential impact of the distance from the stool to the TLS, or the different number of return points within each voxel due to occlusions or shadowing [61,62,63,64], we proposed two alternatives. In the first, we estimated the median number of returns per voxel for each stool, and for occupations equal to or greater than that value, the voxel was considered full, otherwise it was considered empty. This approach was compared with an alternative that considers as full those voxels including at least one return. For either approach, if the voxel was considered full, then its volume was also considered in the quantification. The total volume was obtained by multiplying the number of full voxels by the volume of a voxel (8 cm3, 125 cm3, 1000 cm3, or 15,625 cm3).
2.6. Exploratory Analysis
- Individual stool dry biomass (w_st);
- Stool_height (h_st);
- Diameter at breast height of the largest shoot within the stool (d_st);
- Number of shoots in the stool with breast height diameter > 2 cm (N_shoot).
- Total plot dry biomass (W_tot)—computed as the sum of the biomass of each individual stool;
- Mean height (hm)—the mean height of the different stools in the plot;
- Basal area (BA)—defined as the sum of the sections measured at breast height diameter in the largest shoot of the stool;
- Total number of shoots in the plot (N_shoot_tot)—the sum of N_shoot for all the stools in the plot.
2.7. Modeling Approach
3. Results
3.1. Correlation Analysis
3.2. Modeling Approach
3.2.1. Models for Individual Stool Biomass
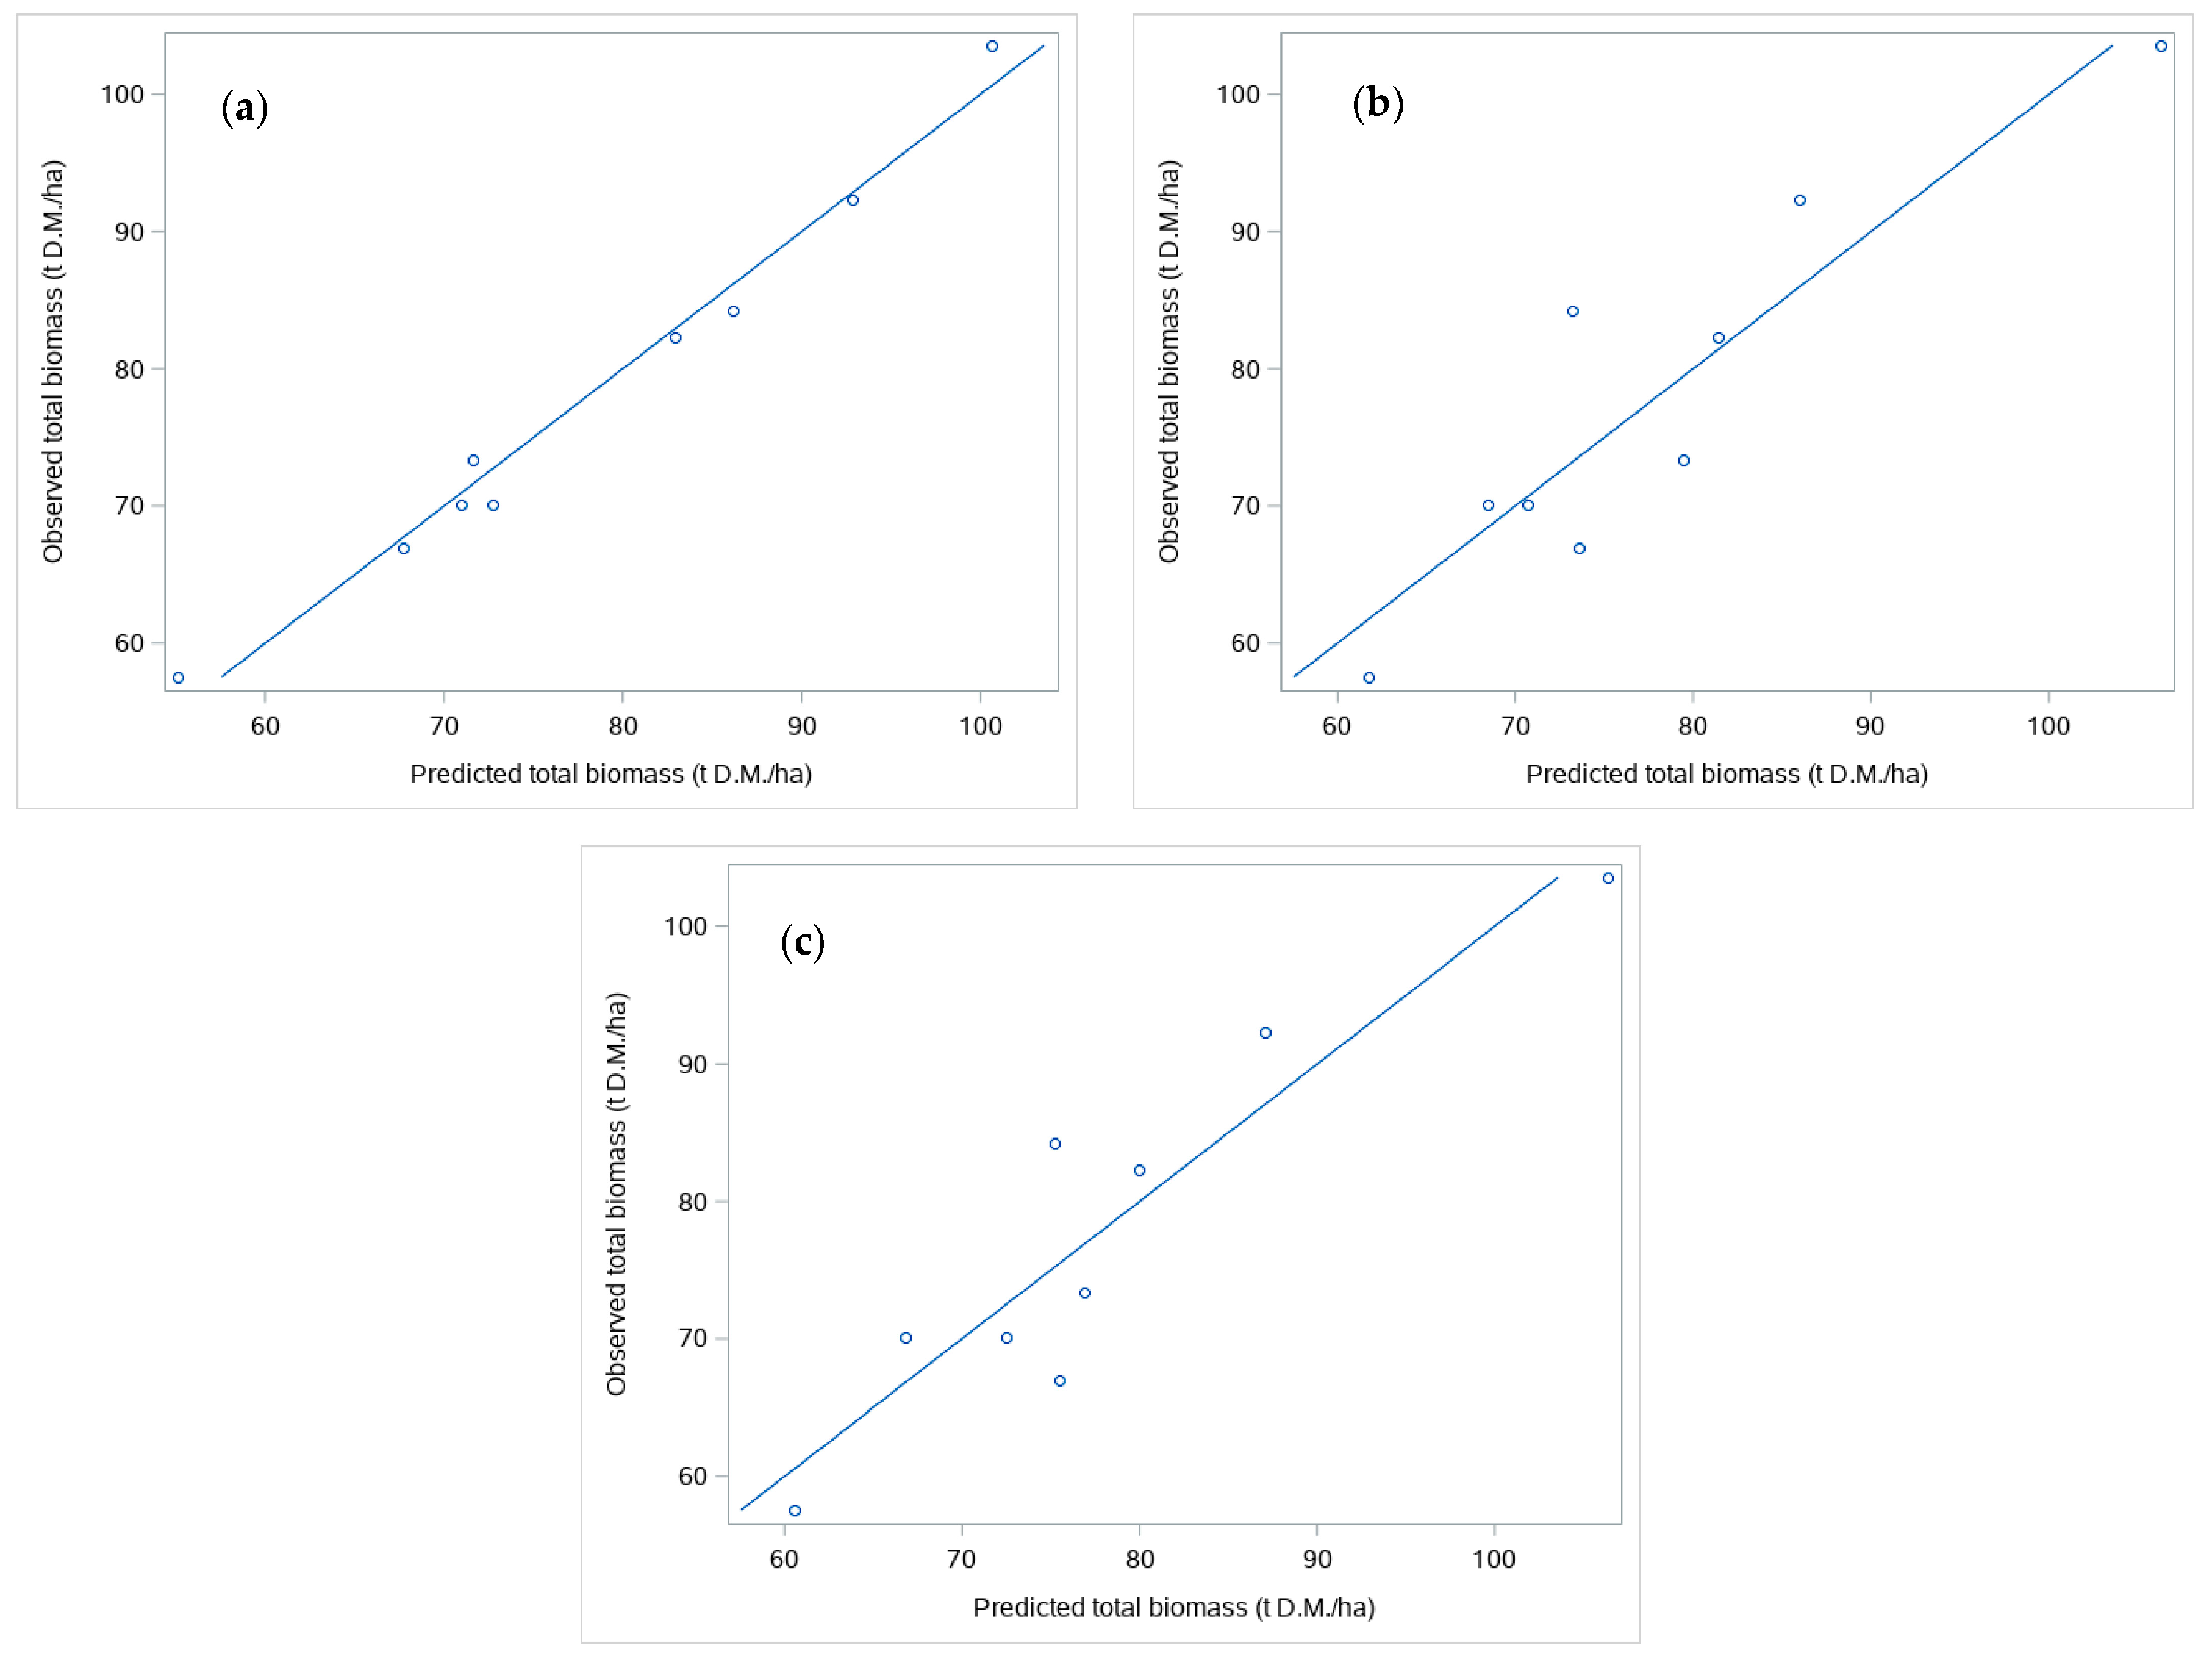
3.2.2. Models for Total Biomass
4. Discussion
4.1. Individual Correlations
4.2. Modeling Approach
4.3. Final Remarks
Author Contributions
Funding
Data Availability Statement
Acknowledgments
Conflicts of Interest
References
- Bioplat Manual Sobre Biorrefinerías En España; Ministerio de Economía Industria y Competividad: Madrid, Spain, 2017; pp. 1–92.
- Bastin, J.-F.; Finegold, Y.; Garcia, C.; Mollicone, D.; Rezende, M.; Routh, D.; Zohner, C.M.; Crowther, T.W. Comment on “The Global Tree Restoration Potential. Science 2019, 365, 76–79. [Google Scholar] [CrossRef]
- Djomo, S.N.; El Kasmioui, O.; Ceulemans, R.J. Energy and greenhouse gas balance of bioenergy production from poplar and willow: A review. GCB Bioenergy 2011, 3, 181–197. [Google Scholar] [CrossRef]
- Corona, P.; Chianucci, F.; Marcelli, A.; Gianelle, D.; Fattorini, L.; Grotti, M.; Puletti, N.; Mattioli, W. Probabilistic sampling and estimation for large-scale assessment of poplar plantations in Northern Italy. Eur. J. For. Res. 2020, 139, 981–988. [Google Scholar] [CrossRef]
- Oliveira, N.; Pérez-Cruzado, C.; Cañellas, I.; Rodríguez-Soalleiro, R.; Sixto, H. Poplar Short Rotation Coppice Plantations under Mediterranean Conditions: The Case of Spain. Forests 2020, 11, 1352. [Google Scholar] [CrossRef]
- Stanturf, J.A.; Perdue, J.H.; Young, T.M.; Huang, X.; Guo, Z.; Dougherty, D.; Pigott, M. A spatially explicit approach to modeling biological productivity and economic attractiveness of short-rotation woody crops in the eastern USA. Energy Sustain. Soc. 2019, 9, 28. [Google Scholar] [CrossRef]
- Ruiz-Peinado, R.; Montero, G.; Cañellas, I. Growth and Yield Models for Pinus Halepensis Mill. Investig. For. Syst. 2001, 10, 179–201. [Google Scholar] [CrossRef]
- Verwijst, T.; Lndkvist, A.; Edelfeldt, S.; Albertsson, J. Development of Sustainable Willow Short Rotation Forestry in Northern Europe. In Biomass NOw-Sustainable Growth and Use; Matovic, D.M.D., Ed.; IntechOpen: London, UK, 2013; pp. 479–502. ISBN 0000957720. [Google Scholar]
- Verlinden, M.S.; Broeckx, L.S.; Ceulemans, R. First vs. second rotation of a poplar short rotation coppice: Above-ground biomass productivity and shoot dynamics. Biomass Bioenergy 2015, 73, 174–185. [Google Scholar] [CrossRef]
- Al Afas, N.; Marron, N.; Van Dongen, S.; Laureysens, I.; Ceulemans, R. Dynamics of biomass production in a poplar coppice culture over three rotations (11 years). For. Ecol. Manag. 2008, 255, 1883–1891. [Google Scholar] [CrossRef]
- Vanbeveren, S.P.; Ceulemans, R. Genotypic differences in biomass production during three rotations of short-rotation coppice. Biomass Bioenergy 2018, 119, 198–205. [Google Scholar] [CrossRef]
- Zianis, D.; Muukkonen, P.; Mäkipää, R.; Mencuccini, M. Biomass and Stem Volume Equations for Tree Species in Europe; Finnish Society of Forest Science, Finnish Forest Research Institute: Helsinki, Finland, 2005; Volume 4, ISBN 9514019830. [Google Scholar]
- Zabek, L.M.; Prescott, C.E. Biomass equations and carbon content of aboveground leafless biomass of hybrid poplar in Coastal British Columbia. For. Ecol. Manag. 2006, 223, 291–302. [Google Scholar] [CrossRef]
- Huber, J.A.; May, K.; Hülsbergen, K.-J. Allometric tree biomass models of various species grown in short-rotation agroforestry systems. Eur. J. For. Res. 2017, 136, 75–89. [Google Scholar] [CrossRef]
- Oliveira, N.; Rodríguez-Soalleiro, R.; Hernández, M.J.; Cañellas, I.; Sixto, H.; Pérez-Cruzado, C. Improving biomass estimation in a Populus short rotation coppice plantation. For. Ecol. Manag. 2017, 391, 194–206. [Google Scholar] [CrossRef]
- Benetka, V.; Novotná, K.; Štochlová, P. Biomass production of Populus nigra L. clones grown in short rotation coppice systems in three different environments over four rotations. iForest-Biogeosci. For. 2014, 7, 233–239. [Google Scholar] [CrossRef]
- Sixto, H.; Cañellas, I.; van Arendonk, J.; Ciria, P.; Camps, F.; Sánchez, M.; Sánchez-González, M. Growth potential of different species and genotypes for biomass production in short rotation in Mediterranean environments. For. Ecol. Manag. 2015, 354, 291–299. [Google Scholar] [CrossRef]
- Verwijst, T.; Telenius, B. Biomass estimation procedures in short rotation forestry. For. Ecol. Manag. 1999, 121, 137–146. [Google Scholar] [CrossRef]
- Mosseler, A.; Major, J.E.; Labrecque, M.; Larocque, G.R. Allometric relationships in coppice biomass production for two North American willows (Salix spp.) across three different sites. For. Ecol. Manag. 2014, 320, 190–196. [Google Scholar] [CrossRef]
- Ketterings, Q.M.; Coe, R.; van Noordwijk, M.; Ambagau’, Y.; Palm, C.A. Reducing uncertainty in the use of allometric biomass equations for predicting above-ground tree biomass in mixed secondary forests. For. Ecol. Manag. 2001, 146, 199–209. [Google Scholar] [CrossRef]
- Ben Brahim, M.; Gavaland, A.; Cabanettes, A. Generalized Allometric Regression to Estimate Biomass of Populus in Short-rotation Coppice. Scand. J. For. Res. 2000, 15, 171–176. [Google Scholar] [CrossRef]
- Dillen, S.Y.; Marron, N.; Bastien, C.; Ricciotti, L.; Salani, F.; Sabatti, M.; Pinel, M.P.C.; Rae, A.M.; Taylor, G.; Ceulemans, R. Effects of environment and progeny on biomass estimations of five hybrid poplar families grown at three contrasting sites across Europe. For. Ecol. Manag. 2007, 252, 12–23. [Google Scholar] [CrossRef]
- Oliveira, N.; Sixto, H.; Cañellas, I.; Rodríguez-Soalleiro, R.; Pérez-Cruzado, C. Productivity model and reference diagram for short rotation biomass crops of poplar grown in Mediterranean environments. Biomass Bioenergy 2015, 72, 309–320. [Google Scholar] [CrossRef]
- Oliveira, N.; Rodríguez-Soalleiro, R.; Pérez-Cruzado, C.; Cañellas, I.; Sixto, H. On the Genetic Affinity of Individual Tree Biomass Allometry in Poplar Short Rotation Coppice. BioEnergy Res. 2017, 10, 525–535. [Google Scholar] [CrossRef]
- Dickmann, D.I. Silviculture and biology of short-rotation woody crops in temperate regions: Then and now. Biomass Bioenergy 2006, 30, 696–705. [Google Scholar] [CrossRef]
- Tallis, M.J.; Casella, E.; Henshall, P.A.; Aylott, M.J.; Randle, T.J.; Morison, J.I.L.; Taylor, G. Development and evaluation of ForestGrowth-SRC a process-based model for short rotation coppice yield and spatial supply reveals poplar uses water more efficiently than willow. GCB Bioenergy 2013, 5, 53–66. [Google Scholar] [CrossRef]
- Ruiz-Peinado, R.; Del Rio, M.; Montero, G. New models for estimating the carbon sink capacity of Spanish softwood species. For. Syst. 2011, 20, 176–188. [Google Scholar] [CrossRef]
- Gertrudix, R.R.-P.; Montero, G.; del Rio, M. Biomass models to estimate carbon stocks for hardwood tree species. For. Syst. 2012, 21, 42–52. [Google Scholar] [CrossRef]
- Menéndez-Miguélez, M.; Canga, E.; Barrio-Anta, M.; Majada, J.; Álvarez-Álvarez, P. A three level system for estimating the biomass of Castanea sativa Mill. coppice stands in north-west Spain. For. Ecol. Manag. 2013, 291, 417–426. [Google Scholar] [CrossRef]
- Menéndez-Miguélez, M.; Ruiz-Peinado, R.; Del Río, M.; Calama, R. Improving tree biomass models through crown ratio patterns and incomplete data sources. Eur. J. For. Res. 2021, 140, 675–689. [Google Scholar] [CrossRef]
- Menéndez-Miguélez, M.; Calama, R.; Del Río, M.; Madrigal, G.; López-Senespleda, E.; Pardos, M.; Ruiz-Peinado, R. Species-specific and generalized biomass models for estimating carbon stocks of young reforestations. Biomass Bioenergy 2022, 161, 106453. [Google Scholar] [CrossRef]
- Picard, N.; Saint-André, L.; Henry, M. Manual for Building Tree Volume and Biomass Allometric Equations: From Field Measurement to Prediction; Food and Agricultural Organization of the United Nations: Rome, Italy; Centre de Coopération Internationale En Recherche Agronomique Pour Le Développement: Paris, France, 2012; ISBN 9789251073476. [Google Scholar]
- Metz, J.Ô.; Seidel, D.; Schall, P.; Scheffer, D.; Schulze, E.-D.; Ammer, C. Crown modeling by terrestrial laser scanning as an approach to assess the effect of aboveground intra- and interspecific competition on tree growth. For. Ecol. Manag. 2013, 310, 275–288. [Google Scholar] [CrossRef]
- Calders, K.; Newnham, G.; Burt, A.; Murphy, S.; Raumonen, P.; Herold, M.; Culvenor, D.S.; Avitabile, V.; Disney, M.; Armston, J.D.; et al. Nondestructive estimates of above-ground biomass using terrestrial laser scanning. Methods Ecol. Evol. 2015, 6, 198–208. [Google Scholar] [CrossRef]
- Disney, M.I.; Vicari, M.B.; Burt, A.; Calders, K.; Lewis, S.L.; Raumonen, P.; Wilkes, P. Weighing trees with lasers: Advances, challenges and opportunities. Interface Focus 2018, 8, 20170048. [Google Scholar] [CrossRef] [PubMed]
- Stovall, A.E.L.; Shugart, H.H. Improved Biomass Calibration and Validation With Terrestrial LiDAR: Implications for Future LiDAR and SAR Missions. IEEE J. Sel. Top. Appl. Earth Obs. Remote Sens. 2018, 11, 3527–3537. [Google Scholar] [CrossRef]
- Taeroe, A.; Nord-Larsen, T.; Stupak, I.; Raulund-Rasmussen, K. Allometric Biomass, Biomass Expansion Factor and Wood Density Models for the OP42 Hybrid Poplar in Southern Scandinavia. BioEnergy Res. 2015, 8, 1332–1343. [Google Scholar] [CrossRef]
- Calders, K.; Armston, J.; Newnham, G.; Herold, M.; Goodwin, N. Implications of sensor configuration and topography on vertical plant profiles derived from terrestrial LiDAR. Agric. For. Meteorol. 2014, 194, 104–117. [Google Scholar] [CrossRef]
- Puletti, N.; Grotti, M.; Ferrara, C.; Chianucci, F. Influence of voxel size and point cloud density on crown cover estimation in poplar plantations using terrestrial laser scanning. Ann. Silvic. Res. 2021, 46, 148–154. [Google Scholar] [CrossRef]
- Dassot, M.; Colin, A.; Santenoise, P.; Fournier, M.; Constant, T. Terrestrial laser scanning for measuring the solid wood volume, including branches, of adult standing trees in the forest environment. Comput. Electron. Agric. 2012, 89, 86–93. [Google Scholar] [CrossRef]
- Radtke, P.J.; Bolstad, P.V. Laser point-quadrat sampling for estimating foliage-height profiles in broad-leaved forests. Can. J. For. Res. 2001, 31, 410–418. [Google Scholar] [CrossRef]
- Côté, J.-F.; Widlowski, J.-L.; Fournier, R.A.; Verstraete, M.M. The structural and radiative consistency of three-dimensional tree reconstructions from terrestrial lidar. Remote Sens. Environ. 2009, 113, 1067–1081. [Google Scholar] [CrossRef]
- Puletti, N.; Grotti, M.; Scotti, R. Evaluating the Eccentricities of Poplar Stem Profiles with Terrestrial Laser Scanning. Forests 2019, 10, 239. [Google Scholar] [CrossRef]
- Ashcroft, M.B.; Gollan, J.R.; Ramp, D. Creating vegetation density profiles for a diverse range of ecological habitats using terrestrial laser scanning. Methods Ecol. Evol. 2014, 5, 263–272. [Google Scholar] [CrossRef]
- Tumbo, S.D.; Salyani, M.; Whitney, J.D.; Wheaton, T.A.; Miller, W.M. Investigation of laser and ultrasonic ranging sensors for measurements of citrus canopy volume. Appl. Eng. Agric. 2002, 18, 367. [Google Scholar] [CrossRef]
- Lee, K.H.; Ehsani, R. A Laser Scanner Based Measurement System for Quantification of Citrus Tree Geomtric Characteristics. Am. Soc. Agric. Biol. 2009, 25, 777–788. [Google Scholar]
- Moorthy, I.; Miller, J.R.; Berni, J.A.J.; Zarco-Tejada, P.; Hu, B.; Chen, J. Field characterization of olive (Olea europaea L.) tree crown architecture using terrestrial laser scanning data. Agric. For. Meteorol. 2011, 151, 204–214. [Google Scholar] [CrossRef]
- Sun, Y.; Liang, X.; Liang, Z.; Welham, C.; Li, W. Deriving Merchantable Volume in Poplar through a Localized Tapering Function from Non-Destructive Terrestrial Laser Scanning. Forests 2016, 7, 87. [Google Scholar] [CrossRef]
- Chianucci, F.; Puletti, N.; Grotti, M.; Ferrara, C.; Giorcelli, A.; Coaloa, D.; Tattoni, C. Nondestructive Tree Stem and Crown Volume Allometry in Hybrid Poplar Plantations Derived from Terrestrial Laser Scanning. For. Sci. 2020, 66, 737–746. [Google Scholar] [CrossRef]
- Fernández-Sarría, A.; Martínez, L.; Velázquez-Martí, B.; Sajdak, M.; Estornell, J.; Recio, J.A. Different methodologies for calculating crown volumes of Platanus hispanica trees using terrestrial laser scanner and a comparison with classical dendrometric measurements. Comput. Electron. Agric. 2013, 90, 176–185. [Google Scholar] [CrossRef]
- Côté, J.-F.; Fournier, R.A.; Frazer, G.W.; Niemann, K.O. A fine-scale architectural model of trees to enhance LiDAR-derived measurements of forest canopy structure. Agric. For. Meteorol. 2012, 166–167, 72–85. [Google Scholar] [CrossRef]
- Hackenberg, J.; Spiecker, H.; Calders, K.; Disney, M.; Raumonen, P. Simple Tree—An Efficient Open Source Tool to Build Tree Models from TLS Clouds. Forests 2015, 6, 4245–4294. [Google Scholar] [CrossRef]
- Raumonen, P.; Kaasalainen, M.; Åkerblom, M.; Kaasalainen, S.; Kaartinen, H.; Vastaranta, M.; Holopainen, M.; Disney, M.; Lewis, P. Fast Automatic Precision Tree Models from Terrestrial Laser Scanner Data. Remote Sens. 2013, 5, 491–520. [Google Scholar] [CrossRef]
- Rosell, J.R.; Llorens, J.; Sanz, R.; Arnó, J.; Ribes-Dasi, M.; Masip, J.; Escolà, A.; Camp, F.; Solanelles, F.; Gràcia, F.; et al. Obtaining the three-dimensional structure of tree orchards from remote 2D terrestrial LIDAR scanning. Agric. For. Meteorol. 2009, 149, 1505–1515. [Google Scholar] [CrossRef]
- Li, L.; Mu, X.; Soma, M.; Wan, P.; Qi, J.; Hu, R.; Zhang, W.; Tong, Y.; Yan, G. An Iterative-Mode Scan Design of Terrestrial Laser Scanning in Forests for Minimizing Occlusion Effects. IEEE Trans. Geosci. Remote Sens. 2020, 59, 3547–3566. [Google Scholar] [CrossRef]
- Weiser, H.; Winiwarter, L.; Anders, K.; Fassnacht, F.E.; Höfle, B. Opaque voxel-based tree models for virtual laser scanning in forestry applications. Remote Sens. Environ. 2021, 265, 112641. [Google Scholar] [CrossRef]
- Seidel, D.; Ammer, C. Efficient measurements of basal area in short rotation forests based on terrestrial laser scanning under special consideration of shadowing. iForest-Biogeosci. For. 2014, 7, 227–232. [Google Scholar] [CrossRef]
- Kankare, V.; Holopainen, M.; Vastaranta, M.; Puttonen, E.; Yu, X.; Hyyppä, J.; Vaaja, M.; Hyyppä, H.; Alho, P. Individual tree biomass estimation using terrestrial laser scanning. ISPRS J. Photogramm. Remote Sens. 2013, 75, 64–75. [Google Scholar] [CrossRef]
- Flade, L.; Hopkinson, C.; Chasmer, L. Allometric Equations for Shrub and Short-Stature Tree Aboveground Biomass within Boreal Ecosystems of Northwestern Canada. Forests 2020, 11, 1207. [Google Scholar] [CrossRef]
- Hosoi, F.; Omasa, K. Voxel-Based 3-D Modeling of Individual Trees for Estimating Leaf Area Density Using High-Resolution Portable Scanning Lidar. IEEE Trans. Geosci. Remote Sens. 2006, 44, 3610–3618. [Google Scholar] [CrossRef]
- Hyyppä, E.; Hyyppä, J.; Hakala, T.; Kukko, A.; Wulder, M.A.; White, J.C.; Pyörälä, J.; Yu, X.; Wang, Y.; Virtanen, J.-P.; et al. Under-canopy UAV laser scanning for accurate forest field measurements. ISPRS J. Photogramm. Remote Sens. 2020, 164, 41–60. [Google Scholar] [CrossRef]
- Béland, M.; Baldocchi, D.D.; Widlowski, J.-L.; Fournier, R.A.; Verstraete, M.M. On seeing the wood from the leaves and the role of voxel size in determining leaf area distribution of forests with terrestrial LiDAR. Agric. For. Meteorol. 2014, 184, 82–97. [Google Scholar] [CrossRef]
- Hilker, T.; van Leeuwen, M.; Coops, N.C.; Wulder, M.A.; Newnham, G.J.; Jupp, D.L.B.; Culvenor, D.S. Comparing canopy metrics derived from terrestrial and airborne laser scanning in a Douglas-fir dominated forest stand. Trees-Struct. Funct. 2010, 24, 819–832. [Google Scholar] [CrossRef]
- Hosoi, F.; Omasa, K. Estimation of Leaf Area Density Profiles of Japanese Maple and Camellia Woody Canopies Using Portable Scanning Lidars. Eco-Engineering 2011, 23, 105–109. [Google Scholar] [CrossRef]
- Calders, K.; Verbeeck, H.; Burt, A.; Origo, N.; Nightingale, J.; Malhi, Y.; Wilkes, P.; Raumonen, P.; Bunce, R.G.H.; Disney, M. Laser scanning reveals potential underestimation of biomass carbon in temperate forest. Ecol. Solut. Evid. 2022, 3, e12197. [Google Scholar] [CrossRef]
- Burt, A.; Vicari, M.B.; da Costa, A.C.L.; Coughlin, I.; Meir, P.; Rowland, L.; Disney, M. New insights into large tropical tree mass and structure from direct harvest and terrestrial lidar. R. Soc. Open Sci. 2021, 8, 201458. [Google Scholar] [CrossRef]
- Dong, Y.; Fan, G.; Zhou, Z.; Liu, J.; Wang, Y.; Chen, F. Low Cost Automatic Reconstruction of Tree Structure by AdQSM with Terrestrial Close-Range Photogrammetry. Forests 2021, 12, 1020. [Google Scholar] [CrossRef]
- Hopkinson, C.; Chasmer, L.; Young-Pow, C.; Treitz, P. Assessing forest metrics with a ground-based scanning lidar. Can. J. For. Res. 2004, 34, 573–583. [Google Scholar] [CrossRef]
- Maas, H.-G.; Bienert, A.; Scheller, S.; Keane, E. Automatic forest inventory parameter determination from terrestrial laser scanner data. Int. J. Remote Sens. 2008, 29, 1579–1593. [Google Scholar] [CrossRef]
- Liang, X.; Litkey, P.; Hyyppa, J.; Kaartinen, H.; Vastaranta, M.; Holopainen, M. Automatic Stem Mapping Using Single-Scan Terrestrial Laser Scanning. IEEE Trans. Geosci. Remote Sens. 2012, 50, 661–670. [Google Scholar] [CrossRef]
- Wang, Y.; Lehtomäki, M.; Liang, X.; Pyörälä, J.; Kukko, A.; Jaakkola, A.; Liu, J.; Feng, Z.; Chen, R.; Hyyppä, J. Is field-measured tree height as reliable as believed—A comparison study of tree height estimates from field measurement, airborne laser scanning and terrestrial laser scanning in a boreal forest. ISPRS J. Photogramm. Remote Sens. 2019, 147, 132–145. [Google Scholar] [CrossRef]
- Liu, G.; Wang, J.; Dong, P.; Chen, Y.; Liu, Z. Estimating Individual Tree Height and Diameter at Breast Height (DBH) from Terrestrial Laser Scanning (TLS) Data at Plot Level. Forests 2018, 9, 398. [Google Scholar] [CrossRef]
- Menéndez-Miguélez, M.; Canga, E.; Álvarez-Álvarez, P.; Majada, J. Stem taper function for sweet chestnut (Castanea sativa Mill.) coppice stands in northwest Spain. Ann. For. Sci. 2014, 71, 761–770. [Google Scholar] [CrossRef]
- Wagers, S.; Castilla, G.; Filiatrault, M.; Sanchez-Azofeifa, G.A. Using TLS-Measured Tree Attributes to Estimate Aboveground Biomass in Small Black Spruce Trees. Forests 2021, 12, 1521. [Google Scholar] [CrossRef]
- Terryn, L.; Calders, K.; Åkerblom, M.; Bartholomeus, H.; Disney, M.; Levick, S.; Origo, N.; Raumonen, P.; Verbeeck, H. Analysing individual 3D tree structure using the R package ITSMe. Methods Ecol. Evol. 2022, 14, 231–241. [Google Scholar] [CrossRef]
- Schneider, R.; Calama, R.; Martin-Ducup, O. Understanding Tree-to-Tree Variations in Stone Pine (Pinus pinea L.) Cone Production Using Terrestrial Laser Scanner. Remote Sens. 2020, 12, 173. [Google Scholar] [CrossRef]
- Olivier, M.-D.; Robert, S.; Richard, A.F. A method to quantify canopy changes using multi-temporal terrestrial lidar data: Tree response to surrounding gaps. Agric. For. Meteorol. 2017, 237–238, 184–195. [Google Scholar] [CrossRef]


| Variable | Definition | Method |
|---|---|---|
| Vol_bound | Volume of the smallest box that encompasses the entire stool | Bounding box |
| X_bound | Length of the bounding box over X axis | |
| Y_bound | Length of the bounding box over Y axis | |
| Z_bound | Height computed as the length of the bounding box over Z axis | |
| H_slice | Height computed as the difference between upper and stool slices | Stool slicing |
| Max_sec | Area of the maximum slice section generated | |
| BH_sec | Area of the breast height slice (H_slice = 1.30 m) | |
| Stool_sec | Maximum area of the slices included in the stool (H_slice < 30 cm) | |
| Stool_vol | Volume of the slices included in the stool | |
| Vol_slice | Stool volume obtained by aggregating the volumes of each slice | |
| Box_stool | Obtained after multiplying Stool_sec per H_slice | |
| Box_BH | Obtained after multiplying BH_sec per H_slice | |
| Vox2_med | Volume of the 2 cm side voxels with number or returns > median | Voxelization |
| Vox2_tot | Volume of the 2 cm side voxels with number or returns ≥ 1 | |
| Vox5_med | Volume of the 5 cm side voxels with number or returns > median | |
| Vox5_tot | Volume of the 5 cm side voxels with number or returns ≥ 1 | |
| Vox10_med | Volume of the 10 cm side voxels with number or returns > median | |
| Vox10_tot | Volume of the 10 cm side voxels with number or returns ≥ 1 | |
| Vox25_med | Volume of the 25 cm side voxels with number or returns > median | |
| Vox25_tot | Volume of the 25 cm side voxels with number or returns ≥ 1 |
| Variable | Definition |
|---|---|
| Plot_vol_bound | Sum of Vol_bound from all the stools in the plot |
| Plot_Z_bound | Mean value of individual Z_bound from all the stools in the plot |
| Hm_slices | Mean value of individual H_slice from all the stools in the plot |
| Max_coverture | Sum of Max_sec from all the stools in the plot |
| BH_coverture | Sum of BH_sec from all the stools in the plot |
| Stool_coverture | Sum of Stool_sec from all the stools in the plot |
| Plot_stool_vol | Sum of Stool_vol from all the stools in the plot |
| Plot_vol_slice | Sum of Vol_slice from all the stools in the plot |
| Plot_box_stool | Sum of Box_stool from all the stools in the plot |
| Plot_box_BH | Sum of BH_stool from all the stools in the plot |
| Plot_Vox2_med | Sum of Vox2_med from all the stools in the plot |
| Plot_Vox2_tot | Sum of Vox2_tot from all the stools in the plot |
| Plot_Vox5_med | Sum of Vox5_med from all the stools in the plot |
| Plot_Vox5_tot | Sum of Vox5_tot from all the stools in the plot |
| Plot_Vox10_med | Sum of Vox10_med from all the stools in the plot |
| Plot_Vox10_tot | Sum of Vox10_tot from all the stools in the plot |
| Plot_Vox25_med | Sum of Vox25_med from all the stools in the plot |
| Plot_Vox25_tot | Sum of Vox25_tot from all the stools in the plot |
| Individual Stool Scale | Plot Scale | ||||||||
|---|---|---|---|---|---|---|---|---|---|
| Variable | Units | Mean | STD | Median | Variable | Units | Mean | STD | Median |
| w_st | kg D.M. | 18.985 | 10.100 | 16.790 | W_tot | t D.M. ha−1 | 77.8 | 14.1 | 70.2 |
| h_st | m | 11.48 | 2.37 | 11.70 | hm | m | 11.5 | 1.8 | 11.1 |
| d_st | cm | 8.52 | 2.62 | 8.60 | BA | m2 ha−1 | 25.3 | 5.8 | 25.2 |
| N_shoot | - | 3.41 | 1.17 | 3 | N_shoot_tot | - | 13,722.5 | 1492.5 | 13,500 |
| Vol_bound | m3 | 72.968 | 25.793 | 67.483 | Plot_vol_bound | m3 ha−1 | 293,141.8 | 53,496.5 | 283,062 |
| X_bound | m | 2.33 | 0.37 | 2.30 | Plot_Z_bound | m | 12.0 | 1.1 | 11.9 |
| Y_bound | m | 2.57 | 0.40 | 2.51 | Hm_slices | m | 11.7 | 1.0 | 11.6 |
| Z_bound | m | 11.96 | 1.37 | 11.86 | Max_coverture | m2 ha−1 | 7755.0 | 1265.0 | 8035 |
| H_slice | m | 11.69 | 1.33 | 11.60 | BH_coverture | m2 ha−1 | 4110.0 | 672.5 | 4261 |
| Max_sec | m2 | 1.93 | 0.63 | 1.88 | Stool_coverture | m2 ha−1 | 1255.0 | 327.5 | 1376 |
| BH_sec | m2 | 1.02 | 0.38 | 0.95 | Plot_stool_vol | m3 ha−1 | 147.8 | 36.3 | 160.9 |
| Stool_sec | m2 | 0.31 | 0.19 | 0.28 | Plot_vol_slice | m3 ha−1 | 42,694.8 | 9273.0 | 45,185 |
| Stool_vol | m3 | 0.037 | 0.019 | 0.034 | Plot_box_proj | m3 ha−1 | 91,182.8 | 16,367.8 | 92,398 |
| Vol_slice | m3 | 10.64 | 4.31 | 10.43 | Plot_box_BH | m3 ha−1 | 47,941.8 | 8522.3 | 47,261 |
| Box_proj | m3 | 22.709 | 8.431 | 21.401 | Plot_Vox2_med | m3 ha−1 | 497.8 | 142.8 | 487 |
| Box_BH | m3 | 11.922 | 4.525 | 11.400 | Plot_Vox2_tot | m3 ha−1 | 926.0 | 258.5 | 923 |
| Vox2_med | m3 | 0.124 | 0.053 | 0.111 | Plot_Vox5_med | m3 ha−1 | 2581.8 | 688.3 | 2595 |
| Vox2_tot | m3 | 0.231 | 0.097 | 0.206 | Plot_Vox5_tot | m3 ha−1 | 4980.3 | 1334.5 | 4590 |
| Vox5_med | m3 | 0.645 | 0.245 | 0.598 | Plot_Vox10_med | m3 ha−1 | 8314.3 | 1940.8 | 8458 |
| Vox5_tot | m3 | 1.245 | 0.503 | 1.145 | Plot_Vox10_tot | m3 ha−1 | 16,300.0 | 3764.0 | 16,030 |
| Vox10_med | m3 | 2.079 | 0.701 | 2.011 | Plot_Vox25_med | m3 ha−1 | 31,139.0 | 5498.5 | 31,348 |
| Vox10_tot | m3 | 4.075 | 1.411 | 3.892 | Plot_Vox25_tot | m3 ha−1 | 62,019.5 | 10,427.0 | 62,430 |
| Vox25_med | m3 | 7.790 | 2.053 | 7.844 | |||||
| Vox25_tot | m3 | 15.514 | 4.033 | 15.672 | |||||
| Individual Stool Scale | Plot Scale | ||||||||
|---|---|---|---|---|---|---|---|---|---|
| Variable | w_st | h_st | d_st | N_shoot | Variable | W_tot | hm | BA | N_sh_tot |
| Vol_bound | 0.3602 *** | 0.3526 *** | 0.3030 *** | 0.1398 a | Plot_vol_bound | 0.8277 ** | 0.5732 | 0.5142 | 0.4231 |
| X_bound | 0.2737 *** | 0.2117 * | 0.2238 ** | 0.2285 ** | Plot_Z_bound | 0.9624 *** | 0.9345 *** | 0.8115 ** | 0.4793 |
| Y_bound | 0.1479 a | 0.0748 | 0.1083 | 0.0054 | Hm_slices | 0.9327 *** | 0.9613 *** | 0.8345 ** | 0.4596 |
| Z_bound | 0.4150 *** | 0.5903 *** | 0.3726 *** | 0.1234 | Max_coverture | 0.1017 | −0.2663 | −0.2674 | 0.2127 |
| H_slice | 0.4829 *** | 0.6325 *** | 0.4467 *** | 0.1980 * | BH_coverture | 0.0880 | −0.2839 | 0.0012 | 0.1914 |
| Max_sec | 0.1775 * | 0.0233 | 0.1124 | 0.1791 * | Stool_coverture | 0.0713 | −0.3418 | 0.0424 | 0.2384 |
| BH_sec | 0.1055 | −0.0389 | 0.0828 | 0.2860 *** | Plot_stool_vol | 0.0896 | −0.305 | 0.0409 | 0.1530 |
| Stool_sec | 0.1704 * | 0.0122 | 0.1241 | 0.2777 *** | Plot_vol_slice | 0.4416 | 0.0750 | 0.0743 | 0.3777 |
| Stool_vol | 0.1841 * | 0.0178 | 0.1398 a | 0.2914 *** | Plot_box_proj | 0.5561 | 0.2227 | 0.1627 | 0.4450 |
| Vol_slice | 0.3069 *** | 0.1821 | 0.2026 | 0.2386 ** | Plot_box_BH | 0.6021 a | 0.2595 | 0.4782 | 0.4408 |
| Box_proj | 0.3234 *** | 0.2321 ** | 0.2500 ** | 0.2205 ** | Plot_Vox2_med | −0.0771 | −0.2943 | −0.3429 | 0.1523 |
| Box_BH | 0.2725 ** | 0.1755 * | 0.2373 ** | 0.3275 *** | Plot_Vox2_tot | −0.1281 | −0.3491 | −0.3956 | 0.1249 |
| Vox2_med | 0.1648 * | −0.0220 | 0.0373 | 0.1842 * | Plot_Vox5_med | −0.0619 | −0.2963 | −0.3450 | 0.1858 |
| Vox2_tot | 0.1278 | −0.0444 | 0.0199 | 0.1643 * | Plot_Vox5_tot | −0.1242 | −0.3361 | −0.3510 | 0.1905 |
| Vox5_med | 0.1545 a | −0.0555 | 0.0091 | 0.1971 * | Plot_Vox10_med | −0.0005 | −0.2641 | −0.3076 | 0.2080 |
| Vox5_tot | 0.1427 | −0.0552 | 0.0266 | 0.1938 * | Plot_Vox10_tot | −0.0386 | −0.2876 | −0.3068 | 0.2372 |
| Vox10_med | 0.1742 * | −0.0369 | 0.0269 | 0.2259 ** | Plot_Vox25_med | 0.1970 | −0.1253 | −0.1581 | 0.2493 |
| Vox10_tot | 0.1678 * | −0.0406 | 0.0261 | 0.2126 * | Plot_Vox25_tot | 0.2023 | −0.1185 | −0.1608 | 0.2369 |
| Vox25_med | 0.2540 ** | 0.0776 | 0.1186 | 0.2491 ** | |||||
| Vox25_tot | 0.2634 ** | 0.0864 | 0.1262 | 0.2702 ** | |||||
| Model | X1 | X2 | β0 | β1 | β2 | AIC | R2adj | RMSE (kg) | RRMSE (%) |
|---|---|---|---|---|---|---|---|---|---|
| TLS | H_slice | Stool_vol | −26.6109 | 3.6224 | 88.1831 | 1031.2 | 0.2490 | 8.7527 | 46.1% |
| Field Inventory | d_st2.h_st | N_shoot | 4.2524 | 0.0115 | 0.9940 | 896.6 | 0.7070 | 5.4675 | 28.8% |
| Combined | d_st2.H_slice | Vox10_med | 3.0171 | 0.0134 | 1.5881 | 899.1 | 0.7018 | 5.5152 | 29.1% |
| Model | X1 | X2 | β0 | β1 | β2 | AIC | R2adj | RMSE (t·ha−1) | RRMSE (%) |
|---|---|---|---|---|---|---|---|---|---|
| TLS | Plot_Z_bound | Plot_stool_vol | −97.7637 | 13.5205 | 0.0929 | 42.1 | 0.9756 | 2.2082 | 2.9% |
| Field Inventory | BA.Hm | - | 43.4755 | 0.1154 | - | 61.2 | 0.8052 | 6.2447 | 8.3% |
| Combined | BA.Plot_Z_bound | - | 35.0969 | 0.1395 | 59.8 | 0.8333 | 5.7779 | 7.7% |
Disclaimer/Publisher’s Note: The statements, opinions and data contained in all publications are solely those of the individual author(s) and contributor(s) and not of MDPI and/or the editor(s). MDPI and/or the editor(s) disclaim responsibility for any injury to people or property resulting from any ideas, methods, instructions or products referred to in the content. |
© 2023 by the authors. Licensee MDPI, Basel, Switzerland. This article is an open access article distributed under the terms and conditions of the Creative Commons Attribution (CC BY) license (https://creativecommons.org/licenses/by/4.0/).
Share and Cite
Menéndez-Miguélez, M.; Madrigal, G.; Sixto, H.; Oliveira, N.; Calama, R. Terrestrial Laser Scanning for Non-Destructive Estimation of Aboveground Biomass in Short-Rotation Poplar Coppices. Remote Sens. 2023, 15, 1942. https://doi.org/10.3390/rs15071942
Menéndez-Miguélez M, Madrigal G, Sixto H, Oliveira N, Calama R. Terrestrial Laser Scanning for Non-Destructive Estimation of Aboveground Biomass in Short-Rotation Poplar Coppices. Remote Sensing. 2023; 15(7):1942. https://doi.org/10.3390/rs15071942
Chicago/Turabian StyleMenéndez-Miguélez, María, Guillermo Madrigal, Hortensia Sixto, Nerea Oliveira, and Rafael Calama. 2023. "Terrestrial Laser Scanning for Non-Destructive Estimation of Aboveground Biomass in Short-Rotation Poplar Coppices" Remote Sensing 15, no. 7: 1942. https://doi.org/10.3390/rs15071942
APA StyleMenéndez-Miguélez, M., Madrigal, G., Sixto, H., Oliveira, N., & Calama, R. (2023). Terrestrial Laser Scanning for Non-Destructive Estimation of Aboveground Biomass in Short-Rotation Poplar Coppices. Remote Sensing, 15(7), 1942. https://doi.org/10.3390/rs15071942