Technical Note

Large-Scale Controls on the Leaf Economic Spectrum of the Overstory Tree Species Metrosideros polymorpha

by
Megan M. Seeley
1,2,* and
Gregory P. Asner
1,2,3
1
Center for Global Discovery and Conservation Science, Arizona State University, Tempe, AZ 85281, USA
2
School of Geographical Sciences and Urban Planning, Arizona State University, Tempe, AZ 85281, USA
3
School of Ocean Futures, Arizona State University, Hilo, HI 96720, USA
*
Author to whom correspondence should be addressed.
Remote Sens. 2023, 15(19), 4707; https://doi.org/10.3390/rs15194707
Submission received: 29 June 2023 / Revised: 8 September 2023 / Accepted: 11 September 2023 / Published: 26 September 2023

Abstract

:
The role of intraspecific trait variation in functional ecology has gained traction in recent years as many papers have observed its importance in driving community diversity and ecology. Yet much of the work in this field relies on field-based trait surveys. Here, we used continuous canopy trait information derived from remote sensing data of a highly polymorphic tree species, Metrosideros polymorpha, to quantify environmental controls on intraspecific trait variation. M. polymorpha, an endemic, keystone tree species in Hawai’i, varies morphologically, chemically, and genetically across broad elevation and soil substrate age gradients, making it an ideal model organism to explore large-scale environmental drivers of intraspecific trait variation. M. polymorpha canopy reflectance (visible to shortwave infrared; 380–2510 nm) and light detection and ranging (LiDAR) data collected by the Global Airborne Observatory were modeled to canopy trait estimates of leaf mass per area, chlorophyll a and b, carotenoids, total carbon, nitrogen, phosphorus, phenols, cellulose, and top of canopy height using previously developed leaf chemometric equations. We explored how these derived traits varied across environmental gradients by extracting elevation, slope, aspect, precipitation, and soil substrate age data at canopy locations. We then obtained the feature importance values of the environmental factors in predicting each leaf trait by training random forest models to predict leaf traits individually. Of these environmental factors, elevation was the most important predictor for all canopy traits. Elevation not only affected canopy traits directly but also indirectly by influencing the relationships between soil substrate age and canopy traits as well as between nitrogen and other traits, as indicated by the change in slope between the variables at different elevation ranges. In conclusion, intraspecific variation in M. polymorpha traits derived from remote sensing adheres to known leaf economic spectrum (LES) patterns as well as interspecific LES traits previously mapped using imaging spectroscopy.

1. Introduction

Community ecology and metrics for assessing functional diversity have traditionally focused on interspecific trait variation and species turnover along environmental gradients [1,2,3]. For example, the leaf economic spectrum (LES), which describes how plant traits covary, primarily describes interspecific trait variation [2]. Since the theory was developed, the role of intraspecific variation in the LES has been investigated with conflicting results [4,5,6,7]. For example, intraspecific variation patterns in montane boreal forests were contrary to community-level interspecific patterns that followed the LES [5]. In contrast, intraspecific variation in temperate rainforests did follow LES and contributed to overall trait variation within the community [4]. Moreover, quantifying the functional diversity of forest communities often ignores intraspecific variation by using species trait means despite the importance of intraspecific trait variation in driving functional diversity—about 25% according to one meta-analysis [8]. Many studies agree that our understanding of functional diversity and community ecology could be enhanced by better incorporating intraspecific trait diversity [1,9,10,11,12].
Quantifying intraspecific trait variation on large geographic scales is possible with remote sensing, specifically imaging spectroscopy. Imaging spectroscopy is a remote sensing technique that captures a continuous portion of the electromagnetic spectrum from the visible (~380 nm) to the shortwave infrared (~2510 nm) at short (~5–10 nm) wavelength intervals. By sampling the spectra at high spectral resolution, these data capture surface chemistry [13,14], and when applied to vegetation, canopy traits (e.g., leaf mass per area, leaf nitrogen, lignin, etc.) can be estimated with demonstrable accuracy [15,16,17]. These data have been used to quantify functional diversity [18] and interspecific leaf trait patterns [19] at the landscape and regional levels.
Metrosideros polymorpha (‘ōhi’a lehua) on Hawai’i Island is an ideal model canopy tree species to study intraspecific trait variation. M. polymorpha spans the entirety of Hawai’i Island across recent (<50 years) lava flows to older soils (~325,000 years old) and from sea level to the tree line (~9000 m). This species is highly polymorphic and has differentiated into four distinct genotypes that self-sort along elevation and soil substrate age gradients [20,21]. By quantifying canopy traits of M. polymorpha across Hawai’i Island using imaging spectroscopy data, we can observe intraspecific trait variation of continuous canopies across broad environmental gradients on a large spatial scale (~10,000 km2). While prior studies have confirmed that interspecific and community-scale trait patterns follow LES across large spatial scales using imaging spectroscopy data [19], we investigated intraspecific variation with regard to the LES using the M. polymorpha model system across Hawai’i Island.

2. Materials and Methods

2.1. Data Collection

M. polymorpha canopy spatial data were developed by Seeley et al. [22] using 2019 Arizona State University Global Airborne Observatory (GAO) data. The GAO houses a high-fidelity imaging spectrometer (380–2510 nm) and a boresight-aligned dual-laser light detection and ranging (LiDAR) scanner, which was used to develop island-wide visible to shortwave infrared (VSWIR) surface reflectance and top of canopy height (TCH) mosaics [23]. Between the summer of 2022 and winter of 2023, canopy location data of 5366 crowns were collected, and crowns were identified as either M. polymorpha or “other.” An island-wide support vector machine (SVM) model was trained using 70% of these crown data and a 96.0% accuracy was achieved when tested on the remaining 30%. The SVM was then used to classify all pixels with vegetation over one meter tall as either M. polymorpha or other vegetation. The model output was compared to a Bayesian Gaussian process classification (GPC) trained using the spatial information from the training crown data, and the results were spatially accurate according to the Bayesian GPC. Due to the large dataset size, ~152,000 pixels representing M. polymorpha canopies were selected from across Hawai’i Island using systematic random sampling. To extract canopy height and trait data, we used GAO TCH from light detection and ranging (LiDAR) and canopy trait estimations were developed by applying universal chemometric algorithms to VSWIR reflectance data [15]. These algorithms have been used to quantify M. polymorpha canopy traits at six locations on Hawai’i Island [24]. Note that the chemometric equations result in estimates of canopy trait information, so we focus on the relative values rather than the absolute values. The canopy traits estimated from VSWIR data included: leaf mass per area (LMA), total carbon (C), phenols, chlorophyll a and b (a+b), foliar nitrogen (N), cellulose, carotenoids, and phosphorus (P).
We next obtained environmental data on elevation, slope, aspect, precipitation, and soil substrate age (Figure S1). Spatial elevation data were collected from the Shuttle Radar Topography Mission (SRTM) digital elevation model (DEM) [25]. Slope and aspect spatial data were derived from the SRTM DEM using the QGIS Terrain Analysis toolbox. Annual precipitation data (30-year normal from 1991 to 2020) were developed by the PRISM Climate Group [26], and soil substrate age datasets were produced by the U.S. Geological Survey [27]. To co-align the environmental conditions and M. polymorpha canopy trait data, we extracted environmental information from the center of each 2 m × 2 m M. polymorpha pixel in the Seeley et al. [22] M. polymorpha spatial distribution dataset.

2.2. Analysis

We first investigated the relative importance of environmental factors (elevation, slope, aspect, precipitation, and soil substrate age) in driving M. polymorpha canopy traits. The relative contribution of the environmental factors in driving canopy trait variation was assessed by training a random forest classifier for each canopy trait. Models were developed using the scikit learn Python package (version 1.1.3) [28] with standardized environmental data as the predictor variables and each canopy trait as the response variable. Predictor importance was calculated using the feature importance method built into the scikit-learn random forest model. The feature importance method calculates how often each predictor was used in the trees developed by the model.
Next, we compared the relationship between canopy traits and environmental factors. As prior studies have described elevation and soil substrate age as being primary drivers of genotypic variation in M. polymorpha [20,24,29,30,31], our analyses focused on these variables. Linear regression models were fit for each canopy trait–environmental factor (elevation, soil substrate age) pairing to understand their relationship. Additionally, linear regressions were fit and boxplots were developed to assess the relationship between canopy traits and soil substrate age at each elevation range. The slope and r2 of each model were recorded. To visualize how canopy traits varied across elevation gradients, box plots of canopy traits grouped according to elevation alone and soil substrate age alone were developed. Boxplots were developed using the seaborne Python package (v. 0.11.2) [32]. For both the linear models and visualizations, elevation and soil substrate age were grouped into categories representing elevation (0–150, 150–300, 300–600, 600–900, 900–1200, 1200–1500, 1500–1800, 1800–2100, 2100–3000 m) and age ranges (0–500, 500–1000, 1000–5000, 5000–15,000, 15,000–50,000, 50,000–400,000 years). Elevation and soil substrate age were modeled using categories as a means of standardizing the data to better compare the trait–environment relationships between the environmental factors. For nonlinear canopy traits–environment relationships, as determined by checking residual normality and homoscedasticity, canopy traits were log-transformed. Dataset ranges were chosen to ensure a more even spread of canopy data within each range. To maintain a consistent group size, 57 pixels within each elevation–soil substrate age category were randomly selected.
To understand how environmental factors mediated trait relationships described by the LES, we developed paired plots between the foliar N and LMA, chlorophyll a+b, and P. Data were first grouped according to elevation and then soil substrate age range. Next, a regression line for paired traits within each elevation or soil substrate age range was calculated and plotted using the scikit learn Python package (version 1.1.3) [28].

3. Results

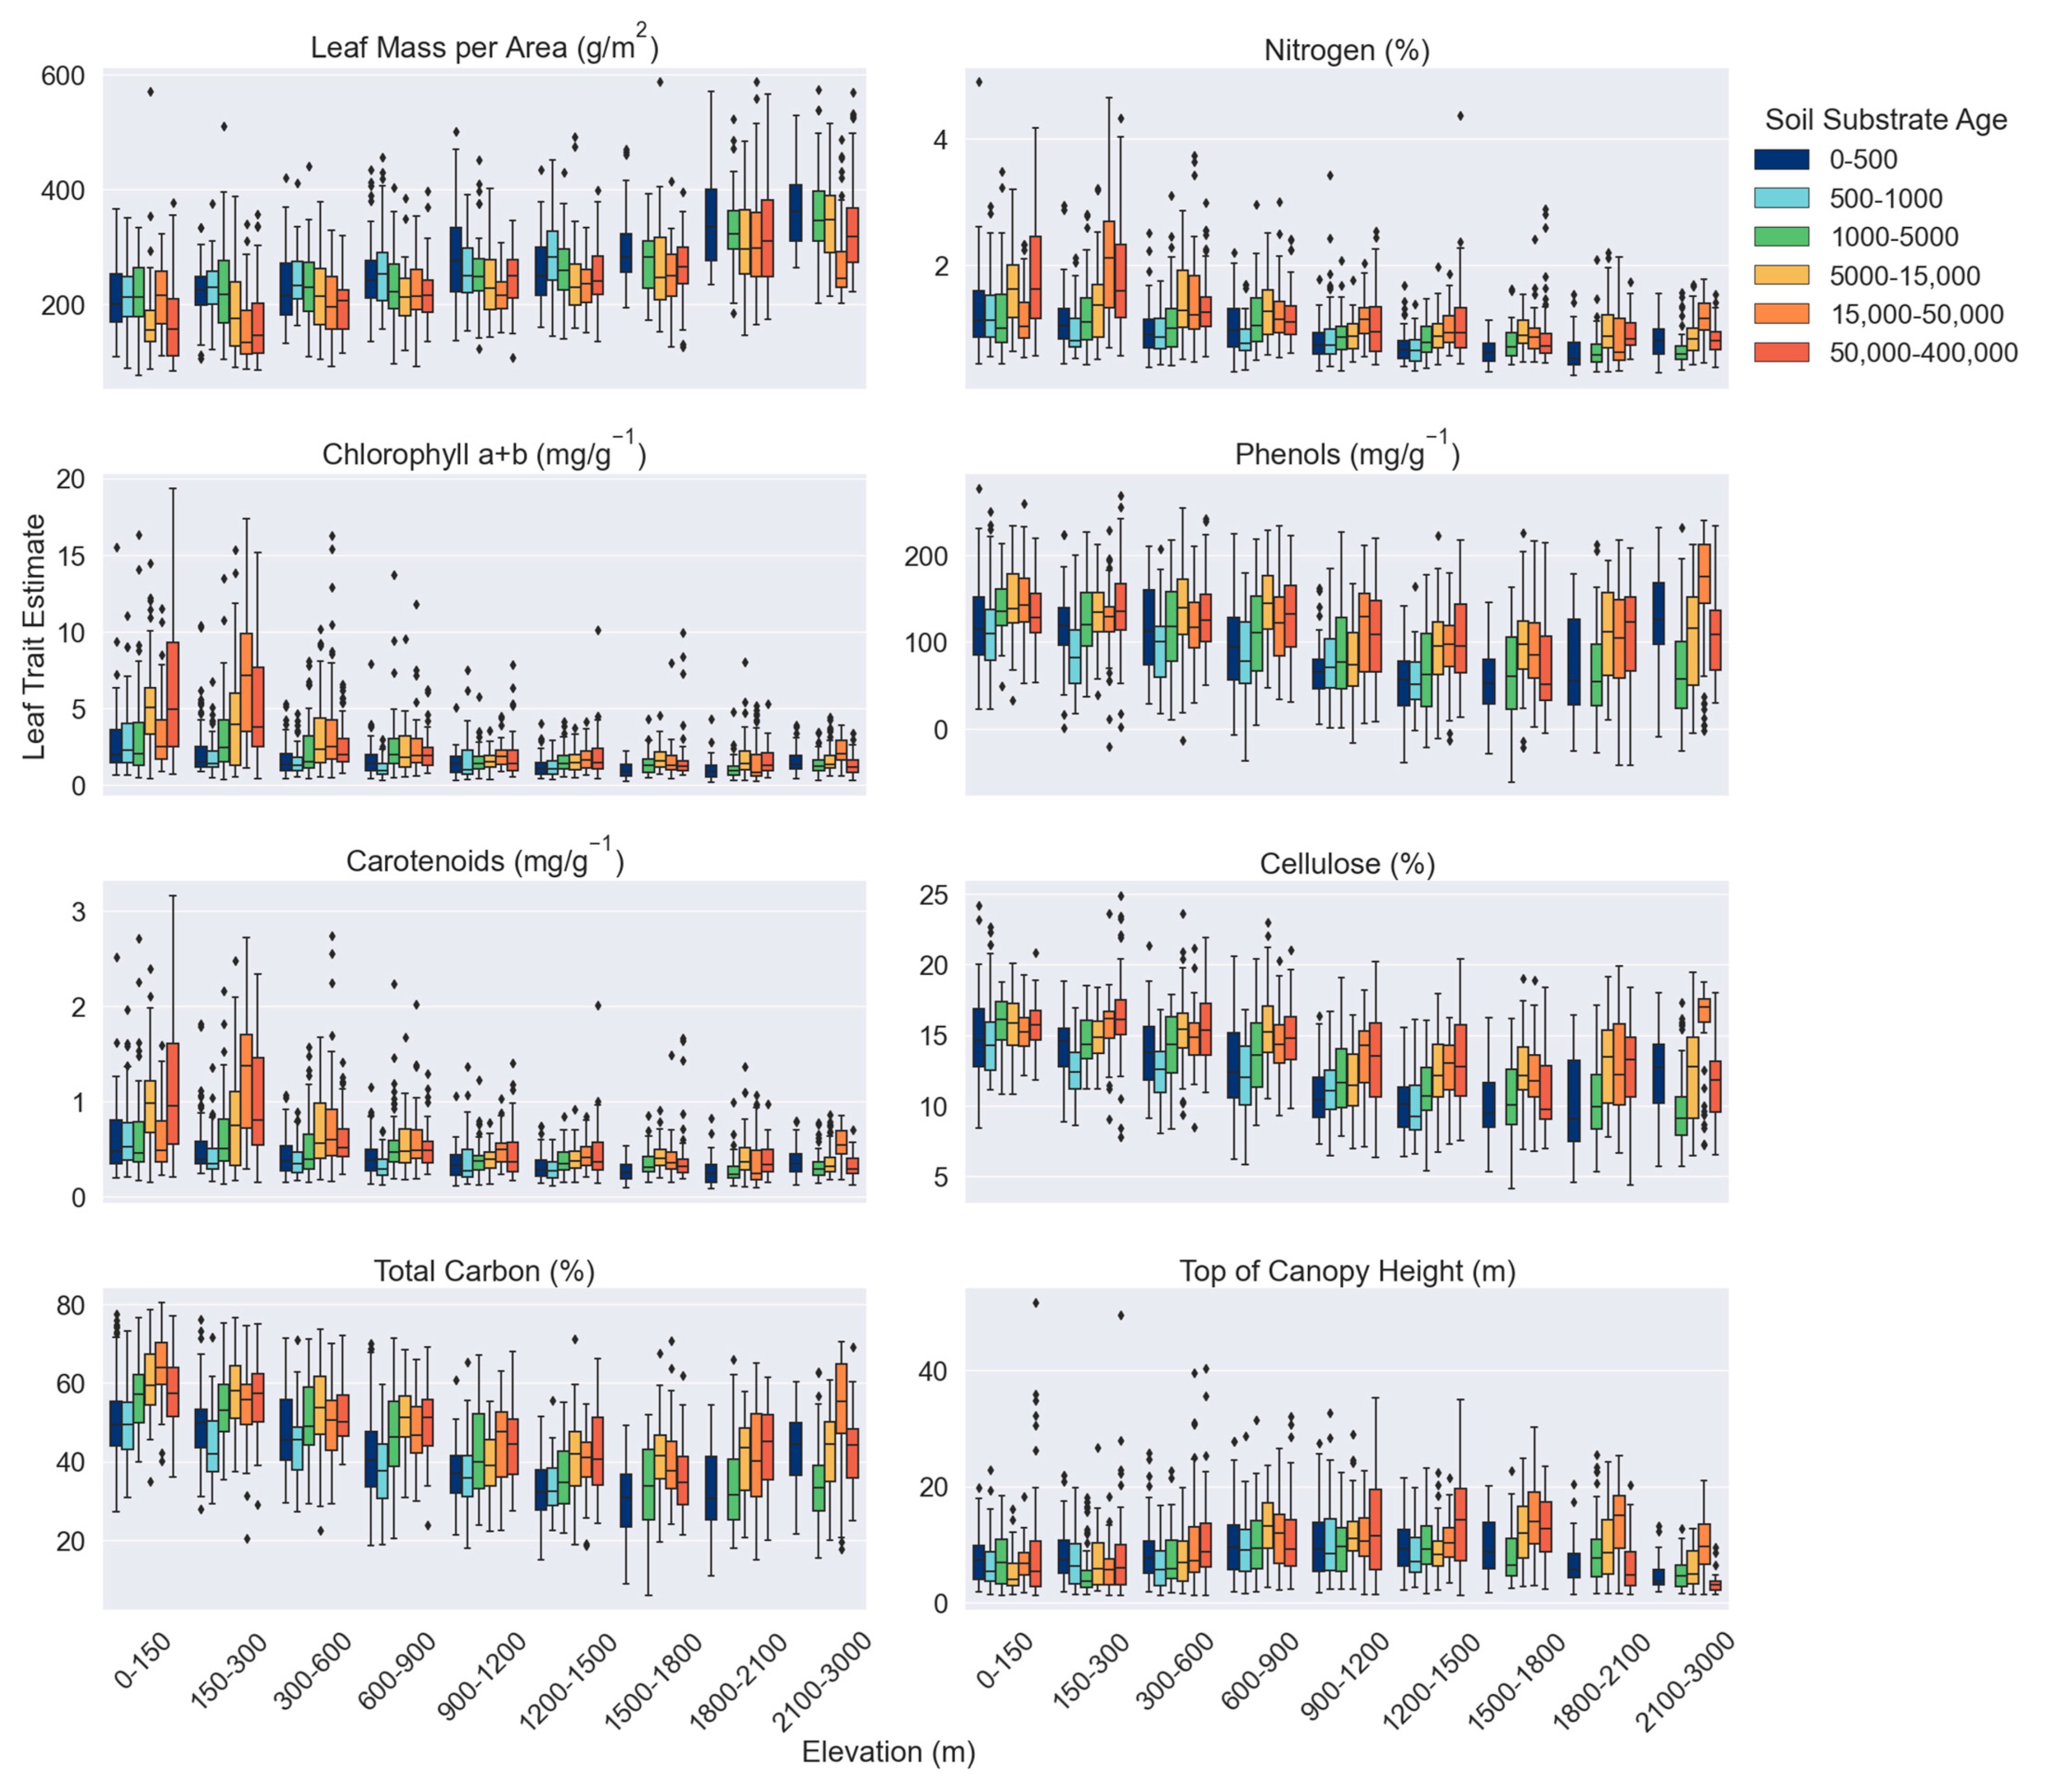
3.1. Canopy Trait Variation across Environmental Gradients

Intraspecific variation of canopy traits primarily followed elevation gradients. The random forest feature importance indicated that elevation is the primary diver of all M. polymorpha canopy traits. Precipitation was the second most important factor in predicting trait estimates. For chlorophyll a+b, carotenoids, total C, and nonstructural carbohydrates, soil substrate age was the third most important predictor, and for all other traits, soil substrate age was the least important predictor. Slope and aspect had similar levels of importance, with slope being the more informative variable in most cases (Figure 1).
Except for TCH, elevation and soil substrate age had opposite relationships with M. polymorpha canopy traits. LMA was positively associated with elevation while all other traits were negatively associated with elevation. TCH was positively related to both elevation and soil substrate age. The relationship between elevation and all canopy traits, except phenols and TCH, was stronger than that of soil substrate age, as determined by the slope and r2. LMA had the strongest relationship with both environmental factors, followed by phenols and total C (Figure 2; Table 1). Across the elevation gradient, total C, phenols, cellulose, and TCH either peaked or had a minimum around 1200–1800 m. Chlorophyll a+b, carotenoids, and N variability decreased with increasing elevation, TCH variability peaked at middle elevations, and variability of cellulose increased positively with elevation (Figure 2). Canopy trait variability did not vary greatly with soil substrate age, and the relationship between traits and soil substrate age was primarily linear (Figure 2). When grouped according to elevation, the relationship between soil substrate age and canopy traits becomes more variable. While few consistent patterns emerged regarding the slope and r2, canopies at 150–300 m had larger slopes for many of the traits than those at other elevations (Table 1). Variability of the chlorophyll a+b, carotenoids, and N was higher on older soils (15,000–40,0000 years) at low elevations (0–300 m). Visually, the relationship between soil substrate age and canopy traits appeared more parabolic in at some elevation ranges, while it remained more linear at others. For example, median N values peaked around 5000–50,000 years at most elevations, but the relationship remained linear at 1200–1500 m (Figure 3).

3.2. Canopy Trait Relationships as Mediated by Environmental Factors

M. polymorpha canopy LMA and N were negatively correlated. High LMA and low N were most often observed at higher elevations while low LMA and high N were observed at low elevations. Further, there was a constriction of trait variability at higher elevations, as can be observed in coordinate space when LMA and N are plotted against each other (Figure 4). The slope of the relationship between LMA and N increased positively with elevation from −62.6 to −151.9. Soil substrate age had a smaller effect on the relationship between these variables, though the slope decreased across soils of different geologic ages. M. polymorpha inhabiting soils aged 0–500 had a larger slope (−111.4) while M. polymorpha on older soil ages was the lowest (−86.6; Figure 5; Table S1).
The effect of elevation and soil substrate age on the relationship between chlorophyll a+b and N was like that of LMA and N. The slope between chlorophyll a+b and N decreased from 4.3 to 2.2 as elevation increased while that for soil substrate age peaked at 15,000–50,000 years old. The slope range was smaller for soil substrate age (2.8–4.0) than that for elevation. There were no consistent patterns between P and N for either elevation or soil substrate age. The slope for this relationship was near zero, and r2 was consistently low (0.0001–0.102). Further, the relationship between P and N switched from negative to positive (Figure 5; Table S1).

4. Discussion

Intraspecific canopy traits of M. polymorpha across Hawai’i Island followed the global LES. Like the LMA-N relationship described by the LES [2], M. polymorpha exhibited a strong LMA-N relationship. Intraspecific variation is an important driver of community-level LMA-N relationship [4], and here we contribute to the body of literature describing intraspecific LMA-N relationships [4,33,34]. The M. polymorpha LMA-N relationship on Hawai’i Island was consistently negative, yet the slope decreased as elevation increased. Soil substrate age did not have a similar systematic effect on the LMA-N relationship. Further, the trait space occupied by M. polymorpha LMA-N variability constricted as elevation increased. This pattern of trait space constriction was observed using canopy traits estimated from imaging spectroscopy across elevation gradients in diverse Peruvian forests [19].
Intraspecific variation of M. polymorpha canopy traits was largely determined by elevation. Prior studies have observed strong morphological and physiological responses of M. polymorpha to elevation, describing differences in leaf size, shape, pubescence, stature, nitrogen use efficiency, and LMA, among others [29,35,36,37,38,39,40,41]. These traits have been shown to follow not only elevation but also soil substrate age gradients [37,38,42]. Further, M. polymorpha genotypes and their hybrids, many of which have unique chemical fingerprints [43] exist on specific elevation–soil substrate age combinations [20,21,44]. Prior studies focusing on M. polymorpha intraspecific variation used geographically separate sites or elevation gradients along a single slope [24,31]. Using data randomly sampled from across Hawai’i Island, we observed that elevation has the primary effect on M. polymorpha canopy traits, followed by precipitation. While soil substrate age was often the least important determinant of M. polymorpha canopy traits, the degree of leaf trait response to soil substrate age depended on elevation.
Elevation is a strong driver of plant traits globally and is thus a major component of the LES. Canopy traits such as LMA, specific leaf area, N, and δ13C respond to elevation [2,19,45,46]. Canopy trait responses to elevational changes have been attributed to light availability, harsher environmental conditions at high elevations, growing season length, and temperature, among others [45,47,48]. Not only does elevation affect canopy traits directly, but it also mediates the effect of other environmental drivers. Here, we observed that the response of M. polymorpha canopy traits on soil substrate age differed based on elevation. Slope and aspect, which often mediates the effect of elevation on tempearure and growing season length, had a lesser effect on canopy traits. Using six M. polymorpha-dominated sites on Hawai’i Island, Seeley et al. [24] reached the same conclusion as they determined that both canopy traits and VSWIR reflectance spectra were driven primarily by elevation, with soil substrate age being a secondary driver. While the occurrence of M. polymorpha across large environmental gradients allows for an investigation of intraspecific trait variation, this species has few analogs globally, and therefore, more work is needed to determine if the LES holds for intraspecific traits of other species.

5. Conclusions

Determining the drivers of intraspecific trait variation on large geographic scales allows us to better understand functional diversity, community ecology, and evolution, and manage for future climate scenarios [8,9,10,46,49,50,51]. As imaging spectroscopy coaligned with LiDAR data [23] allows for accurate species classifications [52,53,54,55,56,57,58] and the estimation of canopy traits [15,16,17], it is a tool with which we can quantify intraspecific variation. Using imaging spectroscopy data from a model system, we demonstrated that intraspecific variation follows LES across broad environmental gradients. In the M. polymorpha model system, as with many systems, elevation was the primary driver of canopy trait variation. This work suggests that highly polymorphic species like M. polymorpha will adapt to environmental drivers like how trait selection and environmental filtering of diverse tree communities result in trait convergence based on site conditions.

Supplementary Materials

The following supporting information can be downloaded at: https://www.mdpi.com/article/10.3390/rs15194707/s1, Figure S1: Spatial data of the soil substrate age, annual precipitation, aspect, slope, elevation, and Metrosideros polymorpha presence for Hawai’i Island; Table S1: Slope and r2 of the linear regression models between nitrogen and three canopy traits (leaf mass per area, chlorophyll a+b, and phosphorus) modeled separately for each trait.

Author Contributions

Conceptualization, M.M.S.; Data curation, M.M.S. and G.P.A.; Funding acquisition, M.M.S. and G.P.A.; Methodology, M.M.S.; Writing—original draft, M.M.S.; Writing—review and editing, G.P.A. All authors have read and agreed to the published version of the manuscript.

Funding

This research was funded by the National Science Foundation Doctoral Dissertation Improvement Grant (Award Number 2218932) and the School of Geographical Sciences and Urban Planning Graduate Summer Research Funding Award.

Data Availability Statement

M. polymorpha canopy trait data used in these analyses are openly available at Figshare: https://doi.org/10.6084/m9.figshare.23605317.v1, accessed on 12 September 2023.

Acknowledgments

The Global Airborne Observatory (GAO) is managed by the Center for Global Discovery and Conservation Science at Arizona State University. The GAO is made possible by support from private foundations, visionary individuals, and Arizona State University.

Conflicts of Interest

The authors declare no conflict of interest.

References

  1. Schleuter, D.; Daufresne, M.; Massol, F.; Argillier, C. A user’s guide to functional diversity indices. Ecol. Monogr. 2010, 80, 469–484. [Google Scholar] [CrossRef]
  2. Wright, I.J.; Reich, P.B.; Westoby, M.; Ackerly, D.D.; Baruch, Z.; Bongers, F.; Cavender-Bares, J.; Chapin, T.; Cornelissen, J.H.C.; Diemer, M.; et al. The worldwide leaf economics spectrum. Nature 2004, 428, 821–827. [Google Scholar] [CrossRef]
  3. Wright, S.J.; Kitajima, K.; Kraft, N.J.B.; Reich, P.B.; Wright, I.J.; Bunker, D.E.; Condit, R.; Dalling, J.W.; Davies, S.J.; Díaz, S.; et al. Functional traits and the growth–mortality trade-off in tropical trees. Ecology 2010, 91, 3664–3674. [Google Scholar] [CrossRef]
  4. Fajardo, A.; Siefert, A. Intraspecific trait variation and the leaf economics spectrum across resource gradients and levels of organization. Ecology 2018, 99, 1024–1030. [Google Scholar] [CrossRef]
  5. Hecking, M.J.; Zukswert, J.M.; Drake, J.E.; Dovciak, M.; Burton, J.I. Montane Temperate-Boreal Forests Retain the Leaf Economic Spectrum Despite Intraspecific Variability. Front. For. Glob. Chang. 2022, 4, 754063. Available online: https://www.frontiersin.org/articles/10.3389/ffgc.2021.754063 (accessed on 10 June 2023). [CrossRef]
  6. Laughlin, D.C.; Lusk, C.H.; Bellingham, P.J.; Burslem, D.F.R.P.; Simpson, A.H.; Kramer-Walter, K.R. Intraspecific trait variation can weaken interspecific trait correlations when assessing the whole-plant economic spectrum. Ecol. Evol. 2017, 7, 8936–8949. [Google Scholar] [CrossRef]
  7. Wright, J.P.; Sutton-Grier, A. Does the leaf economic spectrum hold within local species pools across varying environmental conditions? Funct. Ecol. 2012, 26, 1390–1398. [Google Scholar] [CrossRef]
  8. Siefert, A.; Violle, C.; Chalmandrier, L.; Albert, C.H.; Taudiere, A.; Fajardo, A.; Aarssen, L.W.; Baraloto, C.; Carlucci, M.B.; Cianciaruso, M.V.; et al. A global meta-analysis of the relative extent of intraspecific trait variation in plant communities. Ecol. Lett. 2015, 18, 1406–1419. [Google Scholar] [CrossRef]
  9. Albert, C.H.; Thuiller, W.; Yoccoz, N.G.; Soudant, A.; Boucher, F.; Saccone, P.; Lavorel, S. Intraspecific functional variability: Extent, structure and sources of variation. J. Ecol. 2010, 98, 604–613. [Google Scholar] [CrossRef]
  10. De Bello, F.; Lavorel, S.; Albert, C.H.; Thuiller, W.; Grigulis, K.; Dolezal, J.; Janeček, Š.; Lepš, J. Quantifying the relevance of intraspecific trait variability for functional diversity. Methods Ecol. Evol. 2011, 2, 163–174. [Google Scholar] [CrossRef]
  11. Jung, V.; Violle, C.; Mondy, C.; Hoffmann, L.; Muller, S. Intraspecific variability and trait-based community assembly. J. Ecol. 2010, 98, 1134–1140. [Google Scholar] [CrossRef]
  12. Paine, C.E.T.; Baraloto, C.; Chave, J.; Hérault, B. Functional traits of individual trees reveal ecological constraints on community assembly in tropical rain forests. Oikos 2011, 120, 720–727. [Google Scholar] [CrossRef]
  13. Boardman, J.W.; Green, R.O. Exploring the Spectral Variability of the Earth as Measured by AVIRIS in 1999. 2000. Available online: https://trs.jpl.nasa.gov/handle/2014/16602 (accessed on 9 June 2023).
  14. Green, R.O.; Boardman, J.W. Exploration of the relationship between information content and signal-to-noise ratio and spatial resolution in AVIRIS spectral data. Spectrum 2000, 7, 1–12. [Google Scholar]
  15. Asner, G.P.; Martin, R.E.; Anderson, C.B.; Knapp, D.E. Quantifying forest canopy traits: Imaging spectroscopy versus field survey. Remote Sens. Environ. 2015, 158, 15–27. [Google Scholar] [CrossRef]
  16. Asner, G.P.; Martin, R.E. Airborne spectranomics: Mapping canopy chemical and taxonomic diversity in tropical forests. Front. Ecol. Environ. 2009, 7, 269–276. [Google Scholar] [CrossRef]
  17. Asner, G.P.; Martin, R.E. Spectranomics: Emerging science and conservation opportunities at the interface of biodiversity and remote sensing. Glob. Ecol. Conserv. 2016, 8, 212–219. [Google Scholar] [CrossRef]
  18. Féret, J.-B.; Asner, G.P. Mapping tropical forest canopy diversity using high-fidelity imaging spectroscopy. Ecol. Appl. 2014, 24, 1289–1296. [Google Scholar] [CrossRef]
  19. Asner, G.P.; Knapp, D.E.; Anderson, C.B.; Martin, R.E.; Vaughn, N. Large-scale climatic and geophysical controls on the leaf economics spectrum. Proc. Natl. Acad. Sci. USA 2016, 113, E4043–E4051. [Google Scholar] [CrossRef]
  20. Stacy, E.A.; Johansen, J.B.; Sakishima, T.; Price, D.K.; Pillon, Y. Incipient radiation within the dominant Hawaiian tree Metrosideros polymorpha. Heredity 2014, 113, 334–342. [Google Scholar] [CrossRef]
  21. Stacy, E.A.; Johansen, J.B.; Sakishima, T.; Price, D.K. Genetic analysis of an ephemeral intraspecific hybrid zone in the hypervariable tree, Metrosideros polymorpha, on Hawai’i Island. Heredity 2016, 117, 173–183. [Google Scholar] [CrossRef]
  22. Seeley, M.M.; Vaughn, N.R.; Shanks, B.L.; Martin, R.E.; König, M.; Asner, G.P. Classifying a highly polymorphic tree species across landscapes using airborne imaging spectroscopy. Remote Sens. 2023, 15, 4365. [Google Scholar] [CrossRef]
  23. Asner, G.P.; Knapp, D.E.; Boardman, J.; Green, R.O.; Kennedy-Bowdoin, T.; Eastwood, M.; Martin, R.E.; Anderson, C.; Field, C.B. Carnegie Airborne Observatory-2: Increasing science data dimensionality via high-fidelity multi-sensor fusion. Remote Sens. Environ. 2012, 124, 454–465. [Google Scholar] [CrossRef]
  24. Seeley, M.M.; Martin, R.E.; Vaughn, N.R.; Thompson, D.R.; Dai, J.; Asner, G.P. Quantifying the Variation in Reflectance Spectra of Metrosideros polymorpha Canopies across Environmental Gradients. Remote Sens. 2023, 15, 1614. [Google Scholar] [CrossRef]
  25. Farr, T.G.; Rosen, P.A.; Caro, E.; Crippen, R.; Duren, R.; Hensley, S.; Kobrick, M.; Paller, M.; Rodriguez, E.; Roth, L.; et al. The Shuttle Radar Topography Mission. Rev. Geophys. 2007, 45, 1–33. Available online: https://onlinelibrary.wiley.com/doi/abs/10.1029/2005RG000183 (accessed on 21 June 2023). [CrossRef]
  26. PRISM Climate Group, O.S.U. PRISM Gridded Climate Data 2014. Available online: https://prism.oregonstate.edu (accessed on 20 May 2023).
  27. Sherrod, D.R.; Sinton, J.M.; Watkins, S.E.; Brunt, K.M. Geologic Map of the State of Hawai’i; Open-File Report 2007-1089; U.S. Geological Survey: Reston, VA, USA, 2007. Available online: http://pubs.usgs.gov/of/2007/1089/ (accessed on 20 May 2023).
  28. Pedregosa, F.; Varoquaux, G.; Gramfort, A.; Michel, V.; Thirion, B.; Grisel, O.; Blondel, M.; Prettenhofer, P.; Weiss, R.; Dubourg, V.; et al. Scikit-learn: Machine Learning in Python. J. Mach. Learn. Res. 2011, 12, 2825–2830. [Google Scholar]
  29. Cordell, S.; Goldstein, G.; Mueller-Dombois, D.; Webb, D.; Vitousek, P.M. Physiological and morphological variation in Metrosideros polymorpha, a dominant Hawaiian tree species, along an altitudinal gradient: The role of phenotypic plasticity. Oecologia 1998, 113, 188–196. [Google Scholar] [CrossRef]
  30. Joel, G.; Aplet, G.; Vitousek, P.M. Leaf Morphology Along Environmental Gradients in Hawaiian Metrosideros Polymorpha. Biotropica 1994, 26, 17–22. [Google Scholar] [CrossRef]
  31. Martin, R.E.; Asner, G.P. Leaf Chemical and Optical Properties of Metrosideros polymorpha across Environmental Gradients in Hawaii. Biotropica 2009, 41, 292–301. [Google Scholar] [CrossRef]
  32. Waskom, M.L. seaborn: Statistical data visualization. J. Open Source Softw. 2021, 6, 3021. [Google Scholar] [CrossRef]
  33. Hayes, F.J.; Buchanan, S.W.; Coleman, B.; Gordon, A.M.; Reich, P.B.; Thevathasan, N.V.; Wright, I.J.; Martin, A.R. Intraspecific variation in soy across the leaf economics spectrum. Ann. Bot. 2019, 123, 107–120. [Google Scholar] [CrossRef]
  34. Vasseur, F.; Violle, C.; Enquist, B.J.; Granier, C.; Vile, D. A common genetic basis to the origin of the leaf economics spectrum and metabolic scaling allometry. Ecol. Lett. 2012, 15, 1149–1157. [Google Scholar] [CrossRef] [PubMed]
  35. Cordell, S.; Goldstein, G.; Meinzer, F.C.; Handley, L.L. Allocation of nitrogen and carbon in leaves of Metrosideros polymorpha regulates carboxylation capacity and δ13C along an altitudinal gradient. Funct. Ecol. 1999, 13, 811–818. [Google Scholar] [CrossRef]
  36. Corn, C.A.; Hiesey, W.M. Altitudinal Variation in Hawaiian Metrosideros. Am. J. Bot. 1973, 60, 991–1002. [Google Scholar] [CrossRef]
  37. Drake, D.R.; Mueller-Dombois, D. Population Development of Rain Forest Trees on a Chronosequence of Hawaiian Lava Flows. Ecology 1993, 74, 1012–1019. [Google Scholar] [CrossRef]
  38. Kitayama, K. Ecological and Genetic Implications of Foliar Polymorphism inMetrosideros polymorphaGaud. (Myrtaceae) in a Habitat Matrix on Mauna Loa, Hawaii. Ann. Bot. 1997, 80, 491–497. [Google Scholar] [CrossRef]
  39. Mueller-Dombois, D. Vegetation dynamics and the evolution of Metrosideros polymorpha in Hawaii. Phytocoenologia 1994, 24, 609–614. [Google Scholar] [CrossRef]
  40. Stemmermann, L. Ecological studies of Hawaiian Metrosideros in a successional context. Pac. Sci. 1983, 37, 361–373. [Google Scholar]
  41. Stemmermann, L.; Ihsle, T. Replacement of Metrosideros polymorpha, `Ohi`a, in Hawaiian Dry Forest Succession. Biotropica 1993, 25, 36–45. [Google Scholar] [CrossRef]
  42. Cordell, S.; Goldstein, G.; Meinzer, F.C.; Vitousek, P.M. Regulation of leaf life-span and nutrient-use efficiency of Metrosideros polymorpha trees at two extremes of a long chronosequence in Hawaii. Oecologia 2001, 127, 198–206. [Google Scholar] [CrossRef]
  43. Seeley, M.M.; Stacy, E.A.; Martin, R.E.; Asner, G.P. Foliar functional and genetic variation in a keystone Hawaiian tree species estimated through spectroscopy. Oecologia 2023, 202, 15–28. [Google Scholar] [CrossRef]
  44. Izuno, A.; Kitayama, K.; Onoda, Y.; Tsujii, Y.; Hatakeyama, M.; Nagano, A.J.; Honjo, M.N.; Shimizu-Inatsugi, R.; Kudoh, H.; Shimizu, K.K.; et al. The population genomic signature of environmental association and gene flow in an ecologically divergent tree species Metrosideros polymorpha (Myrtaceae). Mol. Ecol. 2017, 26, 1515–1532. [Google Scholar] [CrossRef]
  45. Gerdol, R.; Iacumin, P.; Tonin, R. Bedrock geology affects foliar nutrient status but has minor influence on leaf carbon isotope discrimination across altitudinal gradients. PLoS ONE 2018, 13, e0202810. [Google Scholar] [CrossRef]
  46. Midolo, G.; De Frenne, P.; Hölzel, N.; Wellstein, C. Global patterns of intraspecific leaf trait responses to elevation. Glob. Chang. Biol. 2019, 25, 2485–2498. [Google Scholar] [CrossRef]
  47. Körner, C. Alpine Treelines: Functional Ecology of the Global High Elevation Tree Limits; Springer Science & Business Media: Berlin/Heidelberg, Germany, 2012; ISBN 978-3-0348-0396-0. [Google Scholar]
  48. Körner, C. The nutritional status of plants from high altitudes. Oecologia 1989, 81, 379–391. [Google Scholar] [CrossRef]
  49. Albert, C.H.; de Bello, F.; Boulangeat, I.; Pellet, G.; Lavorel, S.; Thuiller, W. On the importance of intraspecific variability for the quantification of functional diversity. Oikos 2012, 121, 116–126. [Google Scholar] [CrossRef]
  50. Crutsinger, G.M.; Souza, L.; Sanders, N.J. Intraspecific diversity and dominant genotypes resist plant invasions. Ecol. Lett. 2008, 11, 16–23. [Google Scholar] [CrossRef]
  51. Des Roches, S.; Post, D.M.; Turley, N.E.; Bailey, J.K.; Hendry, A.P.; Kinnison, M.T.; Schweitzer, J.A.; Palkovacs, E.P. The ecological importance of intraspecific variation. Nat. Ecol. Evol. 2018, 2, 57–64. [Google Scholar] [CrossRef]
  52. Baldeck, C.A.; Asner, G.P.; Martin, R.E.; Anderson, C.B.; Knapp, D.E.; Kellner, J.R.; Wright, S.J. Operational Tree Species Mapping in a Diverse Tropical Forest with Airborne Imaging Spectroscopy. PLoS ONE 2015, 10, e0118403. [Google Scholar] [CrossRef]
  53. Balzotti, C.S.; Asner, G.P.; Adkins, E.D.; Parsons, E.W. Spatial drivers of composition and connectivity across endangered tropical dry forests. J. Appl. Ecol. 2020, 57, 1593–1604. [Google Scholar] [CrossRef]
  54. Chakravortty, S.; Shah, E.; Chowdhury, A.S. Application of Spectral Unmixing Algorithm on Hyperspectral Data for Mangrove Species Classification. In Proceedings of the Applied Algorithms: First International Conference, ICAA 2014, Kolkata, India, 13–15 January 2014; Gupta, P., Zaroliagis, C., Eds.; Springer International Publishing: Cham, Switzerland, 2014; pp. 223–236, (Lecture Notes in Computer Science). [Google Scholar]
  55. Pontius, J.; Hanavan, R.P.; Hallett, R.A.; Cook, B.D.; Corp, L.A. High spatial resolution spectral unmixing for mapping ash species across a complex urban environment. Remote Sens. Environ. 2017, 199, 360–369. [Google Scholar] [CrossRef]
  56. Shang, X.; Chisholm, L.A. Classification of Australian Native Forest Species Using Hyperspectral Remote Sensing and Machine-Learning Classification Algorithms. IEEE J. Sel. Top. Appl. Earth Obs. Remote Sens. 2014, 7, 2481–2489. [Google Scholar] [CrossRef]
  57. Somers, B.; Asner, G.P. Tree species mapping in tropical forests using multi-temporal imaging spectroscopy: Wavelength adaptive spectral mixture analysis. Int. J. Appl. Earth Obs. Geoinf. 2014, 31, 57–66. [Google Scholar] [CrossRef]
  58. Torabzadeh, H.; Leiterer, R.; Hueni, A.; Schaepman, M.E.; Morsdorf, F. Tree species classification in a temperate mixed forest using a combination of imaging spectroscopy and airborne laser scanning. Agric. For. Meteorol. 2019, 279, 107744. [Google Scholar] [CrossRef]
Figure 1. Random forest feature importance rankings of environmental factors in predicting canopy traits.
Remotesensing 15 04707 g001
Figure 2. Boxplot of Metrosideros polymorpha canopy traits across its (a) elevation and (b) soil substrate age range on Hawai’i Island. Colors correspond to x axis values.
Remotesensing 15 04707 g002
Figure 3. Metrosideros polymorpha canopy traits grouped according to elevation across a soil substrate age gradient.
Remotesensing 15 04707 g003
Figure 4. Leaf mass per area (LMA) plotted against canopy percent nitrogen (N). Colors represent elevation ranges. The black line represents the linear regression between log N and LMA.
Remotesensing 15 04707 g004
Figure 5. Linear regression plots where three canopy traits (leaf mass per area, chlorophyll a+b, and phosphorus) are plotted separately against canopy nitrogen. Colors in the left column represent elevation ranges while those in the right column represent soil substrate age ranges. See Table S1 for the slope and r2 of each relationship.
Remotesensing 15 04707 g005
Table 1. Slope and r2 of linear regression between Metrosideros polymorpha canopy traits and environmental factors. Rows below the elevation range title represent the relationship between soil substrate age and leaf traits within each elevation range. Elevation and soil substrate age were both treated as categorical rather than continuous variables. Elevation ranges were: 0–150, 150–300, 300–600, 600–900, 900–1200, 1200–1500, 1500–1800, 1800–2100, and 2100–3000 m. Age ranges were grouped as follows: 0–500, 500–1000, 1000–5000, 5000–15,000, 15,000–50,000, and 50,000–400,000 years.
Leaf Mass per AreaChlorophyll a+bCarotenoidsTotal CarbonNitrogenPhosphorusPhenolsCelluloseTop of Canopy Height
ElevationSlope16.972−0.118−0.095−2.256−0.074−0.037−5.179−0.5000.121
R20.2820.1620.1660.2050.1570.0390.0550.1600.003
Soil
Substrate
Age
Slope−6.9080.0980.0831.7020.0730.0276.9340.4430.437
r20.0210.0510.0570.0530.0700.0100.0450.0570.015
Elevation Ranges:
0–150Slope−6.9500.1320.0902.2910.0560.0974.5630.1620.190
r20.0320.0860.0610.1310.0420.1080.0280.0140.003
150–300Slope−15.1610.2220.1782.0470.1290.0216.7400.587−0.110
r20.1330.1980.1970.1070.1910.0080.0590.1600.001
300–600Slope−8.2000.1410.1161.2540.0970.0004.9730.4490.576
r20.0510.1080.1160.0430.1310.0000.0280.0840.026
600–900Slope−7.3460.0950.0822.0630.0690.0339.1780.5520.397
r20.0420.0690.0820.1080.0840.0160.0860.1040.013
900–1200Slope−9.8840.0600.0651.7800.0650.0129.2190.5560.595
r20.0740.0340.0580.0970.0760.0020.0990.1190.024
1200–1500Slope−5.9060.0980.0912.1330.0970.02011.2090.7080.883
r20.0280.0910.1230.1370.1760.0080.1510.1960.068
1500–1800Slope−7.7010.0960.0761.6200.0660.0655.5340.3140.879
r20.0470.0910.0920.0740.0980.0660.0340.0410.067
1800–2100Slope−5.6690.0990.0832.2950.0880.07610.1070.6590.482
r20.0130.0600.0680.1180.1130.0680.0850.1170.020
2100–3000Slope−11.1260.0090.0251.3800.044-0.0623.9000.3570.186
r20.0560.0010.0100.0370.0390.0400.0100.0300.007
Disclaimer/Publisher’s Note: The statements, opinions and data contained in all publications are solely those of the individual author(s) and contributor(s) and not of MDPI and/or the editor(s). MDPI and/or the editor(s) disclaim responsibility for any injury to people or property resulting from any ideas, methods, instructions or products referred to in the content.

