Article

Co-Occurrence of Atmospheric and Oceanic Heatwaves in the Eastern Mediterranean over the Last Four Decades

1
Department of Geography and Geographical Information Systems, Faculty of Arts, Tanta University, Tanta 31527, Egypt
2
Oceanography Department, Faculty of Science, Alexandria University, Alexandria 21500, Egypt
3
Astronomy and Meteorology Department, Faculty of Science, Al-Azhar University, Cairo 11884, Egypt
4
Marine Institute, H91 R673 Galway, Ireland
*
Author to whom correspondence should be addressed.
Remote Sens. 2023, 15(7), 1841; https://doi.org/10.3390/rs15071841
Submission received: 5 February 2023 / Revised: 22 March 2023 / Accepted: 28 March 2023 / Published: 30 March 2023

Abstract

:
Heatwaves are now considered one of the main stressors of global warming. As a result of anthropogenic warming, atmospheric and oceanic heatwaves have increased in frequency, intensity and duration in recent decades. These extreme events have recently become a major concern in climate research due to their economic and environmental impacts on ecosystems. In this study, we investigated the co-occurrence and relationship between atmospheric and marine heatwaves (AHW/MHW) in the Eastern Mediterranean (EMED) over the last four decades (1982–2021). Furthermore, the spatio-temporal variability and trends of sea surface temperature (SST), near-surface air temperature (SAT), AHW and MHW characteristics (frequency and duration) were examined. For these objectives, we used daily gridded high-resolution satellite SST data (0.05° × 0.05°) and the fifth generation European Centre for Medium-Range Weather Forecasts (ECMWF-ERA5) atmospheric reanalysis SAT and wind components (0.25° × 0.25°). The results showed an average warming trend of about 0.38 ± 0.08 °C/decade and 0.43 ± 0.05 °C/decade for SAT and SST, respectively. A high statistically significant (p < 0.05) correlation (R = 0.90) was found between AHW and MHW frequency. Our results showed that more than half of the MHWs in the EMED co-occurred with AHWs throughout the study period. The most intense summer MHW in 2021, which co-occurred with AHW, was associated with higher positive anomalies of SAT and SST, and a decrease in the wind speed anomaly.

1. Introduction

The impacts of climate change have become apparent globally and are evident in changes in various extreme weather events such as heatwaves, dust storms, thunderstorms, and droughts [1,2,3,4]. These extreme events, particularly atmospheric and marine heatwaves (AHW, MHW), have recently become a major concern of many studies (e.g., [5,6,7,8,9]) due to their devastating economic and environmental impacts on ecosystems [10]. Heatwaves, whether atmospheric or marine, are one of the most significant indicators of global warming [11,12,13]; they have become more frequent, intense, and prolonged in recent decades in several regions [14,15,16,17,18,19,20,21]. Atmospheric or marine heatwaves are usually defined as prolonged periods of extreme warming during which air or sea surface temperatures exceed the 90th percentiles of their reference period temperatures [22,23]. Prolonged periods of extreme warming are considered to be three consecutive days for atmospheric heatwaves (AHW) [22] and five consecutive days for marine heatwaves (MHW) [23]. MHWs have various negative consequences on marine life, alter species distribution, and reduce carbon sequestration because of the high mortality of seagrasses and other species vital to habitats [24]. Heatwaves are not confined to the atmosphere, but are increasingly being studied in the marine environment as well [13,25,26,27,28]. Although there are several studies that have investigated AHWs or MHWs independently, there are still ongoing searches for a possible link between them, with some regional studies having taken place [28,29]. This is critically important because the ecological and economic impacts of the coincidence of AHWs and MHWs could be greater than those of a single event [28]. Moreover, there is also an increased risk of heat stress in marginal seas during co-occurring heat waves [28].
Several studies on AHWs have been conducted in the Mediterranean region, such as in the Eastern Mediterranean (EMED) [30], the Middle East and North Africa in 2010 [31,32], and the Euro-Mediterranean in 2017 [33]. Similarly, MHWs have been well documented in the Mediterranean Sea; for example, a severe MHW occurred in the northern Mediterranean in 2003 [15,34,35,36,37,38]. However, there are no published studies that investigate the combination of AHWs and MHWs in the EMED region. The SST analysis of [37] found that since 2000, the Mediterranean Sea had the highest SST values which can be associated with severe MHWs, such as those that occurred in 2003, 2006, and 2015. The MHW study [38] concluded that, due to the increasing frequency of MHWs, the Mediterranean Sea is experiencing an acceleration of ecological impacts that pose an unprecedented threat to its ecosystems. According to [39], the 2003 MHW is considered the longest and most severe event of this period, with the highest mean intensity and the largest extent of the event. Ref [15] found that the mean frequency and duration of MHWs increased by 40% and 15%, respectively, during the last two decades of their study from 2001 to 2020. Ref [39] investigated surface and subsurface MHWs in the Mediterranean Sea using an SST satellite from 1982 to 2020, and in situ temperature measurements from 2012 to 2020. They found that the MHW’s frequency and duration trends ranged from 1.05 to 1.77 events/decade, and 1.6 to 3.7 days/decade, respectively. Ref. [21] examined SST variability and MHWs over the Aegean and Ionian basins from 2008 to 2021 and found that the most intense MHWs occurred in the summers of 2012 and 2018. The authors of [21,40] found that the frequency of MHWs in the EMED ranged from 1 to 1.8 events/decade, with an average of 1.2 events/decade from 1982 to 2021, and concluded that all MHW characteristics (frequency, duration, and intensity) accelerated during the last two decades (2000–2021), which was consistent with [15]. According to [41], which studied MHWs in the Mediterranean Sea between 1982 and 2021, the 2019 summer MHW event was more intense than the 2003 one. MHW study from 1987 to 2019 [42] found that the MHW frequency was higher at the surface than in the subsurface in most basins of the Mediterranean Sea, while the duration of MHWs was longer in the subsurface than at the surface all over the Mediterranean Sea. A recent study on MHWs from 1982 to 2020 [43] found that more than half of all MHW events in the Mediterranean were recorded in the last decade (2011–2020).
The lack of knowledge about the co-occurrence of AHWs and MHWs in EMED motivated the authors to investigate their co-occurrence over the last four decades (1982–2021). For this purpose, we used daily high-resolution (0.05° × 0.05°) SST satellite data. In addition, we used atmospheric variables (air temperature and wind components) obtained from the hourly gridded (0.25° × 0.25°) ERA5 reanalysis dataset during the aforementioned period. Thus, our analysis assesses the following issues: (1) investigation of the spatiotemporal variability and trends of atmospheric and oceanic heat waves in the Eastern Mediterranean during the last four decades (1982–2021); (2) investigation of the co-occurrence and relationship between AHWs and MHWs; (3) elaboration on one of these co-occurring events in 2021 and investigation into the anomalies of atmospheric conditions during this event.

2. Datasets and Methods

2.1. Study Area and Data Sources

The study area covers latitudes from 30° to 41°N and longitudes from 13° to 36.5°E, as demonstrated in Figure 1. The EMED is divided into three sub-basins (i.e., Levantine, Ionian and Aegean, see Figure 1).
To detect MHWs and their main characteristics (frequency and total days), we used a daily gridded high-resolution (0.05° × 0.05°) SST dataset from the Copernicus Marine Environment Monitoring Service website (CMEMS) [44,45,46]. This dataset, from 1 January 1982 to 31 December 2021, is freely available on the following website: (https://resources.marine.copernicus.eu/?option=com_csw&view=details&product_id=SST_GLO_SST_L4_REP_OBSERVATIONS_010_011, last access: 28 December 2022). This product merges different satellite sensors and in situ observations to produce daily gap-free SST maps [44,45,46,47]. The CMEMS SST reprocessed (REP) global dataset provides a reliable and consistent long-term SST time series for the Mediterranean Sea created for climatic applications [44,45,46,47]. To identify the AHWs, we obtained near-surface air temperature (SAT) and wind velocity components (u10, v10) from the European Centre for Medium-Range Weather Forecasts ERA5 reanalysis. The ERA5 dataset provides hourly estimates of different atmospheric parameters with a spatial resolution (0.25° × 0.25°) [48]. The obtained oceanic and atmospheric datasets cover the period from 1 January 1982 to 31 December 2021.

2.2. Detection of Atmospheric and Oceanic Heatwaves

To examine the AHWs, we followed the definition of Perkins and Alexander [22,49], who defined the AHW as a period of time during which the daily SAT exceeds the climatological daily 90th percentile for at least three continuous days. For the MHWs, we used the definition of Hobday et al. [23], who defined the MHW as a period of time during which the daily mean SST is above the 90th percentile for at least five consecutive days. Our baseline climatology for both SAT and SST was from 1982 to 2021, which is recommended by [22,23], which suggested that the baseline should be at least 30 years. The MATLAB software R2020b and Marine Heatwaves toolbox (M_MHW) [50] were used to estimate trends and to detect all heatwave characteristics (frequency and total days). The M_MHW toolbox can be freely downloaded at this website: https://github.com/ZijieZhaoMMHW/m_mhw1.0; accessed on 20 December 2022.
The linear trends of deseasonalized SAT and SST anomalies (SATA and SSTA) and the characteristics of AHWs and MHWs (frequency and total number of days) were estimated using the least squares method [49]. The SATAs and SSTAs were estimated relative to the daily climatology (i.e., after removing the seasonal cycle) [51,52]. To investigate statistically significant trends, we used the modified Mann–Kendall (MMK) test [53] at α = 0.05 (p ≤ 0.05) with a 95% confidence level. The purpose of the MMK test [53,54] is to statistically estimate whether there is a monotonic upward or downward trend. A monotonic upward (downward) trend means that the variable is consistently increasing (decreasing) over time. The null hypothesis for the Mann–Kendall test is that there is no trend in the series; the alternative hypothesis is that the trend exists [51]. The trends estimated in this paper passed the test (the null hypothesis was rejected; 95% confidence level) [51]. Uncertainty in the linear trends of SATA and SSTA was calculated using a standard statistical method [55]. For the correlation analysis between AHW and MHW, a cubic spatial interpolation was applied [56] to the MHWs characteristic to obtain the spatial resolution of (0.25° × 0.25°) as for AHWs.
The distribution of annual events and days of AHWs, MHWs and their co-occurrence in each year was estimated as the average incidence across all grid cells over EMED, while their total frequency distribution was computed as an aggregate over all grid cells during all years of the study period using the method of [28].

3. Results and Discussion

3.1. Climatological Mean and Trends of SST and SAT

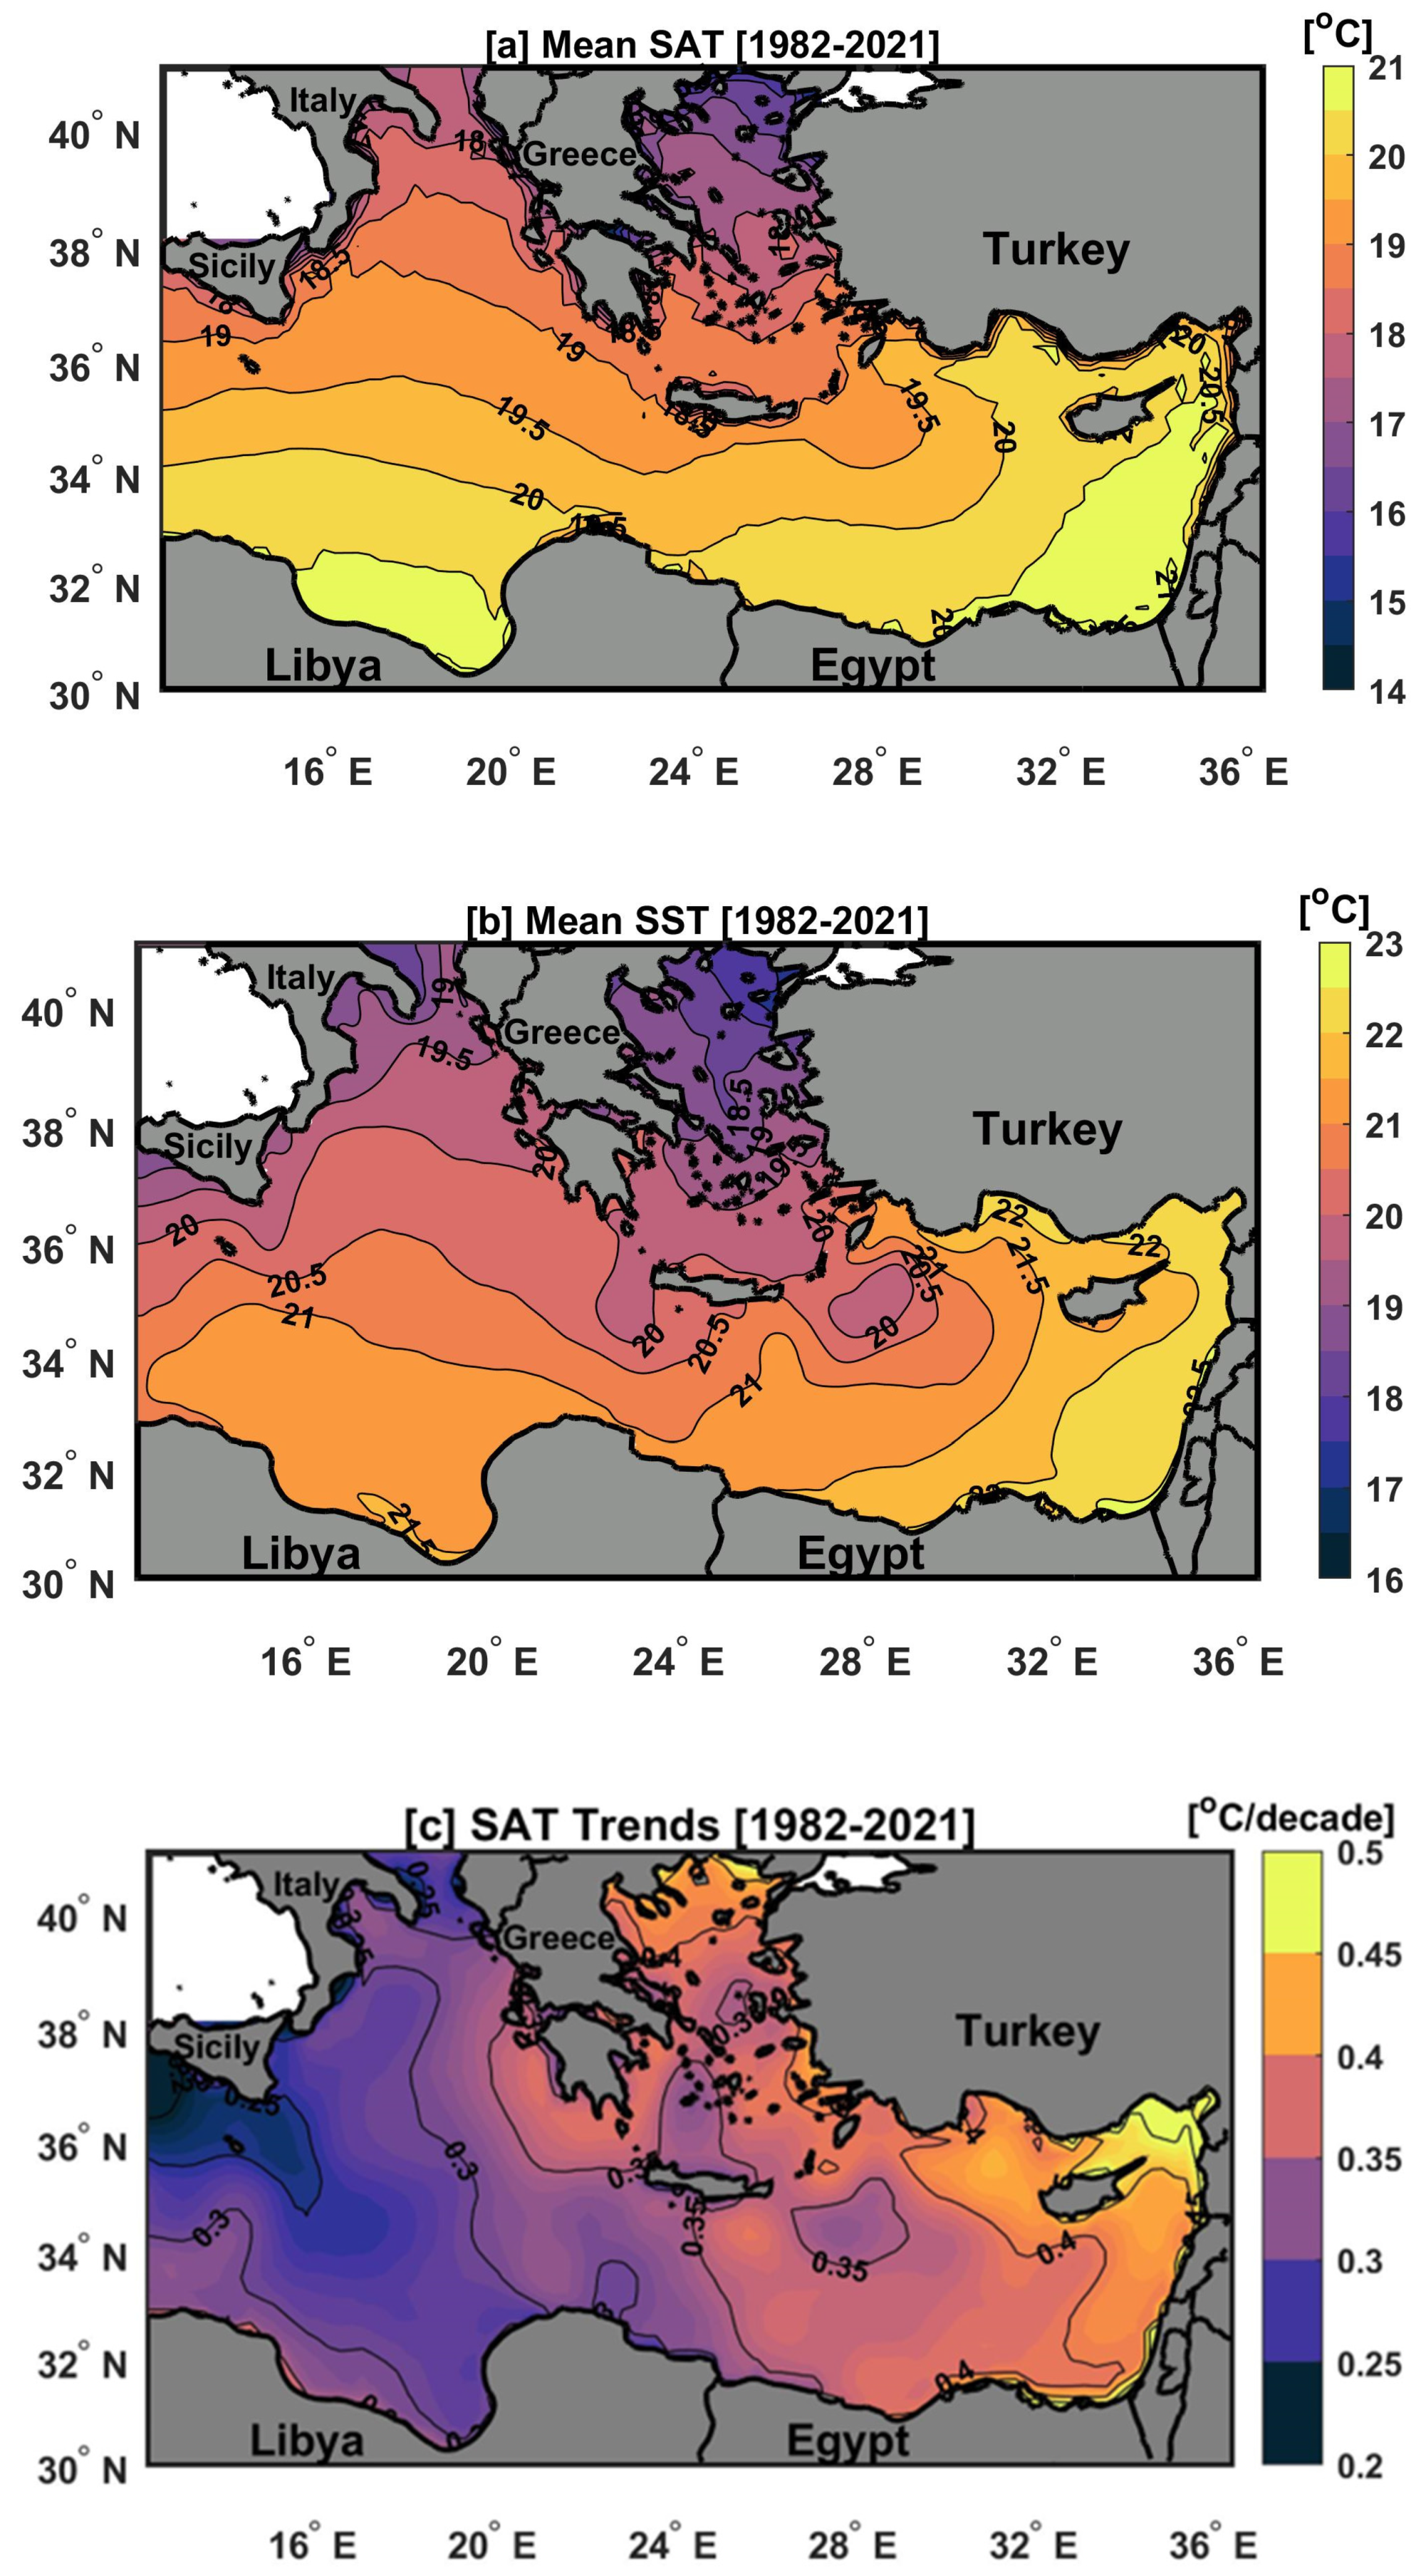
Figure 2a–d show the spatial distribution of mean values and trends for atmospheric and oceanic temperatures over the last four decades (1982–2021). The highest climatological mean values of SAT (>20 °C) and SST (>22 °C) were found along the African coast and in the eastern part of the Levantine Basin (Figure 2a,b), whereas the lowest values (<18 °C) for both SAT and SST were observed in the northern part of the Aegean Sea and in the southern Adriatic Basin (Figure 2a,b). There was a gradual decrease in both temperatures from south to north and from east to west of the EMED, in agreement with [23,57]. Statistically significant (p < 0.05) trends were observed for both atmospheric and oceanic temperatures over the whole EMED (Figure 2c,d). There were significant spatial variations in atmospheric and oceanic temperature trends, with the largest atmospheric temperature trend (>0.45 °C) identified in the north-eastern part of the Levantine Basin. The Aegean and Levantine Basins had larger SST trends (>0.5 °C/decade), while the Ionian basin had lower values (<0.3 °C/decade). The maximum SST trend (>0.6 °C/decade) was observed in the Rhodes cyclonic Gyre region, which could be due to the higher SST variability in this area, as described by [51]. The basin average warming trends for SAT and SST were about 0.38 ± 0.08 °C/decade and 0.43 ± 0.05 °C/decade, respectively, over the whole study period. The spatial pattern of the SST trend was in good agreement with that reported by [58]. In that study, a stronger SST trend was found in the Levantine Basin, with values up to 0.6 °C/decade in the Cretan Arc and west and south of Cyprus, while a much weaker warming (0.1 °C/decade) was found southeast of Crete. Our SST trend was slightly higher than that observed by [15], which found an average SST trend of about 0.33 ± 0.04 °C/decade for the EMED basin from 1982 to 2020. This increase could be due to the use of a high-resolution dataset (0.05° × 0.05°).

3.2. Temporal Variability of Atmospheric and Marine Heatwaves

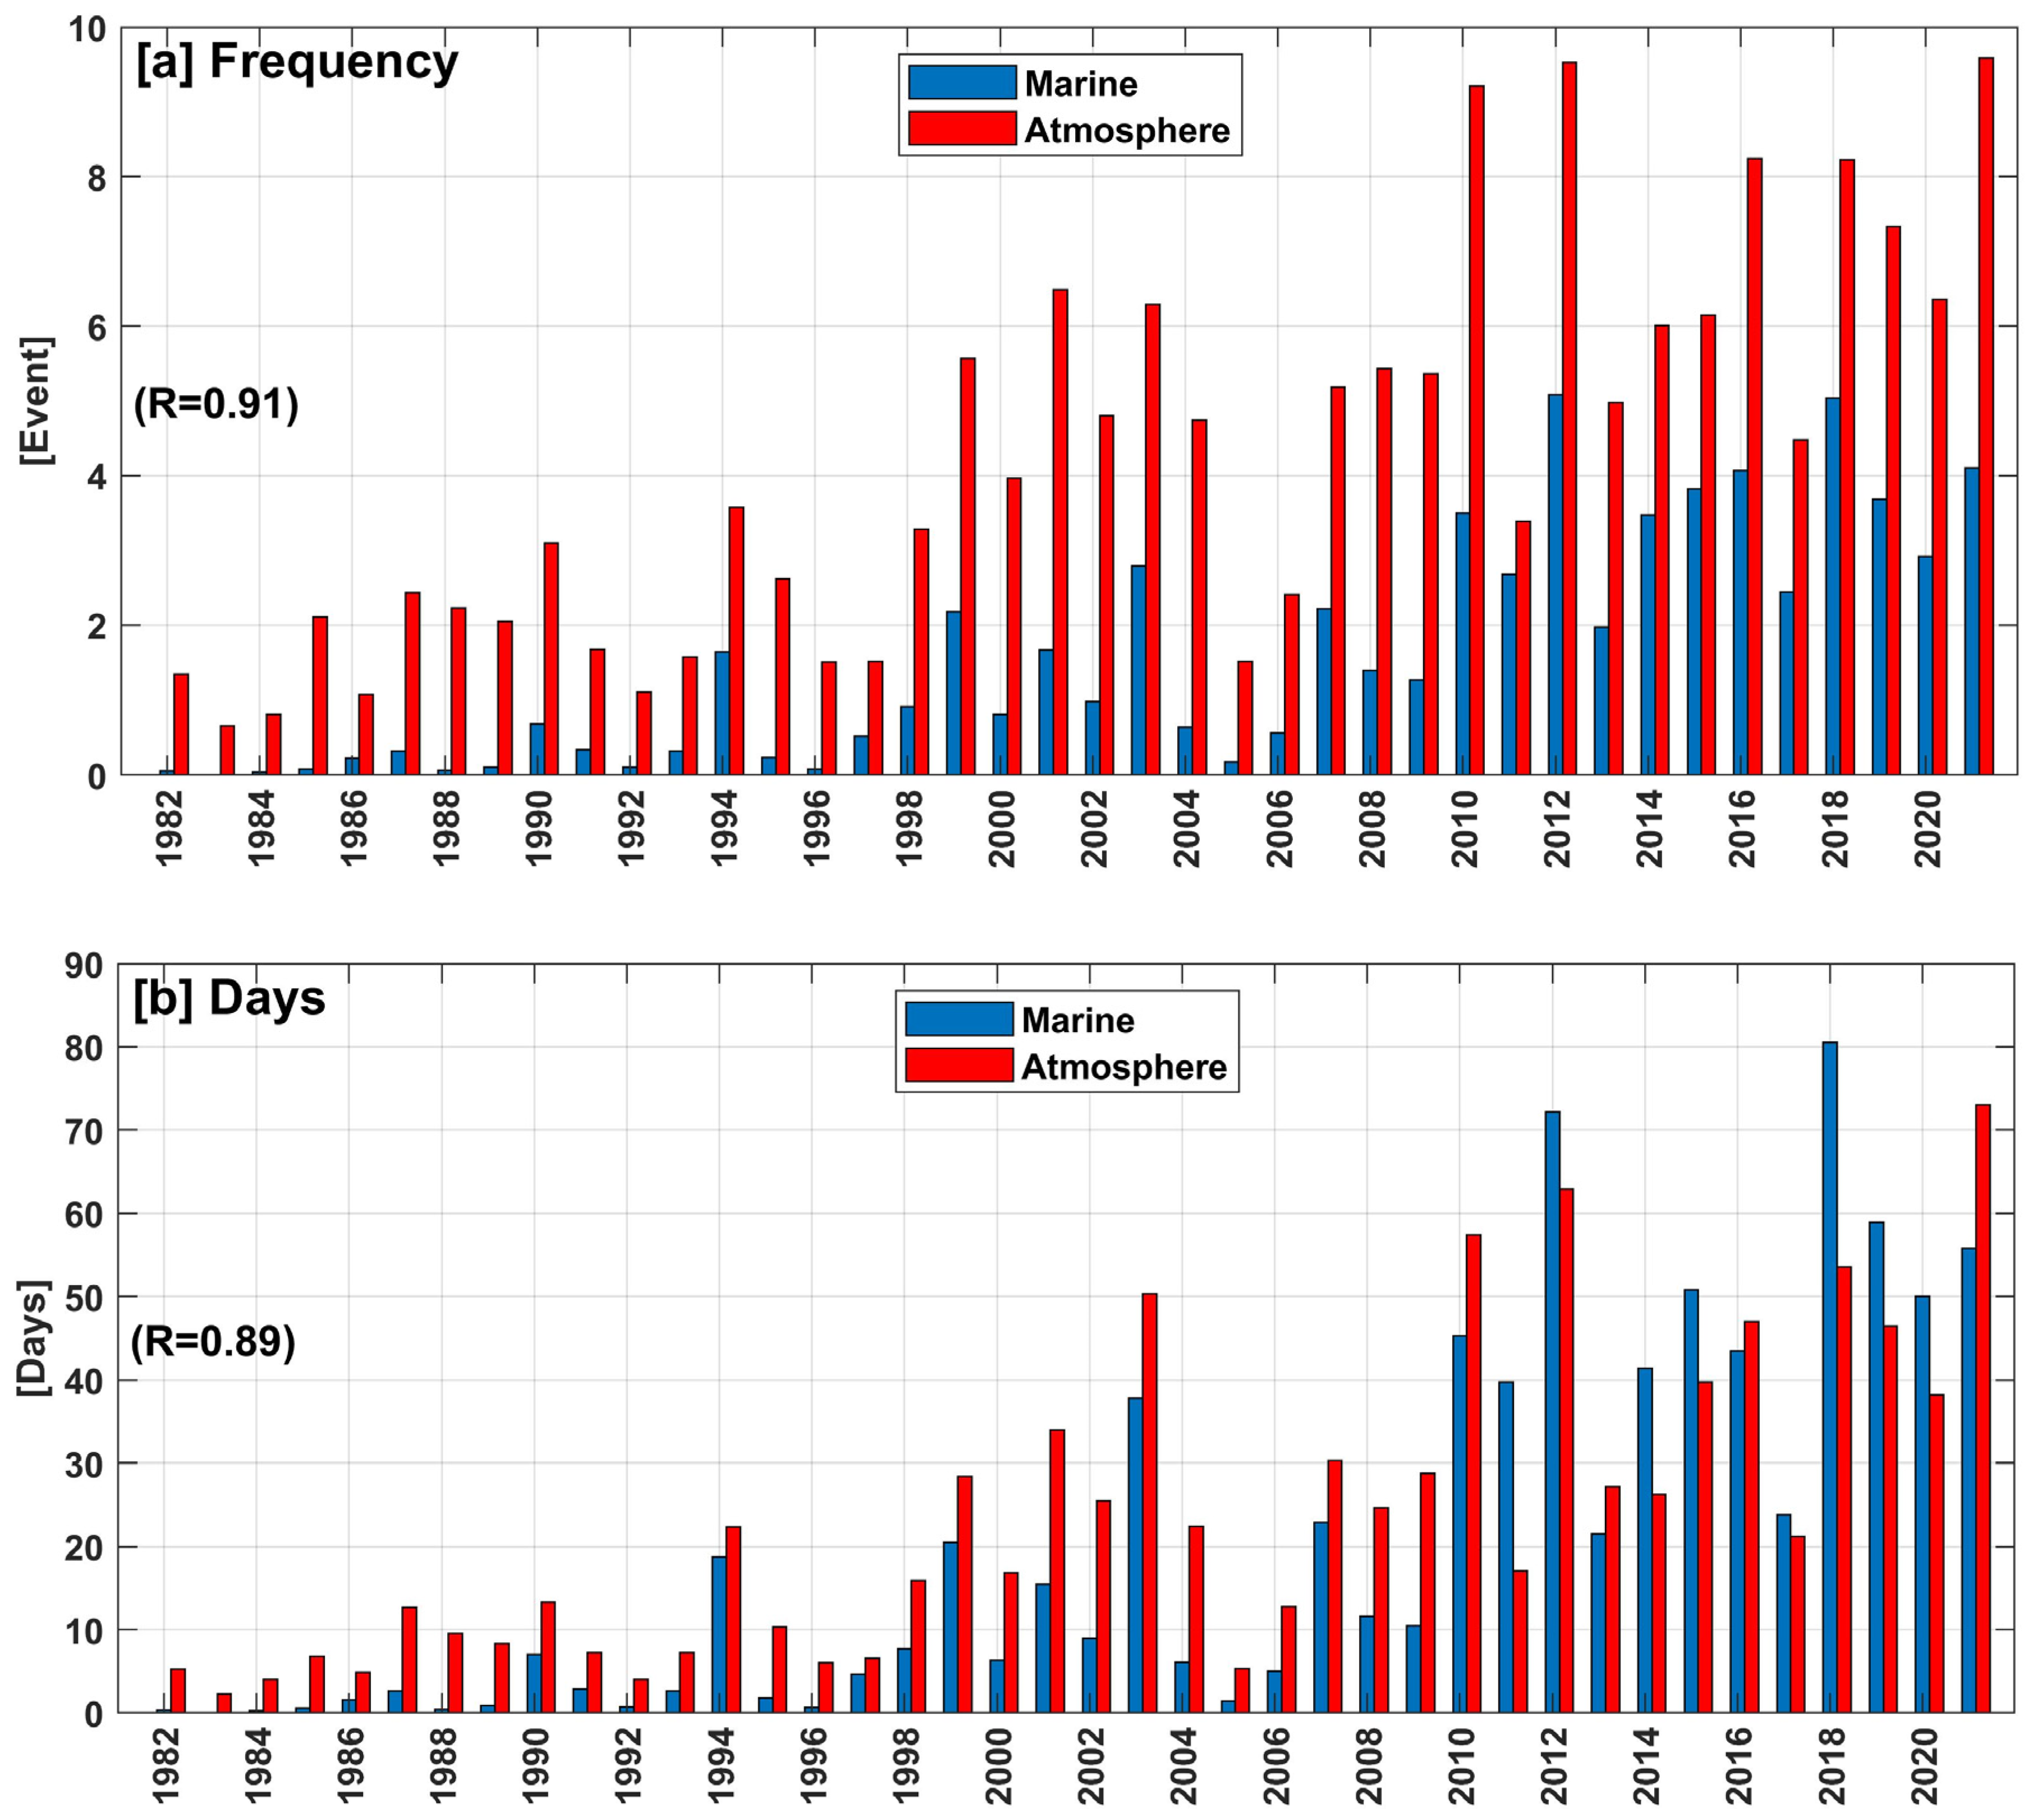
In this section, we investigate the temporal variability of AHW/MHW days and frequency in the EMED and their correlation from 1982 to 2021 (Figure 3). Figure 3a shows that the highest AHW frequencies (up to 8 events) were detected in 2010, 2012, 2016, 2018 and 2021, while the highest MHW frequencies (>4 events) were observed in 2012 and 2018. Our MHW frequency results are consistent with [35,41], which found the highest MHW frequency in 2012 and 2018 over the Mediterranean basin. The highest total days for AHW (>50 days) and MHW (>40 days) were found in 2003, 2010, 2012, 2018 and 2021 (Figure 3b). The 2003 MHW event in the Mediterranean has been well documented in many previous studies e.g., [23,39,41] and has been linked to atmospheric factors, whereas the highest MHW frequencies that occurred in 2012 and 2015 are consistent with [35]. In the last decade (2012–2021), AHWs and MHWs have become more frequent (Figure 3a) and have lasted longer (Figure 3b) than in the previous period. More than 60% and 43% of all AHWs and MHWs, respectively, were observed in the last decade. In addition, about 57% and 38% of the total AHW and MHW days occurred in the last decade. A highly statistically significant (p > 0.05) correlation between AHWs and MHWs frequency was found (R = 0.91), while the correlation between AHW and MHW total days was about 0.89. In summary, we found a statistically significant (p < 0.05) increase in the annual frequency of AHW and MHW, with approximately 1.6 ± 0.4 and 1.1 ± 0.2 events/decade, respectively, over the entire study period (1982–2021). The total days’ trends for AHW and MHW were about 10.5 ± 2.7 and 14.7 ± 3.4 days/decade, respectively.

3.3. Relationship between Compound AHWs and MHWs

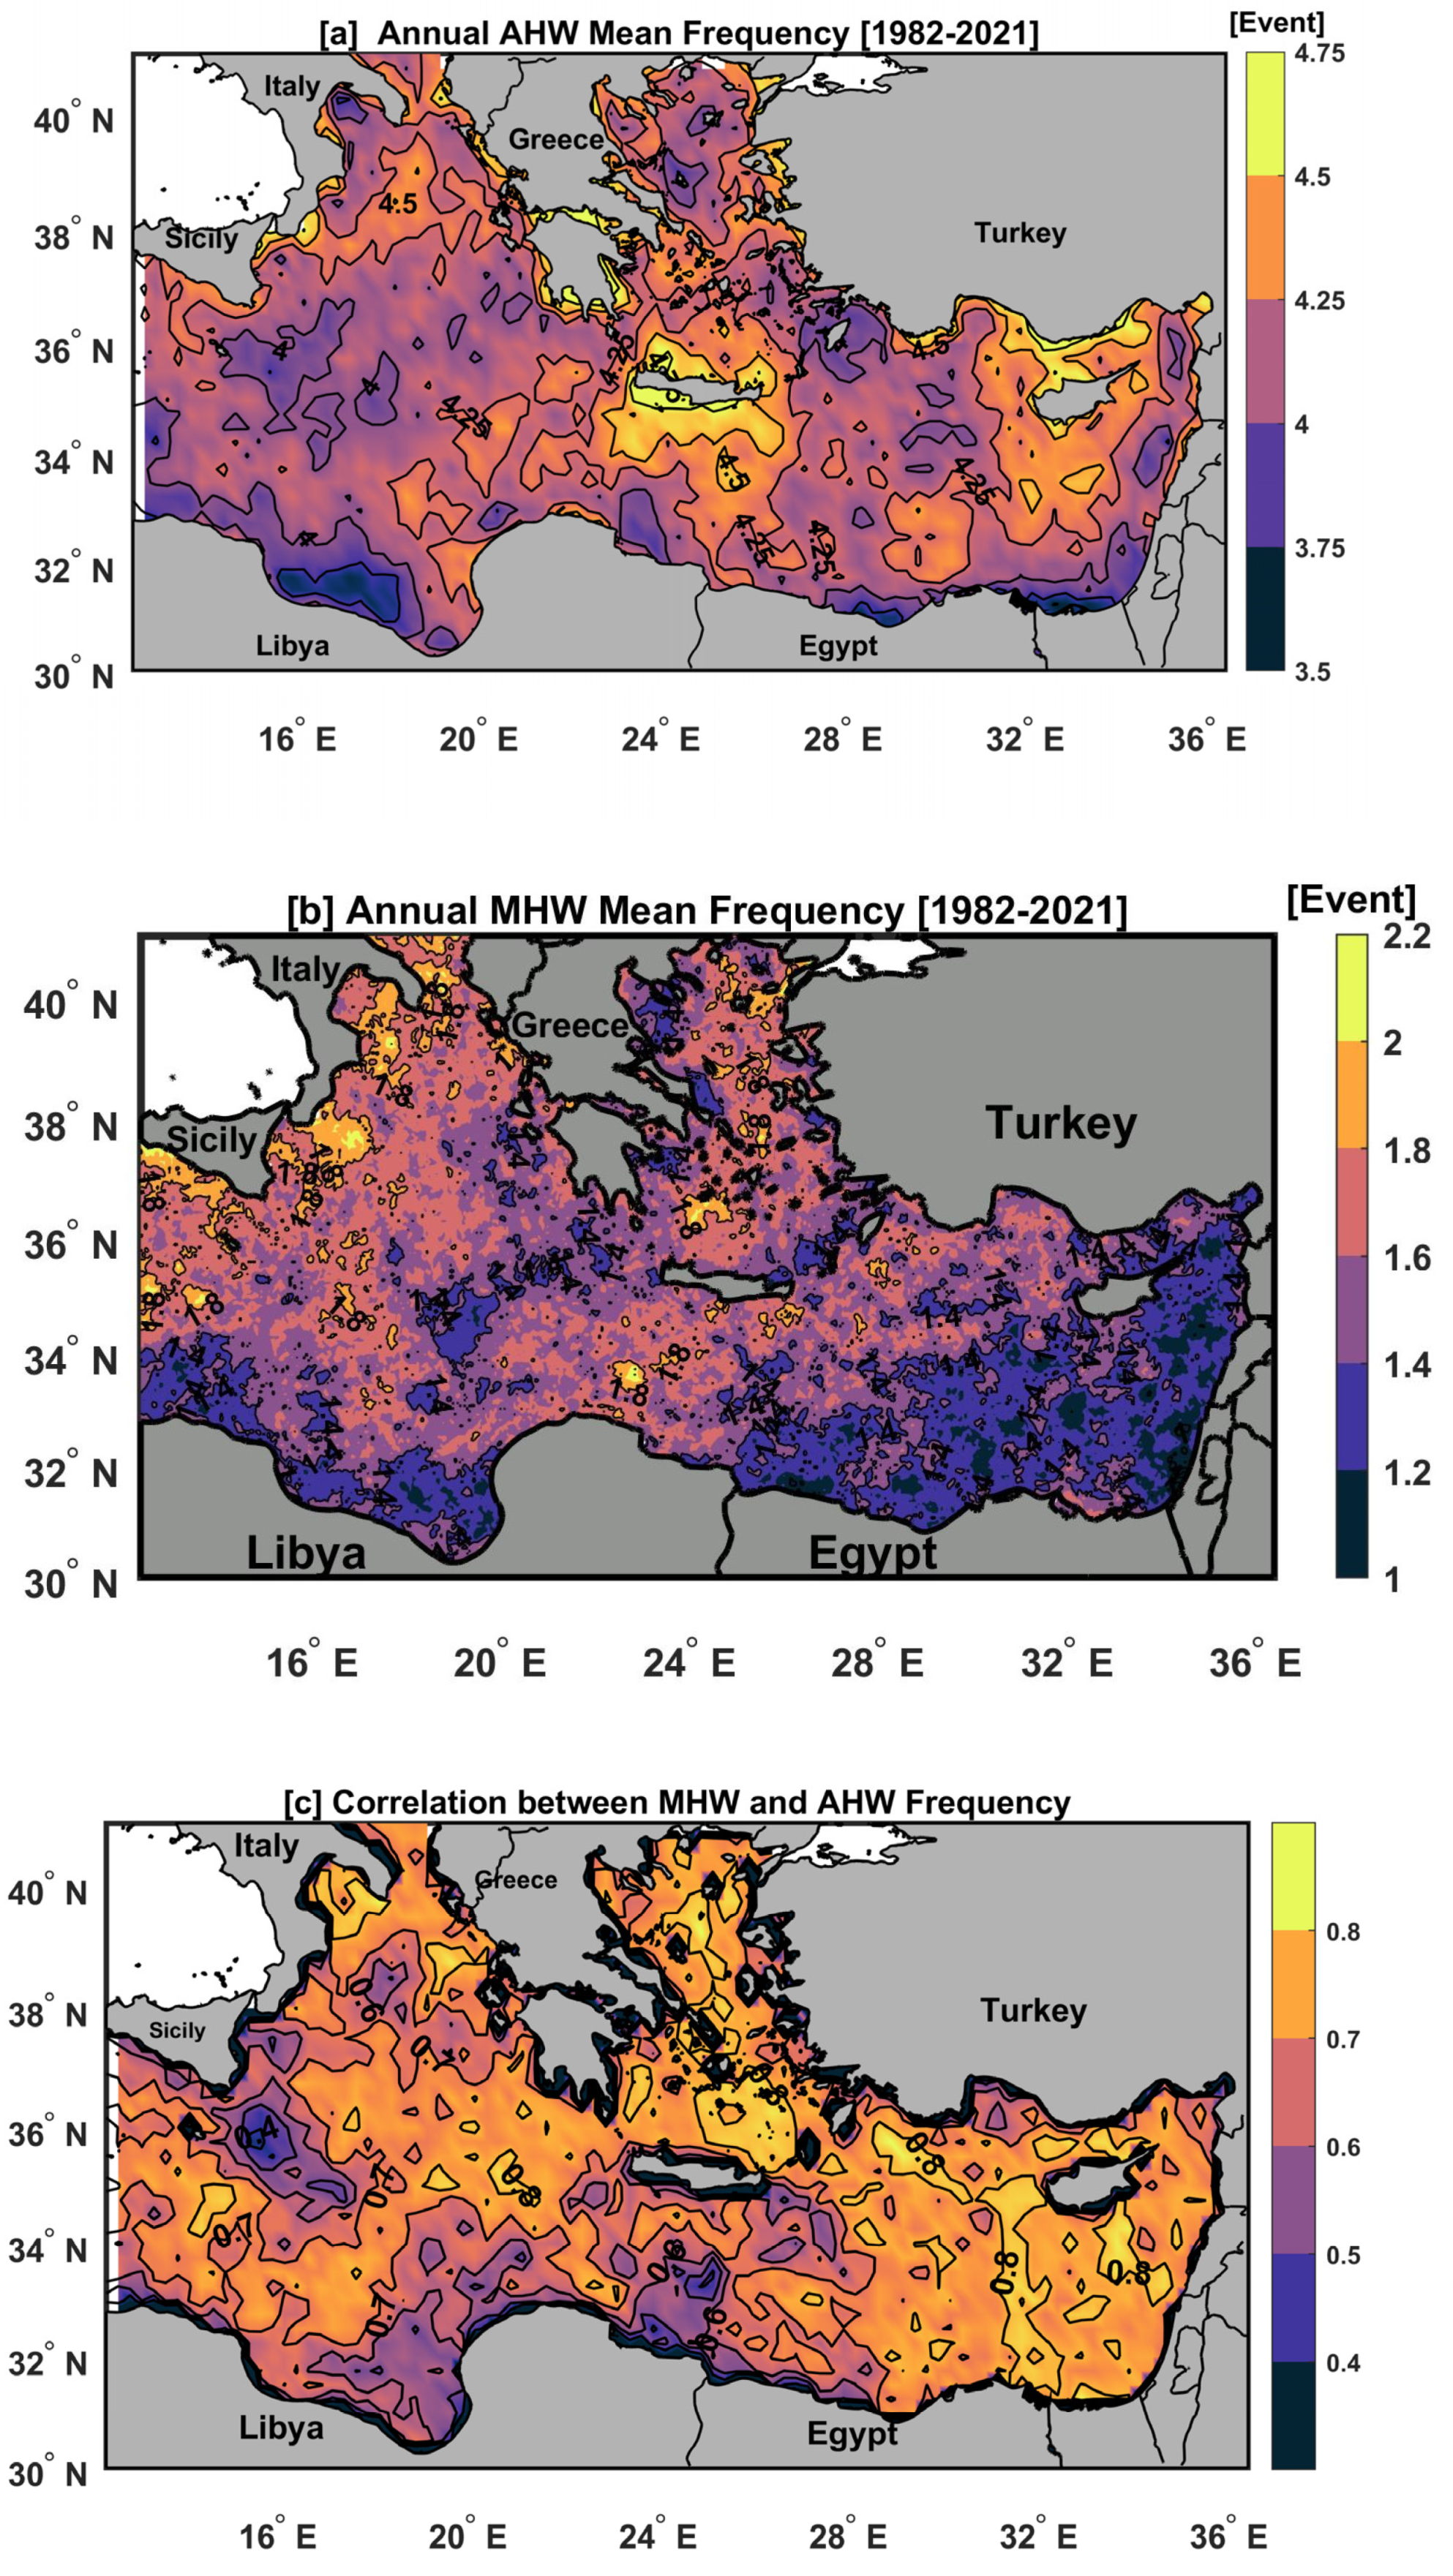
Figure 4a–c show the spatial distribution of annual mean AHW and MHW frequencies and the relationship between them from 1982 to 2021. Annual AHW frequencies ranged from 3.5 to 4.75 events, with the highest values (>4.5 events) around Cyprus and Crete (Figure 4a). The lowest AHW frequencies (<3.75 events) were found along the African coast of Egypt and Libya. The Ionian Basin generally has a lower AHW frequency than the Levantine Basin (see Figure 4a). The MHW frequency was higher in the northern Ionian and Aegean Seas (>2 events) than in the Levantine Basin (<1.4 events) (Figure 4b). These spatial distributions of the MHW frequency findings generally agree with those of [15], except for the southern and eastern parts of Sicily, which have a higher MHW frequency (>1.8 events; Figure 4b). This could be due to the use of high resolution (0.05° × 0.05°) SST data.
The frequencies of AHWs and MHWs were highly significantly correlated (p < 0.05) for the entire study area (Figure 4c). The highest correlation (R~0.8) was found in most parts of the Levantine and Aegean Seas, while the lowest correlation (R < 0.5) was found in three places in the Ionian Basin (i.e., in the area 38–39°N, 17–19°E, south of the island of Sicily, and off the Libyan coast). This low correlation in the area 38–39°N, 17–19°E could be an indirect effect of the Bimodal Oscillation System (BiOS) [59,60,61,62,63], which does not allow a clear identification of MHWs in this region, as mentioned in [15]. BiOS is a decadal circulation periodic reversal area from cyclones to anti-cyclones [63]. The other two low correlation sites are in south-eastern Sicily and off the Libyan coast. These low correlations could be due to the presence of the anticyclonic gyres of the Maltese Channel Crest (MCC) and the Sirte, respectively. The locations of these gyres are well defined by [64,65]. Moreover, this could also be due to the position of the Mid Ionian Jet (MIJ) [64].
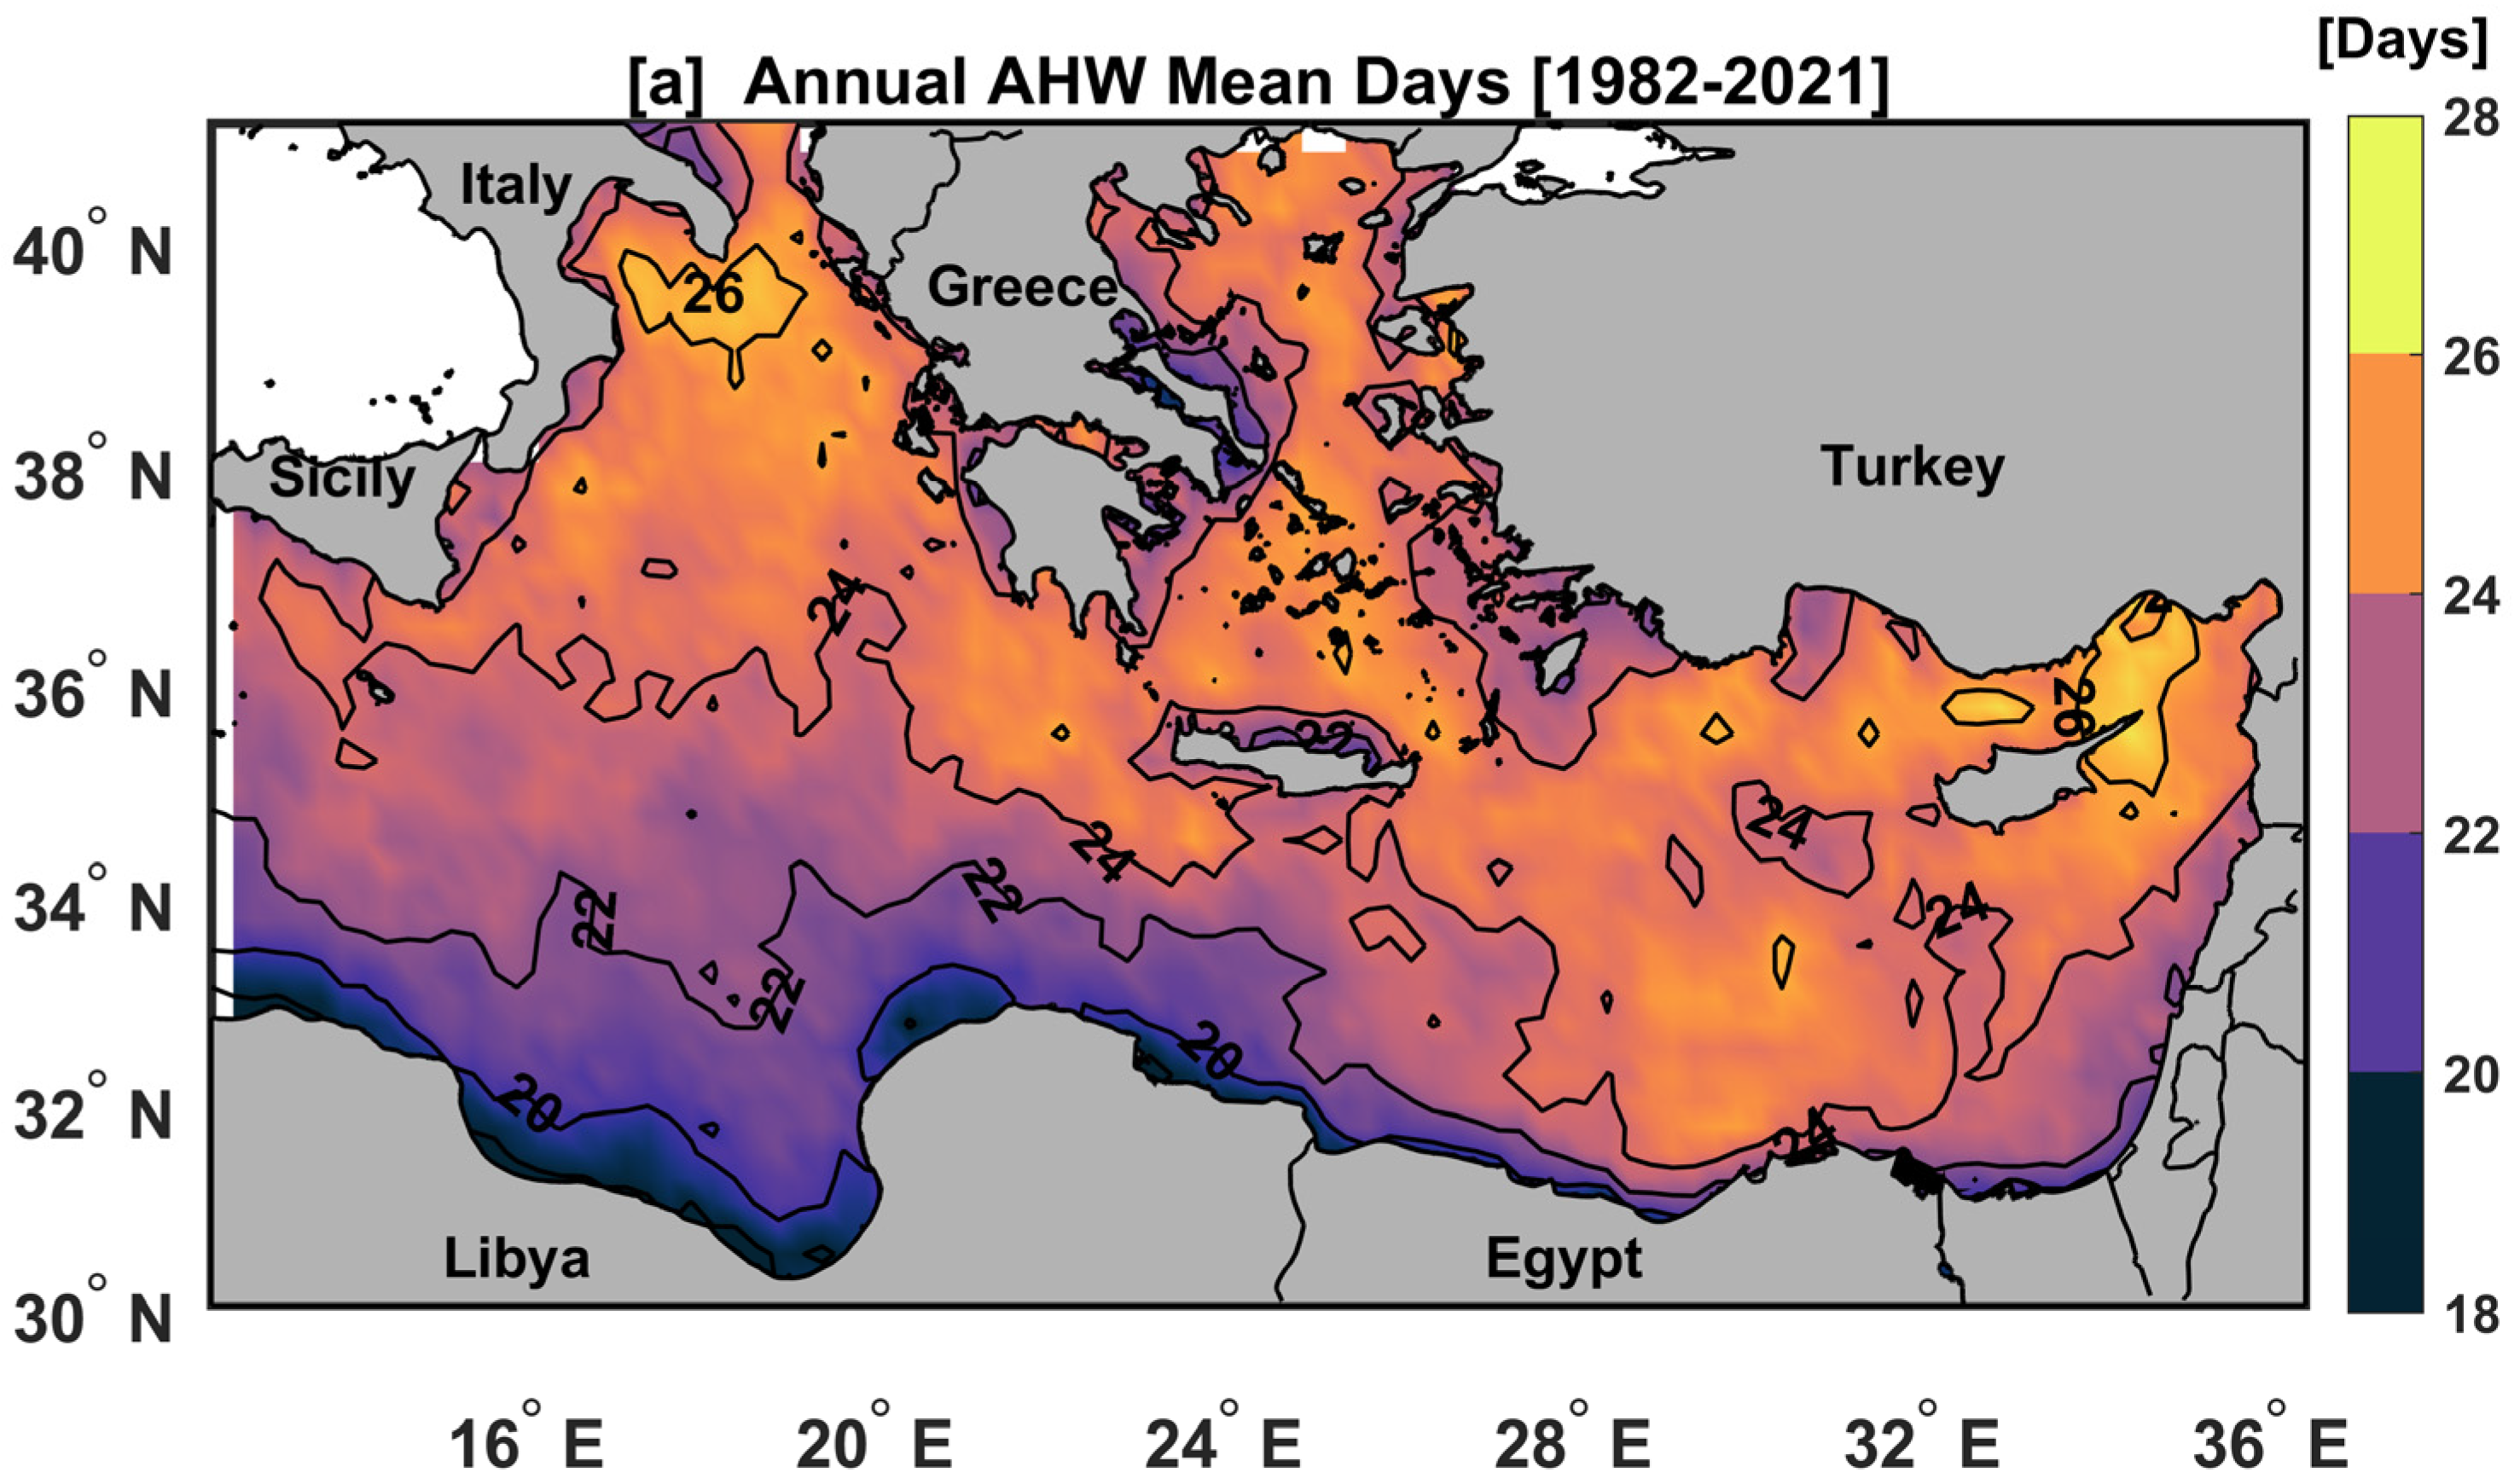
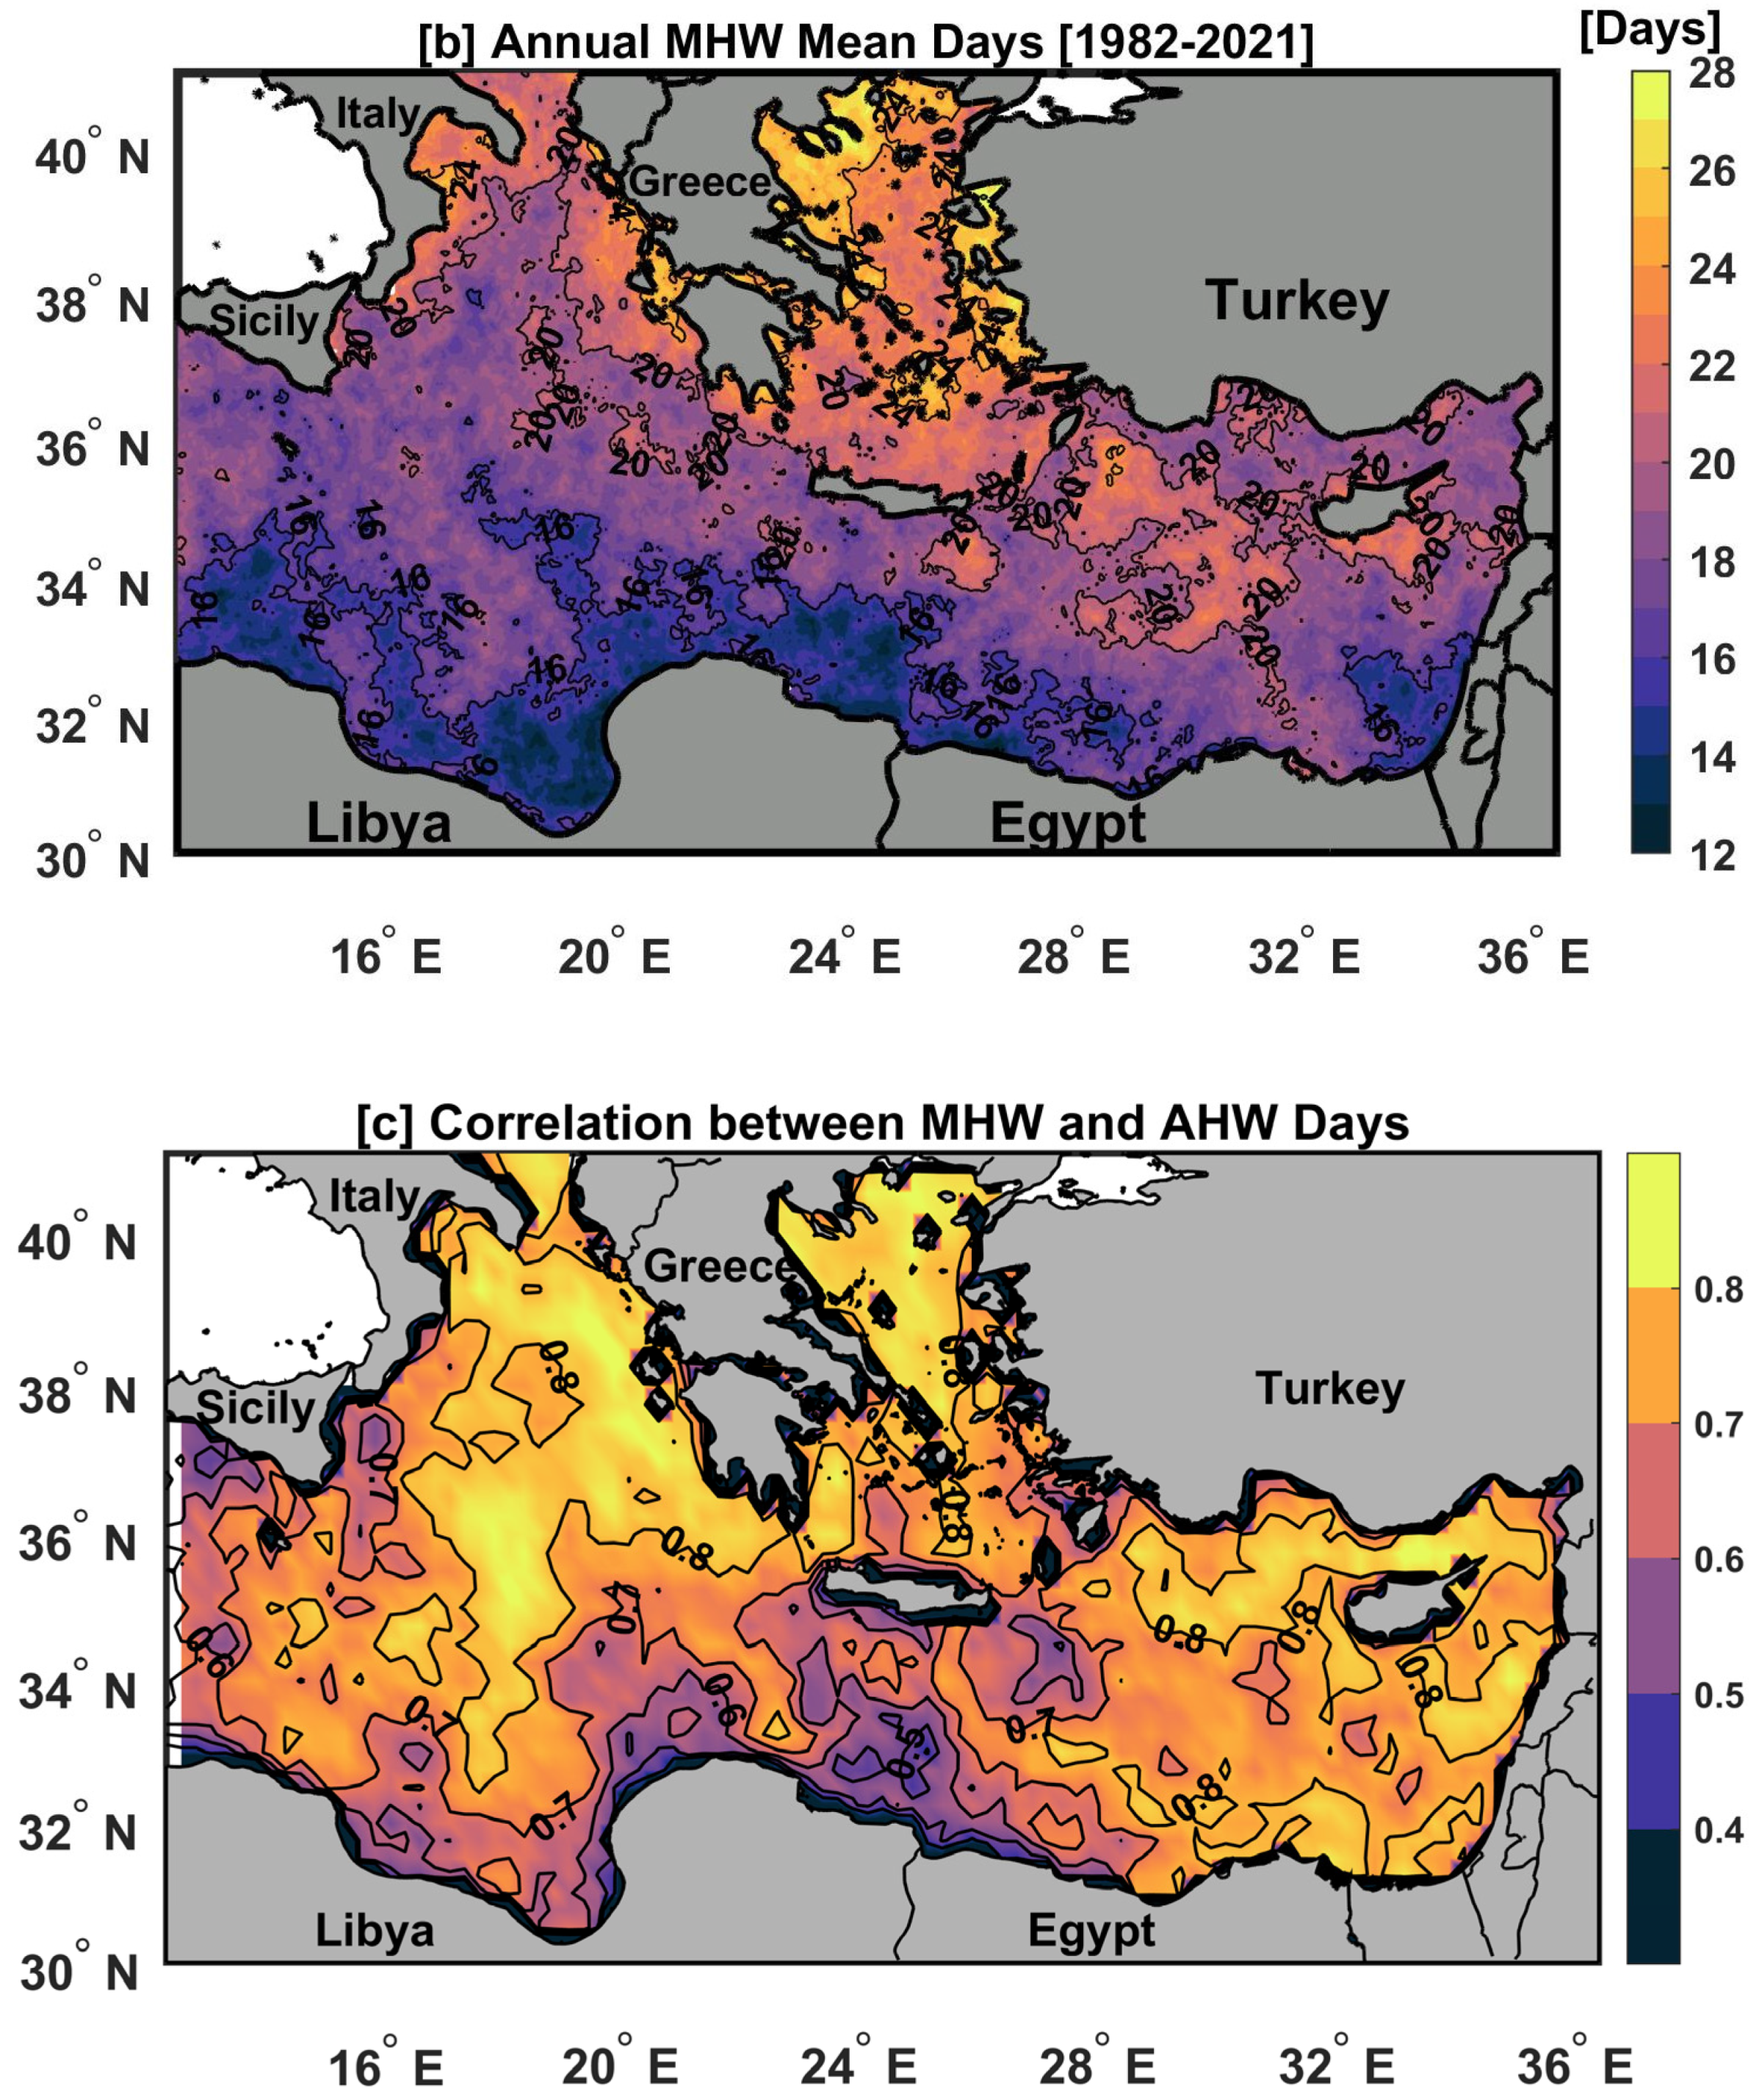
Figure 5a–c depict the spatial distribution of annual mean AHW and MHW days and the correlation between them during the study period. The annual AHW days ranged from 18 to 28 days (Figure 5a). The highest AHW days (>27 days) were in northern Cyprus (Levantine basin), with the lowest values (<20 days) along the Libyan coast (Ionian basin). The Ionian Basin generally had lower MHW days than the Levantine Basin (see Figure 5b), and the highest MHW days (>24 days) were observed in the Aegean Sea. The spatial distribution of the correlation between the AHW and MHW days is highly significant for most of the study area, with a correlation greater than 0.7, except for the Libyan coast and the southern coasts of the islands of Crete and Sicily in the Ionian basin, where the correlation is less than 0.5 (Figure 5c).
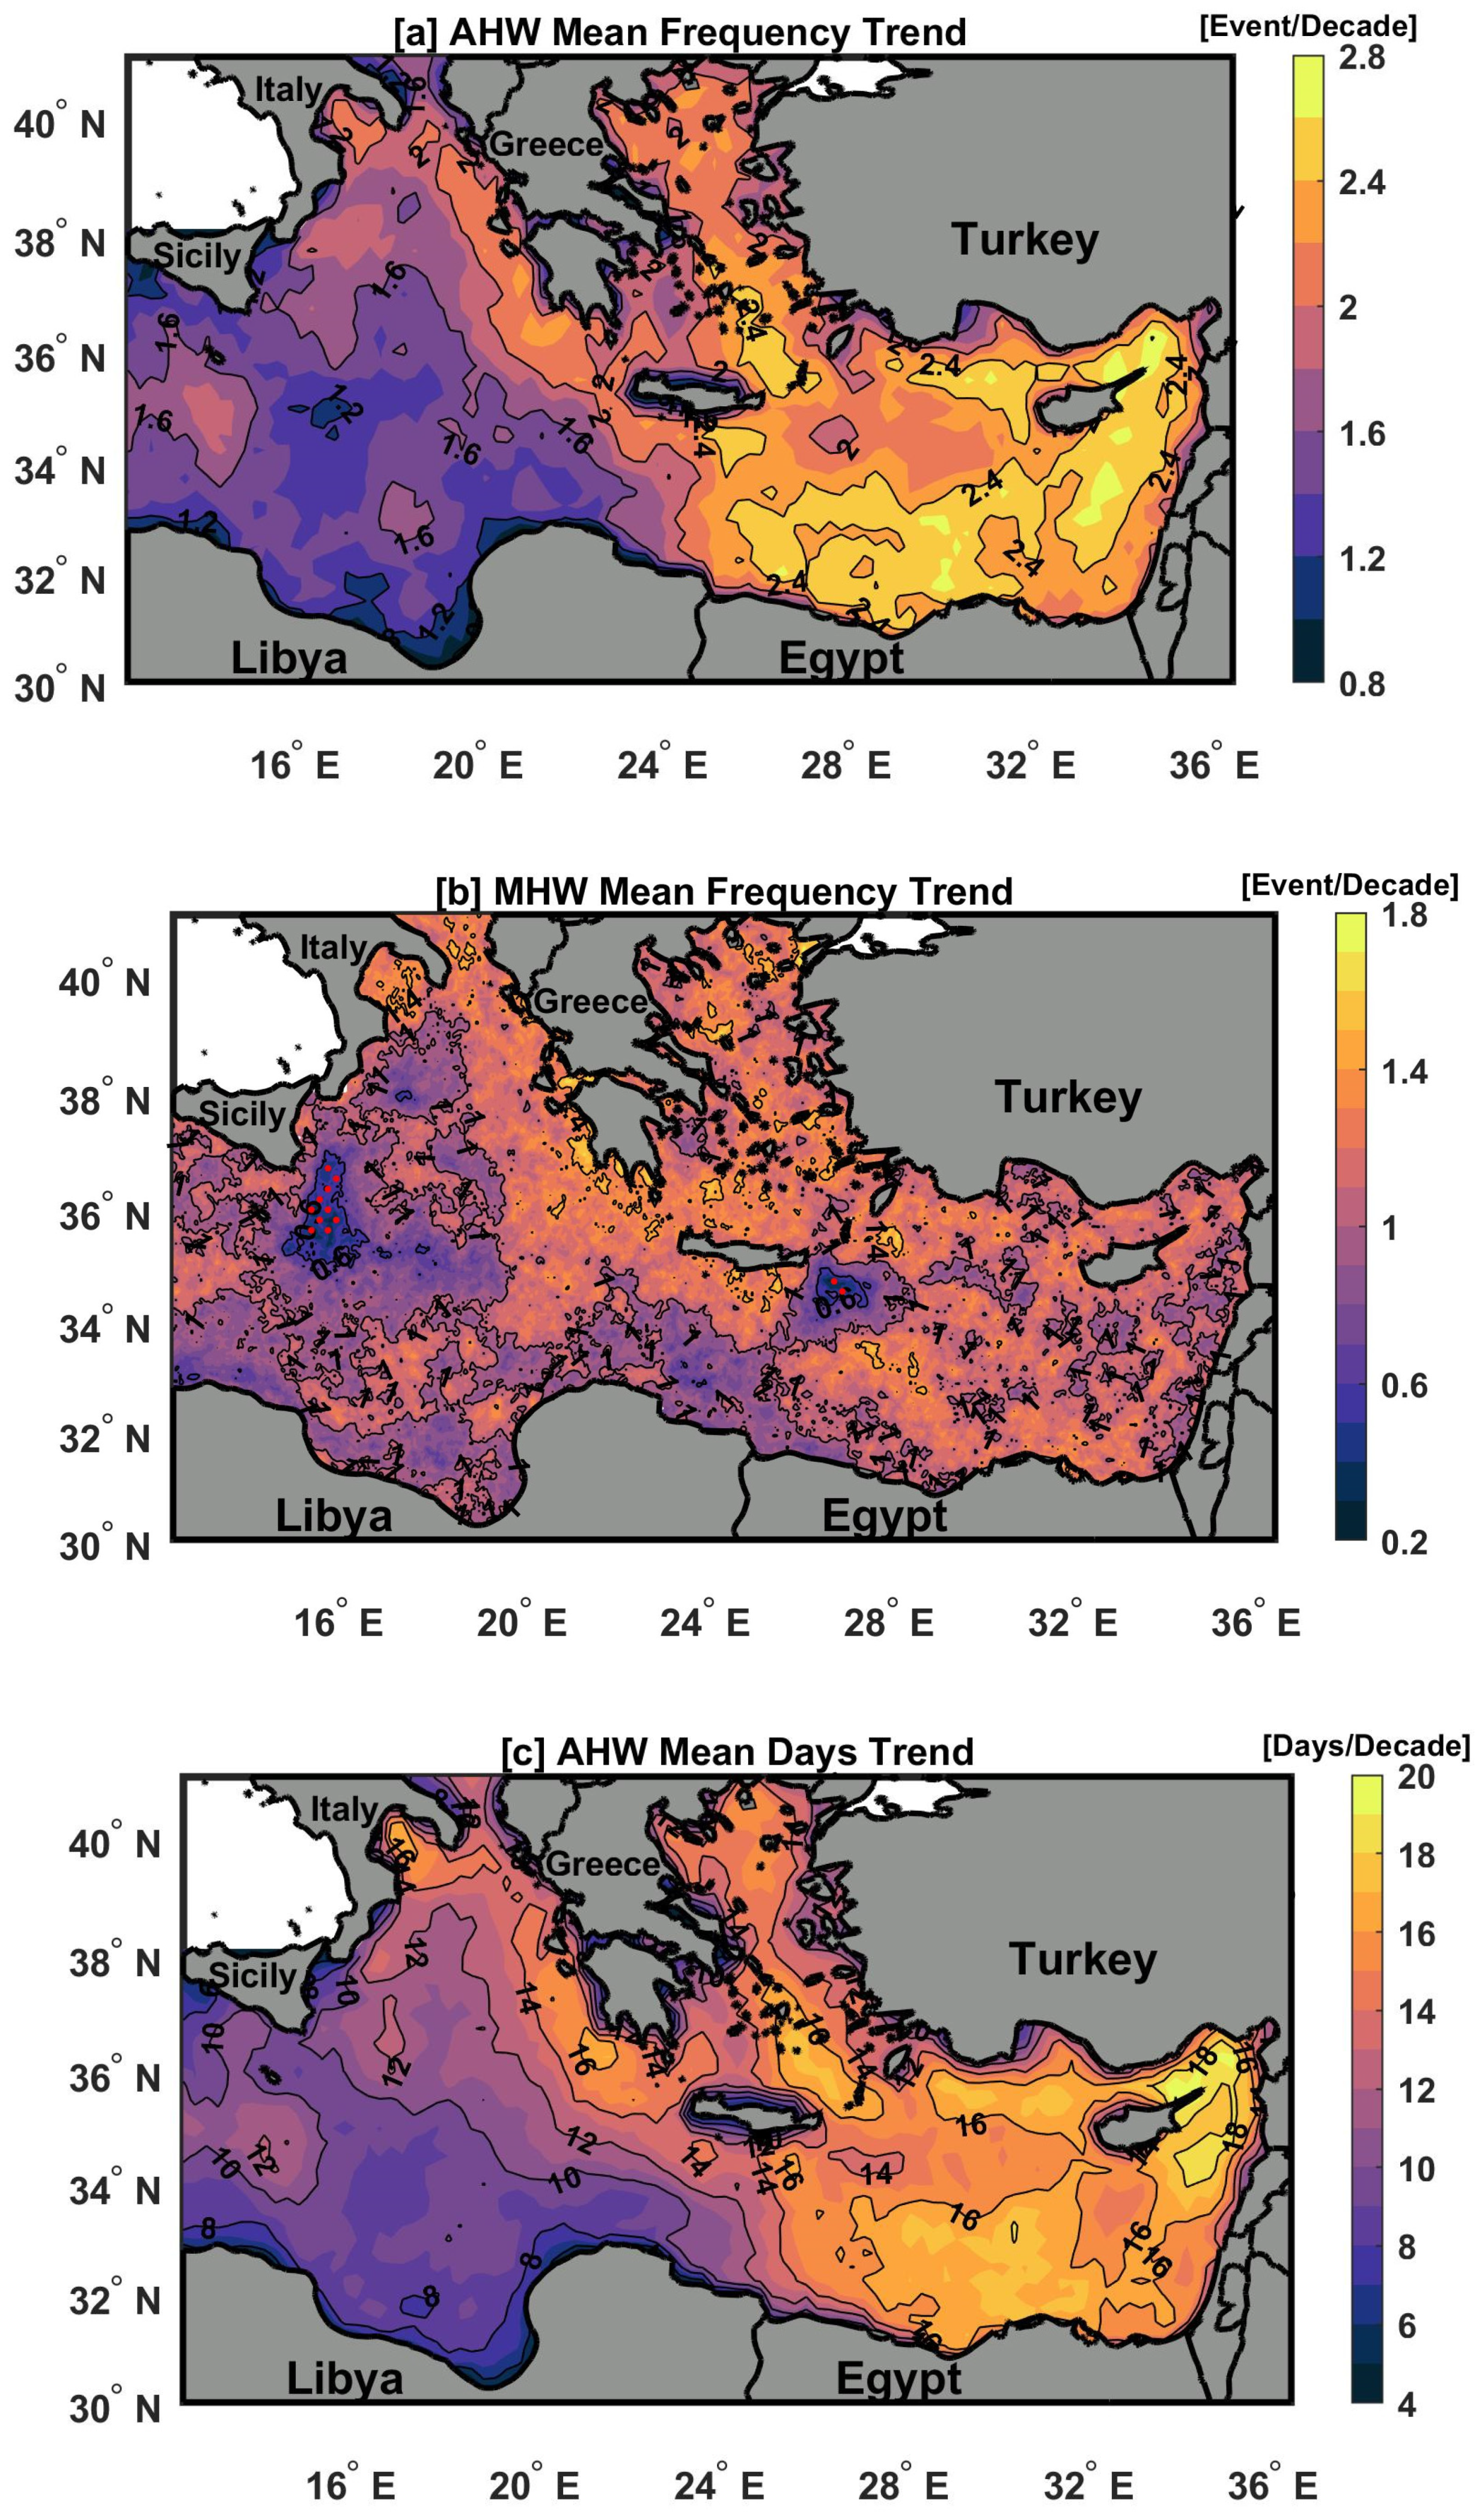
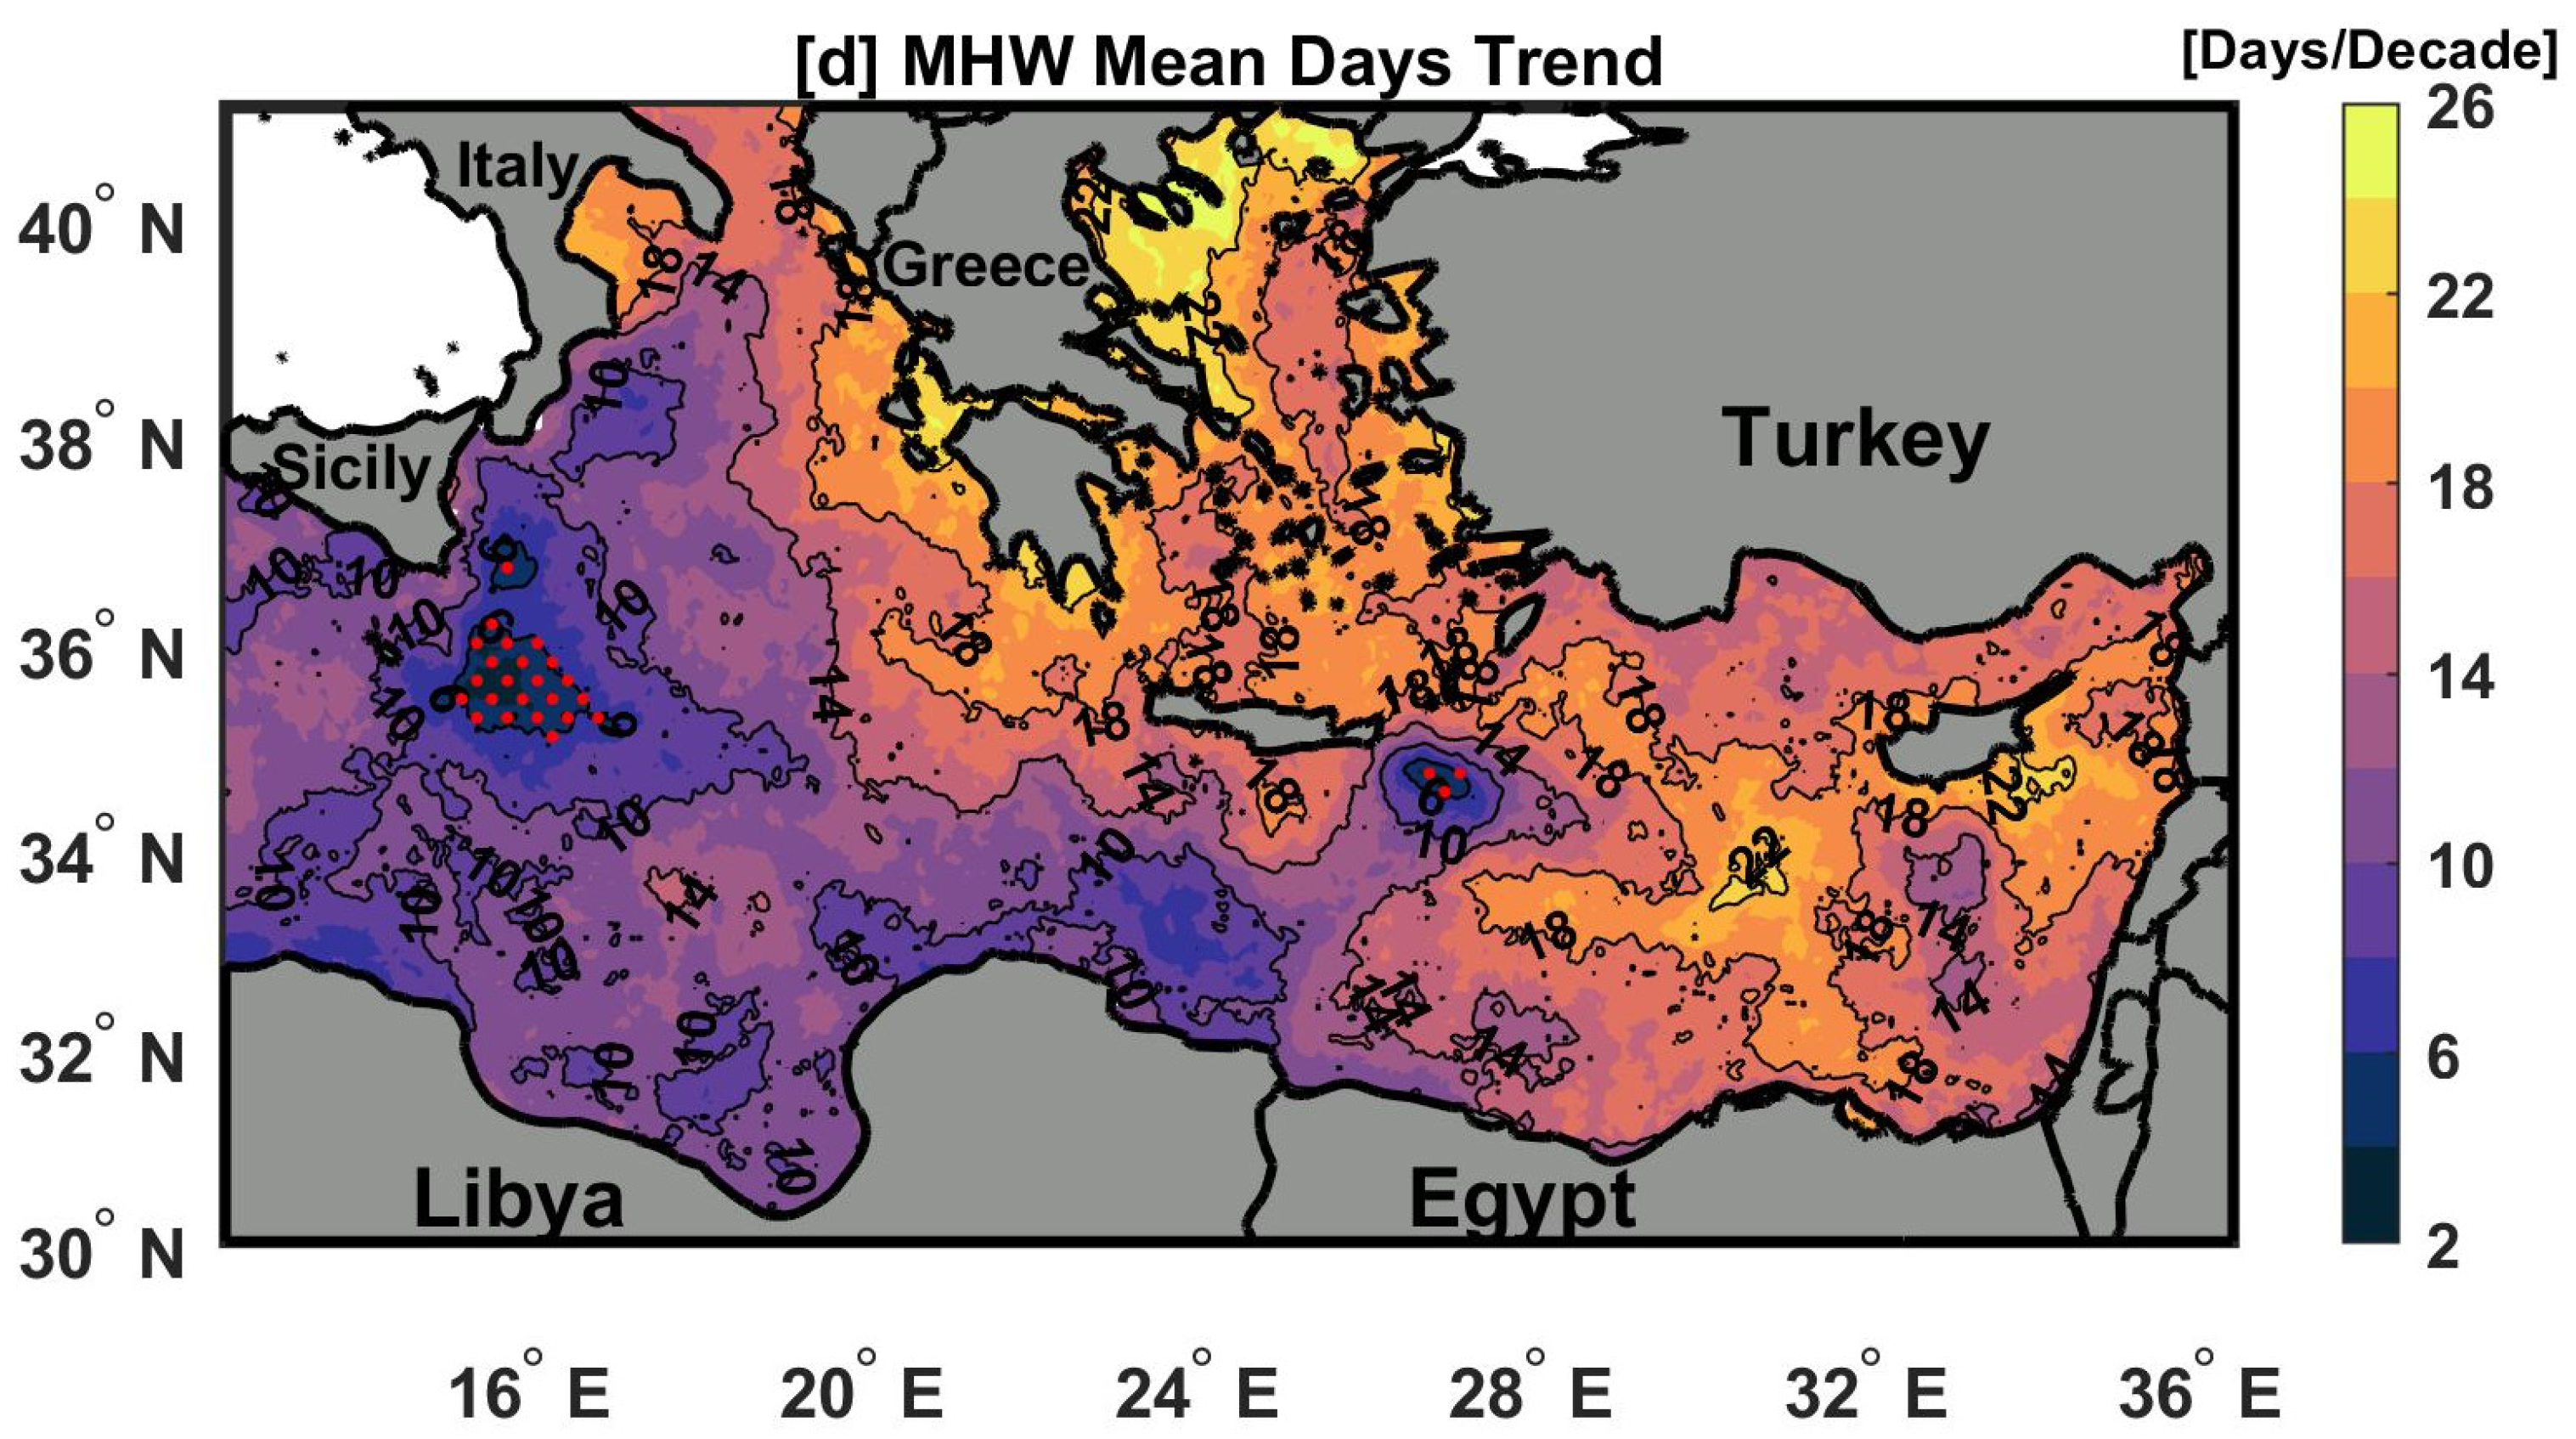
Figure 6a–d illustrate the trends in AHW and MHW frequency and the total number of days over the EMED during the study period (1982–2021). A positive statistically significant (p < 0.05) trend for both the frequency of AHWs and MHWs and the total days was observed across the EMED, except for MHW in the anticyclonic MCC [64] and Ierapetra gyre, which showed a non-significant (p > 0.05) trend (Figure 6b,d). The highest positive trends of AHW frequency (>2 events/decade) and total number of days (>15 days/decade) were found in the Aegean and Levantine Basins (Figure 6a,c). The lowest trends in the frequency of AHWs (<1.2 events/decade) and the total number of days (<10 days/decade) were observed in the Ionian basin. For MHWs, the largest positive trends of frequency (>1 event/decade) and total number of days (>15 days/decade) were detected in the Aegean and Levantine Basins (Figure 6b,d). Furthermore, the lowest trends of MHWs frequency (<0.5 event/decade) and total number of days (<5 days/decade) were observed in the Ionian Basin. In general, the results of the spatial distribution of MHW frequency trend were consistent with those of [15], which could be due to the use of the same MHW trend method and the same SST dataset, but with higher resolution.

3.4. AHW and MHW Co-Occurrence: 2021 Case Study

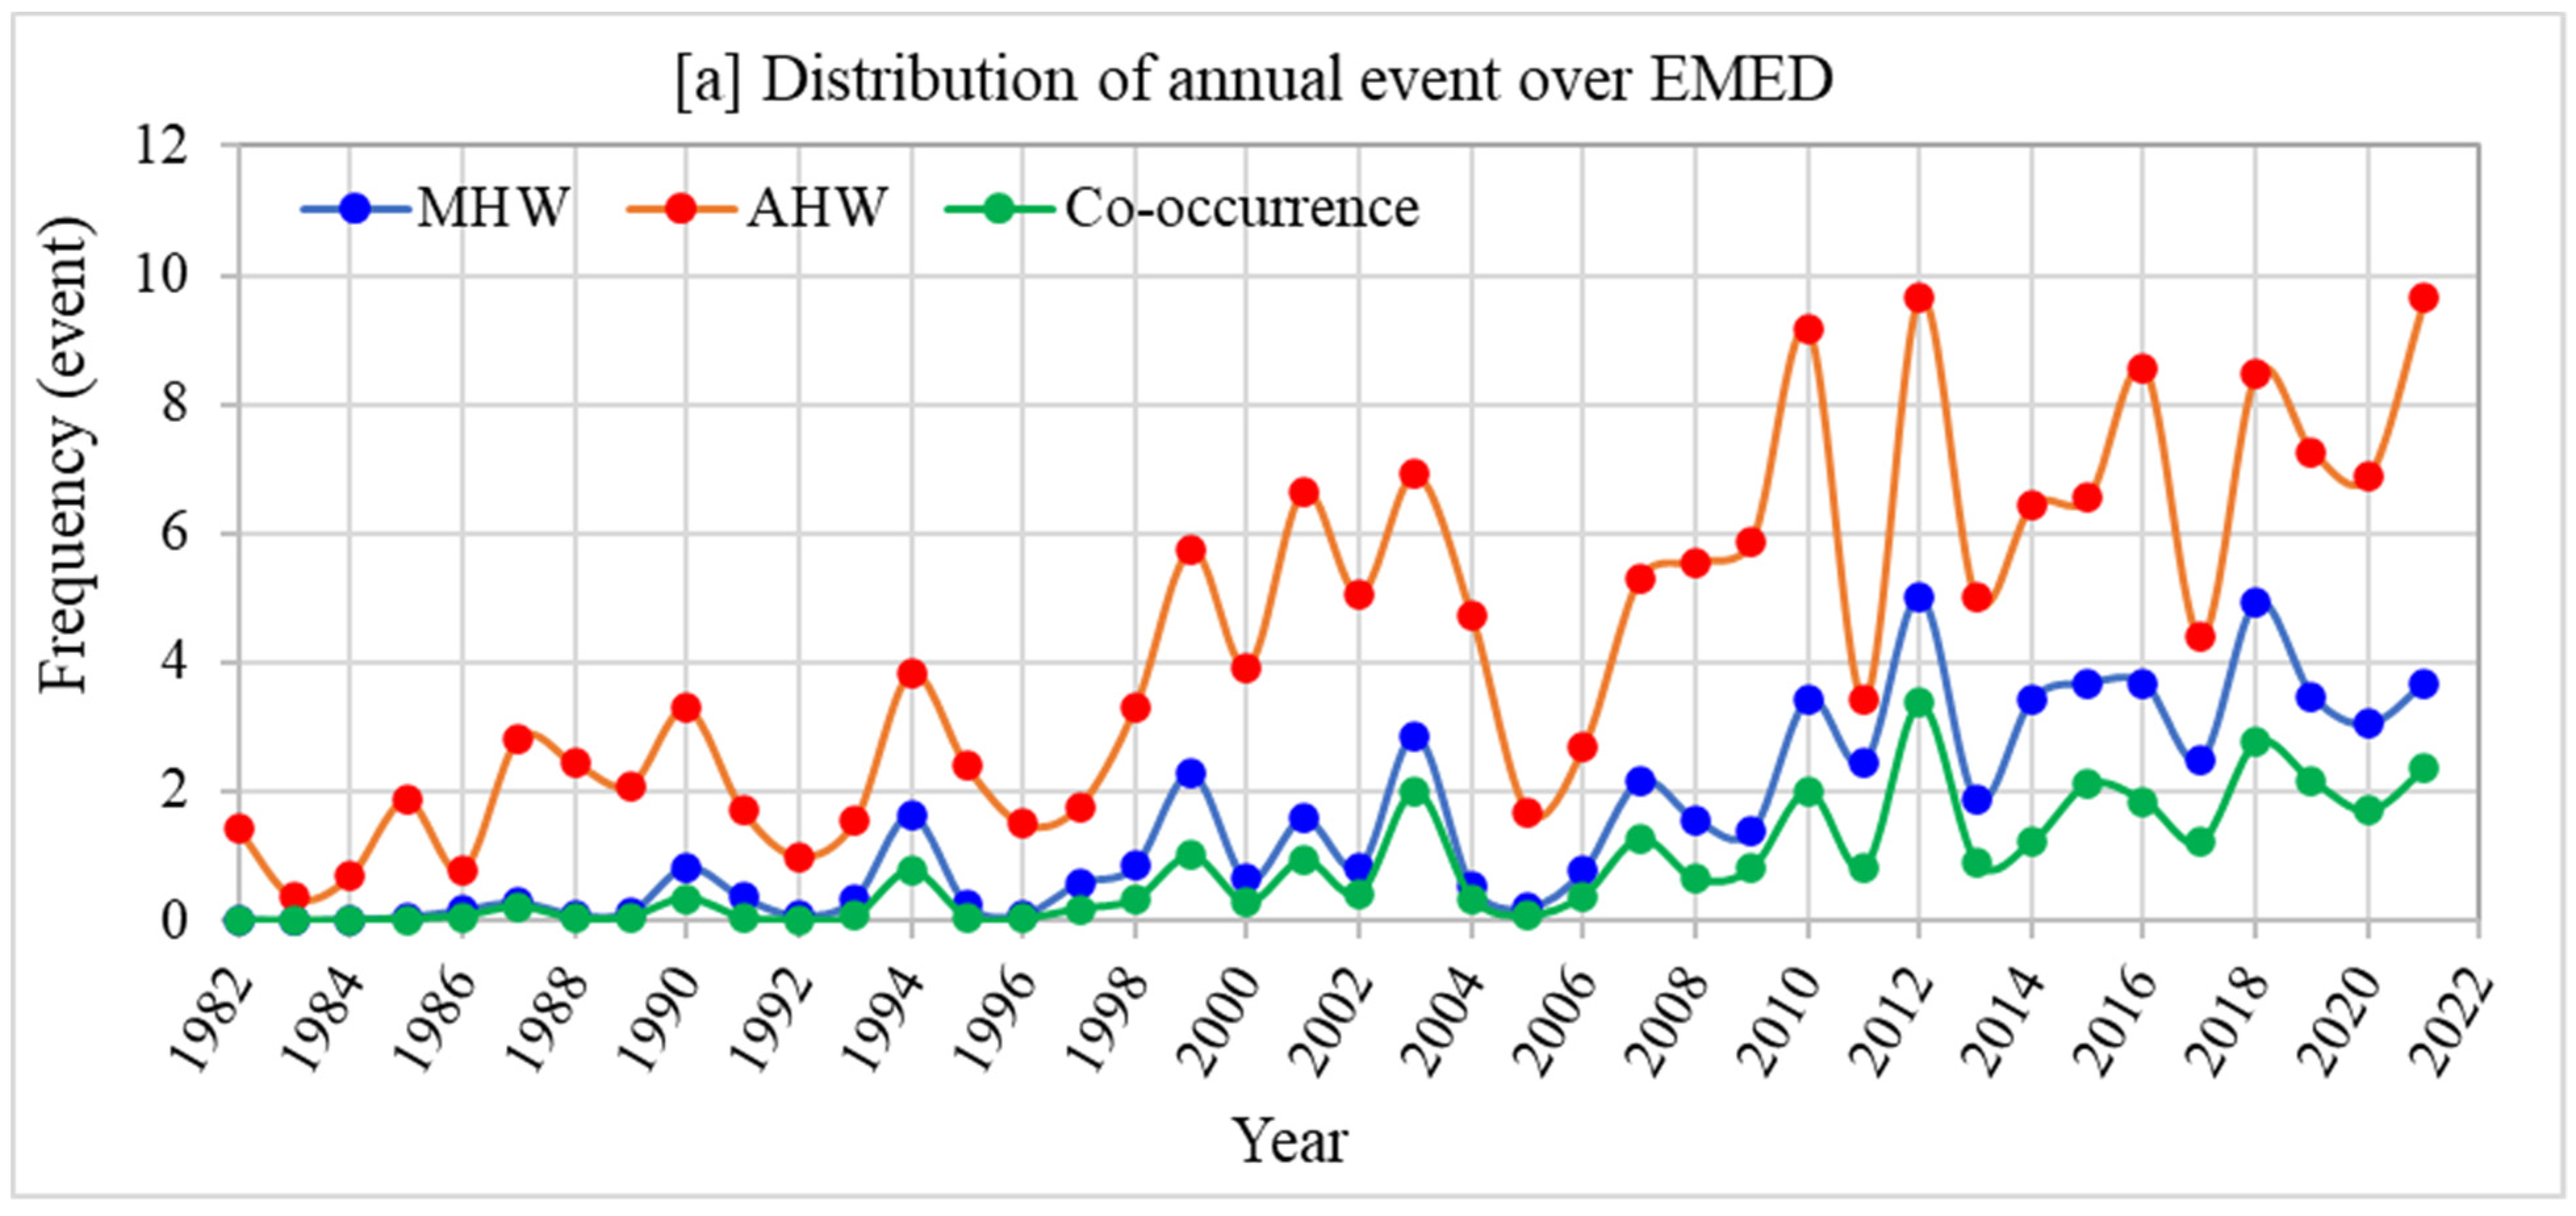
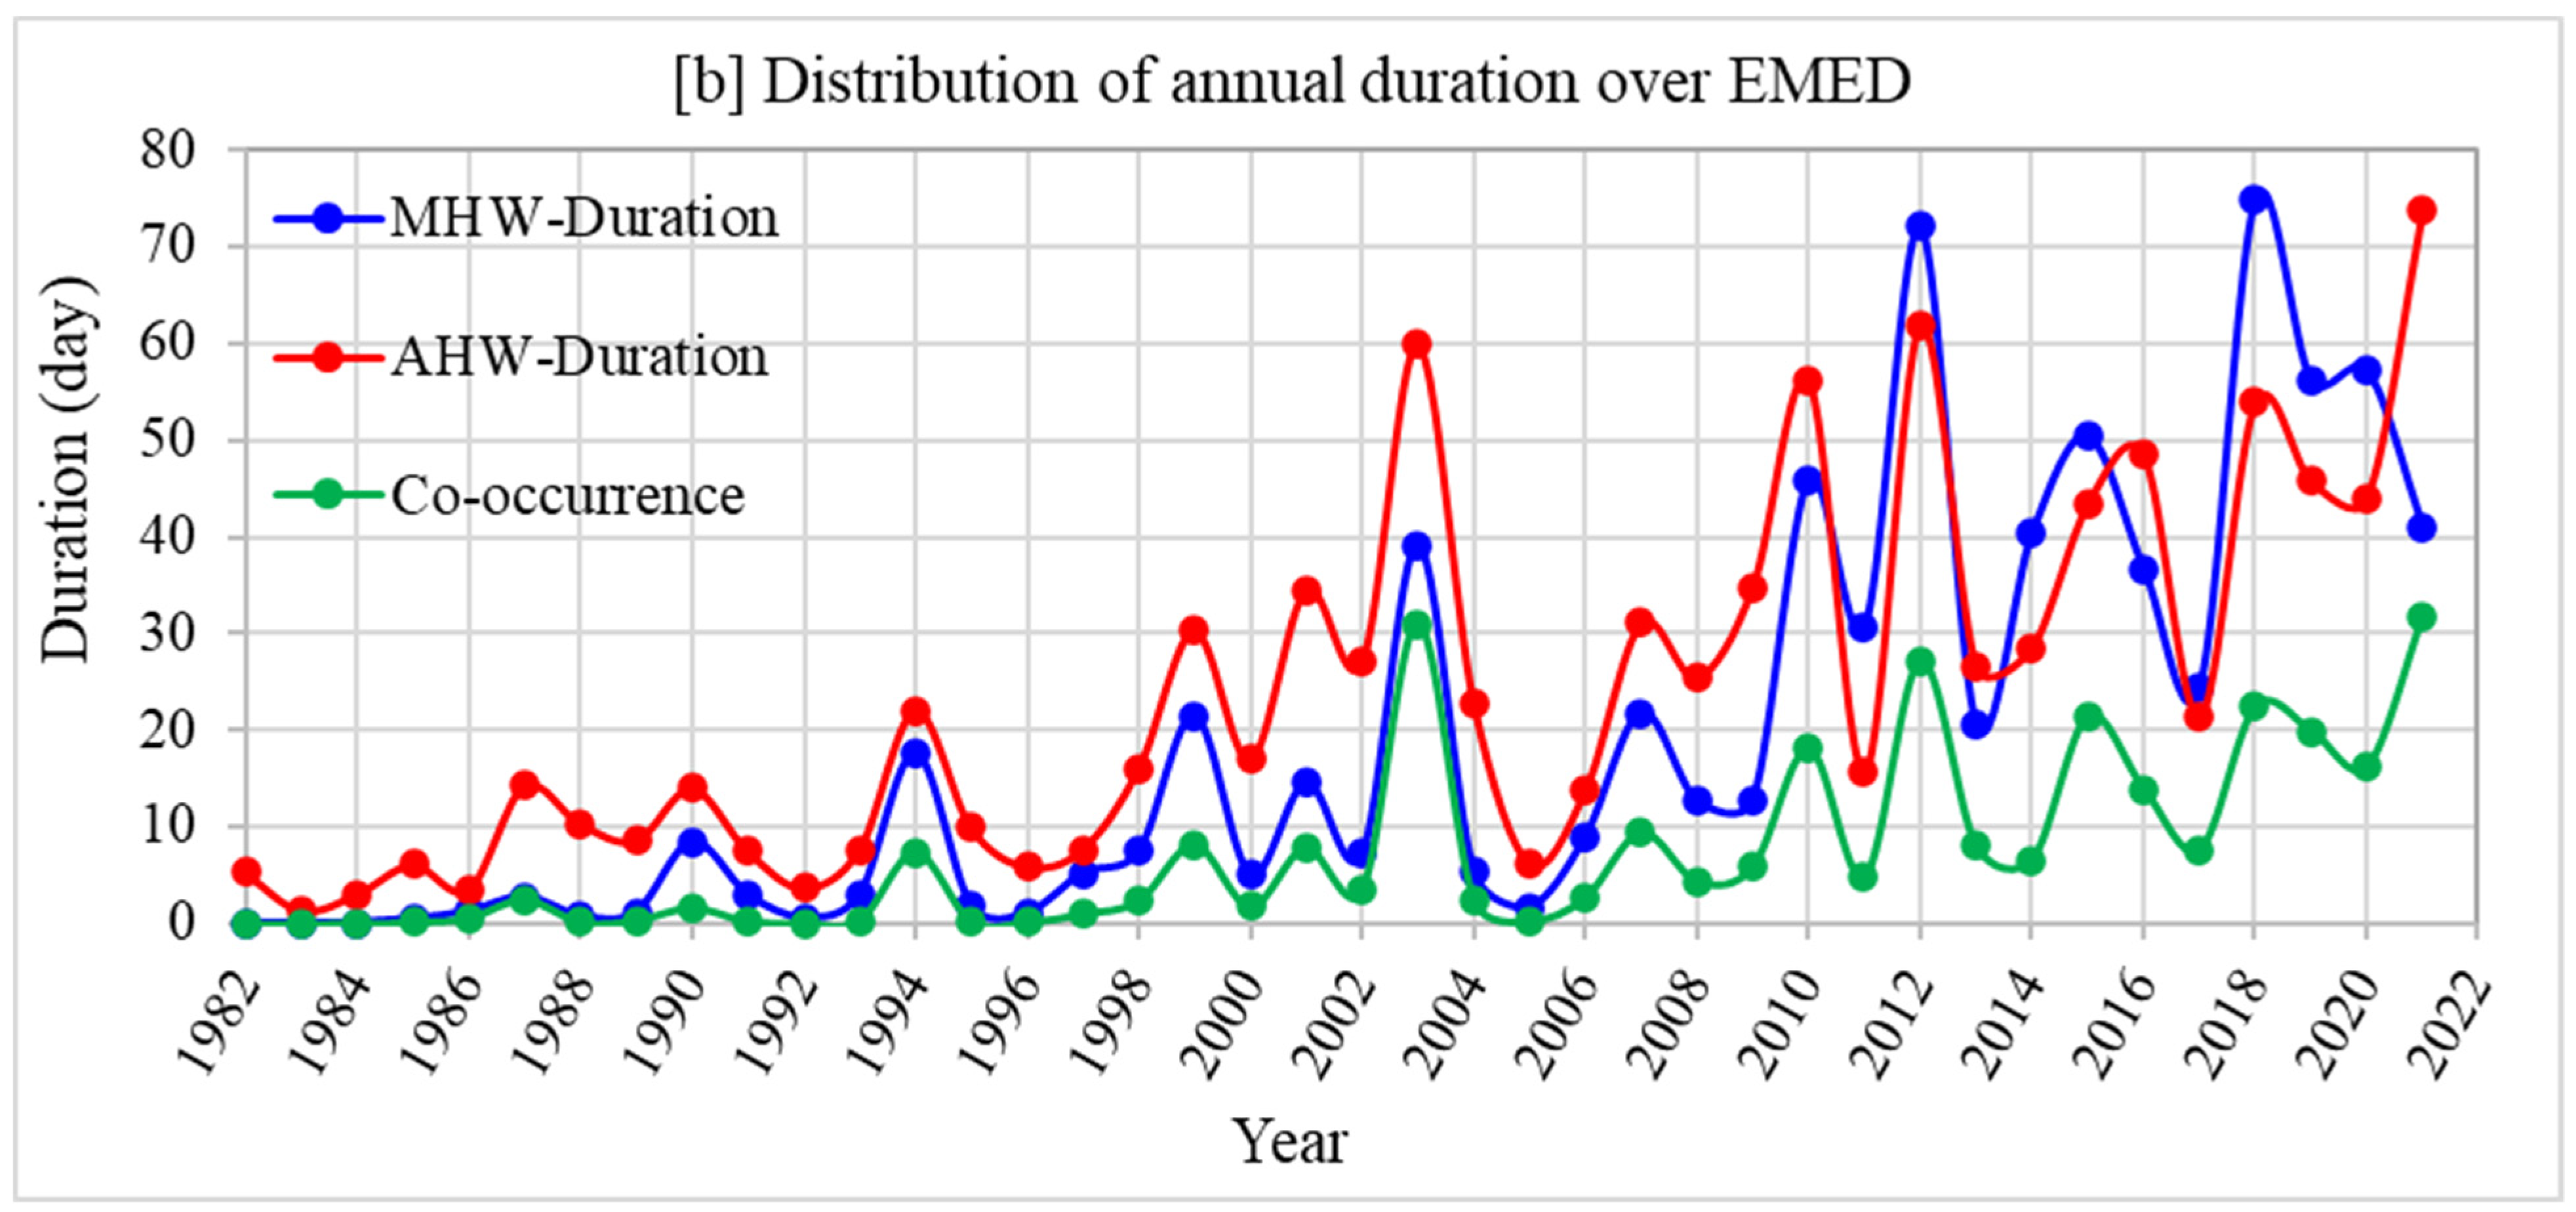
In this section, we calculated the occurrence and total days of AHWs and MHWs throughout the study period (Figure 7a,b) and then focused on the co-occurrence of events in 2021 as a case study. During the study period, the total number of AHW events for each year was always higher than that of MHW events (Figure 7a). The total number of MHW days exceeded that of AHW days in the last decade, except for in 2013, 2015 and 2021 (Figure 7b). There were 172 AHW events and 62 MHW events, with 33 events of AHWs and MHWs occurring together, accounting for 53% of the total MHWs events (Figure 7a,b). This implies that more than half (53%) of the MHWs recorded throughout the study period occurred simultaneously with AHWs, while the remaining percentage (47%) could be due to other causes such as oceanic processes (i.e., heat advection by ocean currents that can aggregate areas of warm water) rather than AHWs.
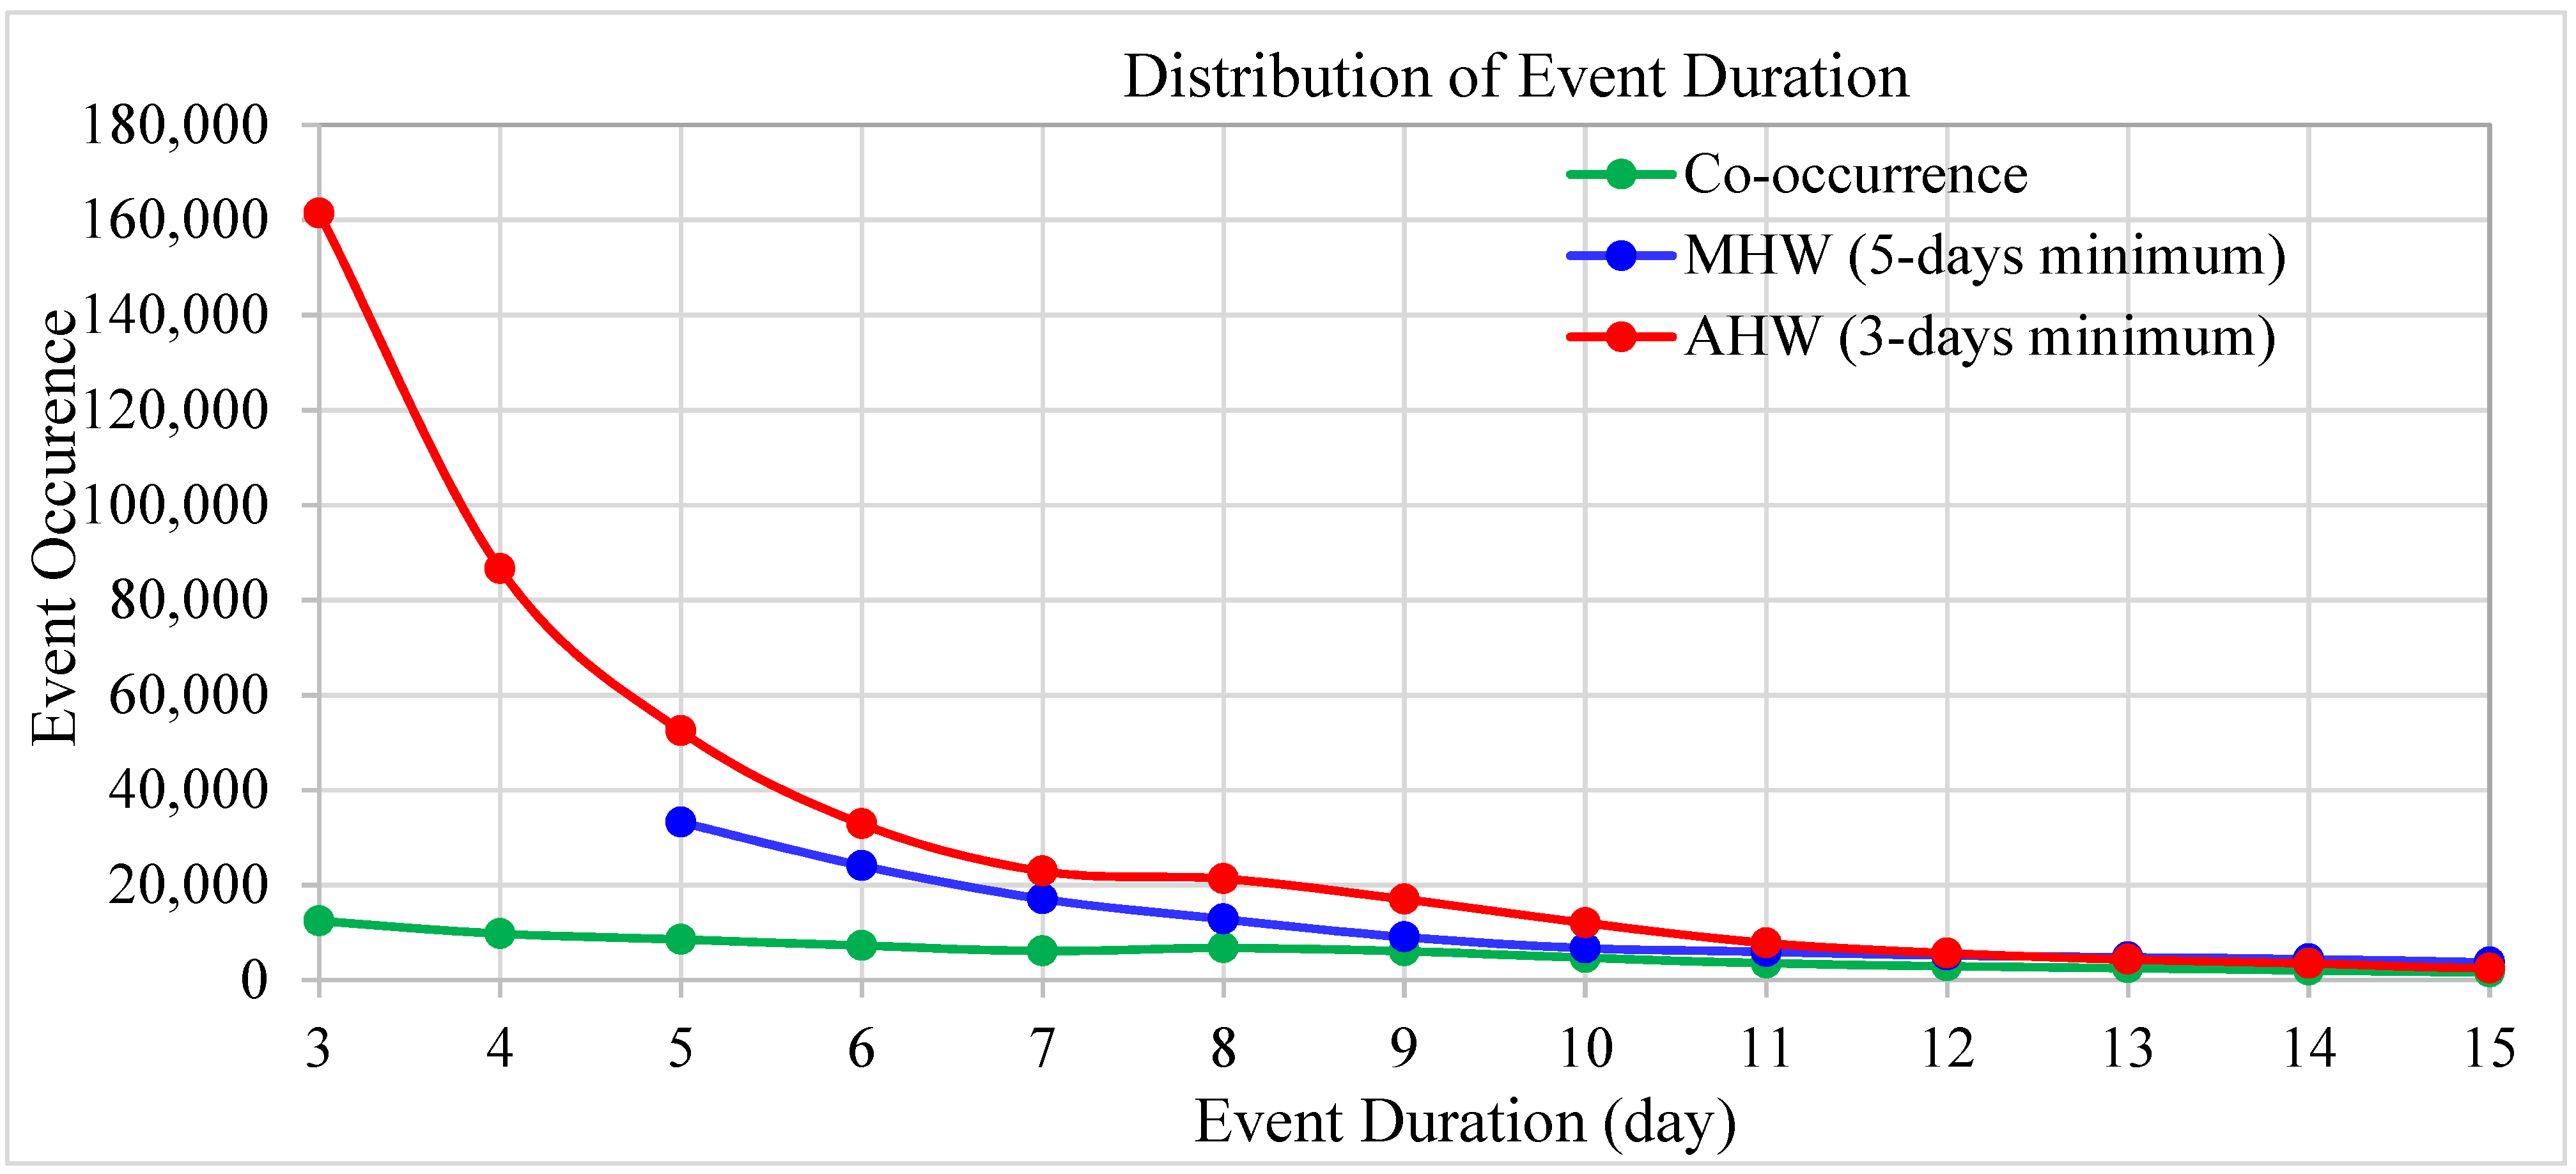
Throughout the study period, an increase in the co-occurrence of frequency and total days was observed in approximately 0.6 ± 0.03 events/decade and 5.5 ± 1.1 days/decade, respectively (Figure 7a,b, green line). The highest frequencies of co-occurrence (>2 events) of AHWs and MHWs were observed in 2012, 2018, and 2021. These years had the most active heatwaves in the Mediterranean region, according to the recent MHW study [41]. The co-occurrence of AHW days was defined as the days in which a MHW was completely encompassed by an AHW, as defined by [28]. The stand-alone AHWs, MHWs, and their co-occurrence across all EMED grid cells during the study period (1982–2021) are shown in Figure 8. It can be noticed that the AHWs were generally longer than the MHWs for all durations (total days). The co-occurrence of AHWs and MHWs accounts for about 53% of the total MHWs (Figure 8), confirming our earlier results in Figure 7. Most stand-alone AHWs had durations of 3 or 4 days, accounting for 56% of total AHWs, while stand-alone MHWs of 5 or 6 days account for 36% of the total MHW events (Figure 8).
Figure 9 demonstrates the simultaneous occurrence of AHWs and MHWs in 2021 as a case study. This schematic figure shows that nine AHWs and five MHWs were detected throughout the EMED in 2021. According to the Hobday classification [49,66], the MHWs were classified as moderate, severe, heavy and extreme. The intensity of all heatwaves observed in 2021 was classified as moderate heatwaves (i.e., SSTA or SATA greater than the 90th percentile). There were four AHW and MHW events that co-occurred (see cyan bars in Figure 9). One MHW (stand-alone) that began on 31 August 2021 and lasted 9 days did not co-occur with an AHW (Figure 9), which may be due to other causes (i.e., oceanic) rather than AHW.
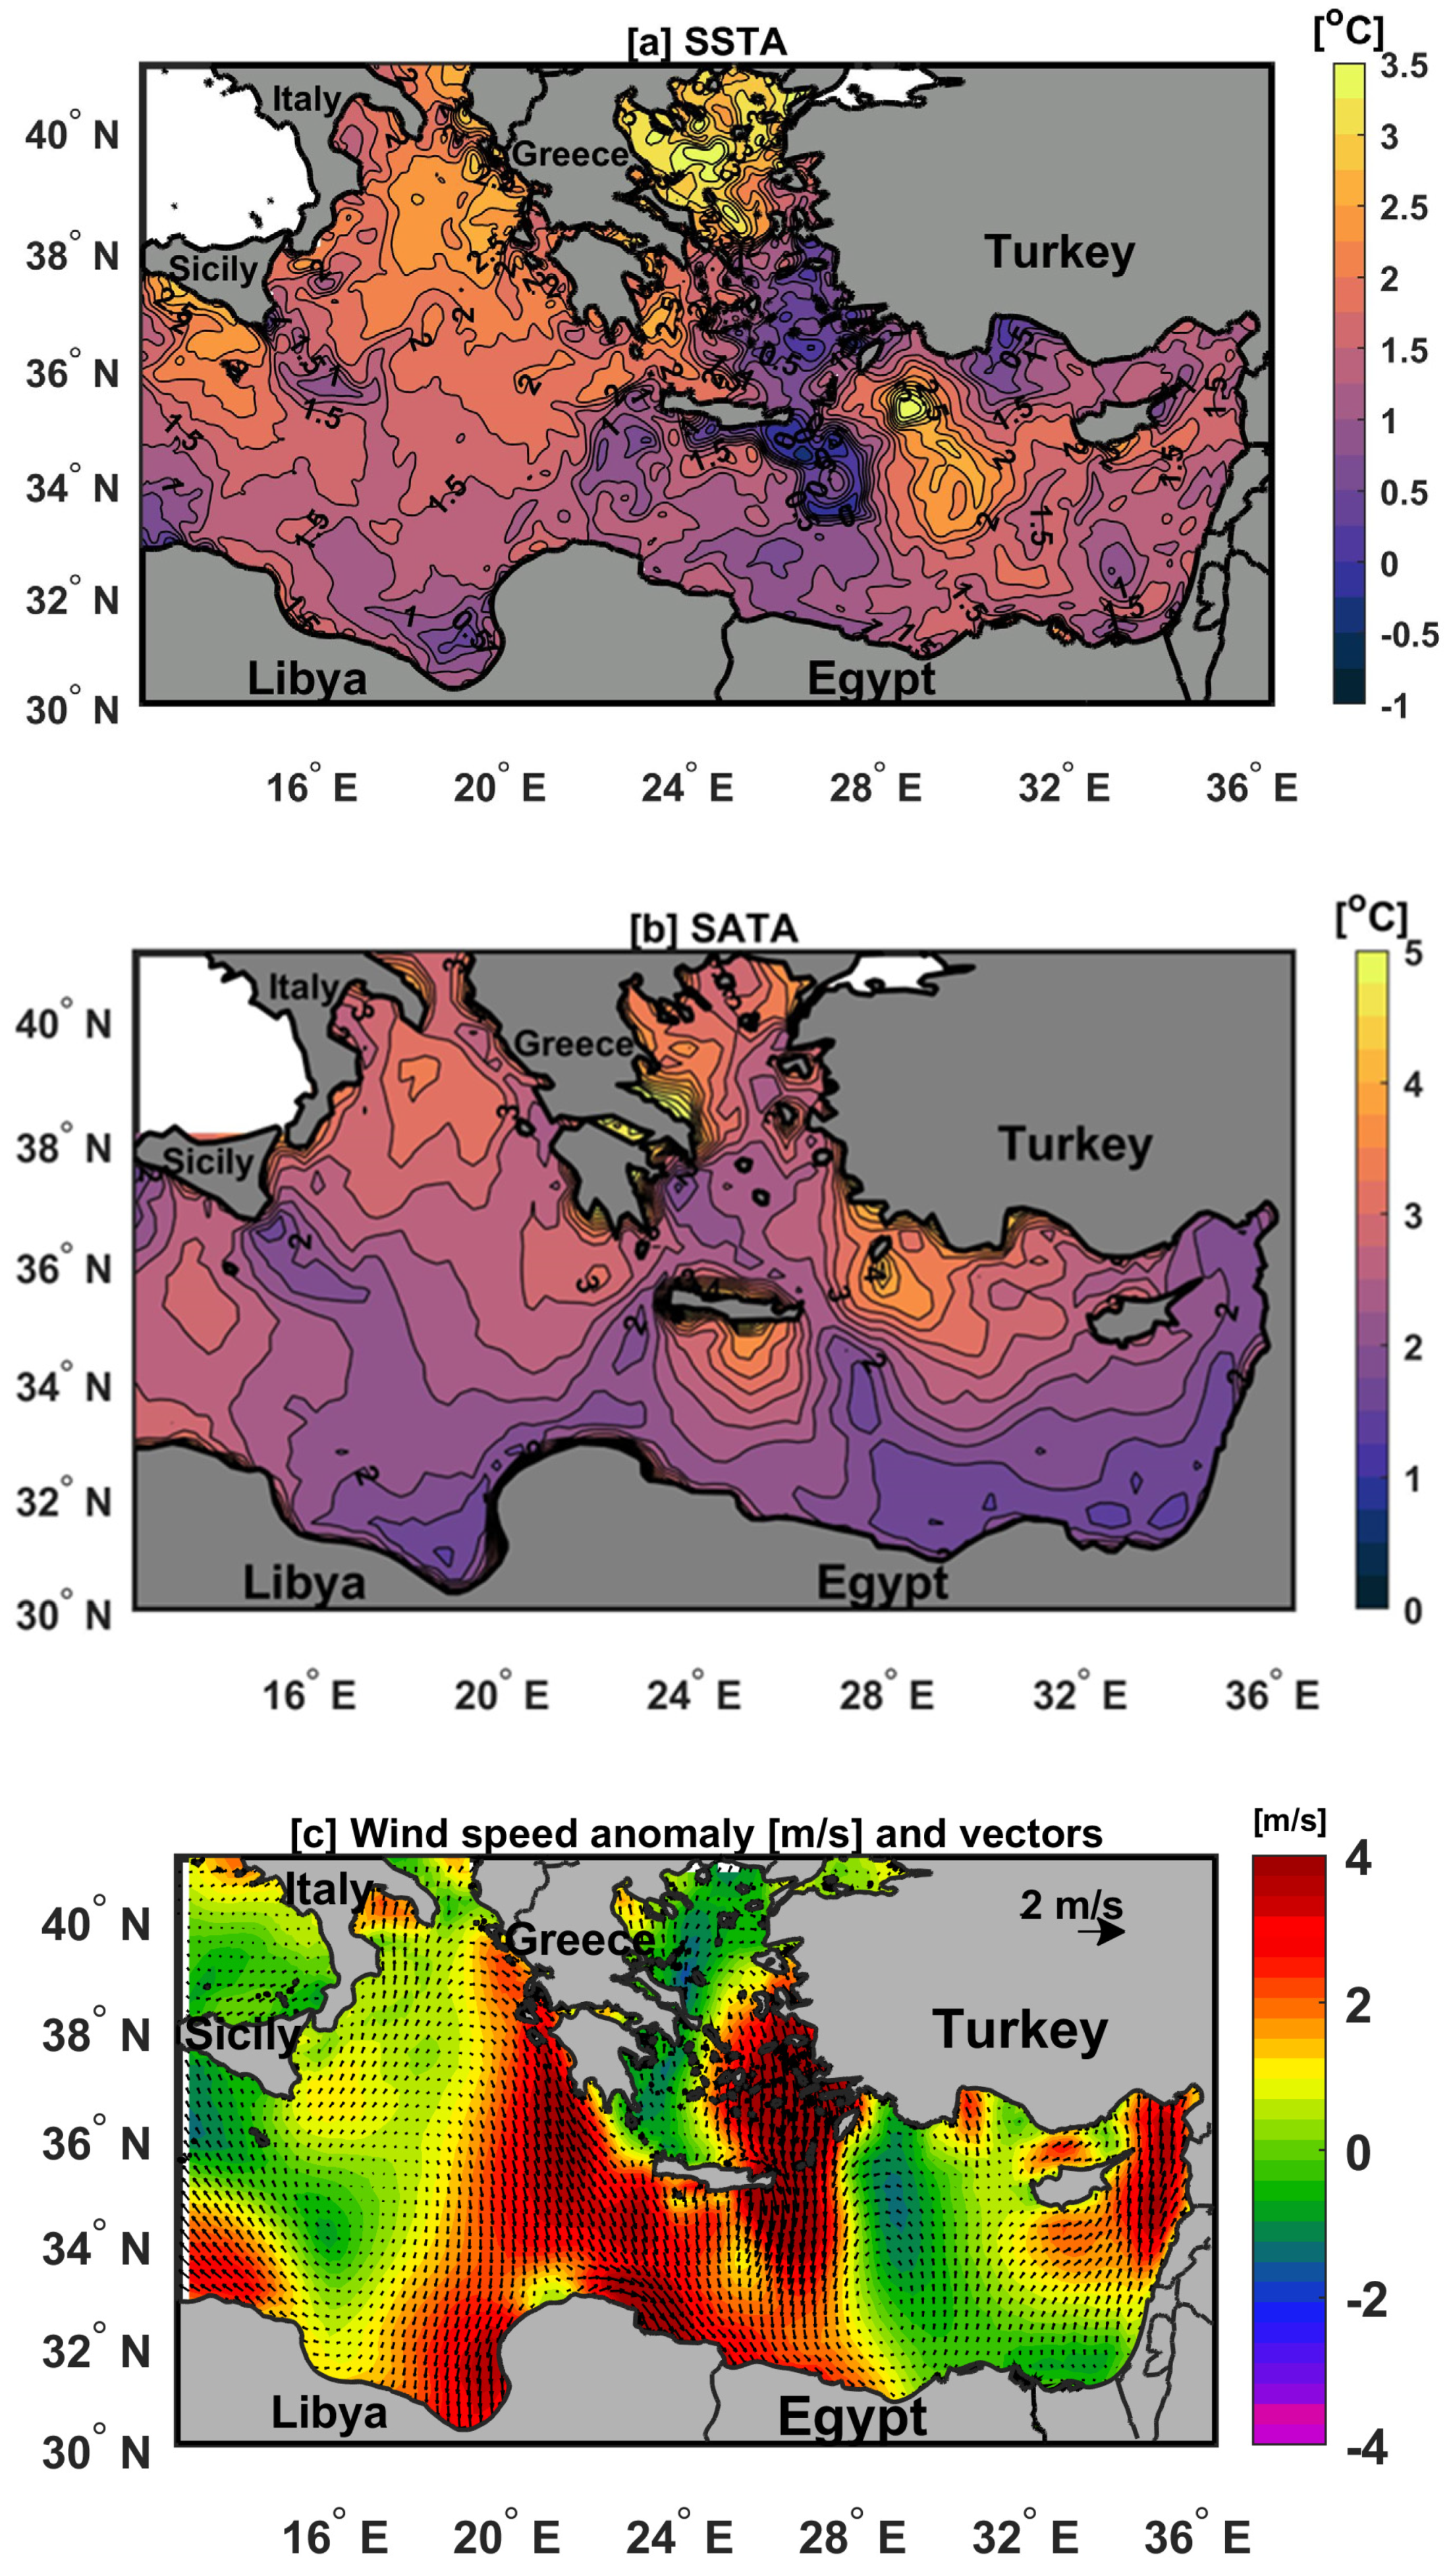
We wanted to gain better insight into the SST and atmospheric condition (SAT and wind components) anomalies during the summer co-occurrence event which lasted for 8 days from 29 July to 5 August 2021 (Figure 10a–c). The spatial distribution of the average SSTA during this event (Figure 10a) ranged from [−1] to 3.5 °C, with maximum anomalies (>2 °C) in most of the Aegean Sea and south of Rhodes Island (Rhodes gyre cyclonic location [58]), with an average 1.52 °C over the whole EMED. The atmospheric conditions during this event revealed warm atmospheric temperature anomalies over the entire EMED (Figure 10b) that ranged from 0 to 5 °C. The highest SATA values (>4 °C) were observed over the most of Aegean Sea and south of Rhodes Island, which coincide with the same regions of the most intense MHWs and highest SSTA (Figure 10a). There is an interesting resemblance in the pattern between the wind speed anomaly, SSTA, and SATA, where the locations of maximum temperature anomalies were coincident with a reduction in the magnitude (<0 m/s) of the wind speed fields (Figure 10c). That the comparison of wind speed patterns and temperature anomalies fields is related to the AHW and MHW extreme events could be related to insufficient wind speed; examples of similar findings can be found in [15,34,67,68].

4. Conclusions

We investigated the spatial and temporal trends of SAT, SST, and their corresponding heatwave characteristics (frequency and total days) over the last four decades (1982–2021). Moreover, this study provides a possible relationship between AHWs and MHWs and their co-occurrence. As far as we know, there are no previous studies on the co-occurrence of AHWs and MHWs in the Eastern Mediterranean (EMED). We concluded that the warming trends for SAT and SST were about 0.38 ± 0.08 and 0.43 ± 0.05 °C/decade, respectively. This warming rate was associated with an increase in the annual frequency of AHWs (1.6 ± 0.4 events/decade) and MHWs (1.1 ± 0.2 events/decade) during the study period. However, these trends were not uniform over the EMED, with maximum values in the Levantine and Aegean basins and minimum values in the Ionian basin. More than half of the MHWs co-occurred with AHWs throughout the study period. Our results showed that the frequency of AHWs and MHWs was strongly correlated (R > 0.8; Figure 4c), especially over the Aegean and Levantine basins, which had high SAT and SST trends (Figure 2c,d). The most intense event, which occurred from 29 July 2021 to 5 August 2021, was associated with higher SSTA and SATA patterns. During this event, there was a reduction in the magnitude of the wind speed fields (Figure 10c).
Further work is needed to investigate the severity of AHWs and MHWs and their main characteristics, including atmospheric and oceanic factors. The co-occurrence of events such as MHWs, extreme precipitation, and chlorophyll over EMED regions is also desired, and a similar analysis could be conducted to understand such events, which would provide a more useful reference for the risk management of these meteorological disasters.

Author Contributions

Conceptualization: H.A., B.M., M.M. and H.N.; methodology: H.A., H.N., M.M. and B.M.; formal analysis: H.A., B.M., H.N. and M.M.; investigation: H.A., B.M., M.M. and H.N.; resources: H.A., M.M., B.M. and H.N.; data curation: H.A., M.M., H.N. and B.M.; writing—original draft preparation: H.A., B.M., M.M. and H.N.; writing—review and editing: H.A., H.N., B.M. and M.M.; visualization: H.A., M.M., B.M. and H.N.; supervision: H.A., H.N., M.M. and B.M. All authors have read and agreed to the published version of the manuscript.

Funding

This research received no external funding.

Data Availability Statement

The datasets used in this work are publicly available online through the Copernicus Marine Environment Monitoring Service (CMEMS) (CMEMS; https://resources.marine.copernicus.eu/?option=com_csw&view=details&product_id=SST_GLO_SST_L4_REP_OBSERVATIONS_010_011, last access: 28 December 2022); Daily Chl-a concentration data were obtained from CMEMS (Data|Copernicus Marine; downloaded on 15 March 2022); the atmospheric data were obtained from the European Centre for Medium-Range Weather Forecasts (ECMWF) ERA5 (https://cds.climate.copernicus.eu/cdsapp#!/dataset/reanalysis-era5-single-levels (downloaded on 20 April 2022).

Acknowledgments

The authors would like to express their gratitude to the Copernicus Marine Environment Monitoring Service (CMEMS) project for supplying the SST dataset used in this investigation. We would also like to thank the reviewers for their constructive comments that helped us to improve the manuscript. The authors would like to express their gratitude to Joseph McGovern from the Marine Institute in Ireland for his assistance in the linguistic editing of our manuscript.

Conflicts of Interest

The authors declare no conflict of interest.

References

  1. Kuroda, H.; Setou, T. Extensive Marine Heatwaves at the Sea Surface in the Northwestern Pacific Ocean in Summer 2021. Remote Sens. 2021, 13, 3989. [Google Scholar] [CrossRef]
  2. Jacox, M.G.; Alexander, M.A.; Amaya, D.; Becker, E.; Bograd, S.J.; Brodie, S.; Hazen, E.L.; Buil, M.P.; Tommasi, D. Global seasonal forecasts of marine heatwaves. Nature 2022, 604, 486–490. [Google Scholar] [CrossRef] [PubMed]
  3. Fang, C.; Han, Y.; Weng, F. Monitoring Asian Dust Storms from NOAA-20 CrIS Double CO2 Band Observations. Remote Sens. 2022, 14, 4659. [Google Scholar] [CrossRef]
  4. Wu, T.; Li, B.; Lian, L.; Zhu, Y.; Chen, Y. Assessment of the Combined Risk of Drought and High-Temperature Heat Wave Events in the North China Plain during Summer. Remote Sens. 2022, 14, 4588. [Google Scholar] [CrossRef]
  5. Perkins, S.E. A review on the scientific understanding of heatwaves—Their measurement, driving mechanisms, and changes at the global scale. Atmos. Res. 2015, 164, 242–267. [Google Scholar] [CrossRef]
  6. Das, J.; Umamahesh, N.V. Heat wave magnitude over India under changing climate: Projections from CMIP5 and CMIP6 experiments. Int. J. Climatol. 2022, 42, 331–351. [Google Scholar] [CrossRef]
  7. Mabrouk, E.H.; Moursy, F.I.; Morsy, M. Assessment of climate characteristics and long-term trends of rainfall and drought in the Congo River Basin. J. Water Clim. Chang. 2022, 13, 3906–3933. [Google Scholar] [CrossRef]
  8. Dar, M.A.; Ahmed, R.; Latif, M.; Azam, M. Climatology of dust storm frequency and its association with temperature and precipitation patterns over Pakistan. Nat. Hazards 2022, 110, 655–677. [Google Scholar] [CrossRef]
  9. Prein, A.F.; Liu, C.; Ikeda, K.; Trier, S.B.; Rasmussen, R.M.; Holland, G.J.; Clark, M.P. Increased rainfall volume from future convective storms in the US. Nat. Clim. Chang. 2017, 7, 880–884. [Google Scholar] [CrossRef]
  10. Smith, K.E.; Burrows, M.T.; Hobday, A.J.; Sen Gupta, A.; Moore, P.J.; Thomsen, M.; Wernberg, T.; Smale, D.A. Socioeconomic impacts of marine heatwaves: Global issues and opportunities. Science 2021, 374, eabj3593. [Google Scholar] [CrossRef]
  11. Frölicher, T.L.; Laufkötter, C. Emerging risks from marine heat waves. Nat. Commun. 2018, 9, 650. [Google Scholar] [CrossRef] [PubMed] [Green Version]
  12. Manta, G.; de Mello, S.; Trinchin, R.; Badagian, J.; Barreiro, M. The 2017 record marine heatwave in the Southwestern Atlantic shelf. Geophys. Res. Lett. 2018, 45, 449–456. [Google Scholar] [CrossRef]
  13. Oliver, E.C.J.; Donat, M.G.; Burrows, M.T.; Moore, P.J.; Smale, D.A.; Alexander, L.V.; Benthuysen, J.A.; Feng, M.; Gupta, A.S.; Hobday, A.J.; et al. Longer and more frequent marine heatwaves over the past century. Nat. Commun. 2018, 9, 1324. [Google Scholar] [CrossRef] [PubMed] [Green Version]
  14. Morsy, M.; El Afandi, G. Decadal changes of heatwave aspects and heat index over Egypt. Theor. Appl. Climatol. 2021, 146, 71–90. [Google Scholar] [CrossRef]
  15. Ibrahim, O.; Mohamed, B.; Nagy, H. Spatial variability and trends of marine heat waves in the eastern mediterranean sea over 39 years. J. Mar. Sci. Eng. 2021, 9, 643. [Google Scholar] [CrossRef]
  16. Mohamed, B.; Nagy, H.; Ibrahim, O. Spatiotemporal Variability and Trends of Marine Heat Waves in the Red Sea over 38 Years. J. Mar. Sci. Eng. 2021, 9, 842. [Google Scholar] [CrossRef]
  17. Mohamed, B.; Ibrahim, O.; Nagy, H. Sea Surface Temperature Variability and Marine Heatwaves in the Black Sea. Remote Sens. 2022, 14, 2383. [Google Scholar] [CrossRef]
  18. Mohamed, B.; Nilsen, F.; Skogseth, R. Marine Heatwaves Characteristics in the Barents Sea Based on High Resolution Satellite Data (1982–2020). Front. Mar. Sci. 2022, 9, 821646. [Google Scholar] [CrossRef]
  19. Hamdeno, M.; Nagy, H.; Ibrahim, O.; Mohamed, B. Responses of Satellite Chlorophyll-a to the Extreme Sea Surface Temperatures over the Arabian and Omani Gulf. Remote Sens. 2022, 14, 4653. [Google Scholar] [CrossRef]
  20. Galanaki, E.; Giannaros, C.; Kotroni, V.; Lagouvardos, K.; Papavasileiou, G. Spatio-Temporal Analysis of Heatwaves Characteristics in Greece from 1950 to 2020. Climate 2022, 11, 5. [Google Scholar] [CrossRef]
  21. Pastor, F.; Khodayar, S. Marine heat waves: Characterizing a major climate impact in the Mediterranean. Sci. Total Environ. 2022, 861, 160621. [Google Scholar] [CrossRef] [PubMed]
  22. Perkins, S.E.; Alexander, L.V. On the measurement of heat waves. J. Clim. 2013, 26, 4500–4517. [Google Scholar] [CrossRef]
  23. Hobday, A.J.; Alexander, L.V.; Perkins, S.E.; Smale, D.A.; Straub, S.C.; Oliver, E.C.; Benthuysen, J.A.; Burrows, M.T.; Donat, M.G.; Feng, M.; et al. A hierarchical approach to defining marine heatwaves. Prog. Oceanogr. 2016, 141, 227–238. [Google Scholar] [CrossRef] [Green Version]
  24. Smale, D.A.; Wernberg, T.; Oliver, E.C.J.; Thomsen, M.; Harvey, B.P.; Straub, S.C.; Burrows, M.T.; Alexander, L.V.; Benthuysen, J.A.; Donat, M.G.; et al. Marine heatwaves threaten global biodiversity and the provision of ecosystem services. Nat. Clim. Chang. 2019, 9, 306–312. [Google Scholar] [CrossRef] [Green Version]
  25. Lima, F.P.; Wethey, D.S. Three decades of high-resolution coastal sea surface temperatures reveal more than warming. Nat. Commun. 2012, 3, 704. [Google Scholar] [CrossRef] [PubMed] [Green Version]
  26. Oliver, E.C.J.; Benthuysen, J.A.; Darmaraki, S.; Donat, M.G.; Hobday, A.J.; Holbrook, N.J.; Schlegel, R.W.; Gupta, A.S. Marine Heatwaves. Ann. Rev. Mar. Sci. 2020, 13, 313–342. [Google Scholar] [CrossRef]
  27. Holbrook, N.J.; Sen Gupta, A.; Oliver, E.C.J.; Hobday, A.J.; Benthuysen, J.A.; Scannell, H.A.; Smale, D.A.; Wernberg, T. Keeping pace with marine heatwaves. Nat. Rev. Earth Environ. 2020, 1, 482–493. [Google Scholar] [CrossRef]
  28. Pathmeswaran, C.; Sen Gupta, A.; Perkins-Kirkpatrick, S.E.; Hart, M.A. Exploring Potential Links Between Co-occurring Coastal Terrestrial and Marine Heatwaves in Australia. Front. Clim. 2022, 4, 792730. [Google Scholar] [CrossRef]
  29. Ruthrof, K.X.; Breshears, D.D.; Fontaine, J.B.; Froend, R.H.; Matusick, G.; Kala, J.; Miller, B.P.; Mitchell, P.J.; Wilson, S.K.; van Keulen, M.; et al. Subcontinental heat wave triggers terrestrial and marine, multi-taxa responses. Sci. Rep. 2018, 8, 13094. [Google Scholar] [CrossRef]
  30. Kuglitsch, F.G.; Toreti, A.; Xoplaki, E.; Della-Marta, P.M.; Zerefos, C.S.; Türkeş, M.; Luterbacher, J. Heat wave changes in the eastern Mediterranean since 1960. Geophys. Res. Lett. 2010, 37, 4802. [Google Scholar] [CrossRef] [Green Version]
  31. Largeron, Y.; Guichard, F.; Roehrig, R.; Couvreux, F.; Barbier, J. The April 2010 North African heatwave: When the water vapor greenhouse effect drives nighttime temperatures. Clim. Dyn. 2020, 54, 3879–3905. [Google Scholar] [CrossRef]
  32. Varela, R.; Rodríguez-Díaz, L.; DeCastro, M. Persistent heat waves projected for Middle East and North Africa by the end of the 21st century. PLoS ONE 2020, 15, e0242477. [Google Scholar] [CrossRef] [PubMed]
  33. Kew, S.F.; Philip, S.Y.; Jan van Oldenborgh, G.; van der Schrier, G.; Otto, F.E.; Vautard, R. The exceptional summer heat wave in southern Europe 2017. Bull. Am. Meteorol. Soc. 2019, 100, S49–S53. [Google Scholar] [CrossRef]
  34. Olita, A.; Sorgente, R.; Natale, S.; Gaberšek, S.; Ribotti, A.; Bonanno, A.; Patti, B. Effects of the 2003 European heatwave on the Central Mediterranean Sea: Surface fluxes and the dynamical response. Ocean Sci. 2007, 3, 273–289. [Google Scholar] [CrossRef] [Green Version]
  35. Darmaraki, S.; Somot, S.; Sevault, F.; Nabat, P.; Narvaez, W.D.C.; Cavicchia, L.; Djurdjevic, V.; Li, L.; Sannino, G.; Sein, D.V. Future evolution of marine heatwaves in the Mediterranean Sea. Clim. Dyn. 2019, 53, 1371–1392. [Google Scholar] [CrossRef] [Green Version]
  36. von Schuckmann, K.; Le Traon, P.Y.; Smith, N.; Pascual, A.; Djavidnia, S.; Gattuso, J.P.; Grégoire, M.; Nolan, G.; Aaboe, S.; Aguiar, E.; et al. Copernicus Marine Service Ocean State Report, Issue 3. J. Oper. Oceanogr. 2019, 12, S1–S123. [Google Scholar] [CrossRef]
  37. Pisano, A.; Marullo, S.; Artale, V.; Falcini, F.; Yang, C.; Leonelli, F.E.; Santoleri, R.; Buongiorno Nardelli, B. New evidence of Mediterranean climate change and variability from sea surface temperature observations. Remote Sens. 2020, 12, 132. [Google Scholar] [CrossRef] [Green Version]
  38. Garrabou, J.; Gómez-Gras, D.; Medrano, A.; Cerrano, C.; Ponti, M.; Schlegel, R.; Bensoussan, N.; Turicchia, E.; Sini, M.; Gerovasileiou, V.; et al. Marine heatwaves drive recurrent mass mortalities in the Mediterranean Sea. Glob. Chang. Biol. 2022, 28, 5708–5725. [Google Scholar] [CrossRef]
  39. Juza, M.; Fernández-Mora, À.; Tintoré, J. Sub-Regional Marine Heat Waves in the Mediterranean Sea From Observations: Long-Term Surface Changes, Sub-Surface and Coastal Responses. Front. Mar. Sci. 2022, 9, 785771. [Google Scholar] [CrossRef]
  40. Androulidakis, Y.S.; Krestenitis, Y.N. Sea Surface Temperature Variability and Marine Heat Waves over the Aegean, Ionian, and Cretan Seas from 2008–2021. J. Mar. Sci. Eng. 2022, 10, 42. [Google Scholar] [CrossRef]
  41. Simon, A.; Plecha, S.M.; Russo, A.; Teles-Machado, A.; Donat, M.G.; Auger, P.A.; Trigo, R.M. Hot and cold marine extreme events in the Mediterranean over the period 1982–2021. Front. Mar. Sci. 2022, 9, 892201. [Google Scholar] [CrossRef]
  42. Dayan, H.; McAdam, R.; Juza, M.; Masina, S.; Speich, S. Marine heat waves in the Mediterranean Sea: An assessment from the surface to the subsurface to meet national needs. Front. Mar. Sci. 2023, 10, 142. [Google Scholar] [CrossRef]
  43. Hamdeno, M.; Alvera-Azcarate, A. Marine heatwaves characteristics in the Mediterranean Sea: Case study the 2019 heatwave events. Front. Mar. Sci. 2023, 10, 1093760. [Google Scholar] [CrossRef]
  44. Merchant, C.J.; Embury, O.; Bulgin, C.E.; Block, T.; Corlett, G.K.; Fiedler, E.; Good, S.A.; Mittaz, J.; Rayner, N.A.; Berry, D.; et al. Satellite-based time-series of sea-surface temperature since 1981 for climate applications. Sci. Data 2019, 6, 223. [Google Scholar] [CrossRef] [Green Version]
  45. Pisano, A.; Buongiorno Nardelli, B.; Tronconi, C.; Santoleri, R. The new Mediterranean optimally interpolated pathfinder AVHRR SST Dataset (1982–2012). Remote Sens. Environ. 2016, 176, 107–116. [Google Scholar] [CrossRef]
  46. Saha, K.; Zhao, X.; Zhang, H.-M.; Casey Kenneth, S.; Zhang, D.; Baker-Yeboah, S.; Kilpatrick Katherine, A.; Evans Robert, H.; Ryan, T.; Relph John, M. AVHRR Pathfinder Version 5.3 Level 3 Collated (L3C) Global 4 km Sea Surface Temperature for 1981-Present; Dataset; NOAA National Centers for Environmental Information: Asheville, NC, USA, 2018. [CrossRef]
  47. Good, S.; Fiedler, E.; Mao, C.; Martin, M.J.; Maycock, A.; Reid, R.; Roberts-Jones, J.; Searle, T.; Waters, J.; While, J.; et al. The current configuration of the OSTIA system for operational production of foundation sea surface temperature and ice concentration analyses. Remote Sens. 2020, 12, 720. [Google Scholar] [CrossRef] [Green Version]
  48. Hersbach, H.; Bell, B.; Berrisford, P.; Hirahara, S.; Horányi, A.; Muñoz-Sabater, J.; Nicolas, J.; Peubey, C.; Radu, R.; Schepers, D.; et al. The ERA5 global reanalysis. Q. J. R. Meteorol. Soc. 2020, 146, 1999–2049. [Google Scholar] [CrossRef]
  49. Wilks, D.S. Statistical Methods in the Atmospheric Sciences; Academic Press: New York, NY, USA, 2011; ISBN 0123850223. [Google Scholar]
  50. Zhao, Z.; Marin, M. A MATLAB toolbox to detect and analyze marine heatwaves. J. Open Source Softw. 2019, 4, 1124. [Google Scholar] [CrossRef]
  51. Menna, M.; Gačić, M.; Martellucci, R.; Notarstefano, G.; Fedele, G.; Mauri, E.; Gerin, R.; Poulain, P.M. Climatic, Decadal, and Interannual Variability in the Upper Layer of the Mediterranean Sea Using Remotely Sensed and In-Situ Data. Remote Sens. 2022, 14, 1322. [Google Scholar] [CrossRef]
  52. Mohamed, B.; Mohamed, A.; Alam El-Din, K.; Nagy, H.; Elsherbiny, A. Sea level changes and vertical land motion from altimetry and tide gauges in the Southern Levantine Basin. J. Geodyn. 2019, 128, 1–10. [Google Scholar] [CrossRef]
  53. Wang, F.; Shao, W.; Yu, H.; Kan, G.; He, X.; Zhang, D.; Ren, M.; Wang, G. Re-evaluation of the Power of the Mann-Kendall Test for Detecting Monotonic Trends in Hydrometeorological Time Series. Front. Earth Sci. 2020, 8, 14. [Google Scholar] [CrossRef]
  54. Gilbert, R.O. Statistical Methods for Environmental Pollution Monitoring; John Wiley & Sons: Hoboken, NJ, USA, 1997. [Google Scholar]
  55. Emery, W.J.; Thomson, R.E. Data Analysis Methods in Physical Oceanography; Newnes: Oxford, UK, 1997; ISBN 0080314341. [Google Scholar]
  56. Mohamed, B.; Abdallah, A.M.; Din, K.A.E.; Nagy, H.; Shaltout, M.A. Inter-annual variability and trends of sea level and sea surface temperature in the mediterranean sea over the last 25 years. Pure Appl. Geophys. 2019, 176, 3787–3810. [Google Scholar] [CrossRef]
  57. Pastor, F.; Valiente, J.A.; Palau, J.L. Sea surface temperature in the Mediterranean: Trends and spatial patterns (1982–2016). Pure Appl. Geophys. 2018, 175, 4017–4029. [Google Scholar] [CrossRef] [Green Version]
  58. Mohamed, B.; Skliris, N. Steric and atmospheric contributions to interannual sea level variability in the eastern mediterranean sea over 1993–2019. Oceanologia 2022, 64, 50–62. [Google Scholar] [CrossRef]
  59. Gacic, M.; Civitarese, G.; EusebiBorzelli, G.L.; Kovacevic, V.; Poulain, P.M.; Theocharis, A.; Menna, M.; Catucci, A.; Zarokanellos, N. On the relationship between the decadal oscil-lations of the Northern Ionian Sea and the salinity distributions in the Eastern Mediterranean. J. Geophys. Res. 2011, 116, C12002. [Google Scholar] [CrossRef]
  60. Gacic, M.; Civitarese, G.; Kovacevic, V.; Ursella, L.; Bensi, M.; Menna, M.; Cardin, V.; Poulain, P.M.; Cosoli, S.; Notarstefano, G.; et al. Extreme winter 2012 in the Adriatic: An example of climatic effect on the BiOS rhythm. Ocean Sci. 2014, 10, 513–522. [Google Scholar] [CrossRef] [Green Version]
  61. Mkhinini, N.; Coimbra, A.L.S.; Stegner, A.; Arsouze, T.; Taupier-Letage, I.; Béranger, K. Long-lived mesoscale eddies in the eastern Mediterranean Sea: Analysis of 20 years of AVISO geostrophic velocities. J. Geophys. Res. Ocean 2014, 119, 8603–8626. [Google Scholar] [CrossRef]
  62. Nagy, H.; Di-Lorenzo, E.; El-Gindy, E. The Impact of Climate Change on Circulation Patterns in the Eastern Mediterranean Sea Upper Layer Using Med-ROMS Model. Prog. Oceanogr. 2019, 175, 244. [Google Scholar] [CrossRef]
  63. Rubino, A.; Gačić, M.; Bensi, M.; Kovačević, V.; Malačič, V.; Menna, M.; Negretti, M.E.; Sommeria, J.; Zanchettin, D.; Barreto, R.V.; et al. Experimental evidence of long-term oceanic circulation reversals without wind influence in the North Ionian Sea. Sci. Rep. 2020, 10, 1905. [Google Scholar] [CrossRef] [Green Version]
  64. Menna, M.; Reyes-Suarez, N.C.; Civitarese, G.; Gačić, M.; Poulain, P.-M.; Rubino, A. Decadal variations of circulation in the Central Mediterranean and its interactions with the mesoscale gyres. Deep Sea Res. Part II Top. Stud. Oceanogr. 2019, 164, 14–24. [Google Scholar]
  65. Menna, M.; Poulain, P.M.; Ciani, D.; Doglioli, A.; Notarstefano, G.; Gerin, R.; Rio, M.H.; Santoleri, R.; Gauci, A.; Drago, A. New insights of the Sicily Channel and Southern Tyrrhenian Sea variability. Water 2019, 11, 1355. [Google Scholar] [CrossRef] [Green Version]
  66. Hobday, A.J.; Oliver, E.C.J.; Gupta, A.S.; Benthuysen, J.A.; Burrows, M.T.; Donat, M.G.; Holbrook, N.J.; Moore, P.J.; Thomsen, M.S.; Wernberg, T.; et al. Categorizing and naming marine heatwaves. Oceanography 2018, 31, 162–173. [Google Scholar] [CrossRef] [Green Version]
  67. Grazzini, F.; Viterbo, P. Record-breaking warm sea surface temperature of the Mediterranean Sea. ECMWF Newslett. 2003, 98, 30–31. [Google Scholar]
  68. Sparnocchia, S.; Schiano, M.; Picco, P.; Bozzano, R.; Cappelletti, A. The anomalous warming of summer 2003 in the surface layer of the Central Ligurian Sea (Western Mediterranean). Ann. Geophys. 2006, 24, 443–452. [Google Scholar] [CrossRef]
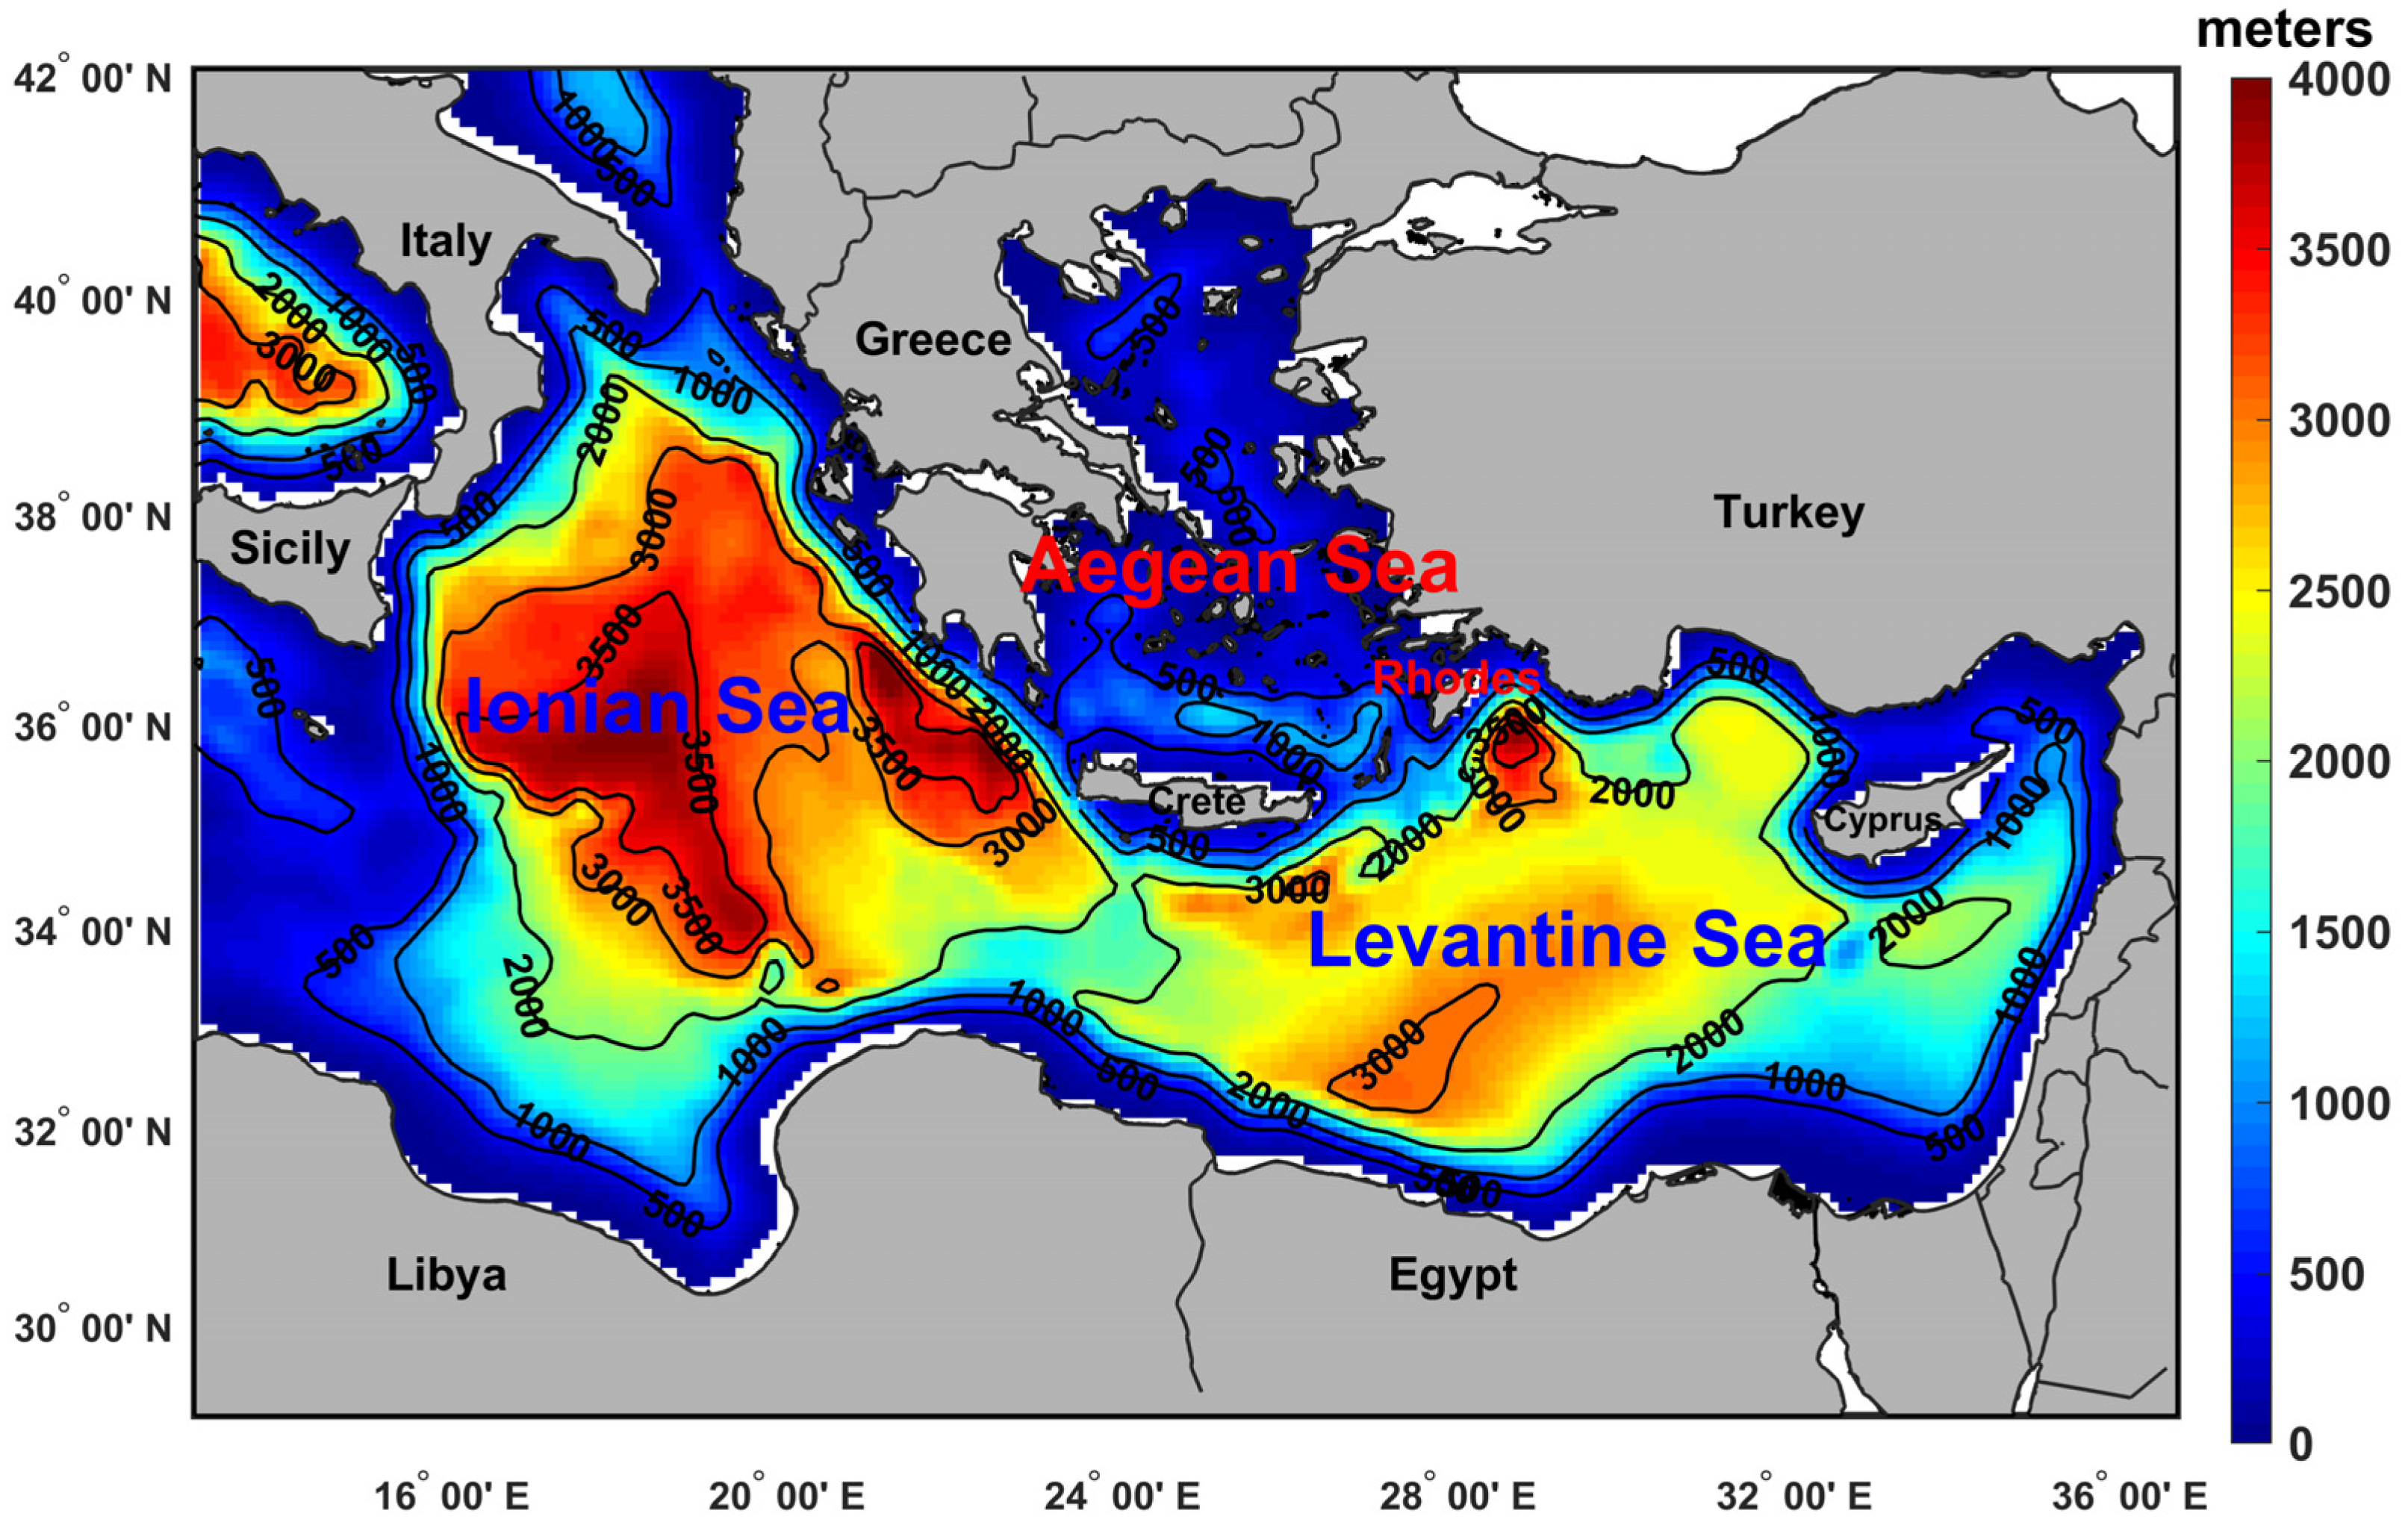
Figure 1. The bathymetric map of the EMED with the main geographic features and sub-basins. Bathymetry and topography are from General Bathymetric Chart of the Oceans GEBCO dataset (www.gebco.net) (accessed on 20 December 2022).
Remotesensing 15 01841 g001
Figure 2. Spatial distribution of the climatological means (a,b) and trends (c,d) of atmospheric and oceanic temperatures from 1982 to 2021.
Remotesensing 15 01841 g002aRemotesensing 15 01841 g002b
Figure 3. Temporal evolution of AHWs (red bars) and MHWs (blue bars) for (a) frequency and (b) total days over the entire EMED during 1982–2021.
Remotesensing 15 01841 g003
Figure 4. The spatial distribution of the annual mean of (a) AHW frequency (events), (b) MHW frequency (events), and (c) the correlation map between them from 1982 to 2021.
Remotesensing 15 01841 g004
Figure 5. The spatial distribution of the annual mean of (a) AHW days (days) and (b) MHW days (days), and (c) the correlation map between them from 1982 to 2021.
Remotesensing 15 01841 g005aRemotesensing 15 01841 g005b
Figure 6. The trend maps of (a) AHW frequency, (b) MHW frequency, (c) AHW days, and (d) MHW days from 1982 to 2021 over the EMED region; the dotted red points show the non-significant (p > 0.05) trend at 95% confidence level.
Remotesensing 15 01841 g006aRemotesensing 15 01841 g006b
Figure 7. Annual AHWs (continuous red line) and MHWs (continuous blue line) and their co-occurrence (continuous green line) over the study period (1982–2020) for (a) frequency and (b) duration.
Remotesensing 15 01841 g007aRemotesensing 15 01841 g007b
Figure 8. Frequency distribution of event durations of AHWs, MHWs and their co-occurrence for all grid cells within EMED from 1982 to 2021.
Remotesensing 15 01841 g008
Figure 9. The 2021 co-occurrence of AHW (upper panel) and MHW (lower panel) events; the red shaded areas refer to the AHW/MHW events. The black solid line defines the SAT/SST (°C), the blue solid lines indicate the SAT/SST (°C) climatology, and the green solid lines denote the 90th percentile for SAT/SST (°C). The cyan and orange bars indicate the co-occurrence and stand-alone events, respectively.
Remotesensing 15 01841 g009
Figure 10. The spatial distribution of (a) SSTA (°C), (b) SATA (°C), and (c) wind speed anomaly (m/s) during the co-occurrence of MHW and AHW events from 29 July to 5 August 2021 over the EMED region.
Remotesensing 15 01841 g010
Disclaimer/Publisher’s Note: The statements, opinions and data contained in all publications are solely those of the individual author(s) and contributor(s) and not of MDPI and/or the editor(s). MDPI and/or the editor(s) disclaim responsibility for any injury to people or property resulting from any ideas, methods, instructions or products referred to in the content.