Article

Monitoring of Land Degradation in Greece and Tunisia Using Trends.Earth with a Focus on Cereal Croplands

Laboratory of Remote Sensing, Spectroscopy and GIS, School of Agriculture, Aristotle University of Thessaloniki, 54124 Thessaloniki, Greece
*
Author to whom correspondence should be addressed.
Remote Sens. 2023, 15(7), 1766; https://doi.org/10.3390/rs15071766
Submission received: 31 January 2023 / Revised: 18 March 2023 / Accepted: 20 March 2023 / Published: 25 March 2023

Abstract

:
Land degradation (LD) processes are widespread in drylands worldwide and are accelerated by climate change. As a result, food security and livelihoods are at risk. Thus, there is a need to monitor LD trends, especially in agricultural areas. Mediterranean countries, including Tunisia and Greece, are concerned due to the presence of drivers and pressures causing land degradation. Through the Trends.Earth plugin, the SDG 15.3.1 indicator can be implemented to map LD status. In this study, we mapped LD in Greece and Tunisia for the recommended baseline period of 2001–2015 and the selected reporting period of 2016–2020. The land productivity was assessed within Trends.Earth using the MODIS MOD13Q1 product, while the default datasets were used for the other sub-indicators. The main findings are: (i) the percentage of degraded land decreased from the baseline to the reporting period from 4.83% to 2.62% of total area in Greece and 9.97% to 6.26% in Tunisia—degradation rates that differ from those reported to the UNCCD (United Nations Convention to Combat Desertification) by the respective national authorities; (ii) the dominant land condition in Greece was improved, while in Tunisia, it was stable; (iii) land productivity presented a similar trend through the SDG 15.3.1 indicator over both countries, including the net land productivity dynamics over croplands; (iv) based on analysis using plant functional types performed with MODIS MCD12Q1, the highest portion of degraded land in Greece was located in grasslands and in Tunisia in cereal croplands (after desert areas); and (v) with a focus on LD over cereal croplands, the portion of degraded areas appeared to decrease in both Greece and Tunisia. The percentage was higher in Tunisia, representing 16.52% of the total degraded land during the reporting period compared to 10.83% in Greece. All the above stress the need to foster the adoption of sustainable land management practices, especially in Tunisia, and speed up the implementation of measures to achieve LD neutrality.

1. Introduction

Land degradation (LD) is one of the greatest global challenges to human livelihoods and the environment. The United Nations Convention to Combat Desertification (UNCCD) defines LD as the result of human-induced actions which exploit the land, causing its utility, biodiversity, soil fertility, and overall health to decrease [1]. On a global scale, about one fifth of land is degraded, where about 3.2 billion people reside [1]. The latter number is higher if we include people who depend on alterations in ecosystem goods and services as a consequence of LD [2]. More specifically, LD has severe implications on agricultural productivity, the environment, and food security, thus affecting human well-being [3]. The process of LD is very complex. Prăvălie et al. [4] reported that aridity is the pressure affecting 40% of the global arable land and that soil erosion concerns 20% of global arable systems, while other pressures—such as vegetation decline, soil salinization, and soil organic carbon decline—are less dominant. In most cases, though, these factors act synergistically.
In the Mediterranean region, LD and desertification processes are accelerated by climate change, extreme weather events, and human activities, resulting in a reduction in the land’s ability to maintain its economic, ecological, and productive functions [5]. According to the Intergovernmental Panel on Climate Change’s Special Report on Climate Change and Earth, climate change is one of the causes of LD, particularly in low-lying coastal areas, river deltas, and drylands. The relationship between climate change vulnerability and LD has not been adequately studied, though [6].
Land degradation neutrality (LDN) is the state in which the quantity and quality of land resources remain constant or increase within defined temporal and spatial scales [1]. As part of the Sustainable Development Goals (SDGs), 129 countries have pledged to establish national voluntary LDN targets and to take relevant measures to achieve LDN by 2030 [1]. Since 2018, 74 countries, including Tunisia, have participated in transformative projects and programs (TPPs) and are aiming to develop national or regional projects [7].
Global tools to strengthen national capacities to conduct quantitative assessments of LD in drylands was a major challenge of international agreements [8]. The SDG 15.3.1 indicator was introduced as a measure of the percentage of land that is degraded in total land area and is considered a tier 1 indicator, meaning it is clearly defined with a methodology agreed upon and applicable at global scale, and data are often available from UNCCD countries [9]. This proposed approach to assessing LD, which has been successfully implemented on a global scale, promotes the use of data analysis platforms that can potentially support countries to use the necessary datasets, including Earth observation (EO) data [10].
According to Theocharopoulos [5], apart from natural processes leading to land degradation in Greece, the main human-induced factors accelerating the process include soil erosion, soil disturbance, removal of vegetative soil cover and/or hedgerows, abandonment of terraces, overstocking and overgrazing, poor and inappropriate crop management (such as burning of crop residues), and wildfires. Work on land degradation in Greece has been undertaken by Karamesouti et al. [11] which modelled the soil quality index (SQI) as part of the environmentally sensitive areas index (ESAI) for the assessment of desertification during three periods for the whole country. Moderate soil quality characterizes over 70% of the country, while over 20% of the soils are of low quality. Additionally, Karamesouti et al. [12] analyzed land degradation processes for croplands in Crete in conjunction with socio-ecological transformations over a long period. The study revealed that the gradual replacement of cereals with olive trees and vineyards due to higher demand and price helped protecting natural resources. However, the mechanization and intensification of agriculture that followed this land use change led to higher soil erosion rates and higher sensitivity to land degradation.
In Tunisia, land and water conservation has been the focus of national policies for nearly 30 years. Tunisia, especially the southern desert rangelands, is a land-degradation-vulnerable country [13]. The northwestern areas that are covered by rainfed agriculture are also prone to land degradation due to intensive cropping and unsustainable land management practices [14,15]. The Global Land Degradation Assessment (GLADA) project in Tunisia, one of the six pilot countries, reported areas of LD and areas that show improvement over the period 1981–2003 [16]. In the degrading areas, half are scrubland (8% of the total scrubland area) and one third is cropland (30% of the arable land). Bayouli et al. [17] assessed land degradation in the southeast of Tunisia and mapped 3% of the Dhahar–Jeffara transect as degraded land, while 89% was stable over the period 1999–2018.
The above-mentioned studies were performed at a national or regional level. None downscaled the analysis or focused on a particular land cover or land use type. In addition, even though studies were conducted to assess land degradation in these countries, the results were not regularly updated every 4 years as recommended by the UNCCD [18] in order to detect changes in the spatial distribution and trends.
Monitoring progress towards achieving the SDGs, particularly those on land (SDG 15), requires the use of data with broad coverage, consistency in quality and availability, and processing using standardized methods. Given these requirements, EO data are particularly suitable for monitoring the SDGs, considering their global coverage and available spatial and temporal resolutions. Regardless of the great potential of EO to support LD studies, there are still several challenges that prevent its successful implementation, such as the scale of assessment, the in situ validation data, the mismatch between spatial and temporal resolution of datasets, and the variable temporal variation of different land degradation parameters [19,20,21].
Timeseries of the normalized difference vegetation index (NDVI) obtained from satellite sensors are commonly used to assess and monitor land productivity as a surrogate for net primary production (NPP) [22,23,24]. Jendoubi et al. [14] used the vegetation potential (90th percentile of NDVI) in order to map LD in northwest Tunisia. Other vegetation indices (e.g, the enhanced vegetation index—EVI) are also used. The performance of vegetation indices is linked to specific vegetation conditions. NDVI is sensitive to variations in the brightness in areas with low vegetation cover, while EVI can minimize changes in the canopy soil and sensitivity under dense vegeta-tion conditions [25]. Yengoh, et al. [22] supports the use of NDVI over other VIs as a surrogate for primary productivity and analysing land productivity dynamics. NDVI is preferred over the EVI because it is more directly related to fAPAR and can be more easily calculated from a larger range of satellite image datasets [18,22]. Linear trends of vegetation indices are usually considered as indicators of vegetation dynamics [24]. However, long-term NDVI trends can exhibit unidirectional as well as cyclic dynamics, including medium-term oscillations, both of which are poorly captured by linear trends [26,27]. As an alternative, the trend-cycle with five major patterns in vegetation dynamics (decreasing, increasing, recovery, relapsing, and no trend-cycles) was introduced by Easdale et al. [23] to monitor non-monotonic vegetation dynamics instead of linear trends.
The use of EO-based vegetation indices is well established for monitoring NPP. However, more research is needed to assess their capacity to track changes at finer spatial and temporal scales and to assess their relation to sustainable livelihoods [28]. The review by Prince [29] identified areas in the current monitoring methodology that need further development, including the extraction of NPP from NDVI taking into account climatic or seasonal factors. The trend in NDVI can be analyzed in relation to rainfall variability through rain use efficiency (RUE). This method is recommended in arid areas and water-limited regions [18]. Gamoun [13] explored the effect of RUE on NPP in the rangelands of southeast Tunisia. The GLADA project considered RUE but not land use change [16]. Unlike the RUE method, water use efficiency (WUE) assesses NPP responses to soil moisture availability rather than rainfall availability to take into account losses through surface runoff, excess of water, groundwater recharge, and evaporation [30]. In this method, NPP is divided by evapotranspiration rather than precipitation.
Giuliani et al. [10] stress the need to create data analysis platforms that can potentially support countries to discover, access, and use the necessary datasets to assess degradation and develop new capabilities for effective and efficient use of EO-based resources. Trends.Earth is an EO-based tool developed to harmonize the way in which the SDG 15.3.1 indicator is assessed using the advantages of EO datasets with spatial resolutions of 250 m–300 m following the data–information–knowledge model [9]. However, there is a need to develop methodologies to take advantage of available high-resolution satellite EO data (e.g., Landsat or Sentinel) [10,31]. The project Tools4LDN “Strengthening Land Degradation Neutrality data and decision-making through free and open access platforms” attempted to add 10 to 30 m global datasets into Trends.Earth, but the last version of the tool does not include the data yet [32]. The MISLAND platform, on the other hand, successfully widened the use of Landsat imagery for assessing LD in North Africa and provides regular information on vegetation cover gain/loss to decision makers and environmental agencies [33].
Frequently updated data on land cover at a global scale are required for land cover change monitoring and LD assessment. There are many sources of land cover maps, but none of the global datasets satisfy the recommended time span (availability since 2000) and 100 m grid size of the data quality standards [18]. The global Copernicus land cover data at 100 m spatial resolution are only available from 2015 onward [34]. The CORINE Land Cover is limited to Europe and has an update frequency of 6 years [35]. The global ESA-CCI is yearly updated and available at medium resolution and thus is conveniently integrated by default in the Trends.Earth plugin [36]. The MCD12Q1 [37] has the advantage of being globally and annually available at medium spatial resolution and of integrating a plant functional type (PFT) classification scheme as well as the FAO land cover classification systems (LCCS) and other schemes. The PFT scheme is suggested for use in Earth system models [38]. Indeed, PFTs reduce the complexity of vegetation diversity to a few plant types and thus help in modelling the functioning of ecosystems and link climate to ecosystem models through a unified treatment of vegetation [38]. Even though the ESA-CCI maps are oriented to the PFTs [18] and a tool was developed to convert ESA-CCI land cover to PFTs [39], PFT maps are readily processed until 2015, while for previous years, the open-source tool should be manually run. Additionally, unlike MCD12Q1, the ESA-CCI classes do not classify cereal crops separately.
Approximately 12 million hectares of productive land—roughly the size of Greece—are degraded each year worldwide. This is mainly due to overexploitation of land resources and lack of protective measures to ensure sustainability [1]. The World Overview of Conservation Approaches and Technologies (WOCAT) developed the global Sustainable Land Management (SLM) Database, which has been officially recognized by the UNCCD as the primary recommended SLM best practices. This database can help advance the scaling up of SLM and thus contribute to land degradation neutrality globally. The SLM database includes 19 measures (technologies and approaches) for Greece and 39 for Tunisia, including conservative agriculture (no-tillage, crop rotation, mulching), agroforestry, soil erosion control, and water management practices (water harvesting, deficit irrigation, recharge of wells). However, most of the efforts and achievements recorded by WOCAT focus on the reduction and prevention of LD rather than rehabilitation, as emphasized by many policy makers [40]. In addition, a decision support framework was developed by the UN Food and Agriculture Organization (FAO) and WOCAT, which guides countries in LD and SLM assessments [41].
Achieving LDN requires the adoption of SLM practices to increase the sustainable provision of ecosystem goods and services that human populations will demand. It will also require the development of systematic, robust, and validated methods for monitoring progress at project, sub-national, and national scales. Gonzalez-Roglich et al. [28] report that satellite-derived land productivity indicators were successful in identifying the impacts of SLM practices on primary productivity. The use of such methods may function as an early warning tool to inform decision-makers on land condition in a timely manner, support adaptive land management as strategies for SLM at an appropriate scale, and also assess SLM practices. The adoption rate of SLM on cropland was estimated to be 0.1% in the Near East and North Africa and 1.7% in East Europe [42].
According to Gondard et al. [43], a PFT-based approach is advantageous for the management of degraded land and ecosystem planning in southern Europe and northern Africa as it helps in planning harmonized practices using PFT because plant species are grouped based on similar phenology and physiology and will thus respond similarly to environmental conditions and disturbances.
By considering the conventional baseline period of 2001–2015 and a post period for the reporting, this study aims to fully analyze the outputs of the Trends.Earth plugin to detect patterns in land degradation in Greece and Tunisia through the indicator SDG 15.3.1. In addition, the plant functional type framework is used to further understand the dynamics of land degradation in each country. Finally, focus is placed on cereal croplands in order to evaluate potential impact on food security.

2. Materials and Methods

2.1. Study Areas

Land degradation was monitored in two countries of the Mediterranean basin, Greece on the northern side and Tunisia on the southern side (see Figure 1). Both countries are prone to land degradation processes, and cereal farming is essential to their food production. According to the reports submitted by both countries to the UNCCD through the PRAIS platform, the total degraded areas in 2015 in Greece were 16.22% and 12.6% of the total area, respectively [44].

2.1.1. Greece

Greece is located in the northeastern part of the Mediterranean basin. According to the Climate Atlas of Greece published by the Hellenic National Meteorological Service [45] and based on the Köppen climate classification [46], the Mediterranean climate is the dominant climate found in Greece, with a temperate dry/hot summer (Csa) in the south and west of the country and a temperate dry/warm summer (Csb) in the north. Eighty percent of Greece consists of mountains and hills. Due to its topography, there is a great variety of climate subtypes, always in the Mediterranean climate frame, encountered in several regions [45]. During the summer, the weather is more often sunny and dry, and any precipitation falls as showers or thunderstorms from cumulus clouds. Heat waves can occur but are usually quite mild in coastal areas. Winters are wet. The western regions receive a higher amount of rainfall, and the average annual rainfall can reach 2000 mm. Areas with high altitude are covered by snow during winter months.
Agriculture is one of the primary activities in Greece. According to FAOSTAT [47], the main crops in 2020 were barley, grapevine, lupine, olive, legumes, and wheat. The gross production index number in total for grains was 71.58. The amount of barley produced was 398,680 tons, and that of wheat was 1,095,150 tons.

2.1.2. Tunisia

Tunisia is located in the southern part of the Mediterranean basin. The terrain in the north and west is mountainous. The climate in the north is Mediterranean with a temperate dry/hot summer according to Köppen–Geiger climate classification (Csa) [46]—where winters are mild (except in the western part, which is colder) with moderate rainfall and hot and dry summers. When moving south, plains dominate and climate naturally becomes warmer and drier with arid steppe climate (BSh, BSk). More to the south, the plains merge into the Sahara and the climate becomes arid hot desert (BWh). A series of salt lakes, known as chotts, lie at the northern edge of the Sahara (south west). The average annual rainfall is less than 500 mm. The southernmost part receives up to 50 mm of rain in areas around El Borma, along the southern border with Algeria.
Regarding agricultural production, which is an important sector in Tunisia, the most important crops are almond, barley, olive, and wheat [47]. In 2020, the gross production index number for cereals as a whole was 93.55, and the yields for barley and wheat were 466,000 tons and 1,042,000 tons, respectively [47].

2.2. Data

2.2.1. Trends.Earth Data

The MOD13Q1 Version 6 dataset was used for the extraction of vegetation indices within Trends.Earth. The dataset is provided by the Moderate Resolution Imaging Spectroradiometer (MODIS) onboard the Terra satellite every 16 days at a spatial resolution of 250 m as a Level 3 product. The MOD13Q1 product provides two main vegetation indices, the NDVI and the EVI. For this 16-day composite product, the algorithm selects the best available pixel value from all acquisitions from the 16-day period. The criteria used are low cloud cover, low viewing angle, and highest NDVI/EVI value. The reason behind the selection of this data source rather than the AVHRR one, also among Trends.Earth datasets, was the spatial resolution (250 m instead of 1 km) and time range (2001–2020 instead of 1982–2015), which covers the entire monitoring period.
Among the other sources of data used by Trends.Earth is the ESA Climate Change Initiative (ESA-CCI) dataset, covering the period from 1992–2020 with a spatial resolution of 300 m used for the monitoring of land cover change by reclassifying the 22 classes into the 7 land cover classes needed for reporting to the UNCCD (forest, grassland, cropland, wetland, artificial area, bare land, and water) [36]. The default Trends.Earth reclassification matrix was used. For the assessment of the initial soil organic carbon (SOC) layer, the ISRIC SoilGrids 250 m global dataset was used with spatial predictions for selected soil properties at six standard depths [48]. The Natural Earth Administrative Boundaries are used in Trends.Earth for the country boundaries.

2.2.2. Plant Functional Types and Cereal Maps

The MODIS Land Cover Type (MCD12Q1) Version 6 product provides global land cover types at annual intervals since 2001 [37]. The annual MCD12Q1 dataset is derived from supervised classifications of reflectivity data from the MODIS of both Terra and Aqua satellites with a spatial resolution of 500 m. Six different classification schemes are provided, including the plant functional type (PFT) scheme described by Bonan et al. [38]. Eleven types are considered: water areas, evergreen conifers, evergreen broad-leaved trees, deciduous conifers, deciduous broad-leaved trees, shrublands, grassy lands, cereal crops, broadleaf crops, urban and residential areas, and barren land. In the absence of a detailed crop map with a cereal class for the two countries under study, the cereal croplands were delineated using the PFT dataset, for which the cereal cropland class was assigned to areas dominated by herbaceous annuals (lower than 2 m) with at least 60% cultivated cereal crops.

2.3. Methods

2.3.1. The SDG Indicator

The SDG 15.3.1 indicator is calculated by assessing changes over time in three sub-indicators—land productivity, land cover, and carbon stocks (represented by SOC stocks)—to determine whether land degradation increased, remained stable, or decreased in a specific area [10]. As a requirement of the UNCCD, each country has the obligation to report the land degradation for its entire territory during the baseline period from 2001 to 2015. This sets the benchmark against which progress towards SDG target 15.3 and LDN is assessed. This assessment can be performed by estimating LD for a subsequent reporting period, indicating the recent changes in degraded land compared to the reference baseline period. Each sub-indicator is calculated using a subset of the baseline or the reporting period, depending on the requirements for trend calculations. For the land productivity sub-indicator, the time series used should cover a period which is long enough to give statistically robust results when calculating trends, which can be a long-term trend for the trajectory and a short-term trend for the state. Performance is a spatial metric calculated over a set of pixels for the same land cover. In this study, the trajectory was calculated using a 15-year period to assess the change of land productivity over time (2001–2015 for the baseline period and 2005–2020 for the reporting period). The state was computed for the baseline period by comparing the productivity of 2013–2015 to the productivity of 2001–2012 and for the reporting period by comparing the productivity of 2018–2020 to the productivity of 2005–2017. The performance was computed by comparing the productivity in an area over the periods 2001–2015 and 2016–2020 to that of similar areas.
The sub-indicators are then combined using the one out, all out principle to finally output the area of degraded land as a percentage of the total area. The one out, all out principle implies that when one sub-indicator is assessed as degraded or stable and is assessed as degraded in a previous period in a land unit, then the final indicator is assessed as degraded for the specific land unit [10].

2.3.2. Use of the Trends.Earth Plugin

The Trends.Earth plugin, developed by Conservation International, is a robust platform for monitoring indicators for multiple SDGs. It draws data from a range of EO global datasets, integrates nationally available data, and uses a cloud-based approach based on the Google Earth Engine for the computation of the sub-indicators, while the final indicator is computed locally. The use of Trends.Earth is recommended by the UNCCD for national agencies to monitor and report land degradation. Trends.Earth is a plugin for QGIS that calculates the sub-indicators for the boundaries of a country and a region or a user-defined area separately and then combines them into the SDG 15.3.1 indicator. The results are generated as Excel files with metrics and raster maps ready in a format compatible with the requirements of the UNCCD.
In this work, the implementation of SDG 15.3.1 using Trends.Earth v1.0.8 performed was according to the guidelines of Sims et al. [18]. The indicator was first calculated for the baseline period of 2001–2015. The reporting period of 2016–2020 was chosen, which is a four-year period as recommended by the UNCCD. Although it was known that the four-year period may not provide a reliable detection of change for many practices with slow-changing variables, such as SOC stocks, it was not possible to expand it due to the unavailability of some of the global datasets.
Trends.Earth provides various data with different time coverage, including the JRC Land Productivity map [49]. For the monitoring of vegetation based on NDVI, the MODIS dataset MOD13Q1 was preferred, as it covers both periods’ spans (2001–2020) and could be used with appropriate sub-periods for the computation of trends in land productivity (trajectory, state, performance). For both periods, the same datasets and methods were used.
Among the available methods for the calculation of land productivity, the NDVI trends were used without climate calibration through RUE or WUE. Even though this method does not take into account the effect of climate on LD, its use is recommended in agricultural areas in which fields are irrigated to avoid water stress conditions. Thus, in this study, land degradation was considered regardless of its cause—human- or climate-induced.
Land productivity was assessed through the analysis of NDVI trends over the selected period of 2005–2020. In Trends.Earth, land productivity is classified in five classes (Declining, Early signs of decline, Stable but stressed, Stable, Increasing), while for the SDG 15.3.1 indicator, three classes are considered (Degraded, Stable, Improved). Areas are considered to be Improved in terms of land degradation, if they have “Increasing” land productivity, to be Stable if they have “Stable” productivity, and to be Degraded if they are classified as “Stressed”, “Early signs of decline”, or “Declining”.
The SOC change sub-indicator was determined by combining the initial SOC from the SoilGrids dataset and a transition matrix. The default transition matrices for land cover and SOC were used.
The results produced by the Trends.Earth QGIS plugin were automatically imported into QGIS for further analysis. We used QGIS Desktop 3.16.13 software that was compatible with version 1 of the plugin.

2.3.3. Pre-Processing of PFT Maps and Statistical Analysis

The pre-processing of the PFT maps consisted of producing two maps of steady PFTs one for the baseline and one for the reporting period. A PFT was considered steady over the baseline period if it remained unchanged from 2001 to 2015. For this purpose, MCD12Q1 datasets were downloaded for the years 2001, 2015, 2016, and 2020. The products were reprojected, and the layer corresponding to the PFTs was extracted from the whole dataset. Based on the two maps of 2001 and 2015 and 2016 and 2020, a new map was generated with steady PFT throughout the baseline period and reporting period, respectively.
Finally, a cross-tabulation was performed between the steady PFTs and the SDG 15.3.1 indicator map in order to quantify the land labelled as degraded, stable, or improved according to each PFT and in particular for cereal croplands.

3. Results

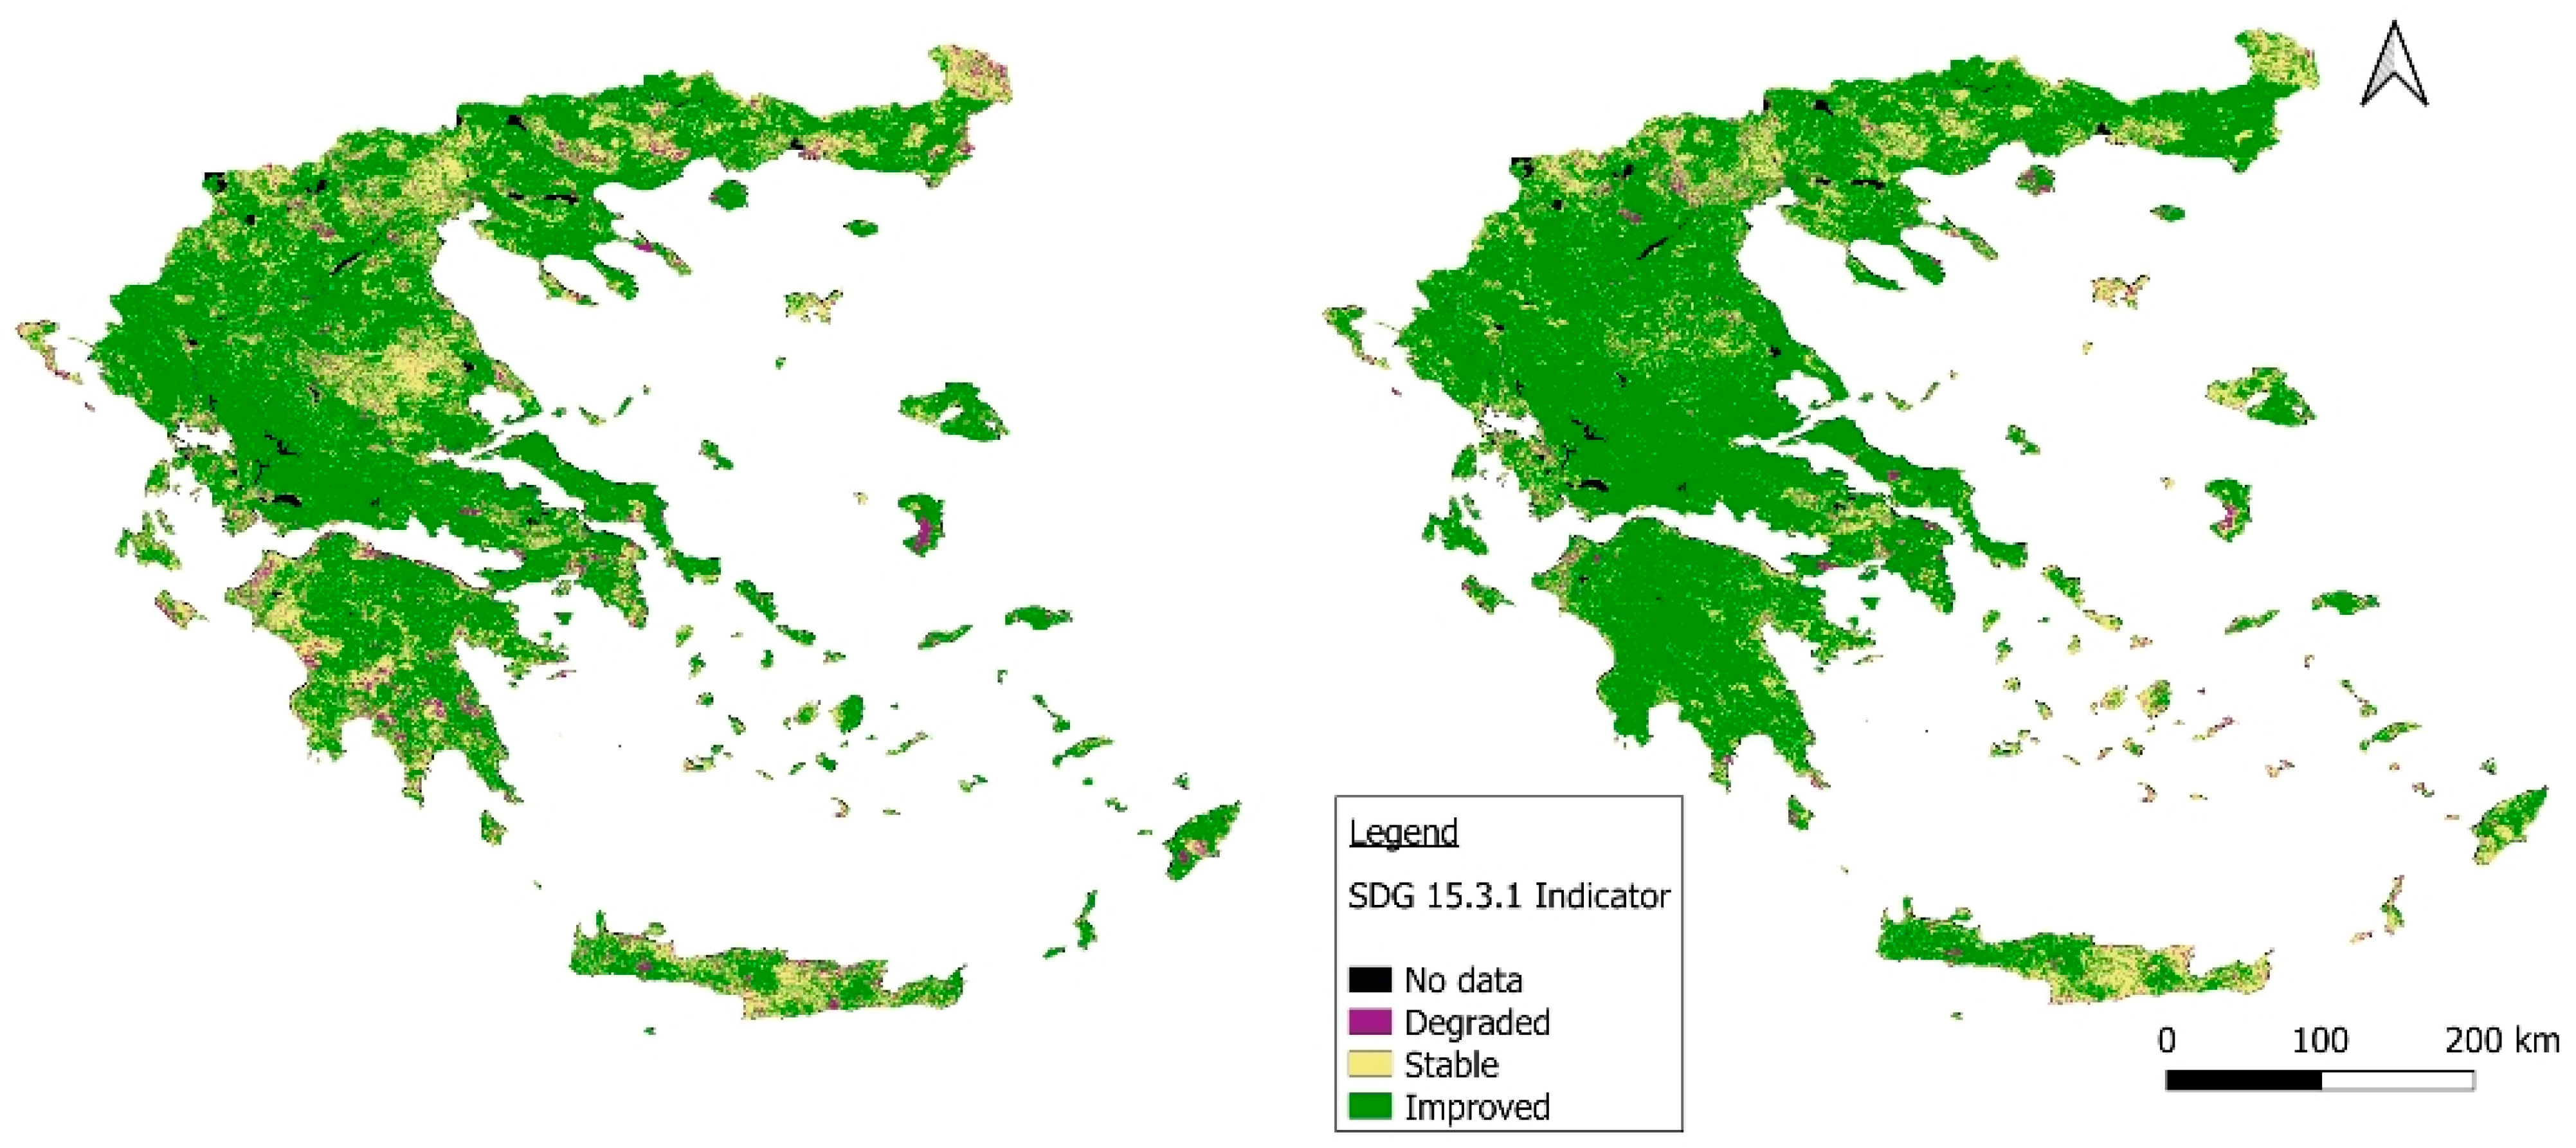
3.1. Trends.Earth Derived SDG 15.3.1

Table 1 presents Trends. Earth output summary tables for the SDG 15.3.1 indicator in Greece and Tunisia for both the baseline and reporting periods. Figure 2 and Figure 3 correspond to the produced LD maps.
According to the LD metrics (Table 1), in Greece, the degraded land percentage dropped from 4.83% during the baseline period to 2.62% in the reporting period, while the largest portion of the land shows improvement during both periods (77.08% in 2016–2020). In Tunisia, the largest portion of the land presented a stable degradation (75.9% in 2016–2020), while the percentage of degraded land decreased from 9.97% in the baseline period to 6.26% in the reporting period.
In Figure 2, the land in Greece with the dominant improved land condition is evident for both periods. Land of stable condition was clearly less during the reporting period (right map) and was mainly found in Evros, Western Macedonia, Thessaly, Evoia, and Crete, while degraded lands are sparse across the country. Figure 3 shows the difference in spatial distribution of land degradation in Tunisia between the baseline (left map) and reporting period (right map). During the latter, the land with improved land condition is in the northwest part and in the eastern areas. The whole southern part of the country has a stable status of degradation, as it is covered by desert. Using Trends.Earth, all the country’s area except water bodies, which are included in the “No data” category, are labelled. A large area located in the southwest (Kebili and Tozeur governorates) is partly covered by temporary water and salt lakes and is mapped as degraded by Trends.Earth. In case of absence of vegetation in the area, the degradation resulting from low land productivity through NDVI-based analysis should be put into perspective.

3.2. Analysis of the SDG 15.3.1 Sub-Indicators

The sections below present the results obtained for each of the three SDG 15.3.1 sub-indicators for each country and each period.

3.2.1. The Land Productivity Sub-Indicator

According to the land productivity metrics (Table 2), in Greece during the baseline period, most of the land had improved productivity (69.95%). The remaining area was mainly stable, while degradation occurred in 3.86% of the land. During the reporting period, an even greater proportion of the land had improved productivity (77.14%), and the percentage of land that was stable and that was degraded decreased. Therefore, the land productivity shows a similar pattern to the SDG 15.3.1 indicator.
In the case of Tunisia, the largest percentage of land is stable in terms of productivity, with 77.81% during the baseline period and 76.76% during the reporting period. Land productivity improved from 13.29% to 16.99% of the area during the reporting period, and the percentage of degraded land decreased (Table 2).
As in the case of Greece, the land productivity sub-indicator in Tunisia follows the pattern of the SDG 15.3.1 indicator.
The land productivity maps produced by Trends.Earth for the two countries and the two periods are presented in Figure 4 and Figure 5.
The spatial distribution of land productivity is very similar to that of the SDG 15.3.1 indicator (Figure 2 and Figure 3), in which improved land productivity in Greece and stable land productivity in Tunisia prevail during both periods. In the land productivity maps, the negative trend in land productivity is presented with a more detailed classification (Declining, Early signs of degradation, Stable but stressed) before classes are merged in the final class, “Degraded”.
An additional output provided by Trends.Earth is the land productivity dynamics for six land cover classes (water bodies were excluded). The results for the croplands class are shown in Table 3.
In Greece, the highest portion of croplands has an increasing productivity dynamic in both periods. In particular, 59.65% during the baseline period and 70.64% (37,961 sq·km) during the reporting period. In Tunisia, the highest portion of croplands is stable, around 61% in both periods, while the percentage with increased land productivity was 28.28% during the baseline period and 31.54% (14,730 sq·km) during the reporting period.

3.2.2. The Land Cover Sub-Indicator

Table 4 summarizes the outputs for the land cover sub-indicator. It shows that land cover is dominantly stable for both countries. The stability in both countries slightly increased from 97% during the baseline period to 99% during the reporting period.
Table 5 shows the land cover change metrics per class of land cover using the seven classes set by Trends.Earth. The highest rate of change for both countries and periods was for artificial areas, with 42% and 7.34% in Greece during the baseline and reporting periods, respectively, and 29.9% and 13.53%, respectively, in Tunisia. In the latter country, a high increase in the extent of grassland areas was reported, with 8.52% for the reporting period after a large drop in the baseline period (−18.05%). Additionally, after a high increase in the extent of tree-covered areas and croplands during the baseline (10.52% and 5.02%, respectively) the extent remained almost unchanged during the reporting period. The high percentage of change in artificial areas reflects intense urbanization activity, especially during the baseline period.

3.2.3. The Soil Organic Carbon Sub-Indicator

Table 6 summarizes the output for the SOC change sub-indicator. It shows that SOC barely changed between the baseline and reporting period. It remained stable over both countries with a percentage above 99%.
In addition, from the summary analysis by Trends.Earth, it appears that overall, the change in SOC storage was low—0.52% to 0.07% in Greece for the baseline and reporting periods, respectively, and 1.39% and 0.22%, respectively in Tunisia for the same periods.

3.3. Analysis of the SDG 15.3.1 Based on the PFTs and Particularly in Cereal Croplands

3.3.1. Spatial Distribution of PFTs and Cereal Croplands

The steady PFT maps derived from the MCD12Q1 dataset for the baseline and reporting periods for both countries are presented in Figure 6. The spatial distribution of cereals appears in yellow.
According to Figure 6, in Greece, cereals are cultivated in the regions of Thessaloniki, Halkidiki, and Thessaly and to a small extent in western Macedonia, Sterea Ellada, and central Crete. In Tunisia, cereals are grown mainly in the northern part of the country, in the governorates of Siliana, Beja, and Zaghouan in particular.

3.3.2. Land Degradation Status Overall PFTs

The results obtained from the analysis of the SDG 15.3.1 indicator related to the plant functional types are shown in Table 7, Table 8 and Table 9.
Based on Table 7, evergreen coniferous trees are the dominant PFT in Greece and have a high rate of land condition improvement (89.58% during the reporting period while lower—81.96%—for the baseline period). Apart from the barren class, the PFT with the highest percentage of its area degraded is the class shrub (12.44% during the reporting period), which doubled compared to the baseline period (5.6%). The extent of shrubland in Greece does not exceed 0.11% of total area, however.
Based on Table 9, when considering all the degraded area, the highest percentage is located in the grasslands (34% during the reporting period). Among all the land with improved land condition, the highest percentage is located in the evergreen needleleaf tree areas (36.55% during the reporting period).
In Tunisia, the barren class is the PFT which covers the largest area due to the desert. Based on Table 8, areas with evergreen broadleaf trees have the highest portion of its area with improved land condition (79.98% during the reporting period, while it is lower for the baseline period at 70.38%).
The PFT with the highest percentage of its area degraded, after the urban class that has the highest rate (25.70%), is the cereal croplands (8.45% during the reporting period) with a lower percentage compared to the baseline period (14.88%).
According to Table 9, when considering all the degraded area, the highest percentage is located in the barren lands (56.03% during the reporting period). Among all the land with improved land condition, the highest percentage is located in the shrub areas (30.37% during the reporting period).

3.3.3. Land Degradation Status in Cereal Croplands

In Greece, 67.65% of the cereal croplands presented improved land condition during the reporting period, higher than for the baseline period (48.39%), revealing a higher improvement rate (Table 7). Additionally, 2.33% of the cereal cropland areas present degraded status during the reporting period compared to 4.23% in the baseline period. Therefore, a lower degradation rate was observed.
According to Table 9, cereal croplands are ranked fourth in terms of PFT with the highest contribution to the total area with improved land condition (10.08% compared to evergreen needleleaf tree areas ranking first with 36.55%) and are ranked fourth in terms of PFT with the highest contribution to the total area with degraded land status (10.83% compared to grasslands ranking first with 34.89%).
In Figure 7 the spatial distribution of SDG 15.3.1 indicator is limited to the extent of cereal croplands. The figure reveals that the cereal croplands that mostly show improvement during the reporting period are in the center of the country, in the region of Thessaly and further to the northwest. The areas with degraded status, which were sparsely located in all cereal croplands during the baseline period, were mainly in the west of Thessaloniki and in Sterea Ellada during the reporting period.
In Tunisia, on the other hand, 61.35% of the cereal croplands presented a stable status of land degradation during the reporting period and a similar rate during the baseline period (62.84%), while 8.45% presented a degraded status compared to 14.88% in the baseline period, revealing a decrease in degradation extent (Table 8).
According to Table 9, cereal croplands in Tunisia are ranked third in terms of PFT with the highest contribution to the total area with improved land condition (21.40% compared to shrublands ranking 1st with 30.37%) and ranked second in terms of PFT with the highest contribution to the total area with degraded land status (16.52% compared to barren lands ranking first with 56.03%).
According to Figure 7, the cereal croplands that show improvement during the reporting period are those located in the northwest and in the most southern cereal fields. The cereal fields with degraded status that formed wide patches during the baseline period were sparser during the reporting period.

4. Discussion

The assessment of the SDG 15.3.1 indicator in Greece and Tunisia was reported in Section 3.1. The metrics obtained in this study for the baseline period (4.83% and 9.97% respectively) differ from those reported to the UNCCD, as presented in Section 2.1. This can be explained by the use of different datasets. For instance, in Greece, the CORINE Land Cover datasets of 2006 and 2012 and in Tunisia, the JRC land productivity dynamics dataset were used instead of the ESA-CCI and NDVI trends datasets. Additionally, the level of confidence in the assessment of SDG 15.3.1 indicator is stated to be low in the report for Greece and medium for the report for Tunisia, as submitted in 2018 for the baseline period [44]. The results obtained in this study are in agreement with those published for southeast Tunisia [17], where RUE was not used, and the stable land degradation status was found to be dominant in the area.
According to the results provided by Trends.Earth, it appears that the sub-indicator that most affects land degradation in the two countries is land productivity. Indeed, the percentage of land area with improved productivity increased from 69.95% to 77% in Greece, and the portion of land which remained stable in Tunisia is 77.81% and 76.76%, respectively, for each period (the same pattern as for the SDG 15.3.1 indicator). Thus, whether land is classified as degraded or not is based primarily on its productivity rather than the carbon stock trend (stable for 99%) or land cover change (stable for more than 97% of the area). The importance of NDVI trends was highlighted in the study of Le et al. [2], which identified one third of the degradation from a statistically significant declining trend in NDVI, while the remaining two thirds are considered concealed by rainfall dynamics, atmospheric fertilization, and application of chemical fertilizers.
Figure 8 displays the land productivity map produced using JRC for the period 2005–2019. When compared to the maps produced using the Trends.Earth dataset (Figure 4-right and Figure 5-right), there are differences due to the NDVI trend calculation with a larger extent of land with improved land productivity in Greece in Figure 4, while there is agreement for the stable condition patches in central Greece. However, a different extent was mapped in northern Greece. In Tunisia, signs of declining land productivity appear in the western area in the JRC dataset, as do areas with improved land productivity in the southeast that were labelled differently in Figure 5. These differences would affect the final land degradation map if the JRC dataset were used instead. Consequently, it is important to carefully select the datasets used when running Trends.Earth after an overall evaluation of their accuracy prior to their use. This step can be made easier if the focus is on a specific area rather than at the country level.
The change in land productivity over all land cover classes, and for the croplands in particular, is similar to the change in the SDG 15.3.1 indicator, which shows a decrease in the percentage of the degraded area between the baseline and the reporting periods. The results, however, should be carefully interpreted considering local knowledge. A positive trend in NDVI, and thus NPP, should not necessarily be considered improvement of land productivity and thus land condition (false positive). For instance, NPP increases in the case of shrub encroachment on grassland but leads to less forage for livestock and thus a loss of ecosystem services [50]. This could be the case in Tunisia, where shrub areas are assigned an improved land condition due to land productivity increase during the reporting period.
In both countries, either broadleaf or needleleaf evergreen trees present the highest portion of land with improved condition, with a higher percentage in the reporting period than in the baseline period. In Greece, all PFTs with trees represent 62.2% of the land improvement of all PFTs (Table 9). Thus, land improvement in forests affects the SDG 15.3.1 indicator over the whole country. In Tunisia, while land improvement for shrubs is moderate, with a change from 27.71% during the baseline period to 30.88% during the reporting period, the shrub PFT presents the highest contribution to land improvement (30.37%), as shrubs cover 16% of the total area. By identifying the PFT that contributes the most to land improvement, it becomes easier to identify actions that are successful and require replication.
Not considering urban areas, the PFT in Greece with higher percentage of degradation during the reporting period is grasslands (34.89%). Degradation of shrubs in Greece also doubled (from 5.60% to 12.44%), while the total area did not vary considerably and remains very small compared to other PFTs. A possible reason could be urbanization and overgrazing by the expanding livestock [5,51]. In Tunisia, the trend for shrubs was inverse, with a decrease in the percentage of degradation from the baseline to the reporting period. On the other hand, the degradation was higher for cereal croplands, which will either impact cereal production or induce further degradation of land as fertilizers may be used to maintain production. By identifying the PFT that contributes the most to land degradation, it becomes easier to identify potential causes of the degradation and to propose appropriate actions to improve the land condition.
In Greece, the greatest percentage of cereal croplands show improvement in land condition, which is an encouraging fact in terms of food production and cultivation methods provided that the productivity increase does not result from unsustainable use of fertilizers and water resources. Additionally, the improvement (48.39% and 67.65% respectively) is not high compared to other PFTs and to overall improvement in Greece (69.58% and 77.08% respectively) as it ranks 4th in terms of improvement (10.08%). The contribution of cereal croplands to overall degradation during the reporting period is also high—10.83% (rank 4) compared to other PFTs. This reveals that despite the land improvement rate, sustainable farming practices must be applied in the cereal croplands in Greece.
In Tunisia, the extent of cereal croplands in 2016–2020 slightly increased (an opposite trend to Greece). The degradation in cereal croplands was higher during the baseline period (14.88%) than during the reporting period (8.45%), which is a similar decreasing pattern to the whole country (9.97% and 6.26%, respectively) but with higher rates of degradation. This is reflected by the high contribution of degraded cereal croplands to the overall degradation (16.52%). This high rate of degradation can be explained by the intensive agriculture applied in this area with the use of unsustainable land management practices [14,15]. Nevertheless, the stable degradation status is dominant for cereals as well as for all PFTs together. The areas with improved land condition are mainly located in the northwest of the country.
Even though the extent of degraded land decreased during the reporting period, there are essential measures that should be implemented not only to sustainably manage land but also to restore degraded land and increase the SOC stock (stock rates are higher in Tunisia but low in both countries). For the two countries under study, among the SLM measures in the WOCAT database that should be applied in cereal fields are direct seeding in cereal fields and integration of leguminous crops. Other actions include grazing land afforestation with carob trees and reconstruction of terraces on olive groves in Greece, reforestation of acacia trees in pre-Saharan areas, spineless cactus cultivation in marginal lands in central Tunisia, and rangelands resting [40].
As shown in the present work, Trends.Earth is used for assessing land degradation status. There are three limitations in the use of this tool that need to be highlighted.
(i) The remote sensing datasets used as input to Trends.Earth have a spatial resolution from 250 m to 300 m. This leads to final SDG 15.3.1 maps at medium resolution that is appropriate for a study at national scale. As shown in this study this level of spatial detail helps characterizing LD over a whole country and allows the localization of patches of degraded land (hotspots) where a focus should be made with an analysis at higher resolution. Land productivity could have been derived from Landsat timeseries (30 m). However, for land cover change, the available global datasets with a higher resolution are recent thus do not meet the temporal coverage requirement (e.g global Copernicus land cover since 2015). Even though national datasets are recommended if more accurate and detailed, they were not available in any of the two countries over both periods of interest. In order to help identifying the optimum dataset for land deg-radation assessment Sims, et al. [18] included the LDN dataset selection decision trees in their recommendations.
(ii) There are errors inherent to the use of EO-based datasets and the methods to pro-cess them within Trends.Earth. For instance, regarding the SOC change sub-indicator, the SoilGrids dataset is subject to large differences in estimates [52]. Uncertainty in the estimation of SOC stock change comes from its association to changes in land use in the Trends.Earth methodology. Besides, for the land productivity sub-indicator, the se-lection of the NDVI vegetation index as proxy to the net primary productivity and the use of a linear trend for deriving the dynamics, undoubtedly impact the accuracy of the SDG 15.3.1 results.
(iii) The type of land degradation and its impact on livelihoods is missing in Trens.Earth, thus prohibiting further analysis related to sustainable development and food security [18,29]. After monitoring the land degradation status, the estimation of crop yield can help detecting any effect on food provision and subsequently on food security. Nevertheless, this approach is driven by a common focus on one dimension of food security, food availability, and skipping the other dimensions: access, utilization, stability [53]. Thus, food insecurity is perceived as a deficient food production against increasing demand for food. Cereals are a major staple crop worldwide, hence the focus on cereal croplands in this study and the concern for the impact of land degradation on cereal yield potential and food security. Efforts are towards a constant increase in cereal production to satisfy needs, while there are other ways of dealing with food insecurity through, e.g., dietary change, the reduction of food waste, or better management of food stocks. This results in higher pressure on land and leads to the further depletion of natural resources through intensive farming and irrational use of fertilizers and pesticides. Above all, healthy communities rely on nutritious food, balanced diets, and a fertile and diverse environment, which are at risk due to degraded land and ecosystems.

5. Conclusions

Land degradation, through the SDG 15.3.1 indicator, was assessed in Greece and Tunisia using the Trends.Earth plugin. The UNCCD Good Practice Guidelines were followed for the selected periods of 2001–2015 and 2016–2020. Land degradation was found to be lower in Greece than in Tunisia, with values of 2.62% and 6.26%, respectively, during the reporting period. For both countries, a decrease in land degradation is noticed in comparison to the baseline values. During both periods, Greece was dominated by improved land condition, while in Tunisia, the highest proportion of the land had a stable status of LD. LD is affected mainly by land productivity dynamics, while stability prevails for both land cover and SOC. Interpreting the results based on the PFTs highlighted that 35% of the extent of degraded land in Greece is in grasslands, while 16.5% is in cereal croplands in Tunisia. Additionally, land degradation over cereal croplands is found to change similarly to all plant functional types. In Tunisia, the change in land degradation for cereals is higher than the equivalent change for the whole country.
The use of PFTs in this study is a step toward linking land degradation assessment specifically to cereal croplands—for which land condition is a determinant of cereal yield potential and food production—and also to other PFTs, which improves the understanding of the degradation processes and its dynamics and helps to identify the needed measures by focusing on specific plant functional characteristics. The results deem it necessary to extend the uptake of SLM practices and regularly monitor their contribution to reaching the LDN targets. Trends.Earth is a valuable tool for monitoring LD. It is also easy to customize in order to use with specific datasets and for particular areas of interest. Therefore, it can be used to evaluate the application of SLM practices to further highlight their benefit for land degradation prevention and mitigation.

Author Contributions

Conceptualization, T.K.A.; methodology, I.C.; software, E.K. and I.C.; validation, I.C. and T.K.A.; writing—original draft preparation, E.K.; writing—review and editing, I.C. and T.K.A.; visualization, I.C.; supervision, T.K.A.; project administration, T.K.A.; funding acquisition, T.K.A. All authors have read and agreed to the published version of the manuscript.

Funding

This research was conducted in the frame of the “Sino-EU Soil Observatory for intelligent Land Use Management (SIEUSOIL)” and “Enhancing Food Security in African Agricultural Systems with the Support of Remote Sensing (AfriCultuReS)” projects, both funded from the European Union’s Research and Innovation Programme under Grant Agreements No. 818346 and No. 774652, respectively.

Data Availability Statement

The MODIS Land Cover Type (MCD12Q1) dataset was downloaded from NASA EOSDIS Land Processes DAAC. All other datasets were downloaded or accessed through the Trends.Earth plugin (ISRIC SoilGrids, ESA-CCI, MODIS MOD13Q1, JRC Land Productivity).

Conflicts of Interest

The authors declare no conflict of interest.

References

  1. LDN. Land Degradation Neutrality. UNCCD Topic for Land & Life. Available online: https://www.unccd.int/land-and-life/land-degradation-neutrality/overview (accessed on 5 January 2023).
  2. Le, Q.B.; Nkonya, E.; Mirzabaev, A. Biomass Productivity-Based Mapping of Global Land Degradation Hotspots. In Economics of Land Degradation and Improvement—A Global Assessment for Sustainable Development; Nkonya, E., Mirzabaev, A., von Braun, J., Eds.; Springer International Publishing: Cham, Switzerland, 2016; pp. 55–84. [Google Scholar] [CrossRef] [Green Version]
  3. Eswaran, H.; Lal, R.; Reich, P.F. Land degradation: An overview. In Responses to Land Degradation; Bridges, E.M., Hannam, I.D., Oldeman, L.R., Pening de Vries, F.W.T., Scherr, S.J., Som-patpanit, S., Eds.; Oxford Press: New Delhi, India, 2001; pp. 20–35. [Google Scholar]
  4. Prăvălie, R.; Patriche, C.; Borrelli, P.; Panagos, P.; Roșca, B.; Dumitraşcu, M.; Nita, I.-A.; Săvulescu, I.; Birsan, M.-V.; Bandoc, G. Arable lands under the pressure of multiple land degradation processes. A global perspective. Environ. Res. 2021, 194, 110697. [Google Scholar] [CrossRef]
  5. Theocharopoulos, S.P. Land Degradation in Greece. In Land Degradation and Desertification: Assessment, Mitigation and Remediation; Zdruli, P., Pagliai, M., Kapur, S., Faz Cano, A., Eds.; Springer: Dordrecht, The Netherlands, 2010; pp. 423–434. [Google Scholar] [CrossRef]
  6. Kussul, N.; Shumilo, L.; Garanis, L. Relationships between Land Degradation and Climate Change Vulnerability of Agricultural Water Resources. In Proceedings of the 2021 IEEE International Geoscience and Remote Sensing Symposium IGARSS, Brussels, Belgium, 11–16 July 2021; pp. 747–750. [Google Scholar] [CrossRef]
  7. UNCCD. Addressing Desertification, Land Degradation and Drought: From Commitments to Implementation; Global Mechanism of the UNCCD: Bonn, Germany, 2022; p. 20. [Google Scholar]
  8. Grainger, A. Is Land Degradation Neutrality feasible in dry areas? J. Arid. Environ. 2015, 112, 14–24. [Google Scholar] [CrossRef]
  9. TE-CI. Trends. Earth User Guide. Conservation International. Revision c60e57bd. Available online: https://docs.trends.earth/en/latest/for_users/index.html (accessed on 5 January 2023).
  10. Giuliani, G.; Mazzetti, P.; Santoro, M.; Nativi, S.; Van Bemmelen, J.; Colangeli, G.; Lehmann, A. Knowledge generation using satellite earth observations to support sustainable development goals (SDG): A use case on Land degradation. Int. J. Appl. Earth Obs. Geoinf. 2020, 88, 102068. [Google Scholar] [CrossRef]
  11. Karamesouti, M.; Panagos, P.; Kosmas, C. Model-based spatio-temporal analysis of land desertification risk in Greece. Catena 2018, 167, 266–275. [Google Scholar] [CrossRef]
  12. Karamesouti, M.; Detsis, V.; Kounalaki, A.; Vasiliou, P.; Salvati, L.; Kosmas, C. Land-use and land degradation processes affecting soil resources: Evidence from a traditional Mediterranean cropland (Greece). Catena 2015, 132, 45–55. [Google Scholar] [CrossRef]
  13. Gamoun, M. Rain Use Efficiency, Primary Production and Rainfall Relationships in Desert Rangelands of Tunisia. Land Degrad. Dev. 2016, 27, 738–747. [Google Scholar] [CrossRef]
  14. Jendoubi, D.; Hodel, E.; Liniger, H.; Subhatu, A.T. Land degradation assessment using landscape unit approach and normalized difference vegetation index in Northwest of Tunisia. J. Mediterr. Ecol. 2019, 17, 67–79. [Google Scholar]
  15. Jendoubi, D.; Hossain, M.S.; Giger, M.; Tomićević-Dubljević, J.; Ouessar, M.; Liniger, H.; Speranza, C.I. Local livelihoods and land users’ perceptions of land degradation in northwest Tunisia. Environ. Dev. 2020, 33, 100507. [Google Scholar] [CrossRef]
  16. Bai, Z.G.; Dent, D.L. Land Degradation and Improvement in Tunisia Report. Part 1: Identification by Remote Sensing; GLADA Report 1f; ISRIC—World Soil Information: Wageningen, The Netherlands, 2008; p. 52. [Google Scholar]
  17. Bayouli, O.T.; Essifi, B.; Ouessar, M. Assessing Land Degradation Neutrality (LDN) in Southeastern Tunisia Based on Earth Observation Data and Open Source Applications. In Proceedings of the Recent Advances in Environmental Science from the Euro-Mediterranean and Surrounding Regions, 2nd ed; Proceedings of 2nd Euro-Mediterranean Conference for Environmental Integration (EMCEI-2), Tunisia 2019; Springer International Publishing: Cham, Switzerland, 2021; pp. 1829–1836. [Google Scholar] [CrossRef]
  18. Sims, N.C.; Newnham, G.J.; England, J.R.; Guerschman, J.; Cox, S.J.D.; Roxburgh, S.H.; Viscarra Rossel, R.A.; Fritz, S.; Wheeler, I. Good Practice Guidance. SDG Indicator 15.3.1, Proportion of Land That Is Degraded over Total Land Area. Version 2.0; United Nations Convention to Combat Desertification: Bonn, Germany, 2021; p. 148. [Google Scholar]
  19. van Lynden, G.W.J.; Mantel, S. The role of GIS and remote sensing in land degradation assessment and conservation mapping: Some user experiences and expectations. Int. J. Appl. Earth Obs. Geoinf. 2001, 3, 61–68. [Google Scholar] [CrossRef]
  20. Dubovyk, O. The role of Remote Sensing in land degradation assessments: Opportunities and challenges. Eur. J. Remote Sens. 2017, 50, 601–613. [Google Scholar] [CrossRef]
  21. Gibbs, H.K.; Salmon, J.M. Mapping the world’s degraded lands. Appl. Geogr. 2015, 57, 12–21. [Google Scholar] [CrossRef]
  22. Yengoh, G.T.; Dent, D.; Olsson, L.; Tengberg, A.E.; Tucker , C.J., III. Use of the Normalized Difference Vegetation Index (NDVI) to Assess Land Degradation at Multiple Scales: Current Status, Future Trends, and Practical Considerations; Springer: Cham, Switzerland, 2015. [Google Scholar]
  23. Easdale, M.H.; Fariña, C.; Hara, S.; Pérez León, N.; Umaña, F.; Tittonell, P.; Bruzzone, O. Trend-cycles of vegetation dynamics as a tool for land degradation assessment and monitoring. Ecol. Indic. 2019, 107, 105545. [Google Scholar] [CrossRef]
  24. Higginbottom, T.P.; Symeonakis, E. Assessing Land Degradation and Desertification Using Vegetation Index Data: Current Frameworks and Future Directions. Remote Sens. 2014, 6, 9552–9575. [Google Scholar] [CrossRef] [Green Version]
  25. Cui, Y.; Li, X. A new global land productivity dynamic product based on the consistency of various vegetation biophysical indicators. Big Earth Data 2022, 6, 36–53. [Google Scholar] [CrossRef]
  26. De Jong, R.; de Bruin, S.; Schaepman, M.; Dent, D. Quantitative mapping of global land degradation using earth observations. Int. J. Remote Sens. 2011, 32, 6823–6853. [Google Scholar] [CrossRef] [Green Version]
  27. Wessels, K.; Van den Bergh, F.; Scholes, R.J. Limits to detectability of land degradation by trend analysis of vegetation index data. Remote Sens. Environ. 2012, 125, 10–22. [Google Scholar] [CrossRef]
  28. Gonzalez-Roglich, M.; Zvoleff, A.; Noon, M.; Liniger, H.; Fleiner, R.; Harari, N.; Garcia, C. Synergizing global tools to monitor progress towards land degradation neutrality: Trends.Earth and the World Overview of Conservation Approaches and Technologies sustainable land management database. Environ. Sci. Policy 2019, 93, 34–42. [Google Scholar] [CrossRef]
  29. Prince, S.D. Challenges for remote sensing of the Sustainable Development Goal SDG 15.3.1 productivity indicator. Remote Sens. Environ. 2019, 234, 111428. [Google Scholar] [CrossRef]
  30. Ponce-Campos, G.E.; Moran, M.S.; Huete, A.; Zhang, Y.; Bresloff, C.; Huxman, T.E.; Eamus, D.; Bosch, D.D.; Buda, A.R.; Gunter, S.A.; et al. Ecosystem resilience despite large-scale altered hydroclimatic conditions. Nature 2013, 494, 349–352. [Google Scholar] [CrossRef]
  31. Giuliani, G.; Chatenoux, B.; Benvenuti, A.; Lacroix, P.; Santoro, M.; Mazzetti, P. Monitoring land degradation at national level using satellite Earth Observation time-series data to support SDG15—Exploring the potential of data cube. Big Earth Data 2020, 4, 3–22. [Google Scholar] [CrossRef] [Green Version]
  32. Tools4LDN. Strengthening Land Degradation Neutrality Data and Decision-Making through Free and Open Access Platforms (Tools4LDN). Global Environment Facility (GEF)-Funded Project. Available online: https://www.tools4ldn.org/project (accessed on 10 January 2023).
  33. MISLAND. Monitoring Integrated System for Land Degradation in North Africa (MISLAND) Platform. GMES&Africa Program. Available online: http://misland.oss-online.org/#/ (accessed on 19 January 2023).
  34. Buchhorn, M.; Smets, B.; Bertels, L.; Lesiv, M.; Tsendbazar, N.-E.; Masiliunas, D.; Linlin, L.; Herold, M.; Fritz, S. Copernicus Global Land Service: Land Cover 100 m: Collection 3: Epoch 2019: Globe (Version V3.0.1). 2020. Available online: https://library.wur.nl/WebQuery/wurpubs/580265 (accessed on 24 March 2023).
  35. CLC. CORINE land Cover. European Union, Copernicus Land Monitoring Service 2018, European Environment Agency (EEA). Available online: https://land.copernicus.eu/pan-european/corine-land-cover (accessed on 28 February 2023).
  36. ESA-CCI. European Sapce Agnecy, Climate Change Intiative, Land Cover. Available online: https://www.esa-landcover-cci.org/ (accessed on 28 February 2023).
  37. Friedl, M.; Sulla-Menashe, D. MCD12Q1 MODIS/Terra+Aqua Land Cover Type Yearly L3 Global 500 m SIN Grid V006 Dataset. NASA EOSDIS Land Processes DAAC. Available online: https://lpdaac.usgs.gov/products/mcd12q1v006/ (accessed on 19 January 2023).
  38. Bonan, G.B.; Levis, S.; Kergoat, L.; Oleson, K.W. Landscapes as patches of plant functional types: An integrating concept for climate and ecosystem models. Glob. Biogeochem. Cycles 2002, 16, 5-1–5-23. [Google Scholar] [CrossRef] [Green Version]
  39. Poulter, B.; MacBean, N.; Hartley, A.; Khlystova, I.; Arino, O.; Betts, R.; Bontemps, S.; Boettcher, M.; Brockmann, C.; Defourny, P.; et al. Plant functional type classification for earth system models: Results from the European Space Agency’s Land Cover Climate Change Initiative. Geosci. Model Dev. 2015, 8, 2315–2328. [Google Scholar] [CrossRef] [Green Version]
  40. WOCAT. World Overview of Conservation Approaches and Technologies (WOCAT). Available online: https://www.wocat.net (accessed on 10 January 2023).
  41. Liniger, H.; Harari, N.; van Lynden, G.; Fleiner, R.; de Leeuw, J.; Bai, Z.; Critchley, W. Achieving land degradation neutrality: The role of SLM knowledge in evidence-based decision-making. Environ. Sci. Policy 2019, 94, 123–134. [Google Scholar] [CrossRef]
  42. Nkonya, E.; Anderson, W.; Kato, E.; Koo, J.; Mirzabaev, A.; von Braun, J.; Meyer, S. Global Cost of Land Degradation. In Economics of Land Degradation and Improvement—A Global Assessment for Sustainable Development; Nkonya, E., Mirzabaev, A., von Braun, J., Eds.; Springer International Publishing: Cham, Switzerland, 2016; pp. 117–165. [Google Scholar] [CrossRef] [Green Version]
  43. Gondard, H.; Jauffret, S.; Aronson, J.; Lavorel, S. Plant functional types: A promising tool for management and restoration of degraded lands. Appl. Veg. Sci. 2003, 6, 223–234. [Google Scholar] [CrossRef]
  44. Prais. Prais Platform for the Submission of Country Reports to the UNCCD. Available online: https://prais.unccd.int (accessed on 8 December 2022).
  45. EMY. The Climate of Greece. Hellenic National Meteorological Service. Available online: http://www.emy.gr/emy/en/climatology/climatology (accessed on 5 January 2023).
  46. Peel, M.C.; Finlayson, B.L.; McMahon, T.A. Updated world map of the Köppen-Geiger climate classification. Hydrol. Earth Syst. Sci. 2007, 11, 1633–1644. [Google Scholar] [CrossRef] [Green Version]
  47. FAO. FAOSTAT Country Profiles. Available online: https://www.fao.org/faostat/en/#country/222 (accessed on 16 December 2022).
  48. SoilGrids. SoilGrids Dataset by ISRIC—World Soil Information. Version 2. Available online: https://www.soilgrids.org/ (accessed on 28 February 2023).
  49. JRC-LPD. Available online: https://wad.jrc.ec.europa.eu/landproductivity (accessed on 17 March 2023).
  50. Orr, B.J.; Cowie, A.L.; Castillo Sanchez, V.M.; Chasek, P.; Crossman, N.D.; Erlewein, A.; Louwagie, G.; Maron, M.; Metternicht, G.I.; Minelli, S.; et al. Scientific Conceptual Framework for Land Degradation Neutrality. A Report of the Science-Policy Interface; United Nations Convention to Combat Desertification (UNCCD): Bonn, Germany, 2017. [Google Scholar]
  51. Kosmas, C.; Detsis, V.; Karamesouti, M.; Kounalaki, K.; Vassiliou, P.; Salvati, L. Exploring Long-Term Impact of Grazing Management on Land Degradation in the Socio-Ecological System of Asteroussia Mountains, Greece. Land 2015, 4, 541–559. [Google Scholar] [CrossRef] [Green Version]
  52. Tifafi, M.; Guenet, B.; Hatte, C. Large Differences in Global and Regional Total Soil Carbon Stock Estimates Based on SoilGrids, HWSD, and NCSCD: Intercomparison and Evaluation Based on Field Data From USA, England, Wales, and France. Glob. Biogeochem. Cycles 2018, 32, 42–56. [Google Scholar] [CrossRef] [Green Version]
  53. Grote, U.; Fasse, A.; Nguyen, T.T.; Erenstein, O. Food Security and the Dynamics of Wheat and Maize Value Chains in Africa and Asia. Front. Sustain. Food Syst. 2021, 4, 17. [Google Scholar] [CrossRef]
Figure 1. Location of the study areas.
Remotesensing 15 01766 g001
Figure 2. Spatial distribution of SDG 15.3.1 indicator in Greece during the baseline period (left) and the reporting period (right).
Remotesensing 15 01766 g002
Figure 3. Spatial distribution of SDG 15.3.1 indicator in Tunisia during the baseline period (left) and the reporting period (right).
Remotesensing 15 01766 g003
Figure 4. Spatial distribution of land productivity in Greece during the baseline period (left) and the reporting period (right).
Remotesensing 15 01766 g004
Figure 5. Spatial distribution of land productivity in Tunisia during the baseline period (left) and the reporting period (right).
Remotesensing 15 01766 g005
Figure 6. Distribution map of functional types of plants that have remained unchanged during the baseline period (left: 2001–2015) and during the reporting period (right: 2016–2020). In Greece (top) and in Tunisia (bottom).
Remotesensing 15 01766 g006
Figure 7. Spatial distribution of SDG 15.3.1 indicator in cereal croplands during the reporting period in Greece (right) and in Tunisia (left).
Remotesensing 15 01766 g007
Figure 8. Spatial distribution of JRC land productivity in 2005–2019 in Greece (left) and Tunisia (right).
Remotesensing 15 01766 g008
Table 1. Land degradation metrics for the baseline and reporting periods in Greece and Tunisia.
LD StatusGreeceTunisia
2001–20152016–20202001–20152016–2020
Area
(sq·km)
% of Total AreaArea
(sq·km)
% of Total AreaArea
(sq·km)
% of Total AreaArea
(sq·km)
% of Total Area
Total Area127,867.6100127,862.3100155,670.4100155,670100
Improved88,973.369.5898,558.177.0821,270.113.6627,479.217.65
Stable32,108.925.1125,339.619.82118,605.776.19118,160.875.90
Degraded6175.24.833352.82.6215,5169.979746.36.26
No data610.20.48611.80.48278.60.18283.80.18
Table 2. Land productivity metrics for the baseline and reporting periods in Greece and Tunisia.
StatusGreeceTunisia
2001–20152016–20202001–20152016–2020
Area
(sq·km)
% of Total AreaArea
(sq·km)
% of Total AreaArea
(sq·km)
% of Total AreaArea
(sq·km)
% of Total Area
Total Area127,867.6100.00127,862.3100.00155,670.4100.00155,670.0100.00
Improved89,437.669.9598,631.277.1420,689.313.2926,278.016.88
Stable32,904.525.7325,436.819.89121,125.277.81119,484.876.76
Degraded4938.23.863205.32.5113,589.68.739635.76.19
No data587.30.46589.00.460.00.00271.60.17
Table 3. Land productivity dynamics for the baseline and reporting periods in Greece and Tunisia for the croplands.
Net Land Productivity Dynamics
CountryPeriodDecliningModerate DeclineStressedStableIncreasingNo DataTotal
Greece2001–20152.07%2.14%0.06%35.80%59.65%0.27%100%
2016–20201.05%1.40%0.11%26.52%70.64%0.29%100%
Tunisia2001–20150.87%8.37%1.24%61.08%28.28%0.16%100%
2016–20203.13%1.75%1.84%61.58%31.54%0.15%100%
Table 4. Land cover metrics for the baseline and reporting periods in Greece and Tunisia.
StatusGreeceTunisia
2001–20152016–20202001–20152016–2020
Area
(sq·km)
% of Total AreaArea
(sq·km)
% of Total AreaArea
(sq·km)
% of Total AreaArea
(sq·km)
% of Total Area
Total Area127,867.6100.00127,862.3100.00155,670.4100.00155,670.0100.00
Improved2255.31.76406.40.323270.42.101377.60.88
Stable124,195.097.13127,257.699.53151,665.197.43154,119.199.00
Degraded1417.31.11198.20.16734.90.47173.30.11
No data0.00.000.00.000.00.000.00.00
Table 5. Land cover change in area of each class of land cover (in percent) for the baseline and reporting periods in Greece and Tunisia.
Land Cover ClassGreeceTunisia
2001–20152016–20202001–20152016–2020
Tree-covered areas3.89%0.96%10.52%0.94%
Grasslands0.11%−0.55%−18.05%8.52%
Croplands−3.21%−0.53%5.02%−0.22%
Wetlands−0.15%−0.43%15.51%−2.07%
Artificial areas42.01%7.34%29.90%13.53%
Other lands−7.80%−1.87%0.34%−1.49%
Water bodies0.02%0.07%−0.63%0.03%
Table 6. Soil organic carbon metrics for the baseline and reporting periods in Greece and Tunisia.
StatusGreeceTunisia
2001–20152016–20202001–20152016–2020
SOC (t)% of TotalSOC (t)% of TotalSOC (t)% of TotalSOC (t)% of Total
Total576,577.8100.00%576,572.4100.00%297,689.8100.00%297,689.5100.00%
Improved1381.00.24%5.60.00%263.30.09%383.70.13%
Stable574,739.199.68%576,465.099.98%295,113.399.13%297,196.399.83%
Degraded457.70.08%101.80.02%2313.20.78%109.50.04%
No data0.00.000.00.000.00.000.00.00
Table 7. Analysis of the land degradation status for each plant functional type in Greece for the baseline and the reporting periods (D: Degraded, S: Stable, I: Improved).
PFT2001–20152016–2020
D%S%I%D%S%I%Total
Evergreen needleleaf trees3.9914.0581.961.338.8289.85100
Evergreen broadleaf trees6.6230.1263.262.0814.7483.18100
Deciduous needleleaf trees0.000.000.000.0050.0050.00100
Deciduous broadleaf trees3.4422.7873.771.4116.2982.30100
Shrub5.6014.3780.0412.4426.0561.51100
Grass4.2922.2973.424.0924.9370.98100
Cereal croplands4.2347.3848.392.3330.0267.65100
Broadleaf croplands8.4048.2243.384.1242.7753.11100
Urban/built-up lands12.0526.9660.995.5520.0274.43100
Barren54.5710.0035.4339.7111.4348.86100
Table 8. Analysis of the land degradation status for each plant functional type in Tunisia for the baseline and the reporting periods (D: Degraded, S: Stable, I: Improved).
PFT2001–20152016–2020
D%S%I%D%S%I%Total
Evergreen needleleaf trees8.8426.2364.935.1339.2555.62100
Evergreen broadleaf trees6.2323.3970.382.7717.2679.98100
Deciduous broadleaf trees3.3967.8028.810.0026.4773.53100
Shrub13.5858.7127.715.6063.5130.88100
Grass14.1754.5831.266.2568.1725.57100
Cereal croplands14.8862.8422.288.4561.3530.20100
Broadleaf croplands10.6949.8439.475.6263.1731.21100
Urban/built-up lands32.1045.1522.7625.7049.9324.37100
Barren7.4690.002.545.4686.757.79100
Table 9. Analysis of PFT contribution per land degradation status in Greece and Tunisia for the reporting period (D: Degraded, S: Stable, I: Improved).
PFTGreeceTunisia
D%S%I%D%S%I%
Evergreen needleleaf trees16.90%14.04%36.55%0.30%0.18%1.19%
Evergreen broadleaf trees7.32%6.49%9.35%0.31%0.15%3.23%
Deciduous broadleaf trees8.71%12.63%16.30%0.00%0.00%0.04%
Shrub0.56%0.15%0.09%15.20%13.45%30.37%
Grass34.89%26.67%19.39%4.26%3.63%6.32%
Cereal croplands10.83%17.51%10.08%16.52%9.36%21.40%
Broadleaf croplands15.97%20.77%6.59%3.53%3.10%7.11%
Urban/built-up lands3.76%1.70%1.61%3.84%0.58%1.32%
Barren1.06%0.04%0.04%56.03%69.54%29.01%
Total100.00%100.00%100.00%100.00%100.00%100.00%
Disclaimer/Publisher’s Note: The statements, opinions and data contained in all publications are solely those of the individual author(s) and contributor(s) and not of MDPI and/or the editor(s). MDPI and/or the editor(s) disclaim responsibility for any injury to people or property resulting from any ideas, methods, instructions or products referred to in the content.

