Abstract
Since the deployment of EO resources into orbit, archaeological surveys have made extensive use of space imaging. In particular, synthetic aperture radar (SAR) and interferometric synthetic aperture radar (InSAR) data have often proved useful in many geomorphic investigations. In this study, we tested the potential of SAR/InSAR datasets for archaeological applications, which were conducted for southern Mesopotamia. While identifying the embedded human settlements, we attempted to reconstruct the paleoclimatic conditions and the paleotopography imprinted onto contemporary geography as key features of the environmental context of ancient human activity. First, Sentinel-1 and PALSAR-2 SAR/InSAR time-series data were compiled and used to identify the paleoshoreline and other ancient hydrologic backgrounds in southern Mesopotamia. We defined regions of interest (ROI) based on this and further used a rotational decomposition of the time-series signature to detect shallow subsurface features in predefined ROI. SAR/InSAR data processing identified ancient channels and shorelines that match the historical/archaeological records of key Sumerian cities. Our findings in Eridu and Larsa-Uruk-Umma, as well as their hydrological contexts, are archaeologically significant and suggest the need for more ground surveys. In terms of global coverage and resolving power, this study shows that the potential of SAR/InSAR for probing the background environment of ancient civilizations is comparable to high-resolution commercial optical imaging. Longer wavelength and higher resolution SAR/InSAR time-series datasets are highly anticipated for such applications.
1. Introduction
It is a well-known fact that the establishment of a civilization crucially depends on the use of hydrological resources, more specifically, the spatiotemporal distribution of hydrological channels. This distribution is seen in some of the greatest ancient civilizations, such as the Indus, Nile, and Yellow Rivers and Mesopotamian civilizations, which is the topic of this study. The evolution process, from chieftain society to ancient country-governed hierarchical politics, is commonly and largely governed by the concentration of labor and technological advancements. One very obvious case is ancient Mesopotamia [1]. Ancient civilizations established in Mesopotamia include the Sumerian, Akkadian, Babylonian, and Assyrian civilizations, all of which flourished in present-day Iraq, Kuwait, and parts of Iran and Syria, especially in the Tigris and Euphrates basins, from the 4th millennium to 1000 BC. These civilizations left behind vast cultural and historical legacies, and their settlements have been discovered over the past few centuries.
The excavations of the ancient Sumerian city Ur, led by Sir Charles Leonard Woolley from 1922 to 1934, have provided valuable insights into the early history and culture of human beings, as well as the Mesopotamian civilization [2]. The excavation of Uruk by the German Oriental Society conducted in the early 20th century discovered a sophisticated temple that represented highly organized political power during that period [3]. Eridu at Tel Abu Shahrain, near Basra, is called the world’s first city in Sumer and traces back to 5400 BC; it [4] was first excavated in the 19th century and again in the early 20th century [5]. The cities of Mesopotamian civilization were mainly discovered through ground surveys. Typically, the location of interest is identified as a “Tell”, a mound of gravel, sand, and debris from consecutive ancient settlements that can be more easily measured using satellite and aerial imagery [6,7,8]. For example, Menze and Ur interpreted the notable footprints of Northern Mesopotamia’s Tell through the public domain digital elevation model (DEM), and analyzed their long-term construction model from a statistical perspective [9]. The majority of such discoveries are now preserved as World Heritage Sites by The United Nations Educational, Scientific, and Cultural Organization (UNESCO), though some were destroyed during long periods of war, primarily in the 20th and 21st centuries.
These days, remote sensing data taken from satellite imagery and aerial photography have been widely employed to identify ancient settlements, as summarized in Wiseman and El-Baz [10]. For instance, de Gruchy and Cunliffe [11] defined the boundary of settlement by identifying a “hollow-way”, which is a long, linear feature, typically with considerable width and is, thus, traceable through satellite images. Stone et al. actually applied this approach to southern Mesopotamia using high-resolution CORONA and Quickbird images [12]. Multispectral signatures have occasionally demonstrated the capability to discriminate artificial structures from ancient civilizations [13,14]. As their case presented, other geomorphic features, such as paleoriver channels and canals incised in the background landscape, were of great help in identifying the ancient cities, especially considering the crucial roles of irrigations and canals in the establishment of Mesopotamian society [15,16]; it might be a better approach to define the position and extent of ancient settlements by tracing the hydrological landscape in its contextual environment rather than investigating a candidate of an ancient settlement that is sometimes covered by current farmlands and towns.
Such channels can be detected using a number of techniques, from ground surveys to visual interpretations of high-resolution images and DEM/digital terrain model (DTM) of high-resolution ranging sensors, as well as multi/hyperspectral image analyses that sense the footprints of soil moisture variation in paleochannels, along with the subsequent growth of vegetation and cooling of soils in hydrological remnants. However, their limits in resolving power and coverages are obvious. For instance, without direct clues on terrains such as levees, terraces, and dry channels, DEM/DTMs frequently lack the capability to detect footprints of fluvial morphologies. The resolving power of the DEM is hampered by a vegetative canopy on top of the bare earth terrain. DTM filtering that reveals bare earth topography is only possible when high-resolution height measurements are used, as demonstrated in several studies [17,18,19]. For arid terrain applications, multi/hyperspectral image analyses are frequently used to detect the effects of soil moisture by hidden paleo-channel [20].
Synthetic aperture radar (SAR) imaging, which was introduced as a major tool to trace paleochannels and investigate the involved ancient settlements, has the following merits over other sensing methods; (1) it can detect subtle changes in the presence of soil moisture, which may imply the presence of paleochannels footprints, as proposed in multiple SAR and interferometric SAR (InSAR) analyses; (2) compiling SAR/InSAR signatures can produce multiple measurements that are capable of tracing the textural, chemical, and physical differences of paleochannels. Those are the technical bases of SAR/InSAR images and their further composition for the purpose of this study.
In this study, we aimed to trace the river channels centering the Euphrates and Tigris and reassign the involved ancient residents to the background hydrological resources of Mesopotamian civilization. For the survey of archaeological places around the hydrological channels, we focused on ancient cities during the Sumer-Akkadian period (hereafter called Sumer or Sumerian). This is because the major cities of the Sumerian period have been well recorded and surveyed; thus, our findings can be compared to existing knowledge.
Based on this context, we first introduce the characteristics of the target area together with the datasets in Section 2. The details of the methodology were introduced in Section 3. The outputs from the spatial analysis of the paleogeomorphic features are reported in Section 4. In Section 5, additional interpretations and discussions are presented, and in Section 6, a conclusion is drawn.
2. Test Site and Data Sets
2.1. Descriptions of Southern Iraq as the Target Area of the Survey
Ancient Sumerian civilization was established in southern Iraq and lay between the Euphrates and Tigris rivers, or so-called Mesopotamia (see Figure 1). This region has a highly flat floodplain that strongly contrasts with the surrounding mountain areas of Zagros, Iran, Anatolia, and the southern desert plateau. As shown in the trails of the Euphrates and Tigris rivers from the Northern Zagros Mountains (Figure 1b), the two rivers and their tributaries are unique, and they present vital water supplies as well as sediments that create gently sloped flood plains between two channels. Climatic conditions in this region have a high temporal oscillation starting from the Paleocene but generally tend to be hot and dry [21,22]. According to Aqrawi’s stratigraphic analyses [23], the climate has shifted from semi-arid (before BCE 5000), wet (BCE 500–4000), semi-arid (BCE 4000–2000), and arid (to the present). The water supply from the two rivers should have been irrigated to the farmlands through natural and artificial channels, but their management imposed a huge workload on the societies populated there. Therefore, it led to the establishment of ancient civilizations, which ultimately centralized political [24]. The civilizations of this area gradually migrated from northern to southern Mesopotamia following the extension of farmland, such as the very earliest Hassuna culture (6000 BCE) in the piedmont of north-western Tigris [25] and the Neo-Babylonian Empire in the 6th century BCE, which was the last indigenous political power in this area. Management of hydrological routes/resources was a key factor in the rise and fall of all political systems in Mesopotamia during that period. Estimates of flooding and channel routing are highly unpredictable by any means [26], as the two channels of the Euphrates and the Tigris typically originate from snow cover in the mountains of northwest Anatolia. Although fine sediments and the flow of water from the streams of the two rivers provided incredible productivity in the surrounding agricultural lands [27] and highly efficient transport routes to related civilizations [28], the management of the watercourse and secondary irrigation systems was a lethal factor for all Mesopotamian civilizations [15,16,29]. It is, therefore, quite natural that all ancient settlements with a certain population density were located along the streams of both rivers and their natural and artificial tributaries.
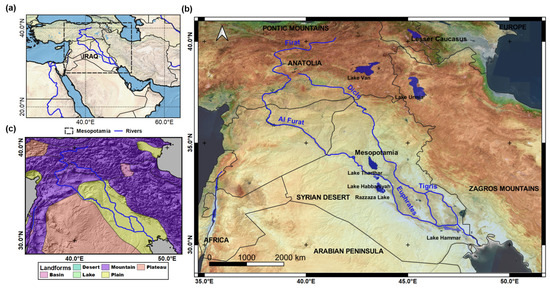
Figure 1.
(a) The location, (b) geographical context of the target area, and (c) surrounding geomorphology (the data are available at https://esdac.jrc.ec.europa.eu/content/global-landform-classification, accessed on 1 January 2023).
Consequently, a number of major cities in the Sumerian civilization developed along the banks of the Euphrates and Tigris rivers and their tributaries. Some of the major Sumerian cities in southern Iraq were demonstrated in Figure 2a, together with detected paleo-channel networks by the interpretation of optical satellite images (refer [30,31]) as shown in Figure 2b. The major cities that have been strongly involved in the analyses of this study (refer to Figure 2c) are as follows:
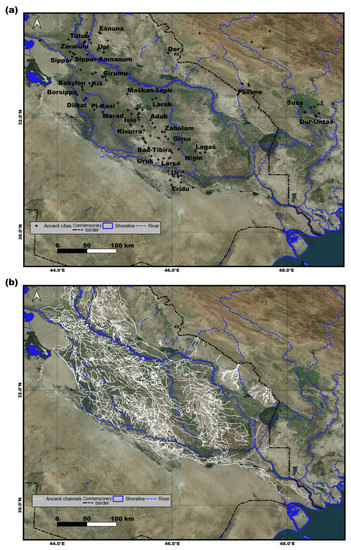
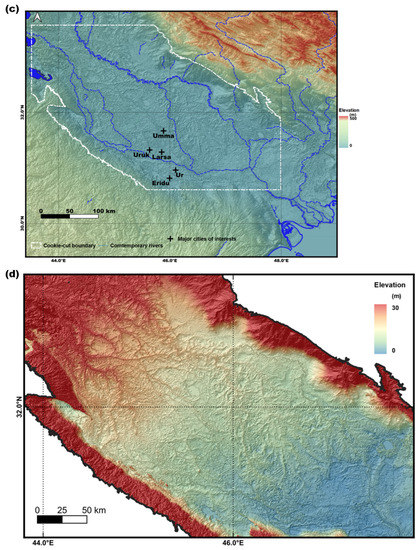
Figure 2.
(a) Sumerian-era cities superimposed on a Google Earth image. (b) Google Earth image with ancient channels overlaid. The routes of ancient rivers and canals were identified using high-resolution imagery [30]. (c) The topography of the study area, as well as the major cities. (d) Cookie-cut hill shading image of the Euphrates–Tigris floodplain. Note the delineated channels over the background topography in comparison to (b).
- Eridu: According to Sumerian cuneiform tablets, Eridu was the city where the first kingship resided before the flood [4]. It first resided in 5900 BCE, the so-called Ubaid age, and survived as a religious center throughout the Sumerian age. Then it was completely abandoned around 600 BCE and was never occupied again [32];
- Uruk: Uruk was one of the first cities of the Sumerian stage of urbanization in the mid–40,000 BCE, known as the Uruk period [33]; therefore, it had tremendously important acting roles in the politics of the Sumerian civilization. It was perhaps located along the Euphrates river and was the most well-equipped city with intensified canal systems covering the whole city and surrounding farmlands [31];
- Ur: Ur was the central political power during all periods of Sumerian civilization but gained the maximum power during Ur’s 3rd dynasty between 2047 BCE and 2030 BCE [32]. It was very likely situated near a tributary of the ancient Euphrates. The economic prosperity of Ur might have been maintained by access to the Persian Gulf and trade via the port city of Kuara [32]. Therefore, the ultimate fate of Ur could have been involved in shoreline changes;
- Larsa: The city won political power in 2025–1763 BCE, the Isin-Larsa period [34]. Thus, the maximum prosperity of the city was attained in the different ages and backgrounds of other Sumerian cities. It has some bearing on this study;
- Umma: The city had been noted by long-standing conflicts with the powerful neighboring city, Lagash, recorded in cuneiform tablets [35,36]. The geographic condition and economic context as the origin of conflict was an issue of this study that was highlighted in the interpretation of the SAR signatures.
These cities and other Sumerian cities are connected by a wide range of artificial canals and natural river networks. Transportation via the canals and river channels was far more efficient than the land road; hence, it facilitated the mass supply of food, wood, and metal resources, which are essential to sustain Sumerian cities’ high-level economic activities [37,38]. Due to canal- and river-channel-based transportation, trading strategies through a few of the ports to the transit trade island or beyond the Persian Gulf were feasible [39]. Rivers and canals also provided significant sources of water for irrigation and other purposes and played a crucial role in the development and prosperity of the Sumerian civilization [40]. The productivity of the Sumerian cultivation scheme was far superior to any other civilizations before the industrial revolution. However, because the river was prone to flooding and other hydrologic hazards, it could also cause extensive damage to Sumerian cities. In addition, the river canals in Mesopotamia were subjected to numerous migrations. These changes in river flow had a significant impact on the rise and decline of Sumerian cities, as evidenced by the abandonment of many major cities. The collapse of the cultivation and trading system by altering river channels was not manageable using Sumerian technology. The mechanism of river channel migrations happened as natural/artificial levees failed. Since the channel bed in Mesopotamia is often higher than the surrounding floodplain [41], new channels are sometimes created on the lower elevation of the floodplain. In the case of a section of the floodplain (situated between elevated alluvial ridges) first being inundated, a new major channel subsequently developed within an inundated avulsion belt [42]. This process, the so-called progradational avulsion, left futile sedimentary deposits and created major farmlands sustaining a few thousand populations once the secondary irrigation network was established [29]. The crevasse splay process that deposits arable sediment at the point of a temporary breach of the levee plays a similar role but only manages hundreds of populations [26].
Figure 2c demonstrates the topography of Mesopotamia, which was a crucial element for the described river channel migration and had shallow slopes to the Persian Gulf. The higher channel bed over the floodplain was noticed in the hill-shaded DEM of Figure 2d. Two of the other interesting topographic features are the shoreline, which clearly implies coastal changes along a few significant wetlands, as investigated by Kennett and Kennett [21], Milli et al. [43], and Pollock et al. [44], and is strongly associated with the Holocene climate changes [22,23,45], and the deltaic and alluvial fans, which are produced by massive Holocene sedimentary deposits [46,47,48]. The wetlands in Iraq are sometimes called “marsh” and are dominated by grasses, rushes, or reeds. In both contemporary Iraq as well as ancient Sumerian ages, this provided highly significant ecology to the surrounding societies [49,50]. It is worth noting that submersion of the terrain and the loss of coastal contact caused catastrophic effects on the fate of the corresponding city [31,47]. Therefore, the management of canals and waterways and the new construction of canals to restore coastal contact, in other words, the restoration of the trading scheme, was one of the most in-demand endeavors from the political power [1,7,29].
2.2. Data Sets
We used two different SAR/InSAR datasets for this study. One is a European Space Agency’s C-band (5.54 cm in wavelength) Sentinel-1 SAR image and the subsequent processed InSAR product. The other is an L-band Japan Aerospace Exploration Agency (JAXA) Advanced Land Observing Satellite (ALOS)-2 Phased Array Type L-Band Synthetic Aperture Radar (PALSAR)-2 image.
Sentinel-1 is designed to deliver 5 × 20 m images in Interferometric Wide Swath (IW) mode, a typical product used in this study [51]. We only used VV polarization of the two polarization (HV + VV) modes of Sentinel-1 [52]. The imaging conditions for the Sentinel-1 images used are listed in Table 1. Using Sentinel-1’s 12-day revisiting time, the data set of this study constituted 2020 InSAR pairs for contextual understanding related to soil moisture, vegetation, and local roughness. To avoid processing accuracy issues described in Section 3, we used the data products available in the Looking Into Continents from Space with Synthetic Aperture Radar (LiCSAR) repository [53], which has preprocessed 90 m resolution InSAR products.

Table 1.
Characteristics of employed Sentinel-1 images.
ALOS-2 is a satellite mission launched in 2014 with capabilities for land cover/use mapping, environmental change, and geomorphic feature tracking [54]. ALOS-2 satellites use the SAR Sensor with L-band wavelengths (23.5 cm), which are longer wavelengths than those employed by many other SAR instruments, typically C and S bands, to provide better signals in environments with vegetation, soil, and snow cover. We employed Global PALSAR-2 mosaic products (available at https://www.eorc.jaxa.jp/ALOS/en/dataset/fnf_e.htm, accessed on 1 January 2023) rather than individual image frames due to better accessibility and productivity [55]. The products are a 25 m resolution global mosaic of ALOS-2 backscattering coefficient images in both HH and HV polarization covering the period from 2015 to 2021. The incidence angle correction and the correction over the mosaicked edge were already applied. The details of the products were given by Molan [56].
The penetration depth of ALOS PALSAR-2 imaging is a critical issue in this study, especially concerning subsurface microscale scatterers and dielectric components. Therefore, this issue is reviewed again in the next section.
The use of a DEM with SAR/InSAR signals is essential because the projection of SAR/InSAR signals onto topographic reliefs by DEMs provides great insight into understanding the characteristics of geomorphic contexts. The Copernicus 30 m DEM (available at https://spacedata.copernicus.eu/collections/copernicus-digital-elevation-model, accessed on 1 January 2023) is built on the WorldDEM [57] created with TanDEM-X Mission’s InSAR image processing [58]. The Copernicus DEM is a resampled version of the WorldDEM processed by the German Space Agency (DLR with additional operations such as gap filling, flattened water bodies, and cut coastlines. Given that WorldDEM has a grid spacing of 0.15″ (~5 m), a vertical accuracy of 2.5 m, and a horizontal accuracy of 6 m [59]; the inherited Copernicus 30 m DEM depicts better details of the terrain.
In addition, the Google Earth and Microsoft Bing maps, both accessible as web data sources in QGIS, were used as auxiliary datasets for cross comparisons.
3. Methods
Overall, the processing algorithms of this study are summarized in Figure 3. It should be noted that we stocked all output onto the GIS together with Microsoft Bing and Google earth webserver for prompt intercomparison with high-resolution optical images.
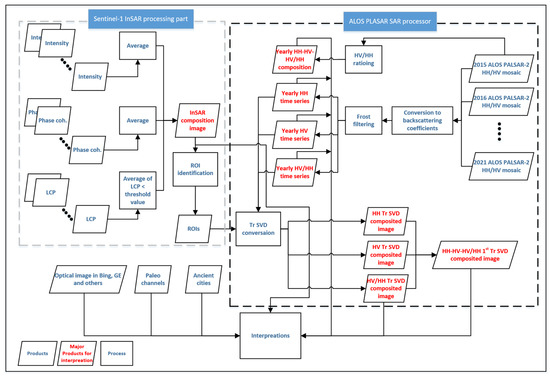
Figure 3.
Overall processing flows and resulting products (hereafter InSAR as InSAR Comp., Yearly HH time series as HH TS Comp., HH-HV/HV/HH composition as 3 Ch pol. Comp., tr-SVD HH time series as HH TS Tr-SVD, HH-HV-HV/HH 1st Tr SVD as 3 Ch/1st Tr-SVD Comp.).
3.1. InSAR Data Compile for the Identification of Hydrological Contexts
The employment of InSAR signatures represents the first technical foundation of our method for recognizing landscape and hydrological situations. The phase coherence is one of the required InSAR signatures and is represented as follows:
where SMi and are the complex conjugated signal of master and slave SAR images, N is the total number of signals within the processing window, ∅(i) is the phase of ith signal of images.
Phase coherence has different responses according to the slope, roughness, stability porosity, and dielectric characteristics of the target terrain, together with image acquisition conditions, vegetation cover, and even weather conditions [60]. Note that dielectric characteristics are largely involved with soil moisture. The most significant contribution to phase coherence is vegetation and stability of topography. Hence, the signals from dense vegetation and changing and steep topography, such as moving dunes [61], are difficult to employ for archeological applications.
The second component of the InSAR signal is the so-called phase residual or loop closure phase (LCP). If there are three unwrapped interferograms in three InSAR pairs in time-series 1–3, the phase loop closure of 1-2-3 pairs occurs as follows [62]:
where Δ 123 is the LCP in the time-series phase angles of 1–3 images, 12 is the difference in the phase angles of 1–2 pairs, and so on.
The loop phase should be zero if there are no error signals, such as unwrapping error, and ionospheric and orbital components in the interferograms [63]. However, the residual originated from the surface condition; for instance, a change in soil moisture cannot be fully addressed [64]. Thus, phase loop closure can be employed to investigate the surface properties [65,66]. However, it should be noted that the direct involvement of LCP in soil moisture is not established as the biggest contribution of LCP is in landcover type [67].
As we have 2020 InSAR pairs as the InSAR frame data, three channels were composed using, (1) the average backscattering coefficients of 352 master images in VV polarization; (2) the average of the 2020 phase coherences; (3) the average of 352 LCPs, which are within the thresholding value of the allowable phase residual (0.1 radians here). Then, we compiled three channels by normalizing (2) and (3) to the range of (1) in order to use the compiled data, like an RGB image, visually. Considering the effect of LCP, we employed the InSAR composite to investigate hydrologic contexts, such as channels and shoreline definition.
3.2. Processing of SAR Time Series Data for the Identification of Geomorphic and Artificial Feat
We also employed the time series of the backscattering coefficients and their polarization channels, namely the HH and HV channels of ALOS PALSAR-2. The pixel values in the data files can be transferred to the backscattering coefficients as follows:
where γ0 is the backscattering coefficient, DN is the pixel value of the data file, cf is the calibration coefficient (−83.0), and lf is the relocating factor to control the minimum backscattering coefficient to zero. The slope correction to the viewing geometry and ortho-rectification was already applied by the algorithm described by Shimada [68]. However, the control errors in mosaicked images remained and produced some ill-sided effects for further interpretation. We tested multiple adaptive filtering schemes to suppress the speckle error of the SAR images and employed the Frost filter [69,70], which demonstrated the best performance for suppressing the obvious speckles while preserving the boundary of the objects for all mosaicked SAR-backscattering coefficient images of our study.
γ0 = 10 log10(DN2) + cf + lf
We compiled the images into time series in two ways, as shown in Figure 3: (1) yearly time-series, which consists of 2015 to 2021 mosaics by polarization types, i.e., 2015 to 2021 HH time series, 2015 to 2021 HV time series and 2015 to 2021 HV/HH ratio time series; (2) HH-HV-HV/HH composition in each year, for instance, 2015 HH-HV-HV/HH composition.
For the yearly time series of the polarization modes, we further applied rotational decomposition. The basis of this rotational decomposition came from the fact that the L-band wavelength used by PALSAR-2 has some limitations when detecting deep subsurface features. The L-band wavelength is less effective than the P-band at penetrating through denser materials, such as rock, and is not able to detect features that are deeply buried beneath the surface. Peaillou et al. estimated the penetration depth of L-band SAR images as 1.5 to a few meters in a dried desert environment [71,72,73]. However, according to our experiences, the penetration depth of PALSAR-2 is far shallower. Therefore, we expected weak scattering from shallow underground features to populate the yearly time series images and be revealed in some of the rotated time-series components.
We tested a few rotational decomposition algorithms and chose the truncated singular value decomposition (tr-SVD) method, as it is known to better to decompose independent components from untangled datasets [74]. Tr-SVD is quite similar to principal component analysis but does not require data centering. It only exploits nondiagonal and nonzero diagonal components among singular value decompositions. From the standpoint of performing SAR time-series processing, the centering operation of the commonly used principle component analysis (PCA) leads to a loss in representative signals. Thus, tr-SVD is consistent with our purpose in simultaneously observing the dominating signal and the weak components, which may come from the subsurface and surface together. We applied tr-SVD on the local regions of interest (ROI) to screen out the effects of certain land-use/cover types, such as rocky surfaces, sea surfaces, and cultivation.
4. Result
As mentioned above, Sentinel-1 InSAR composite images (InSAR Comp. hereafter) have the optimal data for understanding paleo-environmental contexts, especially in the hydrological aspect. These results are demonstrated in Figure 4a with the results of the PALSAR-2 time-series analyses (Figure 4b,c).
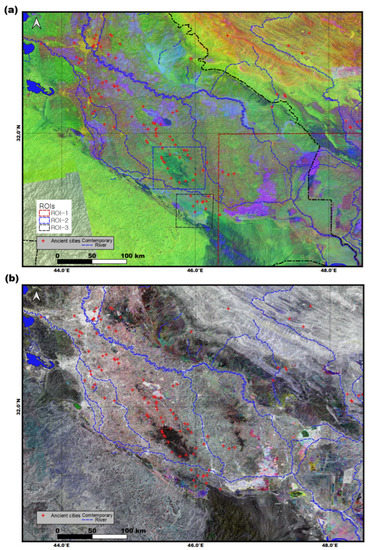
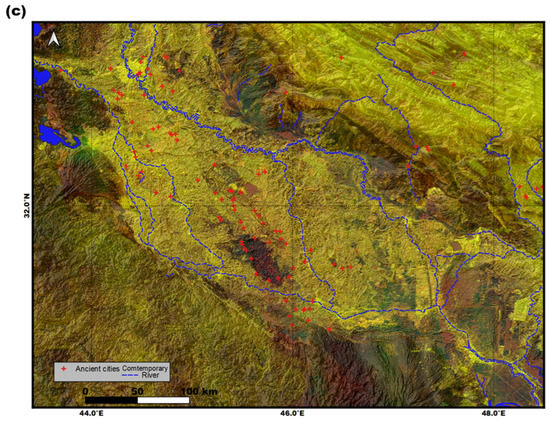
Figure 4.
SAR/InSAR composite products (a) InSAR Comp with three ROI, (b) HH TS Comp. (2018, 2020 and 2021), (c) 3 Ch pol Comp. in 2018.
The InSAR Comp. image shown in Figure 4a can readily interpret the paleo-hydrological background with overlaid paleochannels that are defined by high-resolution optical images (refer to [30]). Figure 4b shows the HH polarization’s color composite image for 2018, 2020, and 2021 (HH TS Comp.), and (c) represents a composite image by HH-HV-HV/HH from PALSAR-2 (3 Ch pol. Comp.). Figure 5 represents the PALSAR-2 time series and composite products in ROI-2, which is defined in the Larsa-Uruk-Umma coverage, including HH polarization time series in 2018, 2020, and 2021 (HH TS Comp., see (c)), and the Tr-SVD composite image of PALSAR-2, (3 Ch/1st Tr-SVD Comp., see (d)). Figure 6 demonstrated the PALSAR-2 time series and composite products around Eridu corresponding to ROI-3, including a HH time series composite (HH TS Comp., see (c)) and Tr-SVD of HH time series (HH TS Tr-SVD, see (d)). Interpretation of these products will be addressed in the following section.
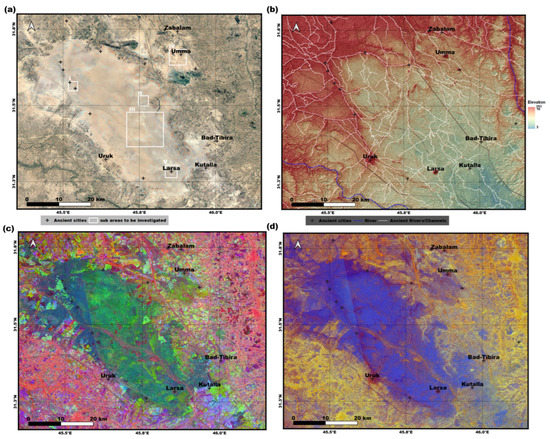
Figure 5.
PALSAR-2 products in the Larsa-Uruk-Umma area are assigned as ROI-2. (a) Google Earth optical image of the corresponding optical image. (b) Copernicus 30 m DEM with paleochannels overlaid. PALSAR-2 HH TS Comp. products (c) (2016–2018). The following section contains an interpretation of the features assigned I through V. (d) 3 Ch/1 st Tr-SVD Comp.
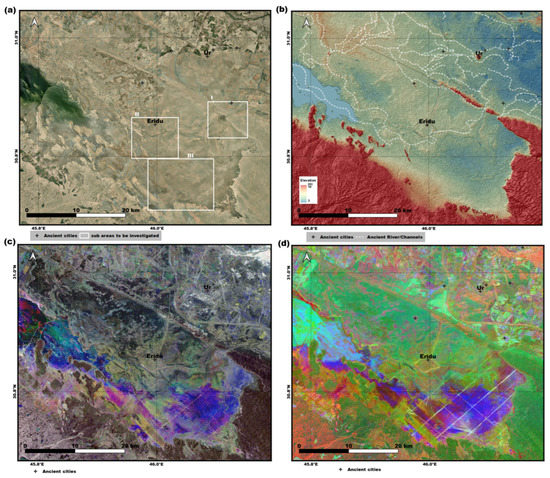
Figure 6.
PALSAR-2 products in the Eridu area are assigned as ROI-3. (a) Corresponding optical image in Google Earth. Subareas I through III are interpreted in the following section. (b) Copernicus 30 m DEM overlaid with paleo-channels. (c) PALSAR-2 HH TS Comp. in 2018. (d) HH TS Tr-SVD.
5. Interpretation & Validation
The paleo-hydrological contexts are the first issue to be interpreted using imagery and context (ROI-1). Figure 7 depicts the geomorphic features collected by the Copernicus 30 m DEM and InSAR Comp. In both the DEM and InSAR Comp., the discontinuity associated with the ancient coastline is evident. The following should be noted in Figure 7c,d as the basis of the suggested paleoshoreline in the Sumerian age: (1) sudden changes in both the topographic relief and InSAR signatures around the proposed paleoshoreline’s buffer zone; (2) the drop in paleochannel density or terminus of the channel routes around the proposed paleoshoreline; and (3) the location of Kaura, a clearly identified Sumerian port in the Eastern terminus of proposed paleoshoreline.
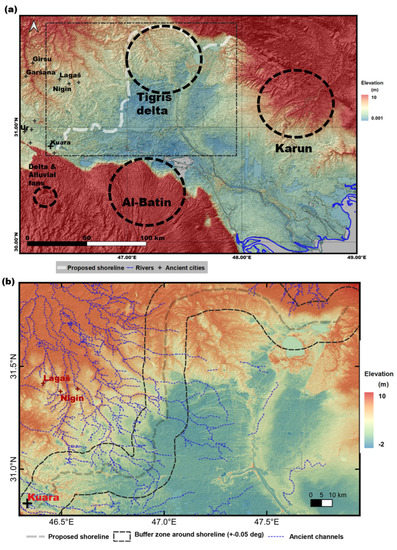
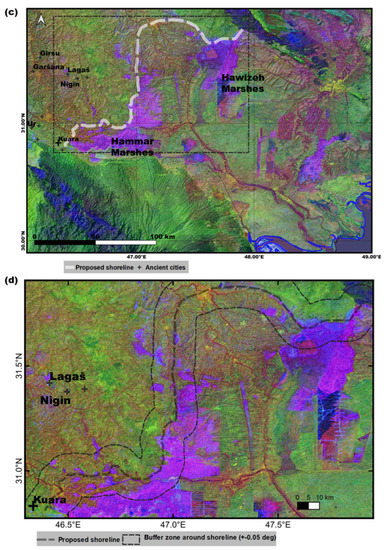
Figure 7.
Paleoshoreline footprints in ROI-1. (a) Copernicus 30 m topography and (b) zoom around the proposed paleoshoreline. (c) InSAR Comp. and (d) zoom around the proposed paleo-shoreline. The location of the ancient city, current river channel, and alluvial fan/delta are noteworthy compared to the proposed shoreline.
The proposed shoreline shown in Figure 7 is bounded (west to east) by three large marshes: Hammar, Central, and Hawizeh. The Al-Batin alluvial fan is very prominent to the east of the proposed ancient shoreline and suggests many clues regarding the geomorphic contexts of the Sumerian cities, especially in the context of geological and topographical evolution around Eridu [75], is presented in Figure 8b. For instance, the depression around Eridu presented in ROI-3 is likely involved in the erosional process of the Al-Batin alluvial fan. The Karun alluvial fan and Tigris delta originating from Mount Zagros, which are clearly distinguished in Figure 7b, were born after 2000 BCE [23]. Therefore, it can be excluded from the approximate shoreline. In particular, the footprints of the Abu Jir-Euphrates fault area in the terrain around the shoreline are evident, as described by Sissakian et al. [76].
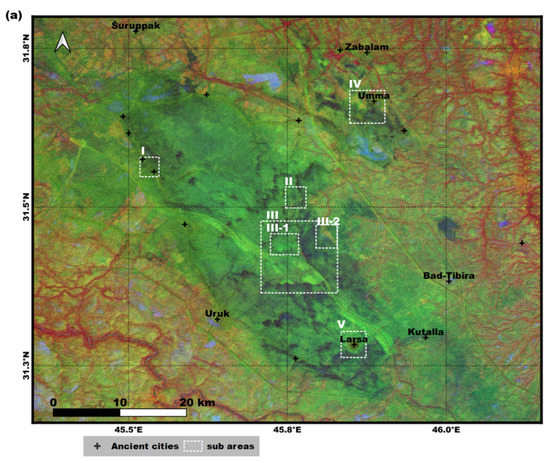
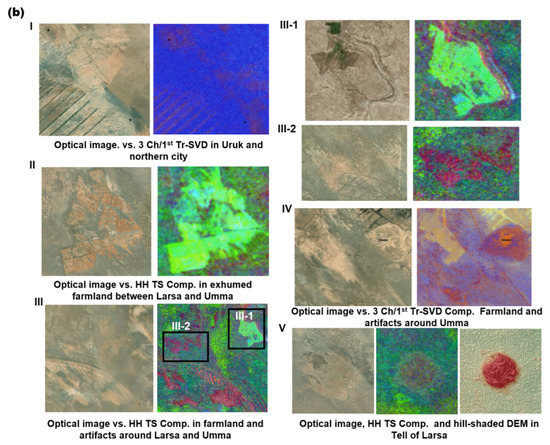
Figure 8.
(a) InSAR Comp. in ROI-2 presenting complicated hydrological context that is covered by contemporary aeolian sediments. (b) The details of ROI-2 of SAR/InSAR Comps. compared to the optical image.
The proposed shoreline denies the direct contact of Ur and Eridu with the sea surface before 2000 BCE (at least), and it fits the location of the ancient seaport Kuara [77] presented in the following Figures. Note that the most significant canal in Ur was connected to the direction of Kuara [78]. There are some studies that propose a far upper coastal contact from BCE 3000 to 2000, but it’s not clear how such shorelines explain the highly dissected canals connecting the southern Sumerian cities, which are clearly observed in any decomposed SAR images.
Figure 8a shows ROI-2, which is the boundary surrounding the Sumerian cities and the Larsa-Uruk-Umma cover. Perhaps it is the footprint of a dried marsh. The channels and other artifacts dissected were visible inside the proposed marsh boundary. Apparently, a few northern cities and Uruk are almost coaligned, and the PALSAR-2 composed image confirms the canals connecting these cities (see also Figure 5c,d, and Figure 8b(I)).
Figure 8b shows the characteristics of the PALSAR-2 Comp. images compared to the optical images. The canal connecting Uruk and its northern cities is well identified in the 3 Ch/1st Tr-SVD image (Figure 8b(I)), with some pathways appearing eroded but with the potential artifacts not visible in the optical image. In Figure 8b(II), exposed farmland is clearly visible in both the optical and HH TS Comp. On the contrary, farmland or similar is observed in the HH TS Comp or HH tr-SVD around Larsa, which is not visible in the optical image (Figure 8b(III-1)). On the opposite side of the hidden farmland (III-2), a number of artifacts are observable only in the SAR image, clearly demonstrating the resolution of the SAR Comp. products in identifying the shallow subsurface structures. In the further analysis using the PLASAR-2 decomposition, we captured the barely visible interior features of wetlands as the backgrounds of extensive and complex urbanization. In Figure 8b(IV,V), Umma and Larsas’ Tells and extensive associated local settlements are represented. Both show the detailed structures of the artifacts by HH TS Comp. The Umma may have maintained their war against Lagash for 50 years thanks to the background economy gained from these properties.
Figure 9a, which depicts ROI-3, reveals extremely intriguing hydrologic channels surrounding Eridu and Ur. The black dotted line traces the river channel that originally surrounded the city of Eridu and proceeded northward. Another river ran into the Persian Gulf from the outflow of the projected lake (see blue dotted line). The ancient river line traced in Figure 9a is very clear, demonstrating the capacity of the InSAR Comp. to track the river channels.
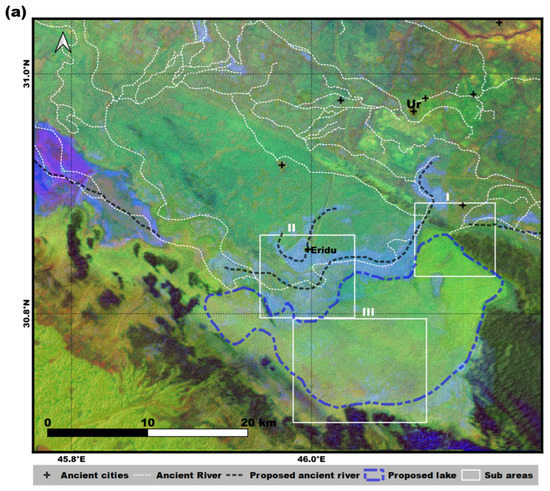
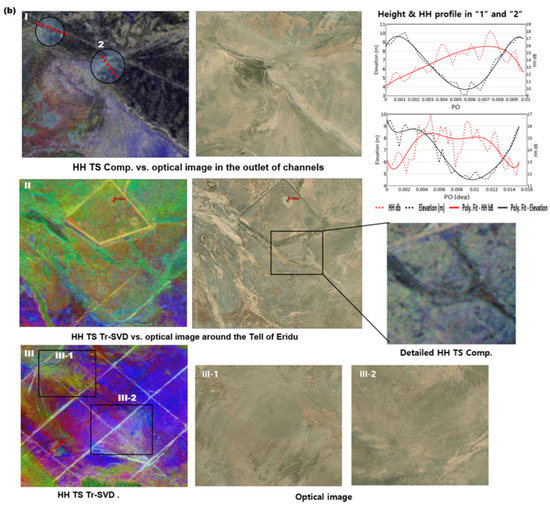
Figure 9.
(a) InSAR Comp. in ROI-3 overlaid with ancient channels, which implied extensive dissection by Sumerian age’s rivers and wetland environments. (b) The details of ROI-3 of SAR Comps. compared to optical images showing the outlets of the channel networks (I), avulsion of channels around the Tell of Eridu, and (II) intersection/spoke-style trails in the southern part of Eridu (III).
Figure 9b demonstrates the notable parts of ROI-3 presented in the HH TS Comp. and tr-SVD images. The depression on the eastern side of Eridu is likely an ancient freshwater lake, and the outlet flowing into the Persian Gulf at point ‘1’ is distinct from the DEM profile (Figure 9b(I)). We also observed a second hydrologic channel traversing the Tell of Eridu (Figure 9b(I)) expressed as ‘2’. The presence of shallow lakes and freshwater marshes at Eridu is observable; therefore, the existence of extensive water channels was suggested by the samples from the Ubaid (5284–4994 BCE) and early dynasty (2855–2481 BCE and 2621–2351 BCE) ages [79]. Therefore, it is consistent with the SAR/InSAR observations and interpretations (see Figure 9a). HH Comp. captured that crevasse splay and meandering of ancient canals surrounding the Tell of Eridu and exhibited the resolving power of the far lower-resolution SAR imagery compared to a high-resolution optical image (Figure 9b(II)). The intersection/spoke-style trails clearly seen in Figure 9c(III) are barely visible or not visible at all in the high-resolution optical image. It is not clear whether it is the plowed rows described in Eridu’s expedition reports or contemporary vehicle tracks. Nonetheless, the DEM crosscuts indicate that there are very shallow imprints. Although the footprints were unlikely to be Sumerian or ancient, they exhibited the resolving ability of the SAR Comp. product. It demonstrates that the resolving power of the SAR pictures to detect shallow surface/subsurface objects is comparable to 30 to 60 times higher-resolution optical images.
Evidence of the resolving power of the SAR Comp. using scattergrams is shown in Figure 10, where the hidden artifact has a different regression pattern than the surrounding background. It shows that subsurface reflection signals were captured in bands 2 and 3 of HH TS tr-SVD. Numerical/quantitative interpretations of such scattering mechanisms are beyond the scope of this study.
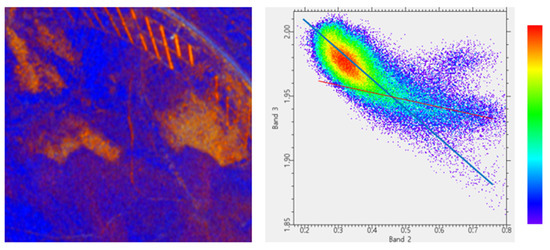
Figure 10.
The scattergram of HH TS tr-SVD 2/3 bands (left) over the hidden features (right) shown in Figure 8b(I).
6. Conclusions
This study aimed to establish a SAR/InSAR methodology for extracting maximal information from an archaeological context from an extensive spatial domain by using easily accessible medium-resolution public domain products.
As demonstrated in the results of this study, SAR and InSAR data, when appropriately processed, are effective in reconstructing the paleo-environment and tracing hydrologic features and their migrations, which have been critical to the development and fate of once-inhabited civilizations. This allows us to focus on the footprint of anthropogenic activity and settlement associated with the paleo-environment, such as channels and lakes.
As a tool for finding artificial geomorphic features, we employed L-band SAR image composition and discovered that the resolving power SAR images is far superior to the multispectral optical image analyses or even high- and very-high-resolution images. Although L-band radar imaging, which is presumed to possess considerable penetration depth, does not show significant signatures over buried artificial features, the features buried shallowly by very thin soil cover in the absence of significant vegetation were often distinguished by L-band SAR combinations. This implies that using medium-resolution (>25 m) SAR images to detect archaeological evidence is limited but feasible, especially in specific environments such as dry land. Efficient ways to utilize SAR/InSAR capabilities for archaeological applications include:
- (1)
- The use of SAR/InSAR data to integrate with other optical images, topography, and existing GIS;
- (2)
- Interpretation using all available background information from geological, climatic, and chronological clues;
- (3)
- Application of appropriate technical processing, such as preprocessing, time-series construction, and transformation.
We also suggest that the archaeological clues interpreted and implied in our study are obvious and fit into existing theories or datasets, making them worth reanalyzing through ground survey work. When additional sensor assets, such as L-band NASA-ISRO SAR (NISAR) [80] and P-band Biomass Monitoring Mission for Carbon Assessment (BIOMASS) [81] become accessible, the utilization of SAR and InSAR data for archaeological applications will develop into a powerful tool. Long wavelength P- and L-band SAR with more polarization modes will be useful for detecting/mapping other subsurface features of interest to archaeologists.
Funding
This research received no external funding.
Data Availability Statement
The data that support the findings of this study are available on request from the corresponding author. The ancient channel data is available at https://doi.org/10.13140/RG.2.2.35101.87524 (accessed on 1 January 2023). and Sumerian city data is available at https://zenodo.org/record/5642899#.Y-P-oXZBwQ8 (accessed on 1 January 2023).
Acknowledgments
The author would like to greatly thank the sincere efforts by Hussein Tbena Kadhim and Waleed Al-Shafie in Ministry of Agriculture, Iraq, to secure ground observation data, although, the access to test areas couldn’t be managed due to the restriction on the security issue. The author deeply appreciates the data sharing and kind confirmation of data use by Jaafar Jotheri.
Conflicts of Interest
The author declares no conflict of interest.
References
- Tamburrino, A. Water Technology in Ancient Mesopotamia. In Ancient Water Technologies; Springer: Berlin/Heidelberg, Germany, 2010; pp. 29–51. [Google Scholar]
- Woolley, C.L. Excavations at Ur. J. R. Soc. Arts 1933, 82, 46–59. [Google Scholar]
- Beckman, G. Briefe aus Uruk-Warka, 1931–1939. J. Am. Orient. Soc. 2009, 129, 375. [Google Scholar]
- Van de Mieroop, M. The Ancient Mesopotamian City; Clarendon Press: Oxford, UK, 1997. [Google Scholar]
- Langdon, S. The British Museum Excavations at Abu Shahrain in Mesopotamia in 1918. By R. Campbell Thompson, Esq., MA, FSA From Archæologia, Volume. lxx. 11½× 9½ pp. 101–144, 6 plates. J. R. Asiat. Soc. 1922, 54, 621–625. [Google Scholar] [CrossRef]
- Menze, B.H.; Mühl, S.; Sherratt, A.G. Virtual survey on north Mesopotamian tell sites by means of satellite remote sensing. In Broadening Horizons: Multidisciplinary Approaches to Landscape Study; Cambridge Scholars Publishing: Newcastle upon Tyne, UK, 2007; pp. 5–29. [Google Scholar]
- McMahon, A. Waste management in early urban southern Mesopotamia. In Sanitation, Latrines and Intestinal Parasites in Past Populations; Routledge: Oxfordshire, UK, 2016; pp. 31–52. [Google Scholar]
- Menze, B.H.; Ur, J.A. Mapping patterns of long-term settlement in Northern Mesopotamia at a large scale. Proc. Natl. Acad. Sci. USA 2012, 109, E778–E787. [Google Scholar] [CrossRef]
- Willis, L.E. Looting in Ancient Mesopotamia: A Legislation Scheme for the Protection of Iraq’s Cultural Heritage. Ga. J. Int’l Comp. L. 2005, 34, 221. [Google Scholar]
- Wiseman, J.; El-Baz, F. Remote Sensing in Archaeology; Springer: Berlin/Heidelberg, Germany, 2007. [Google Scholar]
- de Gruchy, M.; Cunliffe, E. How the Hollow Ways Got Their Form and Kept Them: 5000 Years of Hollow Ways at Tell Al-Hawa. In New Agendas in Remote Sensing and Landscape Archaeology in the Near East; Archaeopress Archaeology: Oxford, UK, 2020; p. 124. [Google Scholar]
- Stone, E.C.; Lawrence, D.; Altaweel, M.; Philip, G. Hollow Ways in Southern Mesopotamia. In New Agendas in Remote Sensing and Landscape Archaeology in the Near East; Archaeopress Archaeology: Oxford, UK, 2020; pp. 144–153. [Google Scholar]
- Menze, B.H.; Ur, J.A. Multitemporal fusion for the detection of static spatial patterns in multispectral satellite images—With application to archaeological survey. IEEE J. Sel. Top. Appl. Earth Obs. Remote Sens. 2014, 7, 3513–3524. [Google Scholar] [CrossRef]
- Comer, D.C.; Harrower, M.J.; Menze, B.H.; Ur, J.A. Multi-temporal classification of multi-spectral images for settlement survey in northeastern Syria. In Mapping Archaeological Landscapes from Space; Springer: Berlin/Heidelberg, Germany, 2013; pp. 219–228. [Google Scholar]
- Rost, S. Navigating the ancient Tigris–insights into water management in an early state. J. Anthropol. Archaeol. 2019, 54, 31–47. [Google Scholar] [CrossRef]
- Rost, S. Water management in Mesopotamia from the sixth till the first millennium BC. Wiley Interdiscip. Rev. Water 2017, 4, e1230. [Google Scholar] [CrossRef]
- Kraus, K.; Pfeifer, N. Determination of terrain models in wooded areas with airborne laser scanner data. ISPRS J. Photogramm. Remote Sens. 1998, 53, 193–203. [Google Scholar] [CrossRef]
- Kim, J.; Muller, J.-P. Tree and building detection in dense urban environments using automated processing of IKONOS image and LiDAR data. Int. J. Remote Sens. 2011, 32, 2245–2273. [Google Scholar] [CrossRef]
- Mongus, D.; Žalik, B. Parameter-free ground filtering of LiDAR data for automatic DTM generation. ISPRS J. Photogramm. Remote Sens. 2012, 67, 1–12. [Google Scholar] [CrossRef]
- Hulley, G.C.; Hook, S.J.; Baldridge, A.M. Investigating the effects of soil moisture on thermal infrared land surface temperature and emissivity using satellite retrievals and laboratory measurements. Remote Sens. Environ. 2010, 114, 1480–1493. [Google Scholar] [CrossRef]
- Kennett, D.J.; Kennett, J.P. Early State Formation in Southern Mesopotamia: Sea Levels, Shorelines, and Climate Change. J. Isl. Coast. Archaeol. 2006, 1, 67–99. [Google Scholar] [CrossRef]
- Kennett, D.J.; Kennett, J.P. Influence of Holocene marine transgression and climate change on cultural evolution in southern Mesopotamia. Clim. Change Cult. Dyn. 2007, 229–264. [Google Scholar] [CrossRef]
- Aqrawi, A.A. Stratigraphic signatures of climatic change during the Holocene evolution of the Tigris–Euphrates delta, lower Mesopotamia. Glob. Planet. Change 2001, 28, 267–283. [Google Scholar] [CrossRef]
- Smith, M.E.V. Gordon Childe and the Urban Revolution: A historical perspective on a revolution in urban studies. Town Plan. Rev. 2009, 80, 3–29. [Google Scholar] [CrossRef]
- Campbell, S. Culture, Chronology and Change in the Later Neolithic of North Mesopotamia; University of Edinburgh: Edinburgh, UK, 1992. [Google Scholar]
- Morozova, G.S. A review of Holocene avulsions of the Tigris and Euphrates rivers and possible effects on the evolution of civilizations in lower Mesopotamia. Geoarchaeology 2005, 20, 401–423. [Google Scholar] [CrossRef]
- Jacobsen, T.; Adams, R.M. Salt and Silt in Ancient Mesopotamian Agriculture: Progressive changes in soil salinity and sedimentation contributed to the breakup of past civilizations. Science 1958, 128, 1251–1258. [Google Scholar] [CrossRef] [PubMed]
- Connan, J. Use and trade of bitumen in antiquity and prehistory: Molecular archaeology reveals secrets of past civilizations. Philos. Trans. R. Soc. London. Ser. B: Biol. Sci. 1999, 354, 33–50. [Google Scholar] [CrossRef]
- Wilkinson, T.J.; Rayne, L.; Jotheri, J. Hydraulic landscapes in Mesopotamia: The role of human niche construction. Water Hist. 2015, 7, 397–418. [Google Scholar] [CrossRef]
- Jotheri, J.; Allen, M.B.; Wilkinson, T.J. Holocene Avulsions of the Euphrates River in the Najaf Area of Western Mesopotamia: Impacts on Human Settlement Patterns. Geoarchaeology 2016, 31, 175–193. [Google Scholar] [CrossRef]
- Jotheri, J.; Altaweel, M.; Tuji, A.; Anma, R.; Pennington, B.; Rost, S.; Watanabe, C. Holocene fluvial and anthropogenic processes in the region of Uruk in southern Mesopotamia. Quat. Int. 2018, 483, 57–69. [Google Scholar] [CrossRef]
- Leick, G. Mesopotamia: The Invention of the City; Penguin Books: London, UK, 2002. [Google Scholar]
- Algaze, G. The end of prehistory and the Uruk period. In The Sumerian World; Routledge: Oxfordshire, UK, 2013; pp. 92–118. [Google Scholar]
- Reichel, C.D. Political Changes and Cultural Continuity in the Palace of the Rulers at Eshnunna (Tell Asmar) from the Ur III Period to the Isin-Larsa Period (ca. 2070--1850 BC)(Iraq); University of Chicago, Department of Near Eastern Languages and Civilizations: Chicago, IL, USA, 2001. [Google Scholar]
- Foster, B.R. Reconstructing History from Ancient Inscriptions: The Lagash-Umma Border Conflict; JSTOR: New York, NY, USA, 1984. [Google Scholar]
- Hritz, C. Tracing Settlement Patterns and Channel Systems in Southern Mesopotamia Using Remote Sensing. J. Field Archaeol. 2013, 35, 184–203. [Google Scholar] [CrossRef]
- Hnaihen, K.H. River transport in mesopotamia (5900–539 BC). Światowit 2020, 59, 141–151. [Google Scholar] [CrossRef]
- Wenke, R. Heartland of Cities: Surveys of Ancient Settlement and Land Use on the Central Floodplain of the Euphrates; JSTOR: New York, NY, USA, 1982. [Google Scholar]
- Massa, M.; Palmisano, A. Change and continuity in the long-distance exchange networks between western/central Anatolia, northern Levant and northern Mesopotamia, c. 3200–1600 BCE. J. Anthropol. Archaeol. 2018, 49, 65–87. [Google Scholar] [CrossRef]
- Wilkinson, T.J. Hydraulic landscapes and irrigation systems of Sumer. In The Sumerian World; Routledge: Oxfordshire, UK, 2013; pp. 57–78. [Google Scholar]
- Verhoeven, K. Geomorphological research in the Mesopotamian flood plain. In Changing Watercourses in Babylonia: Towards a Reconstruction of the Ancient Environment in Lower Mesopotamia, Vol. 1.; Oriental Institute of the University of Chicago: Chicago, IL, USA, 1998; Volume 2, pp. 159–240. [Google Scholar]
- Morozova, G.S.; Smith, N.D. Holocene avulsion styles and sedimentation patterns of the Saskatchewan River, Cumberland Marshes, Canada. Sediment. Geol. 2000, 130, 81–105. [Google Scholar] [CrossRef]
- Milli, S.; Forti, L.; Romano, L.; D’Agostino, F. Geology and palaeoenvironment of Nasiriyah area/southern Mesopotamia. Abu Tbeirah Excav. I. Area 1: Last Phase Build. A–Phase 1 2019, 44, 21. [Google Scholar]
- Pollock, S.; Susan, P. Ancient Mesopotamia; Cambridge University Press: Cambridge, UK, 1999; Volume 1. [Google Scholar]
- Engel, M.; Brückner, H. Holocene climate variability of Mesopotamia and its impact on the history of civilisation. In Middle East and North Africa; Brill: Leiden, NE, USA, 2021; pp. 77–113. [Google Scholar]
- Saad, Z.J.; Goff, J.C. Geology of Iraq; Brno, Czech Republic, Geological Society Pub House: London, UK, 2006. [Google Scholar]
- Pennington, B.T.; Bunbury, J.; Hovius, N. Emergence of civilization, changes in fluvio-deltaic style, and nutrient redistribution forced by Holocene sea-level rise. Geoarchaeology 2016, 31, 194–210. [Google Scholar] [CrossRef]
- Yacoub, S.Y. Geomorphology of the Mesopotamia plain. Iraqi Bull. Geol. Min. Spec. Issue 2011, 4, 7–32. [Google Scholar]
- Al-Gburi, H.F.A.; Al-Tawash, B.S.; Al-Lafta, H.S. Environmental assessment of Al-Hammar marsh, southern Iraq. Heliyon 2017, 3, e00256. [Google Scholar] [CrossRef]
- Richardson, C.J.; Hussain, N.A. Restoring the Garden of Eden: An ecological assessment of the marshes of Iraq. BioScience 2006, 56, 477–489. [Google Scholar] [CrossRef]
- Yagüe-Martínez, N.; Prats-Iraola, P.; Gonzalez, F.R.; Brcic, R.; Shau, R.; Geudtner, D.; Eineder, M.; Bamler, R. Interferometric processing of Sentinel-1 TOPS data. IEEE Trans. Geosci. Remote Sens. 2016, 54, 2220–2234. [Google Scholar] [CrossRef]
- Geudtner, D.; Torres, R.; Snoeij, P.; Davidson, M.; Rommen, B. Sentinel-1 system capabilities and applications. In Proceedings of the 2014 IEEE Geoscience and Remote Sensing Symposium, Quebec City, QC, Canada, 13–18 July 2014; pp. 1457–1460. [Google Scholar]
- Lazecký, M.; Spaans, K.; González, P.J.; Maghsoudi, Y.; Morishita, Y.; Albino, F.; Elliott, J.; Greenall, N.; Hatton, E.; Hooper, A. LiCSAR: An automatic InSAR tool for measuring and monitoring tectonic and volcanic activity. Remote Sens. 2020, 12, 2430. [Google Scholar] [CrossRef]
- Kankaku, Y.; Suzuki, S.; Osawa, Y. ALOS-2 mission and development status. In Proceedings of the 2013 IEEE International Geoscience and Remote Sensing Symposium-IGARSS, Melbourne, Australia, 21–26 July 2013; pp. 2396–2399. [Google Scholar]
- Shimada, M.; Itoh, T.; Motooka, T.; Watanabe, M.; Thapa, R. Generation of the first PALSAR-2 global mosaic 2014/2015 and change detection between 2007 and 2015 using the PALSAR and PALSAR-2. In Proceedings of the 2016 IEEE International Geoscience and Remote Sensing Symposium (IGARSS), Beijing, China, 10–15 July 2016; pp. 3871–3872. [Google Scholar]
- Molan, Y.E. Global 25m Resolution PALSAR-2/PALSAR Mosaic and Forest. Non-Forest Map (FNF) Dataset Description. Available online: https://www.eorc.jaxa.jp/ALOS/en/kyoto/dec2014_kc21/pdf/1-05_KC21_Shimada-JAXA.pdf (accessed on 1 January 2023).
- Riegler, G.; Hennig, S.; Weber, M. Worlddem—A Novel Global Foundation Layer. In International Archives of the Photogrammetry, Remote Sensing & Spatial Information Sciences, Proceedings of the 2015 PIA15+HRIGI15—Joint ISPRS Conference, Munich, Germany, 25–27 March 2015; ISPRS: Munich, Germany, 2015; Volume XL-3/W2. [Google Scholar]
- Krieger, G.; Moreira, A.; Fiedler, H.; Hajnsek, I.; Werner, M.; Younis, M.; Zink, M. TanDEM-X: A satellite formation for high-resolution SAR interferometry. IEEE Trans. Geosci. Remote Sens. 2007, 45, 3317–3341. [Google Scholar] [CrossRef]
- Becek, K.; Koppe, W.; Kutoğlu, Ş.H. Evaluation of vertical accuracy of the WorldDEM™ using the runway method. Remote Sens. 2016, 8, 934. [Google Scholar] [CrossRef]
- Yun, H.-W.; Kim, J.-R.; Choi, Y.-S.; Lin, S.-Y. Analyses of time series InSAR signatures for land cover classification: Case studies over dense forestry areas with L-band SAR images. Sensors 2019, 19, 2830. [Google Scholar] [CrossRef]
- Kim, J.-R.; Lin, C.-W.; Lin, S.-Y. The Use of InSAR Phase Coherence Analyses for the Monitoring of Aeolian Erosion. Remote Sens. 2021, 13, 2240. [Google Scholar] [CrossRef]
- Yunjun, Z.; Fattahi, H.; Amelung, F. Small baseline InSAR time series analysis: Unwrapping error correction and noise reduction. Comput. Geosci. 2019, 133, 104331. [Google Scholar] [CrossRef]
- Biggs, J.; Wright, T.; Lu, Z.; Parsons, B. Multi-interferogram method for measuring interseismic deformation: Denali Fault, Alaska. Geophys. J. Int. 2007, 170, 1165–1179. [Google Scholar] [CrossRef]
- De Zan, F.; Zonno, M.; Lopez-Dekker, P. Phase inconsistencies and multiple scattering in SAR interferometry. IEEE Trans. Geosci. Remote Sens. 2015, 53, 6608–6616. [Google Scholar] [CrossRef]
- De Zan, F.; Gomba, G. Vegetation and soil moisture inversion from SAR closure phases: First experiments and results. Remote Sens. Environ. 2018, 217, 562–572. [Google Scholar] [CrossRef]
- Zwieback, S.; Hensley, S.; Hajnsek, I. Assessment of soil moisture effects on L-band radar interferometry. Remote Sens. Environ. 2015, 164, 77–89. [Google Scholar] [CrossRef]
- Molan, Y.E.; Lu, Z.; Kim, J.-W. Influence of the statistical properties of phase and intensity on closure phase. IEEE Trans. Geosci. Remote Sens. 2020, 58, 7346–7354. [Google Scholar] [CrossRef]
- Shimada, M. Ortho-rectification and slope correction of SAR data using DEM and its accuracy evaluation. IEEE J. Sel. Top. Appl. Earth Obs. Remote Sens. 2010, 3, 657–671. [Google Scholar] [CrossRef]
- Frost, V.S.; Stiles, J.A.; Shanmugan, K.S.; Holtzman, J.C. A model for radar images and its application to adaptive digital filtering of multiplicative noise. IEEE Trans. Pattern Anal. Mach. Intell. 1982, 2, 157–166. [Google Scholar] [CrossRef]
- Sun, Z.; Zhang, Z.; Chen, Y.; Liu, S.; Song, Y. Frost filtering algorithm of SAR images with adaptive windowing and adaptive tuning factor. IEEE Geosci. Remote Sens. Lett. 2019, 17, 1097–1101. [Google Scholar] [CrossRef]
- Paillou, P.; Lopez, S.; Farr, T.; Rosenqvist, A. Mapping Subsurface Geology in Sahara Using L-Band SAR: First Results From the ALOS/PALSAR Imaging Radar. IEEE J. Sel. Top. Appl. Earth Obs. Remote Sens. 2010, 3, 632–636. [Google Scholar] [CrossRef]
- Paillou, P.; Grandjean, G.; Baghdadi, N.; Heggy, E.; August-Bernex, T.; Achache, J. Subsurface imaging in south-central Egypt using low-frequency radar: Bir Safsaf revisited. IEEE Trans. Geosci. Remote Sens. 2003, 41, 1672–1684. [Google Scholar] [CrossRef]
- van Gasselt, S.; Kim, J.R.; Choi, Y.-S.; Kim, J. The Oasis impact structure, Libya: Geological characteristics from ALOS PALSAR-2 data interpretation. Earth Planets Space 2017, 69, 35. [Google Scholar] [CrossRef]
- Halko, N.; Martinsson, P.-G.; Tropp, J.A. Finding structure with randomness: Probabilistic algorithms for constructing approximate matrix decompositions. SIAM Rev. 2011, 53, 217–288. [Google Scholar] [CrossRef]
- Sissakian, V.; Shihab, A.; Al-Ansari, N.; Knutsson, S. Al-Batin alluvial fan, southern Iraq. Engineering 2014, 6, 699–711. [Google Scholar] [CrossRef]
- Sissakian, V.; Al-Ansari, N.; Adamo, N. Geomorphology, Stratigraphy and Tectonics of the Mesopotamian Plain, Iraq: A Critical Review. Geotectonics 2021, 55, 135–160. [Google Scholar] [CrossRef]
- Howard-Carter, T. Dilmun: At Sea or Not at Sea?: A Review Article. J. Cuneif. Stud. 1987, 39, 54–117. [Google Scholar] [CrossRef]
- Alhawi, N.A.; Albadran, B.N.; Pournelle, J.R. The archaeological sites along the ancient course of Euphrates river. Am. Sci. Res. J. Eng. Technol. Sci. ASRJETS 2017, 29, 1–20. [Google Scholar]
- Hritz, C.; Pournelle, J.; Smith, J.; Albadran, B.; Issa, B.M.; Al-Handal, A. Mid-Holocene dates for organic-rich sediment, palustrine shell, and charcoal from southern Iraq. Radiocarbon 2012, 54, 65–79. [Google Scholar] [CrossRef]
- Alvarez-Salazar, O.; Hatch, S.; Rocca, J.; Rosen, P.; Shaffer, S.; Shen, Y.; Sweetser, T.; Xaypraseuth, P. Mission design for NISAR repeat-pass Interferometric SAR. In Proceedings of the Sensors, Systems, and Next-Generation Satellites XVIII, Dresden, Germany, 23–26 September 2013; p. 92410C. [Google Scholar]
- Ramongassie, S.; Valle, P.; Arpesi, P.G.; Heliere, F. P-band SAR instrument for BIOMASS. In Proceedings of the EUSAR 2014, 10th European Conference on Synthetic Aperture Radar, Berlin, Germany, 2–6 June 2014; pp. 1–4. [Google Scholar]
Disclaimer/Publisher’s Note: The statements, opinions and data contained in all publications are solely those of the individual author(s) and contributor(s) and not of MDPI and/or the editor(s). MDPI and/or the editor(s) disclaim responsibility for any injury to people or property resulting from any ideas, methods, instructions or products referred to in the content. |
© 2023 by the author. Licensee MDPI, Basel, Switzerland. This article is an open access article distributed under the terms and conditions of the Creative Commons Attribution (CC BY) license (https://creativecommons.org/licenses/by/4.0/).