Abstract
Flood hazards resulting from short-term severe precipitation have caused serious social and economic losses and have posed extraordinary threats to the safety of lives and property. Vulnerability, which reflects the degree of the adverse impact of flooding on a city, the sensitivity of the environment, and the extent to which rescues are possible during flooding, is one of the significant factors of the disaster risk assessment. Because of this, this paper proposes an Environmental Vulnerability Analysis Model (EVAM), based on comprehensively evaluating multi-source remote sensing data. The EVAM includes a two-stage, short-term flood vulnerability assessment. In the first stage, the flood’s areal extension and land-use classification are extracted, based on the U-NET++ network, using multi-source satellite remote sensing images. The results from the first stage are used in the second stage of vulnerability assessment. In the second stage, combining multi-source data with associated feature extraction results establishes the Exposure–Sensitivity–Adaptive capacity framework. The short-term flood vulnerability index is leveraged through the analytic hierarchy process (AHP) and the entropy method is calculated for an environmental vulnerability evaluation. This novel proposed framework for short-term flood vulnerability evaluation is demonstrated for the Henan Province. The experimental results show that the proportion of vulnerable cities in the Henan Province ranging from high to low is 22.22%, 22.22%, 38.89%, and 16.67%, respectively. The relevant conclusions can provide a scientific basis for regional flood control and risk management as well as corresponding data support for post-disaster reconstruction in disaster regions.
1. Introduction
Across the globe, storm flood disasters have occurred with a high frequency, limiting economic and sustainable development [1,2]. Against the background of climate change, disaster risk is forecast to increase both globally and regionally [3,4]. Extreme disaster events can bring devastating effects on human lives and properties. Meanwhile, rapid urbanization and industrialization, as well as transformations in human productivity and lifestyle, have intensified pressure on water resources and significantly changed hydrological processes. In addition, drainage and waterlogging prevention facilities are poorly constructed, and urban waterlogging is increasing [5]. Urban populations and wealth are especially densely concentrated, industries are highly clustered, and transportation is strongly interconnected [6,7,8,9,10]. Urban floods show explosive, chained, and catastrophic characteristics, which brings new challenges to the analysis, research, prevention, and control of urban floods [11,12]. According to statistics from the Ministry of Emergency Management of the People’s Republic of China, half of the top ten natural disasters in China have been caused by rainstorm-floods, including: 1) the catastrophic rainstorm in the Henan province from 17 July to 23 July 2021); the serious autumn flood in the middle and lower reaches of the Yellow River in September 2021); the storm flood disasters in Shanxi from 10 July to 23 July 2021; the storm flood in Hubei from 8 August to 15 August 2021); the storm flood in Shaanxi from 19 August to 25 August 2021. It can be concluded that accurate extraction of the flood areal extension and integration of the multi-source heterogeneous remote sensing data are the key technologies for the application of the environmental vulnerability analysis model.
The United Nations’ International Strategy for Disaster Reduction (UNISDR) Terminology on Disaster Risk Reduction defines vulnerability as: the attributes of communities, systems, or properties and the extent to which the environment is damaged by disaster-causing factors, vulnerability is related to natural, social, economic, and environmental factors, and to some extent has time and space attributes [13]. When disaster drivers are highly destructive and the vulnerability of the social system is high, the risk level for natural disasters is correspondingly high. Vulnerability generally includes physical vulnerability and social vulnerability. Physical vulnerability is the probability of loss by the disaster bearer under various disaster intensities; it is a quantitative estimation of the disaster resistance of the disaster bearer on a microscale [14]. Social vulnerability is related to societal, economic, cultural, and other factors. Social vulnerability is a natural attribute during disasters [15]. Currently, flood vulnerability assessment can be roughly classified into four categories. First, the scenario simulation method focuses primarily on the quantitative prediction methods based on the scenario model for small-area flood vulnerability, its application is limited by large-scale flood disasters [16,17]. The second category is the vulnerability curve method, which mainly studies the relationships between flood intensity and the affected disaster bearer [18,19]. The third category consists of historical data-based methods, usually used for the assessment of large-scale flood vulnerability but that rely on historical flood events statistical data [20,21]. The fourth category is the index-based system method, the most basic and critical segment in the establishment of an indicator framework. The indicators selected in the construction of the vulnerability assessment vary according to different assessment objects, differences in assessment subjects’ understanding of social vulnerability, and different specific assessment methods [22,23,24]. The Third Assessment Report of the Intergovernmental Panel on Climate Change proposed an Exposure–Sensitivity–Adaptive capacity framework for vulnerability assessment [25,26,27,28]. Exposure refers to the degree to which the system is influenced by external stress. Sensitivity refers to the degree to which the system is affected by climate change. Adaptive capacity refers to the ability of a system to mitigate potential damage by adapting to climate change. The Exposure-Sensitivity-Adaptive capacity conceptual framework had been utilized in various vulnerability assessments with the goal of addressing multi-dimensional issues. Vulnerability indexes were limited by timeliness. With the rapid development and wide application of remote sensing technology, providing research bases for quantitative assessment of urban rainstorm flood disaster risk is conducive to promoting planners and managers to carry out short-term rainstorm flood disaster risk management.
Inspired by these studies, this paper mainly delves deeply into the social vulnerability aspect of short-term rainstorms and flood disasters. It focuses on integrating multi-source heterogeneous remote sensing data and analyzing the vulnerability of storm flood catastrophes used to construct an environmental vulnerability model, which is for evaluating the hazard of short-term precipitation-induced flooding. To achieve this goal, flood areal extension extraction and the vulnerability assessment indicator framework were chosen as starting points for this study. A methodology for evaluating the hazards of short-term precipitation-induced flooding was proposed in our work. First, flood area extension extraction and land-use classification, based on a deep convolutional neural network, were addressed, driven by multi-source remote sensing images. Then, a real extension of the flood, land-use classification, and other indexes are combined to build the vulnerability evaluation system. Finally, an Environmental Vulnerability Analysis Model (EVAM) leveraged on multi-source remote sensing data is used to comprehensively evaluate the complex impact of short-term floods in this paper. The contributions of this work are twofold:
- (1)
- The present study proposes a novel framework of short-term flood vulnerability analysis through a deep learning-based U-Net++ as well as Exposure–Sensitivity–Adaptive capacity indicators.
- (2)
- Flood areal extension extraction and land-use classification based on multi-source satellite remote sensing images have high real-time performance.
2. Experimental Data and Methodology
In this experiment, multi-source remote sensing data was utilized to construct an environmental vulnerability analysis model (EVAM). The proposed EVAM, from a disaster management perspective, was adopted to evaluate the complex impact of floods on the regional environment. Firstly, the result of flooding scope and land-use types were extracted based on multi-source satellite remote sensing images. Then, these results were utilized to build a vulnerability evaluation model. In the end, the vulnerability of urban regions in Henan Province was assessed by applying the vulnerability indicators acquired.
2.1. Study Area
The study area, Henan Province (31°23′~36°22′N, 110°21′~116°39′E, Figure 1), is located in the center of China. Its total area is 167,000 square kilometers, and the permanent population is about 99 million according to the 2020 Henan Statistical Yearbook. Its terrain is high in the west and low in the east, and is surrounded by mountains in the north, west and south, with the Huang-Huai-Hai Alluvial Plain in the east-central region, and the Nanyang Basin in the southwest. Plains/basins and mountainous/hills account for 55.7% and 44.3% of Henan’s total area, respectively. In addition, Henan is the only province in China that stretches over four river basins including the Yangtze River, Huaihe River, Yellow River, and Haihe River.
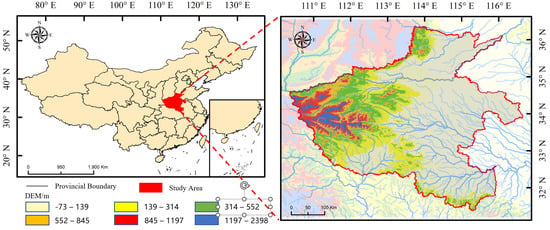
Figure 1.
Schematic diagram of experimental area.
As Henan Province is located in the transition zone where warm temperate and subtropical climates meet, it has obvious climate characteristics that meteorological disasters occur frequently, and rainfall is mostly concentrated in the flood season [29]. In July 2021, Henan encountered a rare and extraordinarily heavy rainfall in its history, resulting in 398 deaths or missing persons, with tens of billions of economic losses [30,31,32]. Therefore, this paper takes Henan Province as the study area to analyze the vulnerability to floods and waterlogging therein, providing an important reference for the follow-up improvement of measures regarding emergency and governance.
In order to evaluate the hazard of short-term precipitation-induced floods in the area, the data sources used in this experiment included: the NASA datasets of Global Precipitation Measurement (GPM) v6—precipitation data (17 July 2021–23 July 2021), data of the 2021 Population Counts of WorldPop (https://hub.worldpop.org/geodata/listing?id=69, accessed on 1 March 2022), the NASA-USDA Global Soil Moisture Data, the global 30 m impervious surface dynamic dataset (GISD30), the population structure data, and data of education, drainage, medical institutions, and GDP from the Statistical yearbook of Henan (https://tjj.henan.gov.cn/tjfw/tjcbw/tjnj/, accessed on 1 March 2022), the impervious surface area data from Zenodo database, (https://zenodo.org/record/5220816#.YrUCEPnraly, accessed on 1 March 2022), and the road network data (https://www.openstreetmap, accessed on 10 March 2022).
The experimental data of remote sensing images are summarized in Table 1. Specifically, in this experiment, the flooding scope was obtained based on the optical images, to evaluate and analyze the spatial change of the water body as well as the influence and inundation to surroundings. Due to the major difference between the Sentinel-1A satellite images and the Landsat-8 satellite images in spatial resolution, the resolution of Sentinel-1A satellite images was lowered to that of the Landsat-8 satellite images by down-sampling. Accordingly, a total of 61 images of the study area were collected for experimental analysis.

Table 1.
The experimental data of remote sensing images used in this paper.
2.2. Flooding scope Extraction and Land-Use Classification Based on Multi-source Remote Sensing Images
An end-to-end architecture where flooding scope extraction and land-use classification were proposed and then performed simultaneously. Figure 2 shows the significance of the proposed method. Specifically, U-NET++ was used as the backbone network for flooding scope extraction and land use classification based on multi-source remote sensing images, allowing us to alleviate the problems caused by the network depth through effective integration of U-Net with different depths, as well as to obtain better training effect upon integrating deep supervision, new skip connection layer structures, and pruning schemes [33]. On this basis, multispectral remote sensing images and SAR images of the same period in the study area were taken as inputs. Next, the results of the flooding scope were extracted from SAR images, and affected land-use types were taken from multispectral images. The final results were then carried out by overlap analysis. In the end, the flooding scope and surrounding affected land use types were used for the environmental vulnerability evaluation.
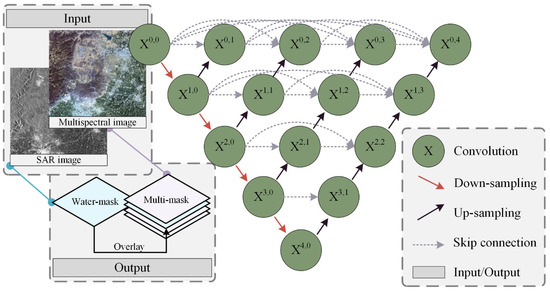
Figure 2.
Network structure of flood areal extension extraction and land-use classification.
The U-Net++ network includes the convolution layer, down-sampling layer, up-sampling layer, skip connection layer, and input/output layer. The shallow and deep features of different proportions of ground objects can be fused using multi-scale skip connection layers. Compared with other networks, more details of remote sensing images can be reserved in U-Net++, which is one of the main reasons for selecting this network for work. represents convolution nodes with different proportions, and the relationship between nodes is defined as follows:
where H represents the convolution operation, D represents down-sampling operation.
U represents the up-sampling operation, i is defined as the number in the sequence of down-sampling operation along the encoder, and j is defined as the number in the sequence of skip connection operation.
On the other hand, deep supervision was introduced in the U-Net++ network to obtain the best depth in multiple models of the U-Net. Sigmoid activation function and 1 × 1 convolution were added to X0,1, X0,2, X0,3, and X0,4 nodes of the outputs. Where C is equal to the number of categories of the given data set, and N is the number of all pixels. After calculation, a new loss function is defined, and was mainly composed of pixel level cross entropy loss and dice coefficient loss. The loss function has the advantages of both smoothing the gradient and redistributing the imbalance class, which is defined as follows:
where yn,c ∈ Y represents the target label, pn,c ∈ P represents the prediction probability of the current category, c represents the current category, and n represents the nth pixel. In addition, the training model can be pruned through deep supervision to reduce the parameters that have to be saved. It can be realized in the following two ways: (1) integrated mode: collect the segmentation results of all model branches, and then take the average value; (2) pruning mode: select one from the multi-scale U-Net model as the output. Therefore, by leveraging the U-Net++ network, the flooding scope and land-use types extracted therefrom can be applied to evaluate the environmental vulnerability to short-term precipitation-induced floods.
2.3. Disaster Evaluation System Based on Multi-Source Data
The Exposure–Sensitivity–Adaptive capacity framework was used to build an environmental vulnerability model for short-term precipitation-induced floods. The vulnerability indicators were largely gained from the flooding scope extraction in the U-Net++ network, focusing on reflecting and explaining the exposure and sensitivity of short-term precipitation-induced floods. In combination with flooding scope extraction, land-use type, and remote sensing data, 18 vulnerability indicators (Figure 3), including precipitation, economy, population, watershed runoff, land-use, transportation, medical care, drainage facilities and educational condition were quantified. Based on the above vulnerability indicators, analytic hierarchy process (AHP) and entropy were integrated to construct the vulnerability analysis model. Furthermore, the EVAM was used to evaluate the hazard of short-term precipitation-induced floods.
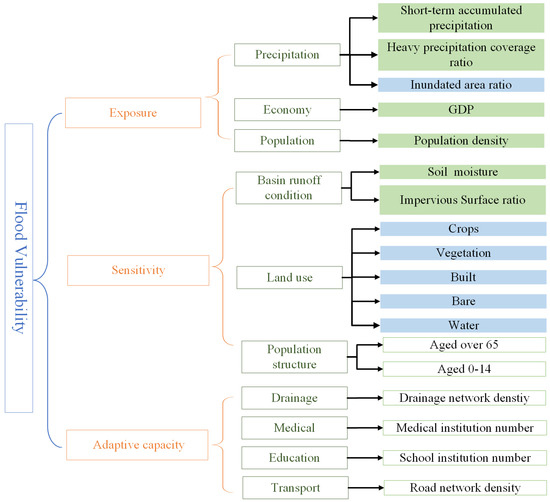
Figure 3.
Index system of rainstorm flood vulnerability model (the s-indexes of green filling are based on the remote sensing product extraction, the s-indexes of bule filling are based on the U-Net++ extraction, the s-indexes without filling are based on the statistical data collection).
2.3.1. Establishing Vulnerability Model
In the vulnerability analysis system of short-term precipitation-induced floods, flood scope extension extraction and vulnerability index system were combined to construct the environmental vulnerability analysis model for short-term precipitation-induced floods. In order to better reflect the features of the vulnerability to short-term precipitation-induced floods, an assessment method was introduced into the EVAM, and its mathematical expression is shown in Equation (3).
where f is the vulnerability indicator of exposed region, E is the exposure indicator, S is the sensitivity indicator, and A is the adaptive capacity indicator. α, β, δ are the weights of primary indicators.
E, S and A were calculated by multiplying the normalized secondary indicator data by the corresponding weights and sums, i.e., these are composite scores obtained after using the entropy value method to calculate the weights of secondary indicators.
- (1)
- Exposure
Exposure indicator, primarily characterized by rainstorm, economic or demographic data, is positive in Equation (3) and increases the vulnerability to short-term precipitation-induced floods. On these grounds, short-term precipitation-related data, GDP (gross domestic product), and population density were selected in our study. Short-term precipitation is the disaster-inducing factor for heavy rainfall flooding. Vulnerability to floods increases significantly in disaster-affected areas where the population density is too concentrated without effective flood response measures. For areas enjoying sound economic development while lacking in experience of short-term precipitation-induced flood prevention, the economic losses caused by floods are significantly exacerbated. In addition, short-term precipitation lead to work and production suspension, which indirectly incurs economic losses. Therefore, exposure can raise the vulnerability to short-term precipitation-induced floods.
- (2)
- Sensitivity
The sensitivity indicator, which is characterized by land use, demographic structure, and environmental sensitivity, is positive in Equation (3). The land-use types were extracted based on the U-Net++ network. Moreover, the impervious surface has relatively poor permeability to water and even cannot be penetrated, it is one of main attributes of urban waterlogging. The larger the impervious surface layer, the greater the sensitivity of the city to floods [34]. In terms of the demographic structure, those who are over 65 years of age and who are under 14 years of age correspond to the percentage of urban elderly and children, and they are less resilient and more sensitive to flood disaster. Therefore, the sensitivity indicator is positively related to vulnerability.
- (3)
- Adaptive capacity
Adaptive capacity indicator is negative in Equation (3) and decreases the vulnerability to short-term precipitation-induced floods. The adaptive capacity was analyzed from the aspects of transportation, drainage facilities, medical treatment, and education. In terms of education, the educational level is conducive to improving the disaster response ability [35], and educational institution reflects the overall education and popularization to people on disaster response. For transportation conditions, it reflects the input ability of relief workers and materials during short-term precipitation-induced floods, and for medical resources, they are related to disaster relief support ability and insurance mechanism. In addition, to significantly lower the occurrences of urban waterlogging, the urban drainage system should be built in a reasonable way. Hence, the adaptive capacity indicators can improve the resilience of a city to short-term precipitation-induced floods.
2.3.2. Confirming Weights of Indicators
In this experiment, AHP (analytic hierarchy process) was used as it was a systematic and hierarchical analysis method combining qualitative and quantitative analysis [36,37,38]. Firstly, the weight of three primary indicators, exposure, sensitivity, and adaptive capacity, were determined based on AHP. The specific steps were as follows: (1) Determination of the scale, construct the judgment matrix, and finally establish the judgment matrix table by using the 1–5 rating scale method together with the expert scoring; (2) Calculation of the eigenvector, eigenroot, and weight of the matrix; (3) Consistency test analysis using, CR value, where CR < 0.1 indicates that the consistency test passes; otherwise, it fails to pass.
Secondly, the entropy method was used to determine the weight of 18 secondary indicators. It is a mathematical method to assess the degree dispersion of indicatiors. The specific process was as follows:
Step 1: Data standardization processing. Positive indicators select positive normalization Equation (4), and reverse indicators select reverse normalization Equation (5). Mab and Nab represent the values of positive as well reverse normalization of a in the b region, respectively. and represent the maximum and minimum values of the nth index, respectively.
Step 2: Calculate the proportion of the value of j in the region i, and m denotes the number of regions participating in the study areas.
Step 3: Calculate using information entropy.
Step 4: Calculate the redundancy using information entropy.
Step 5: Calculate the weights, and n represents the number of indicators.
Step6: Calculate the score of single-indicator evaluation.
The weights of vulnerability to short-term precipitation-induced floods were calculated according to AHP and entropy method. The vulnerability evaluation index system and weight results are shown in Table 2.

Table 2.
Flood vulnerability evaluation index system and weight results.
3. Results
3.1. Flooding Scope Extraction and Land-Use Types Results
In our experiment, flooding scope and land-use types were extracted based on the U-NET++ network which was free from the deficiencies of flooding scope extraction using traditional methods. The buildings, mountain shadows, and other surface features can be misdentified as flood features when using traditional feature extraction methods, including the threshold method and OSTU method. Moreover, flooding scope simulation results based on the diffuse attenuation coefficients cannot be applied to complex actual flood situations. Comparatively speaking, the accuracy of the U-Net++ network is better than these traditional methods, and the deep learning network can obtain typical land use features from texture features of real-time satellite remote sensing images. Thus, it can avoid the above problems, although the accuracy of flooding scope extraction and land use type is heavily dependent on the drive of remote sensing data. In order to improve the training efficiency, the U-NET++ network was applied to reduce the model parameters. On the other hand, multi-sensor satellite remote sensing images were used to increase the precision of flood feature identification. In the absence of verification data, such feature identification was maintained at a high accuracy through artificial visual interpretation.
Land-use types before or after disasters and flooding scope were extracted by using the U-NET++ network (Figure 4). As shown in Figure 4a,b, the results include water, crops, vegetation, bare lands, and buildings. Results in Figure 4c,d are obtained from local amplification, corresponding to the red rectangular region. Depending on the results of the spatial distribution of land-use types before and after precipitation-induced floods, these disasters mainly occurred in the northeast of Henan Province (Xinxiang and Hebi). The flooding scopes in these cities increased significantly after short-term precipitation-induced floods. According to the local amplification results, short-term precipitation-induced floods occurred in dense urban communities, resulting in serious economic and property losses, or even threats to human life.
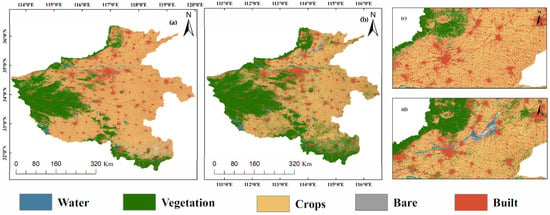
Figure 4.
Analysis and comparison of the affected areas before and after flooding in Henan Province. (a) is pre-flood classification result, (b) is post-flood classification result, (c) is pre-flood local amplification result, (d) is post-flood local amplification result.
Impact analysis for various land-use features about precipitation-induced floods is seen in Figure 5, which shows the chord diagram of land-use feature changes, and such changes of land-use features are significant in the study area. The impacts of precipitation-induced floods on various land use features are more intuitive and quantitative. The severity of impacts from high to low is: crops, vegetation, bare lands, and buildings. For water bodies converted into croplands, they resulted from the connection to croplands during the evolution of the short-term precipitation-induced floods, which greatly changed the original water contour lines and made them evolve in space. As urban floods affect human activity areas to a certain extent and erode various land use features, these affected areas or lands may recover in the short term or could be permanently irreversible. For example, the inundated urban roads may temporarily cause traffic inconvenience but can be resolved through drainage, transpiration and other ways, and the inundated crops lands may cause irreparable economic losses.
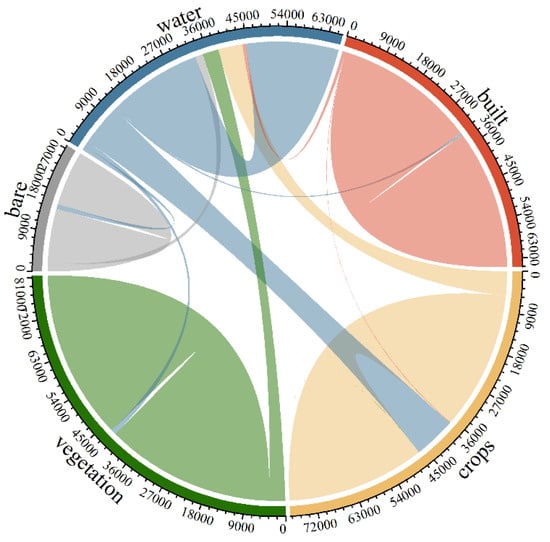
Figure 5.
Impact analysis of various ground features caused by flood disasters.
The land use type transfer matrix of the short-term precipitation-induced flood disaster is given in Table 3. On a macroscale, the short-term precipitation-induced flood area is 26.55 km2, and the increased area only accounts for 0.18% of the flooded area. The spatial resolution of the remote sensing images is 30 m, calculated from the number of pixels in the flooded area. Generally, areas in Henan Province affected by short-term precipitation-induced floods vary in degree, and the change in land-use features is consistent with the above conclusion. The affected land-use features remain within the range of crops areas, vegetation, bare lands, and buildings. According to the large-scale data analysis, some land use features do not change significantly, which may result from the algorithm accuracy or other factors, rather than the short-term precipitation-induced flood itself. However, precipitation-induced flood itself explains that flood not only has a greater influence on the area of intensive precipitation, but also has a more or less irreversible trend impact on the whole flooded area. Therefore, these potential factors of influence must be considered the environmental vulnerability analysis.

Table 3.
Transfer matrix of land-use classification before and after the flood disaster.
3.2. Analysis of Building Disaster Vulnerability Model Based on Multi-source Data
Combining AHP with the entropy method, 18 indicators of the Exposure–Sensitivity–Adaptive capacity framework were included in this experiment, so as to build an environmental vulnerability analysis model. The vulnerability indicators, including flood area and land use type, were obtained by using the U-Net++ network. Other vulnerability indicators are acquired based on remote sensing data. For instance, precipitation indicators in a disaster vulnerability model were mainly achieved based on the NASA data sets of Global Precipitation Measurement (GPM) v6 precipitation data (see Figure 6). The characteristic of this data is that the precipitation data during the short-term precipitation-induced disaster can be obtained in real time. In this paper, the precipitation data from 17 July 2021 to 23 July 2021 were collected. The daily precipitation during the disaster was accumulated and treated as a short-term accumulated precipitation indicator, and the results of short-term accumulated precipitation more than 50 mm were treated as heavy precipitation coverage ratio indicators. The inundated area ratio indicator was got through flooding scope extraction using U-Net++, and basin runoff condition indicators in this model were processed through the NASA-USDA Global Soil Moisture Data and the global 30 m impervious surface dynamic dataset (GISD30), respectively. Land use types were all extracted through the U-Net++. The remote sensing image data from 17 July 2021 to 23 July 2021 was obtained. The population structure and adaptive capacity indexes were taken from the statistical yearbook of Henan in 2020, which was the latest data that could be obtained for vulnerability analysis.
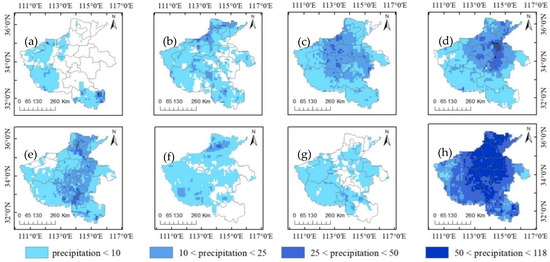
Figure 6.
The daily precipitation and cumulative precipitation result. (a–g) is the precipitation from 17 July 2021 to 23 July 2021, respectively. (h) is the cumulative precipitation.
Results and Analysis of Criterion Layer Elements
In order to better analyze the vulnerability to short-term precipitation-induced floods in the study area, the weight of AHP and the entropy method were elaborated in our experiment. For the AHP algorithm, the criterion layer contained three evaluation factors, which are exposure, sensitivity, and adaptive capacity, respectively. AHP algorithm combined quantitative analysis with qualitative analysis, and then the relative importance of each objective was determined with the experience of decision-makers, so as to give each weight reasonably. In addition, expert experience and rule layer information were consolidated for comprehensive evaluation. The importance of the criterion layer was exposure, sensitivity, and adaptive capacity. After using the 1–5 rating scale, the final judgment matrix is shown in Table 4.

Table 4.
The index scale result in AHP.
According to AHP, a judgment matrix was constructed to calculate the eigenvector, eigenroot, and three weights of primary indicators. CI refers to consistency indicator, and CR refers to consistency ratio. When the CR value is lower than 0.1, it means the consistency test passes. AHP results are shown in Table 5.

Table 5.
Analytic hierarchy process results.
In this work, the weights of primary indicators obtained were based on AHP, and the entropy method was used to determine the weights of secondary indicators. Then, the comprehensive scores of the vulnerability indicators were calculated. The calculated vulnerability indexes and results from a specific analysis are as following:
- (1)
- Exposure
Generally speaking, in the face of extreme disaster events, the economic losses of developed regions are more seriously due to high exposure. accounting for a large proportion in the vulnerability to short-term precipitation-induced floods. A weight of 0.491 was got in this experiment, and in the study area, the precipitation in Xinxiang, Jiaozuo, Kaifeng, and Zhengzhou was relatively high, and rainfall coverage and flood submerging range were larger. As cities like Zhengzhou, Xinxiang and Jiaozuo enjoy sound economic development with dense population, they were highly exposed regions in this extreme disaster event.
- (2)
- Sensitivity
People under 14 years old and over 65 years old are highly sensitive to short-term precipitation-induced floods with poor self-rescue ability. The sensitivity of different land-use types to floods is also completely changed. Developed cities have higher modernization and dense buildings, resulting in a larger impervious surface area. Zhengzhou is a new first-tier city in Henan Province, covering the abovementioned city features, and therefore, the probability of waterlogging after extreme rainstorm could be at a high degree. In Kaifeng, Zhoukou, Puyang, and Shangqiu, there is a problem with the serious aging of population, large proportion of crops, and relatively high sensitivity to floods. For short-term precipitation-induced flood prevention and control, attention should be paid to sensitive groups and the construction of flood control facilities set in highly sensitive areas.
- (3)
- Adaptive capacity
As the provincial capital city, Zhengzhou is an important transportation hub with a dense road network and convenient transportation. It is rich in medical resources and has a higher comprehensive disaster responsability. However, its southern and north-eastern regions are economically backward relatively, and the road networks are sparse, the medical resources are scarce, and their disaster response abilities are low.
- (4)
- Composite vulnerability
On the whole, the vulnerability results calculated by the EVAM were divided into four levels: very high, high, medium and low (Figure 7). Vulnerability classification was based on GIS natural breaks algorithm. The very vulnerable regions are Zhengzhou, Jiaozuo, Xinxiang Hebi and Xuchang, respectively, as these cities are generally economically developed and densely populated. The higher urbanization it is, the denser the buildings there are. Meanwhile, the impervious surface area gradually increases, aggravating the heat island effect of the city. The surface air temperature rises, and the infiltration decreases. It will also lead to a reduction in vegetation coverage aggravating the exposure and sensitivity of the disaster response capacity of personnel, economic condition, and infrastructure in short-term precipitation-induced floods. Low vulnerability is concentrated in mountainous areas with high altitude and high forest coverage, which are relatively less precipitation in short-term precipitation-induced floods. These areas generally have low exposure and sensitivity. According to the results of vulnerability analysis, most of them in the Henan Province show medium and high vulnerability, which should be focused on disaster control construction and emergency rescue in the future.
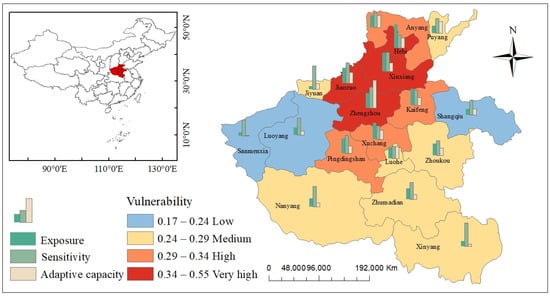
Figure 7.
Results of vulnerability assessment in Henan Province.
In order to further verify the accuracy of the EVAM model proposed for short-term precipitation-induced floods, the experiment used social media data of this flood in July 2021 for analysis. The software tool used for social media data collection was “GooSeeker”, and the social media data acquisition platform was Sina Weibo (a social platform) based on its characteristics of rapid response, wide coverage and wide influence on extreme natural disasters. The information from 17 July 2021 to 23 July 2021 on this platform was collected. On this social platform, “Henan Rainstorm” was searched as the keyword, and the valid data were more than 80,000. The information on short-term precipitation-induced floods in severity was extracted based on social media data (Figure 8). In the experimental analysis, Pearson’s method was used to analyze the correlation between vulnerability to short-term precipitation-induced floods and disaster risk of the social media data. Pearson’s method is a statistical index to express the linear correlation between two variables [39,40]. The closer the correlation value approaches 1, the higher the correlation between the two variables, and the closer the relationship between them. The correlation value between the vulnerability to short-term precipitation-induced floods and the severity of social media data was 0.76, demonstrating a significant positive correlation between them.
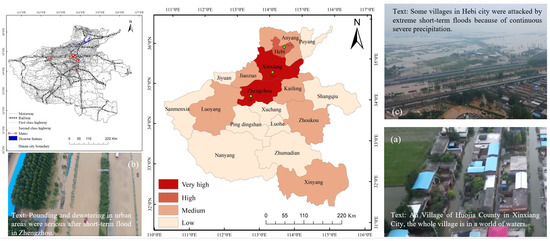
Figure 8.
The severity of short-term flood disasters based on social media data.
4. Discussion
The existing research on flood disaster analysis and risk assessment can be divided into two categories [41,42,43]: Simulating the evolution and extinction trend of flood regions based on a variety of reference data and analyzing the impact of disaster based on references and data with long time series. These methods have achieved excellent results in extreme disasters. However, these previous studies have their limitations, which include the feasibility of data collection, timeliness of reference data, and model universality in complex practical situations. Consequently, an EVAM based on multi-source remote sensing data is proposed to comprehensively evaluate the complex impact of short-term precipitation-induced floods on the regional environment. Vulnerability indicators in this model are based on multi-source remote sensing data extraction, allowing to solve the limitations of the feasibility of data collection and timeliness of reference data. Moreover, the flooding scope is extracted by the U-Net++ network. Therefore, the disaster-related information is more authentic and accurate than the simulation methods. It realizes the extraction of flooding scope and land-use type in a complex context. A vulnerability index system is established based on leveraging on statistical theories, integrating with exposure, sensitivity, and adaptive capacity.
The previous methods require land-use data before and after the disaster as inputs, and the available public data limit the prompt evaluation of precipitation-induced floods in terms of time and space coverage. Therefore, to solve this problem, U-NET++ can be used to gain nearly real-time and continuous land-use type data, making EVAM a widely available method. On the one hand, U-Net++ has the advantages of U-Net, which presents a left–right symmetrical U-shaped structure, and is able to compress the image and reduces noise through the encoder–decoder, while saving the typical features of the image. In addition, the gradient disappearance problem of U-Net++ is solved by skipping the connection, and the original summation is replaced by concatenation, allowing us to retain the typical generalization characteristics of the image. On the other hand, U-Net++ has the capacity to reduce model parameters, helping the model of flooding scope extraction and land-use classification training efficiency to be improved. U-Net++ improves the recognition accuracy and training time significantly better than other models, and can obtain the shallow and deep features of different scales in remote sensing images. In this experiment, due to the lack of data with high temporal resolution, the temporal resolution of experimental data met the daily scale, and the spatial resolution was 30 m. It is difficult to give a quantifiable result verifying the proposed model accuracy. However, the overall accuracy is greater than 80% through visual interpretation, and the feature extraction network is considerable reliability and consistency. This model extracts and quantifies 18 indicators from three dimensions of environmental vulnerability assessment (i.e., exposure, sensitivity, and adaptive capacity) as inputs. The weight of each indicator is determined through AHP and entropy method, and the disaster vulnerability index of each regional cell is then obtained. Accordingly, the impact analysis and risk assessment of short-term precipitation-induced floods are produced. The disaster evaluation system constructed has a high transferability, which is available for other disasters, and can better predict the environmental changes in other regions before and after disasters. In addition, AHP is a widely used theory in the multi-criteria analysis and assessment of natural disaster risk. It is in need of a variety of reference data with different spatial and temporal resolutions and the selection of multiple parameters. As a consequence, the timeliness of data and human subjective factors may lead to additional potential errors. In the future, combined with deep learning and other theories driven by multi-source data, a more objective model system could be built to deal with the disaster impact analysis under various changes, showing more comprehensive and objective model effectiveness. How to be compatible with multi-source data, unify model data standards, and meet the need of diverse emergency management levels will also be an issue to be continuously concerned and solved in subsequent research.
5. Conclusions
This study proposes a novel framework to evaluate the vulnerability to short-term precipitation-induced floods through deep learning-based U-Net++, multi-source remote sensing images as well as Exposure–Sensitivity–Adaptive capacity indicators. These can complete the large-scale, rapid, and automatic evaluation of urban short-term precipitation-induced floods. The exhaustive framework is demonstrated over Henan Province concerning, the short-term precipitation-induced flood that occurred from 17 to 23 July 2021. Taking 18 cities in Henan Province as assessment units, the overall relative vulnerability distribution of Henan Province is obtained.
- U-Net++ is used as the backbone of the network to realize the classification of land uses and the extraction of flooding scope, and then analyze the flooding scope and the results of the surrounding land use erosion. During this short-term rainfall, the water area has increased by 0.18%. The rainfall has the greatest impact on crops lands, but has a weak impact on areas of vegetation and bare lands, and a very weak impact on buildings. The model can quickly and pertinently analyze the land use types affected by short-term precipitation-induced floods, and then provide data support for post-disaster reconstruction and recovery. The proposed feature extraction framework, on account of giving the consideration of land use characteristics and real-time extraction of flooding scope, shows its wide applicability, especially for resource and data-constrained flood regions.
- In this paper, the Exposure–Sensitivity–Adaptive capacity framework is used as the vulnerability assessment system on short-term precipitation-induced floods, and the EVAM is constructed based on multi-source data. The vulnerability is divided into four levels: very high, high, medium, and low. The proportion of the four levels in the study area from high to low is 22.22%, 22.22%, 38.89%, and 16.67%, respectively. The EVAM proposed has well transferability for vulnerability analysis to other types of disasters and can better estimate the relative vulnerability of other regions.
Author Contributions
H.Z. proposed the methodology and wrote the manuscript. J.Y. and J.M. contributed to improving the methodology and is the corresponding author. C.C. and M.W. helped edit and improve the manuscript. R.Y. contributed to methodological testing. All authors have read and agreed to the published version of the manuscript.
Funding
This research was jointly supported by grants from the Science technology research and development plan self-fund program of Langfang (Grant No. 2022011020); the National natural disaster risk remote sensing monitoring prewarning and emergency application platform construction (Grant No. 2021YFB3901204); the Hebei Province Science and Technology Research Project (Grant No. Z2020119); the Fundamental Research Funds for the Central Universities (Grant No. ZY20200202).
Data Availability Statement
The data are not publicly available due to restrictions privacy.
Conflicts of Interest
The authors declare no conflict of interest.
References
- Dottori, F.; Szewczyk, W.; Ciscar, J.-C.; Zhao, F.; Alfieri, L.; Hirabayashi, Y.; Bianchi, A.; Mongelli, I.; Frieler, K.; Betts, R.A.; et al. Increased human and economic losses from river flooding with anthropogenic warming. Nat. Clim. Change 2018, 8, 781–786. [Google Scholar] [CrossRef]
- Bamidele, O.F.; Badiora, A.I. Flood Disaster Vulnerability in North Central Nigeria. Int. J. Res. Innov. Soc. Sci. 2019, 3, 42–49. [Google Scholar]
- Ma, S.; Lyu, S.; Zhang, Y. Weighted clustering-based risk assessment on urban rainstorm and flood disaster. Urban Clim. 2021, 39, 100974. [Google Scholar] [CrossRef]
- Shoyama, K.; Cui, Q.; Hanashima, M.; Sano, H.; Usuda, Y. Emergency flood detection using multiple information sources: Integrated analysis of natural hazard monitoring and social media data. Sci. Total Environ. 2020, 767, 144371. [Google Scholar] [CrossRef] [PubMed]
- Rahman, M.; Ningsheng, C.; Mahmud, G.I.; Islam, M.; Pourghasemi, H.R.; Ahmad, H.; Habumugisha, J.M.; Washakh, R.M.A.; Alam, M.; Liu, E.; et al. Flooding and its relationship with land cover change, population growth, and road density. Geosci. Front. 2021, 12, 101224. [Google Scholar] [CrossRef]
- Yang, Y.; Guo, H.; Wang, D.; Ke, X.; Li, S.; Huang, S. Flood vulnerability and resilience assessment in China based on super-efficiency DEA and SBM-DEA methods. J. Hydrol. 2021, 600, 126470. [Google Scholar] [CrossRef]
- Schwarz, I.; Kuleshov, Y. Flood Vulnerability Assessment and Mapping: A Case Study for Australia’s Hawkesbury-Nepean Catch-ment. Remote Sens. 2022, 14, 4894. [Google Scholar] [CrossRef]
- Wang, B.; Loo, B.P.; Zhen, F.; Xi, G. Urban resilience from the lens of social media data: Responses to urban flooding in Nanjing, China. Cities 2020, 106, 102884. [Google Scholar] [CrossRef]
- Qi, W.; Ma, C.; Xu, H.; Zhao, K. Urban flood response analysis for designed rainstorms with different characteristics based on a tracer-aided modeling simulation. J. Clean. Prod. 2022, 355, 131797. [Google Scholar] [CrossRef]
- Chang, H.; Pallathadka, A.; Sauer, J.; Grimm, N.B.; Zimmerman, R.; Cheng, C.; Iwaniec, D.M.; Kim, Y.; Lloyd, R.; McPhearson, T.; et al. Assessment of urban flood vulnerability using the social-ecological-technological systems framework in six US cities. Sustain. Cities Soc. 2021, 68, 102786. [Google Scholar] [CrossRef]
- Liu, X.; Yang, S.; Ye, T.; An, R.; Chen, C. A new approach to estimating flood-affected populations by combining mobility patterns with multi-source data: A case study of Wuhan, China. Int. J. Disaster Risk Reduct. 2021, 55, 102106. [Google Scholar] [CrossRef]
- Kim, K.; Pant, P.; Yamashita, E. Integrating travel demand modeling and flood hazard risk analysis for evacuation and sheltering. Int. J. Disaster Risk Reduct. 2018, 31, 1177–1186. [Google Scholar] [CrossRef]
- United Nations International Strategy for Disaster Reduction. UNISDR Terminology on Disaster Risk Reduction; United Nations International Strategy for Disaster Reduction: Geneva, Switzerland, 2009. [Google Scholar]
- Wood, R.M.; Drayton, M.; Berger, A.; Burgess, A.; Wright, T. Catastrophe loss modelling of storm-surge flood risk in eastern England. Philos. Trans. R. Soc. A 2005, 363, 1407–1422. [Google Scholar] [CrossRef]
- Wisner, B.; Blaikie, P.; Cannon, T.; Davis, I. At Risk: Natural Hazards, People’s Vulnerability and Disasters, 2nd ed.; Routledge: London, UK, 2003. [Google Scholar]
- Lopez-Valencia, A.P. Vulnerability assessment in urban areas exposed to flood risk: Methodology to explore green infrastructure benefits in a simulation scenario involving the Canaveralejo River in Cali, Colombia. Nat. Hazards 2019, 99, 217–245. [Google Scholar] [CrossRef]
- Shi, Y. Population vulnerability assessment based on scenario simulation of rainstorm-induced waterlogging: A case study of Xuhui District, Shanghai City. Nat. Hazards 2013, 66, 1189–1203. [Google Scholar] [CrossRef]
- Budiyono, Y.; Aerts, J.; Brinkman, J.; Marfai, M.; Ward, P. Flood risk assessment for delta mega-cities: A case study of Jakarta. Nat. Hazards 2015, 75, 389–413. [Google Scholar] [CrossRef]
- Hendrawan, V.S.A.; Komori, D. Developing flood vulnerability curve for rice crop using remote sensing and hydro-dynamic modeling. Int. J. Disaster Risk Reduc. 2021, 54, 102058. [Google Scholar] [CrossRef]
- Adikari, Y.; Osti, R.; Noro, T. Flood-related disaster vulnerability: An impending crisis of megacities in Asia. J. Flood Risk Manag. 2010, 3, 185–191. [Google Scholar] [CrossRef]
- Jongman, B.; Winsemius, H.C.; Aerts, J.C.J.H.; de Perez, E.C.; van Aalst, M.K.; Kron, W.; Ward, P.J. Declining vulnerability to river floods and the global benefits of adap-tation. Proc. Natl. Acad. Sci. USA 2015, 112, E2271–E2280. [Google Scholar] [CrossRef]
- Ding, M.; Heiser, M.; Hübl, J.; Fuchs, S. Regional vulnerability assessment for debris flows in China-a CWS approach. Landslides 2016, 13, 537–550. [Google Scholar] [CrossRef]
- Duan, Y.; Xiong, J.; Cheng, W.; Wang, N.; Li, Y.; He, Y.; Liu, J.; He, W.; Yang, G. Flood vulnerability assessment using the triangular fuzzy number-based analytic hierarchy process and support vector machine model for the Belt and Road region. Nat. Hazards 2022, 110, 269–294. [Google Scholar] [CrossRef]
- Yang, W.; Xu, K.; Lian, J.; Bin, L.; Ma, C. Multiple flood vulnerability assessment approach based on fuzzy com-prehensive evaluation method and coordinated development degree model. J. Environ. Manag. 2018, 213, 440–450. [Google Scholar] [CrossRef] [PubMed]
- Li, Y.; Gong, S.; Zhang, Z.; Liu, M.; Sun, C.; Xhan, Y. Vulnerability evaluation of rainstorm disaster based on ESA conceptual frame-work: A case study of Liaoning province, China. Sustain. Cities Soc. 2021, 64, 102540. [Google Scholar] [CrossRef]
- IPCC. Climate Change 2014: Synthesis Report. Contribution of Working Groups I, II and III to the Fifth Assessment Report of the Intergovernmental Panel on Climate Change; IPCC: Geneva, Switzerland, 2014. [Google Scholar]
- IPCC. Climate Change 2014: Impacts, Adaptation, and Vulnerability. Part a: Global and Sectoral Aspects. Contribution of Working Group II to the Fifth Assessment Report of the Intergovernmental Panel on Climate Change; Cambridge University Press: Cambridge, UK; New York, NY, USA, 2014. [Google Scholar]
- Duan, Y.; Xiong, J.; Cheng, W.; Wang, N.; He, W.; He, Y.; Liu, J.; Yang, G.; Wang, J.; Yang, J. Assessment and spatiotemporal analysis of global flood vulnerability in 2005–2020. Int. J. Disaster Risk Reduct. 2022, 80, 103201. [Google Scholar] [CrossRef]
- Deng, G.; Chen, H.; Wang, S. Risk assessment and prediction of rainstorm and flood disaster based on henan province, China. Math. Probl. Eng. 2022, 2022, 5310920. [Google Scholar] [CrossRef]
- Wang, H.; Hu, Y.; Guo, Y.; Wu, Z.; Yan, D. Urban flood forecasting based on the coupling of numerical weather model and stormwater model: A case study of Zhengzhou city. J. Hydrol. 2022, 39, 100985. [Google Scholar] [CrossRef]
- Wang, K.; Wu, Y.; Fan, Q. Construction of rainstorm security pattern based on waterlogging prevention and control: A case study on Zhengzhou City. Alex-Eng. J. 2022, 61, 8911–8918. [Google Scholar] [CrossRef]
- Zhang, S.; Ma, Z.; Li, Z.; Zhang, P.; Liu, Q.; Nan, Y.; Zhang, J.; Hu, S.; Feng, Y.; Zhao, H. Using CYGNSS Data to Map Flood Inundation during the 2021 Extreme Precipitation in Henan Province, China. Remote Sens. 2021, 13, 5181. [Google Scholar] [CrossRef]
- Zhou, Z.; Siddiquee, M.M.; Tajbakhsh, N.; Liang, J. UNet++: Redesigning Skip Connections to Exploit Multiscale Features in Image Segmentation. IEEE Trans. Med. Imaging 2020, 39, 1856–1867. [Google Scholar] [CrossRef]
- Zhang, X.; Liu, L.; Zhao, T.; Gao, Y.; Chen, X.; Mi, J. GISD30: Global 30 m impervious-surface dynamic dataset from 1985 to 2020 using time-series Landsat imagery on the Google Earth Engine platform. Earth Syst. Sci. Data. 2022, 14, 1831–1856. [Google Scholar] [CrossRef]
- Saaty, T.L. The Analytic Hierarchy Process; McGraw-Hill: New York, NY, USA, 1980; pp. 95–115. [Google Scholar]
- Dano, U.L. An AHP-based assessment of flood triggering factors to enhance resiliency in Dammam, Saudi Arabia. GeoJournal 2021, 87, 1945–1960. [Google Scholar] [CrossRef]
- Shannon, C.E. A mathematical theory of communication. Bell Syst. Tech. J. 1948, 27, 379–423. [Google Scholar] [CrossRef]
- Nsangou, D.; Kpoumié, A.; Mfonka, Z.; Ngouh, A.N.; Fossi, D.H.; Jourdan, C.; Mbele, H.Z.; Mouncherou, O.F.; Vandervaere, J.-P.; Ngoupayou, J.R.N. Urban flood susceptibility modelling using AHP and GIS approach: Case of the Mfoundi watershed at Yaoundé in the South-Cameroon plateau. Sci. Afr. 2022, 15, e01043. [Google Scholar] [CrossRef]
- Hauke, J.; Kossowski, T. Comparison of Values of Pearson’s and Spearman’s Correlation Coefficients on the Same Sets of Data. Quaest. Geogr. 2011, 30, 87–93. [Google Scholar] [CrossRef]
- Arndt, S.; Turvey, C.; Andreasen, N.C. Correlating and predicting psychiatric symptom ratings: Spearmans r versus Kendalls tau correlation. J. Psychiatr. Res. 1999, 33, 97–104. [Google Scholar] [CrossRef]
- Ologunorisa, T.E.; Abawua, M.J. Flood risk assessment: A review. J. Appl. Sci. Environ. Manag. 2005, 9, 57–63. [Google Scholar]
- Tsakiris, G.J.N.H. Flood risk assessment: Concepts, modelling, applications. Nat. Hazards Earth Syst. Sci. 2014, 14, 1361–1369. [Google Scholar] [CrossRef]
- Lyu, H.M.; Shen, S.L.; Zhou, A.; Yang, J. Perspectives for flood risk assessment and management for mega-city metro system. Tunn. Undergr. Space Technol. 2019, 84, 31–44. [Google Scholar] [CrossRef]
Disclaimer/Publisher’s Note: The statements, opinions and data contained in all publications are solely those of the individual author(s) and contributor(s) and not of MDPI and/or the editor(s). MDPI and/or the editor(s) disclaim responsibility for any injury to people or property resulting from any ideas, methods, instructions or products referred to in the content. |
© 2023 by the authors. Licensee MDPI, Basel, Switzerland. This article is an open access article distributed under the terms and conditions of the Creative Commons Attribution (CC BY) license (https://creativecommons.org/licenses/by/4.0/).