Abstract
Fluvial floods in coastal areas are affected by tides and storm surges, while the impact is seldom quantified because the dynamics of seawater levels are often not represented in river routing models. This study established a model framework by coupling a surge model with a global hydrodynamic model at a higher spatiotemporal resolution than previous studies so that flood processes affected by seawater level fluctuation in small river basins can be investigated. Model implementation in Zhejiang Province, China, shows that the integration of dynamic seawater levels increases the stress of flooding along the Zhejiang coasts. The ocean effect varies in space, as it is much stronger in northern Zhejiang because of the lower landform and strong tidal amplification, while the mountainous rivers in southern Zhejiang are dominated by river flow regimes. Typhoon Lekima resulted in compound flood events (i.e., rainfall-induced riverine flood, tides, and surges), during which the maximum water level at the outlet of Qiantang River was 0.80 m in the default model settings with a constant downstream seawater level (i.e., 0 m), while it increased to 2.34 m (or 2.48 m) when tides (or tides and surges) were considered. The maximum increase due to tides and surges was 2.09 m and 1.45 m, respectively, while the maximum increase did not match the time of the flood peak. This mismatching indicates the need to consider different processes in physical models rather than linearly summing up different extreme water levels (i.e., river flood, tide, and surge) found in previous studies. The model framework integrating various flow processes will help to prevent risks of compound events in coastal cities in practical and future projections under different scenarios.
1. Introduction
Coastal regions are often densely populated and economically developed, but also susceptible to flooding because of their low-lying topography [1]. Their flooding risk is increasing due to sea level rise [2] and the increasing frequency of tropical cyclones and extreme rainfall events [3], leading to extensive damage to local facilities, disruption in transportation, and human relocation in extreme cases [4]. Simulation of the flood processes is therefore important in practice for risk assessments or city planning and for understanding the mechanism of coastal flooding.
Flooding in coastal areas is often induced by the co-occurrence of heavy rainfall, riverine floods, and storm surges, which is a so-called compound event [5]. A typhoon is often a trigger of such compound events because it approaches the land with strong wind and heavy rainfall [6,7]. Strong wind results in storm surges, increasing the near-shore water level [8]; heavy rainfall causes rapid increases in river discharge and water level. The impact of surges can propagate upstream along river channels, leading to higher river water levels and making city drainage more difficult [9,10]. Therefore, it is important to understand how and how much these compound events within the typhoon period interact with and affect the coastal areas.
The flooding processes (water level or inundation) can be reported from in situ measurements or remote satellites (e.g., MODIS, Sentinel) on a large scale [11,12]. However, it is difficult to disentangle the impact of ocean water from observations since all aspects are integrated. Earth System Models provide a useful tool with which to simulate the flow regimes and enable a separating impact from a single parameter or boundary [13]. Ocean models can consider the effects of the atmosphere, astronomic tide, sea level, waves, and river discharge on hydrodynamics [10,14,15,16]. In this regard, various ocean models, such as the Finite Volume Community Ocean Model (FVCOM), MIKE21, the Regional Ocean Modeling System (ROMS), and Delft3D, have been used in previous studies to simulate coastal inundation induced by storm surges. However, their applications have been limited to relatively small scales because those detailed models are time-consuming in simulations, especially for land inundation processes [17].
Large-scale river models with the adoption of simplified Saint-Venant equations have high computational efficiency and robust flood modeling performance at the continental or global scales (e.g., LISFLOOD-FP [18] or the Catchment-based Macro-scale Floodplain model (CaMa-Flood) [19]). Among the large-scale river routing models, most use a kinematic wave equation and thus are limited in application to the analysis of compound events primarily due to the lack of presentation of backwater effects in discharge calculation [17], while some (e.g., CaMa-Flood) employ water surface slope to represent the realistic backwater effects, which makes it possible to consider river–ocean interactions at the terrestrial–aquatic interface by coupling with ocean models. Therefore, although limited, there have been a growing number of applications of large-scale river models to assess compound fluvial and coastal flooding events.
CaMa-Flood was originally developed to improve river flow simulations along the global river networks by adopting the diffusive wave equation and incorporating floodplain inundation dynamics [19]. Yamazaki et al. [20] incorporated the ocean tidal elevation at the river mouth and successfully reproduced the tidal signal in the inland Amazon basin, which suggests that CaMa-Flood includes the main physical processes needed to plausibly capture the tidal propagation in continental-scale rivers. Ikeuchi et al. [21] further developed a flexible lower boundary scheme by revising the lower boundary from a constant value to a dynamic water level (with a varying sea level rise and tides as calculated by a global ocean barotropic tide model (FES2021) and surge data from Global Tide and Surge Reanalysis (GTSR)) [17,22]. The new model framework was applied in Bangladesh and extended worldwide by Eilander et al. [23]. These applications showed that integrating sea water levels increased flood magnitudes and flood frequency across most of the coastline area. However, all the previous applications were run at a 15 arcmin spatial resolution with an average catchment size of 600 km2. The effects at a finer spatial resolution for small rivers are unknown. In addition, the CaMa-Flood was coupled with the nearest GTSR location, which is at a 5 km spatial resolution on the shallow coasts. The maximum distance tolerated between the unit catchment and the GTSR gauge was up to 75 km [24]. It is therefore difficult to determine accurate downstream water levels, especially at narrow estuaries or convergence bays, where the water elevation is greatly changed due to the shoaling effect during tidal wave propagation. Moreover, the tide process and surge were separated in previous studies. Their impact on water level was linearly added, which is not accurate, especially during rapid surges and for small rivers.
Motivated by the increasing attention paid to compound flooding in a warming climate, this study evaluated the impact of tides and surges on smaller rivers based on the CaMa-Flood model. Instead of using GTSR, we established a surge model based on MIKE21, which has high resolution along the coastline and integrates the processes of tides, winds, and atmospheric pressure, providing a more realistic view of water level fluctuation. By coupling the river routing model with the surge model, land–river–ocean interactions are represented for modeling the changing compound flood risks in the coastal regions of Zhejiang Province, with potential implications for flooding simulation in small river basins. The general descriptions including the model, data, study area, and evaluation methods will be introduced in Section 2. The results will be introduced in Section 3, consisting of an analysis of impacts from astronomic tides and surges on riverine flow regimes. Discussions and conclusions are provided in the last section.
2. Methods and Data
2.1. Study Domain
We selected Zhejiang Province, located on the southeast coast of China (118–122.2°E, 27–31.2°N), as our study area (Figure 1a). The topography of Zhejiang Province slopes from southwest to northeast, with approximately 74.63% of the land area covered by mountains and hills [25]. Therefore, most rivers in Zhejiang are mountainous rivers, with floods responding quickly to precipitation, and limited regulation ability of the river flows. Dominated by a subtropical monsoon climate, the fluvial floods of the western Zhejiang region are controlled by the plum rain, while eastern Zhejiang is often affected by typhoons originating from the northwestern Pacific Ocean. Storm surges combined with fluvial flooding resulting from typhoon precipitation have caused serious coastal economical losses and damage [26]. For instance, Super Typhoon Sang Mei (2006) caused 153 deaths in Cangnan County in Wenzhou City, with CNY 11.25 billion of direct economic losses [27]. During Typhoon Fitow (2013), spring tide superimposed on an extreme surge and heavy rainfall led the coastal tidal level to approach the 1-in-100-year return period water level, which affected 8 million inhabitants in Zhejiang Province, with direct economic losses amounting to CNY 33.36 billion in Ningbo City.
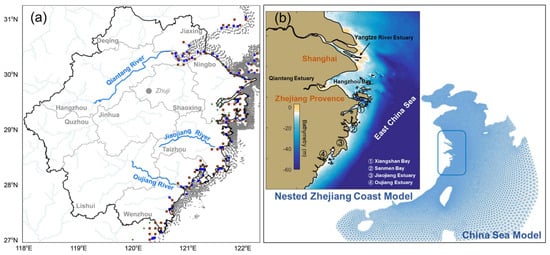
Figure 1.
Illustration of the study area and surge model settings. (a) The Zhejiang Province (outlined by a thick black boundary) and its municipal level boundaries, outlined with light gray. Rivers with mean river discharge higher than 10 m3/s are illustrated with light blue, and the three major rivers are drawn with thick lines. The connections between coastal CaMa-Flood nodes (i.e., unit catchment in a red square) and surge model nodes (i.e., triangle apex, in a blue square) are shown with gray lines. The gray dots are the locations of nearshore simulation nodes from the surge model mesh, with 80% of the nodes not shown for better visualization. (b) Model domain for the Zhejiang Coast–China Sea nested model (surge model).
2.2. River Routing Model
CaMa-Flood, which was integrated into the model framework, is used to simulate the fluvial dynamics [19]. It solves the mass and momentum equations with the local inertial approximation for river flows in one dimension [28]. The basic calculation unit in CaMa-Flood is the unit catchment, which integrates all the small pixels (i.e., 90 m) in a certain grid (0.1 degrees in this study) flowing to another identical grid. The unit catchment contains a river segment with a rectangular cross-section, and the river channel parameters are estimated with an empirical power-law function based on climatological average river discharge. To reduce local biases induced by using global constant power-law parameters, we further refined the river channel width with the Global Width Database for Large Rivers (GWD-LR [29]), which originated from the SRTM Water Body Data (SWBD) and Global Land Cover Facility (GLCF) MODIS Water Mask database [30]. The manning’s coefficient is set as default at 0.03 sm−1/3 [19]. The floodplain topography profile is derived from the global high-resolution topography MERIT DEM, which integrates multiple terrain elevation datasets (i.e., SRTM3, AW3D, VFP-DEM) with the help of ICESat (Ice, Cloud, and Land Elevation Satellite) laser altimetry [31], a global tree density map [32], and tree height map [33], to estimate errors due to forest canopy [34]. Therefore, the integration of remote satellite datasets is greatly helpful for the model settings and accuracy of model parameters. The relationship between water storage–water height–inundation area is generated from the topography and is applied to estimate either water height or inundation area at the simulation spatial resolution. To obtain the inundation area at a higher spatial resolution (i.e., 90 m), a downscaling method is applied, where the water inundates from lower pixels within the same unit catchment until the calculated water storage is all distributed.
We used a regional cutout of CaMa-Flood over southern China where the upstream flow could be included as it accumulates downstream. The ECMWF Reanalysis v5 (ERA5, [35]) runoff at a 6 arcmin spatial resolution was used as the input runoff forcing to drive CaMa-Flood. The downstream river stage of each unit catchment was used as the lower boundary condition in the local inertial equation. In this study, the water surface elevation of the ocean extracted from the surge model connected to the river outlet was considered as the lowest boundary, and the water level of the lower catchment was used as the boundary of its upstream unit catchment. The upstream propagation of tidal waves was therefore represented in the model. In addition to the default daily output, CaMa-Flood simulations also provided output at an hourly resolution to capture the high-frequency changes in river regimes corresponding to tides and surges.
2.3. Surge Model
The surge model adopted in the present study was initially established as the Zhejiang Coast–China Sea nested model, based on the MIKE21 flexible mesh model. The parent model, including a large portion of China’s coastal water, extended from 16.8°N to 40.8°N, and from 105.8°E to 133.8°E (Figure 1b). This computational domain includes most of the northwestern Pacific Ocean typhoon tracks that affect China’s coast and their far-field influence. The nested child model, the Zhejiang Coast model, applied a variable resolution mesh along the Zhejiang coast to compromise between simulation efficiency and accuracy. The model resolution varies from 37 km offshore to 60 m nearshore, and results were stored at a 1 h temporal resolution. Details about the nested model schematization and parameterization are introduced in the article of Liang et al. [36]. The nested model uses astronomic tidal levels derived from the NAOTIDE global model (NAO.99b), as well as mean sea level pressures of 10 m meridional (v; northward) and zonal (u; westward) wind components from the ERA5 reanalysis dataset, with a spatial resolution of 15 arcmins and a temporal resolution of 1 h. To ensure coherence between the flood drivers, the atmospheric forcing of the river routing model and surge model was based on the same ERA5 reanalysis dataset, with a significantly enhanced one-hour temporal resolution [35]. This surge model considers the interaction between tides and surges while neglecting the effect of waves whose contribution to surges is less than 5% [25]. This surge model has been validated for historical typhoon events, showing good agreement with previous observations [36].
2.4. Model Coupling and Typhoon Events
The surge model provided the ocean water level to be used as the downstream boundary of CaMa-Flood for the coastal unit catchments from which water flows into oceans. The water level at the nearest point within a maximum distance of 14.2 km from the unit catchment in the surge model meshes was used as the lower boundary of the coastal unit catchment. As shown in Figure 1a, the coastal unit catchments of CaMa-Flood (marked with a green cross) used the downstream water level derived from the surge model (marked with gray dots). The nodes that succeeded in connection are marked with red and blue squares for unit catchments and MIKE nodes, respectively. However, some unit catchments were not perfectly connected to the surge model meshes; some downstream river points in CaMa-Flood were far from the threshold for surge meshes. The unit catchments without connections kept using a constant zero value as the downstream boundary. Fortunately, the impact of this is limited because few big rivers flow into these unit catchments.
We ran a coupled model with a spin-up period of three years, and the river hydrodynamics in the year 2019 were specifically investigated because three typhoon events, i.e., Lekima (3 August–15 August), Mitag (27 September–5 October), and Lingling (31 August–11 September), affected Zhejiang Province from August to October, bringing strong winds and associated rainfall. Among these, Lekima ranked among the strongest tropical cyclones in 2019, with a maximum wind speed of 62 m/s and a minimum central pressure of 915 hPa. Based on the best tracks of typhoons from the China Meteorological Administration tropical cyclone database, Lekima developed over the Philippine Sea and was upgraded to a super typhoon on 3 August. Lekima made landfall on 10 August in Wenling, Taizhou City, which induced direct economic losses of CNY 30 billion in Taizhou City and Wenzhou City [37].
The strong winds induced during the typhoon period increased the sea water level, which exerted certain impacts on the riverine flooding and riverine water level. Consequently, our fluvial flood analysis focused on the three largest rivers in Zhejiang: the Qiantang River (QR), which is the largest river in northern Zhejiang; the Jiaojiang River (JR), which flows through Taizhou; and Oujiang River (OR), which flows through Wenzhou (Figure 1a). JR and OR are mountainous rivers, with floods responding quickly to precipitation, and limited regulation ability of the river flows. In addition, they usually have funnel- or bifurcation-shaped estuaries, where tidal amplification and strong river and tide interactions take place. The characteristics of these rivers are compared in Table 1.

Table 1.
Characteristics of the three largest rivers in Zhejiang Province.
2.5. Model Scenarios
To reproduce compound flood events and clarify the major drivers along Zhejiang Province, three experiments were designed, i.e., the control experiment (S0), with the default CaMa-Flood settings of constant downstream boundaries (0 m at the river outlet); the astronomical tide experiment (S1), using the fluctuated water level of astronomical tides as the downstream boundary; and the surge experiment (S2), using a realistic dynamic water level under the combined effects of astronomical tides, air pressure, and winds (especially the typhoons). Other model settings (i.e., model structure, parameters, inputs, and post-processing) remained the same among the three scenarios and are described in Section 2.2 and Figure 2. In S1 and S2, the seawater level fluctuations were simulated based on the surge model and read by CaMa-Flood as the downstream boundaries. Comparisons were conducted among them to show the differences due to modifications in the downstream boundary. We decided to focus on the riverine flood; therefore, the changes in river discharge, water level, and inundation area were analyzed. Because the tides and surge changes are featured as short-term events with a sub-daily scale, the analysis was conducted at both the daily and hourly time scales.
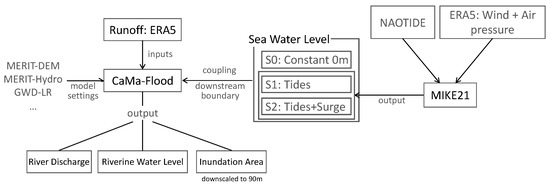
Figure 2.
Flowchart of the research. Different sea water levels (S0, S1, S2) will be used as the downstream boundary of the global hydrodynamic model (CaMa-Flood). Among the various sea water level scenarios, S1 (tides) and S2 (tides + surge) were provided by simulations from ocean model MIKE21, with consideration of the tide boundary only, and inputs of tides, wind and air pressure. For details, please refer to Section 2.3.
3. Results
3.1. Effects of Wind and Typhoon on Coastal Water Elevation
The difference among experiments S0, S1, and S2 was the coastal water level simulated by the surge model (Figure 3). The sea level was gradually elevated as tides propagate from offshore to nearshore due to nearshore bathymetry. The astronomical tide further elevated the water level at the head of bays and estuaries (e.g., Qiantang Estuary) while the impact was not apparent at Jiaojiang Estuary (Figure 3a). Landward winds (including typhoons) enhanced the maximum sea level nearshore (Figure 3b,c), leading to a maximum increase approaching 2 m in northern Zhejiang (e.g., the Xiangshan Bay, Sanmen Bay, and Jiaojiang Estuary), even 3 m from the head of Qiantang Estuary.
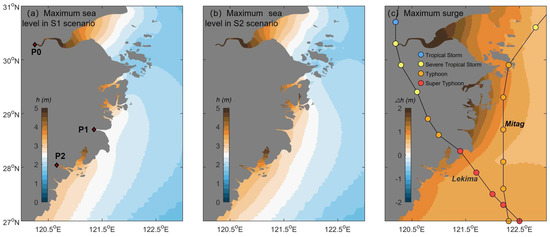
Figure 3.
Maximum sea water level in (a) S1 and (b) S2 scenario during the year 2019; (c) the maximum differences in sea water level between S1 and S2. The maximum values occurred during the typhoon periods. Results were extracted from hourly simulations. Typhoon tracks of Lekima and Mitag are shown in (c). Red rhombi in (a) indicate the analysis points P0–P2 in the following results.
The time series of water levels at the three ocean points (Qiantang Estuary, Jiaojiang Estuary, and Oujiang Estuary) connected to the investigated rivers (P0–P2 marked with red rhombi) are shown in Figure 4. In general, the daily mean water level in S1 and S2 successfully reflected both the semi-monthly (spring–neap) tide cycle and the seasonal signal (Figure 4a). Because of the width convergence and bed rising in the estuaries, the low water level was elevated, with the mean water level being higher than zero (gray dashed line), demonstrating that the default setting of the downstream boundary (constant 0 m) in CaMa-Flood is underestimated. Figure 4b illustrates that the detailed hourly water level fluctuation during the Typhoon Lekima period (indicated with two gray vertical lines in Figure 4a) was characterized by a semi-diurnal cycle with the largest range reaching around 6 m at P0. Wind during the typhoon period increased the water level to varying degrees and produced a significant water jump around its landfall. Notably, Lekima affected the area during the neap tide period; thus, the typhoon-induced elevated water level did not exceed the water level during the spring tide (Figure 4b,d,f). However, because Lekima’s effect lasted longer than one day, the daily average water level during the typhoon’s landfall reached the highest of the year. The determination of the downstream boundary, therefore, differs if a different time scale is used for the model simulation.
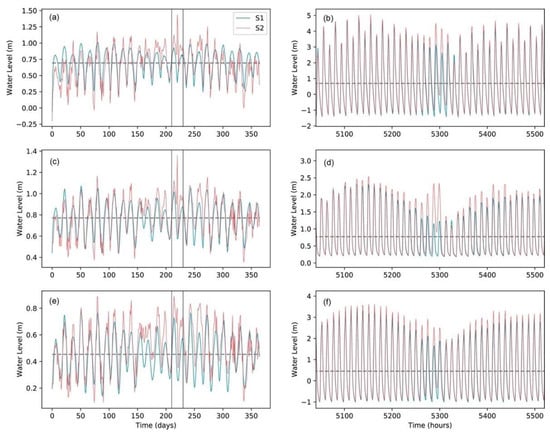
Figure 4.
Sea level at the head of three estuaries downstream of the selected rivers, (a,b), (c,d), and (e,f), representing the series in P0, P1, and P2, representatively. (a,c,e) Daily mean values and (b,d,f) hourly values. The time window used for the hourly time series was the Typhoon Lekima period (marked with the thin, gray, dashed line in the left panels). The horizontal dashed line is the mean value for S1.
The wind impact on the water level can be viewed clearly by the difference among scenarios in Figure 5. The wind impact on the water level showed seasonal variation with increases in summer because of the dominant landward direction, which reversed in the winter when the dominant wind direction turned seaward. An apparent increase in water level occurred during the landfall of Lekima (10–11 August), reaching 1 m at P0 and above 0.5 m at the other two estuaries. The storm surge impact was stronger at the hourly scale (Figure 5b) with the maximum impact reaching 3 m at P0 and 1 m at P1. Considering the typhoon path, Lekima landed near P1 and then moved northward to Hangzhou Bay (Figure 5b). Persistent landward wind effects and high convergence of Hangzhou Bay came with a longer period but a delayed peak at P0 compared to P1 and P2.

Figure 5.
Differences in seawater level between S1 and S2 at the head of three estuaries. (a) The daily value for the entirety of 2019 and (b) the hourly values during the Typhoon Lekima period (marked with the thin, gray, dashed lines in the left panels).
3.2. Flow Regimes in Rivers
3.2.1. Differences in Water Level
This subsection will present how the water level changes in rivers if the downstream water levels are integrated with CaMa-Flood. The investigated locations of the rivers (i.e., QR, JR, and OR) were the coastal unit catchments connecting to the ocean model grid (marked as p0–p2). Figure 6a–f show that the ocean forcing significantly increased the water level in the unit catchments by 1–2 m with different magnitude variations at the three locations. p0 is significantly affected by the downstream tides and surges, while the other two rivers are dominated by river floods, especially p1, where the variation in water level is strongly affected by the inflows from upstream. The fluctuation can be seen with periodic tides, while the variation is weaker than that caused by riverine floods.
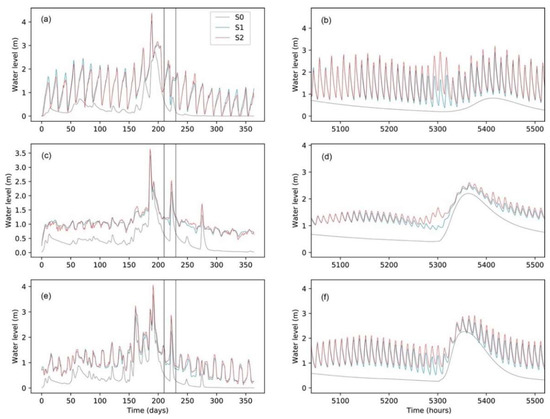
Figure 6.
Variations in the river water level at the three coastal unit catchments. (a,b), (c,d), and (e,f) represent the series in p0, p1, and p2 from top to bottom, respectively. (a,c,e) show the different scenarios for the daily scale, and (b,d,f) show the variations on the hourly scale.
When the effects of the tidal cycle were eliminated, the highest daily mean water level was found to occur in the plum rain season during July, rather than during the typhoon period (Figure 6a,c,e). The interactions between tides and fluvial floods increased the river water level to 2 m higher than the default setting at p0; however, the impact of storm surge was very limited (Figure 6a). For the stations of p1 and p2, the differences in peak water levels between S0, S1, and S2 during the flood events were minor (Figure 6c,e), indicating that the water level in the two southern rivers is still dominated by the river flow. In the detailed hourly scale (Figure 6b,d,f), the mean water level in the river channels was elevated to about 0.5–0.8 m higher than their boundary conditions, while the tidal ranges were significantly lowered to 25%. Comparisons of the water elevations in different scenarios indicate that the peak surge occurs 2–4 days earlier than the peak runoff. Therefore, surge impact and fluvial flood during Typhoon Lekima were not encountered. The fluvial floods were a delayed process driven by Lekima and post-Lekima rainfall.
Figure 7a,b illustrate the impact of tides on the river water level more clearly. In general, the fluctuation in the water level was highly correlated with that of the sea level, showing that the rivers are affected by the downstream water levels. A superposed tide on upstream river discharge increased the river water level variation compared to the ocean water levels at the daily scale (Figure 4) but weakened the fluctuation in river water level at the hourly scale as a buffering effect. Figure 7c illustrates that a stronger surge effect was captured in the river channel at p0 when the peak increase in the water level reached 1.5 m compared to 1.0 m in the ocean grid. At the hourly scale, the peak increase in water level was 1.5 m in the unit catchment but lower than 3.0 m at the downstream ocean grid (Figure 5b). However, the high water levels lasted longer than those of the downstream ocean grid (Figure 7d). These simulation results indicate that the longer periodic signal (i.e., the spring–neap cycle) is more easily transported in the river than the short periodic signal (i.e., tidal cycle). The surge signal tends to change from high frequency to low frequency as it propagates from ocean to river, thus leading to longer-lasting effects of waterlogging in the cities.
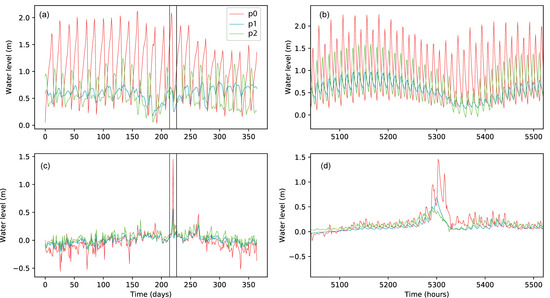
Figure 7.
Differences in the river water level at the three coastal unit catchments. (a,b) show the difference between S1 and S0 at the daily and hourly scales, respectively. (c,d) show the difference between S2 and S1 at the daily and hourly scales, respectively.
3.2.2. River Discharge
Tides and surges had minor impacts on the river discharge of the two southern mountainous rivers at the daily scale (Figure 8c,e), while the impact was not negligible in the QR during the dry season (Figure 8a). The peak discharges are caused by plum rain or typhoon-induced precipitation. The rainstorm during Typhoon Lekima resulted in ~2000 m3/s river discharge; however, the increased river discharge at the QR was not obvious compared to the other two rivers.
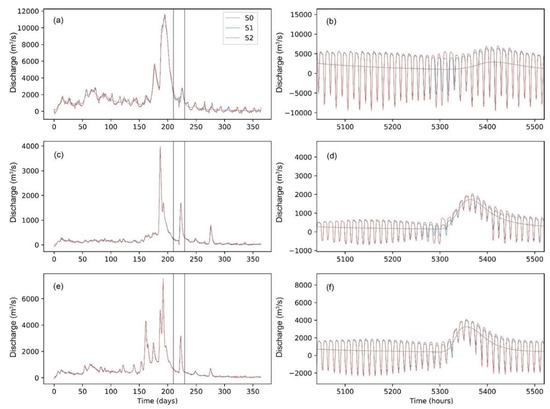
Figure 8.
Variability in the river discharge at the three coastal unit catchments. (a,b), (c,d), and (e,f) represent the series in p0, p1, and p2, respectively. (a,c,e) show the different scenarios on a daily scale, and (b,d,f) show the variations on an hourly scale.
The hourly river discharge in S1 and S2 was strongly affected by the backwater effect (negative discharge in Figure 8b,d,f), which was not found in the default CaMa-Flood model (S0, gray lines). Backwater magnitude is determined by the cycle of the tides (Figure 9a,b) and is affected by the wind. During Typhoon Lekima, the positive storm surge caused a significant increase in backwater of around 6000 m3/s in QR (Figure 9d), which induced a ~1000 m3/s decrease in daily discharge before the flow peaks arrived at the river outlet (Figure 9c). On the contrary, the negative surge effect enhanced the riverine flow peaks, resulting in an increment of 2000 m3/s discharge for a few hours (Figure 9d), but the impact was smoothed on the daily scale.
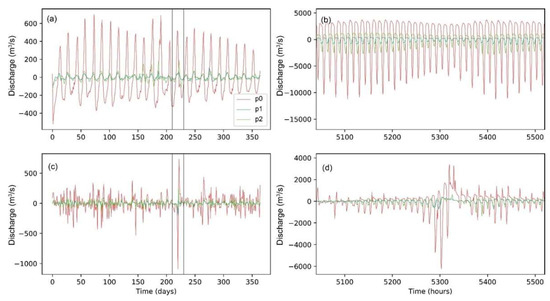
Figure 9.
Differences in the river discharge at the three coastal unit catchments. (a,b) show the difference between S0 and S1 at the daily and hourly scales, respectively. (c,d) show the difference between S2 and S1 at the daily and hourly scales, respectively.
3.3. Rating Curve (Discharge–Stage Curve)
The rating curve or discharge–stage relation (i.e., the relationship between discharge and water level) is an internal relation of topography, including the shapes of the river channel and slopes of the river section, but it can be affected by the boundary conditions from upstream or downstream calculation units. Figure 10 presents the rating curves at the three locations in three experimental scenarios. When the lower dynamic water boundary was not considered (S0), the rating curve was as simple as the linear or power-law relation (gray dots). However, in S1 and S2, when the lower water boundary was dynamic, the one–one relation was not valid. The same discharge can correspond to different water levels, while these are higher those of the S0. The variation in water level depends on how strong the backwater effect is or how much the impact of the lower boundary is propagated. Among the three locations, p1 showed the smallest impact, and the relation between discharge and water level remained the power-law relation, with a relatively narrow variation range due to the weak tidal range. p2 showed a moderate impact from the seawater and P0 showed the largest impact as the QR was strongly affected by the seawater.
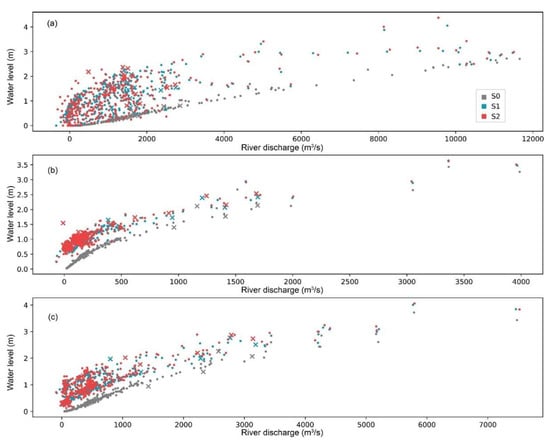
Figure 10.
The rating curve (discharge–stage relation) for daily time scale at three river channels. Those marked as points are normal periods, but those marked with a cross occurred during the Lekima typhoon period. (a–c) show the results at three locations: p0, p1, and p2.
Regarding p0, the variation in water level corresponding to an identical river discharge increased up to 2 m. The impact was strong and varied during the normal flow period (<2000 m3/s). The difference between S1 and S2 was smaller than that between S0 and S1, indicating that the backwater effect is mainly caused by tides. Storm surges can further increase the impact. When the downstream dynamic water level was integrated, the riverine water depth in the coastal area had stronger variation, which might have caused a sequential impact on the inundation area.
3.4. Flood Depth Variation Pattern and Inundation Area
Figure 11 illustrates the inundation extent with the maximum flood water depth on the daily scale in these three river basins during the period of Lekima (9–15 August). In S0, the maximum water level in different main rivers exceeded 3.0 m. Among these three river basins, the largest flood depth was found upstream of JR, while the most moderate and smallest were in the OR and QR, respectively. A few cities (e.g., Zhuji, Yuyao, Ningbo, and Wenzhou) suffered inundation. The area in the northern part of the Qiantang basin suffered larger inundation because of the low-lying coastal areas and the complex river networks; however, most of the inundation depths in cities were lower than 0.5 m.
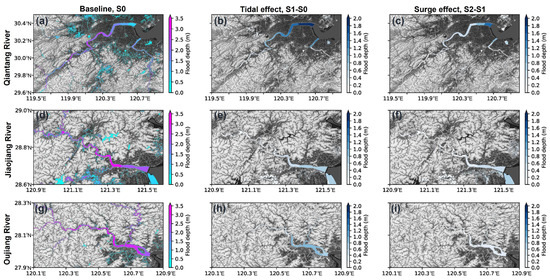
Figure 11.
Maximum inundation based on the daily mean flood depth in the basins of (a–c) QR, (d–f) JR, and (g–i) OR during Typhoon Lekima (9–15 August 2019). Subplots (b,e,h) represent the maximum flood depth differences between S1 and S0. Subplots (c,f,i) represent the maximum flood depth differences between S2 and S1.
The differences in flood water depth between S1 and S0 (Figure 11b,e,h) and between S2 and S1 (Figure 11c,f,i) indicate the tidal effect and surge effects on flood depth, respectively. Because of the highly convergent Hangzhou Bay, the tidal wave experiences strong distortion and amplification when propagating from the open sea to the QR; consequently, the flood of QR suffers the strongest effects from ocean forcing. Considering astronomical tide and surge effects, the maximum flood depth at the Qiantang Estuary can be elevated by 1.8 m and 1.2 m, respectively. Moreover, a 0.4 m increase in flood depth induced by tidal and surge effects could be traced 100 km and 77 km upstream, respectively, while the flood depth in the other two rivers was mainly dominated by fluvial floods. The effects of astronomical tides and storm surges were limited in the estuaries, with a maximum flood depth increase of less than 0.8 m and 1.0 m in the JR and OR, respectively. It could be found that the shapes of estuaries influence the spatial patterns of flood depth increases in the river basin. For the funnel-shaped estuaries, such as Qiantang Estuary and Jiaojiang Estuary, the flood increases (or ocean forcing effects) were gradually reduced from the mouth to the upstream river channel, while for the Oujiang Estuary, with two branches divided by an island, the maximum flood depth increases usually occurred in the middle branches rather than the mouth, where the backwater effect is much stronger.
3.5. Summary of the Comparison during Typhoon
Table 2 summarizes the daily flood regimes at the three river locations with the maximum values for each variable and the maximum increase between scenarios during the Typhoon Lekima period. In terms of the maximum riverine water level, tides increased the maximum water level from 0.80 m to 2.34 m in QR, with a maximum increase of 2.09 m, indicating that the maximum change does not occur at the peak. Indeed, the peak water level was dominated by tides before the riverine water level reached its peak (Figure 6a). The additional surge effect was smaller than the tide effect with a 1.45 m increase from the tide scenario, while the peak riverine water level only reached 2.48 m, with a 0.14 m increase from that of the peak in S1. For p1 (JR), which is less affected by the ocean, the increase in water level due to tides and surges was 0.70 m and 0.56 m, respectively, while the peak water level only increased by 0.31 m in total. A similar effect was seen for p2 (OR). We can conclude that although tides and surges can increase riverine flooding, the peak timing does not always perfectly match, leading to a weakened impact compared to a rough summing up of the extremes of different components (i.e., riverine flood, tide, and surge).

Table 2.
Quantitative comparison between different scenarios in terms of riverine water level, river discharge, and inundation at a daily scale. p0, p1, and p2 represent the points in Section 3.2 and the area indicated in Figure 10. Note that the values are the maximum value extracted during Typhoon Lekima (3–15 August). For each variable, the maximum value for each scenario (S0, S1, and S2), and the maximum difference between scenarios (S1-S0 and S2-S1) are listed to represent the tidal effect and surge effect, respectively. For the inundation area, the number represents the total area for each scenario and the area with increasing inundation depth.
Peak river discharge changes little, or even decreases, on a daily scale. The largest change in river discharge occurs right before the river discharge starts increasing (Figure 8a,c,e). This is because tides and surges can result in strong backwater when upstream river discharge is relatively small. Tides and surges do not add water volume and the impact will be counteracted or disappear at a daily scale, but the backwater effect leads to a rapid decrease in river discharge followed by a rapid increase in river discharge (Figure 9c).
The small total inundation area increased in the p0 area (Figure 11a) by 7.8% due to tides and surges, while 75.6% of the area (including rivers and inundated land) had a higher inundation depth. However, only 22.1% and 15.2% of the area experienced an increased inundation depth at p1 and p2 where the ocean effect was limited. Moreover, the total area of inundation indeed did not increase in these two regions.
4. Discussion
This study aimed to evaluate the impact of tides and surges on smaller rivers by coupling the river routing model (CaMa-Flood) with the surge model (MIKE21). Rather than emphasizing restricted validation of the water level and river discharge, we focused on the land–river–ocean interactions in coastal regions of Zhejiang Province and potential implications for flooding simulation in small river basins. The CaMa-Flood framework, integrating sea level boundaries, has previously been used to model compound floods, although the spatial resolution used in previous studies was 15 arcmins (0.25 degrees) [17,23], with an average river catchment area of around 600 km2. In this study, we investigated the application of 6 arcmins (0.1 degrees), which ensured an average river catchment area of around 100 km2. This improvement is especially important for small rivers and particularly for coastal rivers. Moreover, instead of using outputs from GSTR in previous implementations with a spatial resolution of 5 km nearshore [38], we established a new surge model for the eastern China coast with a maximum resolution of 60 m nearshore to provide the downstream boundary for CaMa-Flood. Based on these improvements, we gained more detailed results and deep insights into the small rivers. For example, we found that the ocean-effect-induced maximum daily flood depth increases are gradually reduced from the mouth to the upstream river channel in the funnel-shaped estuaries, while for the Oujiang Estuary, with two branches divided by an ait, the maximum increases usually occur in the middle branches rather than the mouth, where the backwater effect is much stronger. These results indicate the feasibility of using the framework (CaMa-Flood + MIKE) for applications requiring finer spatial resolution and involving smaller regions.
Results indicate that a significant ocean effect can be detected in the water level rather than the river discharge. Strong fluctuations in water level induced by tides and surges were captured on both hourly and daily scales (Figure 6, Figure 7 and Figure 10, Table 2). The tidal ranges and peak surges were significantly dampened as they propagate from the ocean to the river channel. However, the low-frequency spring–neap signal was not weakened, and the period of surge tended to be prolonged. This may infer that the low-frequency tidal wave signals propagate much more easily in the river channel. High-frequency signal attenuation in the river may be partly induced by model simplification, where the advection item is neglected, and the tide–surge–river interaction is markedly underestimated. The long-distance transport of low-frequency tidal wave signals has also been mentioned in previous studies. Yamazaki et al. [20] found that the spring–neap tidal signal (fortnightly tides) propagated inland more than 800 km upstream from the mouth of the Amazon River; however, the higher-frequency variations were limited around the river mouth. Hoitink and Jay [39] also indicated that large fortnightly tides are forced long waves with amplitudes that may increase beyond the point where astronomical tides cease and transport the storm surge hundreds of kilometers inland. In this view, the flooding or inundation mechanism differs for the inland and coastal areas. A low-frequency surge superimposed on the large spring–neap tide is expected to produce a significant waterlogging threat inland, while the estuarine and coastal areas face a high risk of rapid onset of flooding because the higher-frequency harmonics dominate tide–surge–river interaction and produce a larger surge [40].
Zhejiang Province is frequently attacked by typhoons; however, it is not a typical delta region like the Ganges–Brahmaputra–Meghna Delta, which was investigated by Ikeuchi et al. [21]. The short river length and small catchment usually produce a rapid onset of peak flow in rivers. Particularly in the southern mountainous river basins, the rapid rise and regression of river floods limit the propagation of tides and surges within the coastal area. Notably, Typhoon Lekima, highlighted in this study, swept the Zhejiang coast during the neap tides. The highest water level during the typhoon event did not exceed the absolute highest water level during the spring tide and occurred 2–4 days earlier than the peak river discharge at the river mouth. Therefore, investigations of compound events should have a higher spatial and temporal resolution to better represent the changes in tide, wind, and flow regimes. Rainstorms superposing the spring tide or matching the peak flood could produce more profound flooding and inundation.
Some uncertainties regarding the simulation could stem from biases in the ocean model (downstream boundary), runoff simulation (upper boundary), and the model structures or parameters of the routing model (CaMa-Flood). The surge model did not account for the wave effects, which usually have a minor (<5%) contribution to the surge [25] but might have a moderate impact on coastal flooding. The operation of reservoirs was not accounted for in CaMa-Flood. The QR is regulated by the large Xin’anjiang Reservoir in reality, which means the magnitude and timing of discharge peaks can be effectively regulated to prevent severe compound damages. For the current model framework, the surge model was one-way coupled with the river routing model, where water only propagates from the ocean to rivers. The effect of discharge variation on sea water level is ignored, which may in turn induce underestimation of the water level in the surge model. Although finer structured meshes (~10 km) are applied in CaMa-Flood, much higher spatial resolutions are suggested to resolve the smaller-scale topology near the coastline for the coastal backwaters [41,42], and regionally refined unstructured mesh can greatly improve the model performance in coastal areas [13]. Notably, this study focused on a fluvial flood superimposed on a coastal flood on a regional scale; thus, the compound event of rainfall and urban sewers was not considered. CaMa-Flood is driven by the generated runoff to the river system. The processes in the urban area, especially at the street level, are not represented. Urban flooding also requires a topography map with a much higher spatial resolution (up to a few meters), while we used a 90 m DEM map, which is not fine enough to achieve the desired result. The drainage system and precipitation at super high resolution are also needed in city inundation studies.
5. Conclusions
This study enables the one-way coupling of a surge model (based on MIKE) with a global hydrodynamic model (based on CaMa-Flood) to investigate the impacts of tides and surges on fluvial floods in different model scenarios (default constant water level, astronomical tides, and realistic dynamic water level). The higher spatial resolution of CaMa-Flood enables reaching a closer and more accurate downstream water boundary from the finer surge model.
Numerical results from the implementation of the model in Zhejiang Province indicate the semi-diurnal tides are elevated, with a mean water level higher than zero, because of the width convergence and bed rising of the estuaries. In addition, Typhoon Lekima led to an increase in water level by about 0.5–1 m on the daily scale and up to 1–3 m on the hourly scale nearshore. This oceanic forcing significantly increased the water level in the coastal catchments and alterations in river discharge through propagation. The riverine water level is more sensitive to the downstream boundary, while tides and surges have a minor impact on the daily maximum river discharge, but the one–one relation in the discharge–stage curve is no more valid. The oceanic impact varies in space, and it is much stronger in northern Zhejiang because of the lower landform, strong tidal distortion, and amplification, which also lead to higher risks of river flooding and inundation, while flow regimes and inundation are still dominated by river flooding in mountainous regions in southern Zhejiang.
With this integrated framework of a river routing model and surge model, it is possible to simulate the dynamics of river flow driven by precipitation but affected by sea level dynamics. Compared to studies on the input of seawater level at a certain frequency (e.g., 1-in-100-year return period based on historical observations or simulation), our framework can provide results for specific events and can further be applied for future projections.
Author Contributions
Conceptualization, H.L. and X.Z.; methodology, H.L. and X.Z.; software, H.L. and X.Z.; validation, H.L.; formal analysis, X.Z.; investigation, H.L.; resources, H.L.; data curation, X.Z.; writing—original draft preparation, H.L. and X.Z.; writing—review and editing, H.L. and X.Z.; visualization, H.L. and X.Z.; supervision, H.L.; project administration, H.L.; funding acquisition, H.L. and X.Z. All authors have read and agreed to the published version of the manuscript.
Funding
This research was funded by the Zhejiang Provincial Natural Science Foundation of China, grant number LY22E090011; the Scientific Research Fund of the Second Institute of Oceanography, MNR, grant number JG2015; the National Natural Science Foundation of China, grant number 41906151; the China Scholarship Council, grant number 202104180007; the Japan Society for the Promotion of Science (JSPS), grant number 20K22428; and the Belt and Road Special Foundation of the State Key Laboratory of Hydrology-Water Resources and Hydraulic Engineering, grant number 2021491111.
Data Availability Statement
The CaMa-Flood model with dynamic downstream boundaries can be accessible at https://github.com/global-hydrodynamics/CaMa-Flood_v4/tree/release_v4.02 (accessed on 12 November 2022). The ERA5 dataset can be accessible at https://cds.climate.copernicus.eu/ (accessed on 12 November 2022).
Acknowledgments
We are sincerely grateful to the reviewers and academic editor for their constructive comments. We thank Dai Yamazaki, Hiroaki Ikeuchi and Dirk Eilander for their contributions in model development. The simulations were conducted at the Clusters in the Global Hydrodynamics Lab, the University of Tokyo.
Conflicts of Interest
The authors declare no conflict of interest.
References
- Tanoue, M.; Hirabayashi, Y.; Ikeuchi, H. Global-scale river flood vulnerability in the last 50 years. Sci. Rep. 2016, 6, 36021. [Google Scholar] [CrossRef] [PubMed]
- Vitousek, S.; Barnard, P.L.; Fletcher, C.H.; Frazer, N.; Erikson, L.; Storlazzi, C.D. Doubling of coastal flooding frequency within decades due to sea-level rise. Sci. Rep. 2017, 7, 1399. [Google Scholar] [CrossRef]
- Woodruff, J.D.; Irish, J.L.; Camargo, S.J. Coastal flooding by tropical cyclones and sea-level rise. Nature 2013, 504, 44–52. [Google Scholar] [CrossRef] [PubMed]
- Kettner, A.J.; Brakenridge, G.R.; Schumann, G.J.; Shen, X. DFO—Flood Observatory. In Earth Observation for Flood Applications; Elsevier Ltd.: Amsterdam, The Netherlands, 2021. [Google Scholar]
- Bermudez, M.; Farfan, J.F.; Willems, P.; Cea, L. Assessing the effects of climate change on compound flooding in coastal river areas. Water Resour. Res. 2021, 57, e2020WR029321. [Google Scholar] [CrossRef]
- Gori, A.; Lin, N.; Xi, D. Tropical cyclone compound flood hazard assessment: From investigating drivers to quantifying extreme water levels. Earth’s Future 2020, 8, e2020EF001660. [Google Scholar] [CrossRef]
- Valle-Levinson, A.; Olabarrieta, M.; Heilman, L. Compound flooding in Houston-Galveston Bay during Hurricane Harvey. Sci. Total Environ. 2020, 747, 141272. [Google Scholar] [CrossRef]
- Cheung, K.F.; Phadke, A.C.; Wei, Y.; Rojas, R.; Douyere, Y.J.M.; Martino, C.D.; Houston, S.H.; Liu, P.L.F.; Lynett, P.J.; Dodd, N.; et al. Modeling of storm-induced coastal flooding for emergency management. Ocean Eng. 2003, 30, 1353–1386. [Google Scholar] [CrossRef]
- Didier, D.; Bandet, M.; Bernatchez, P.; Dumont, D. Modelling Coastal Flood Propagation under Sea Level Rise: A Case Study in Maria, Eastern Canada. Geosciences 2019, 9, 76. [Google Scholar] [CrossRef]
- Hsiao, S.; Chiang, W.; Jang, J.; Wu, H.; Lu, W.; Chen, W.; Wu, Y. Flood risk influenced by the compound effect of storm surge and rainfall under climate change for low-lying coastal areas. Sci. Total Environ. 2021, 764, 144439. [Google Scholar] [CrossRef]
- Tellman, B.; Sullivan, J.A.; Kuhn, C.; Kettner, A.J.; Doyle, C.S.; Brakenridge, G.R.; Erickson, T.A.; Slayback, D.A. Satellite imaging reveals increased proportion of population exposed to floods. Nature 2021, 596, 80–86. [Google Scholar] [CrossRef]
- Cao, W.; Zhou, Y.; Guneralp, B.; Li, X.; Zhao, K.; Zhang, H. Increasing global urban exposure to flooding: An analysis of long-term annual dynamics. Sci. Total Environ. 2022, 817, 153012. [Google Scholar] [CrossRef] [PubMed]
- Feng, D.; Tan, Z.; Engwirda, D.; Liao, C.; Xu, D.; Bisht, G.; Zhou, T.; Li, H.-Y.; Leung, L.R. Investigating coastal backwater effects and flooding in the coastal zone using a global river transport model on an unstructured mesh. Hydrol. Earth Syst. Sci. 2022, 26, 5473–5491. [Google Scholar] [CrossRef]
- Sampurno, J.; Vallaeys, V.; Ardianto, R.; Hanert, E. Modeling interactions between tides, storm surges, and river discharges in the Kapuas River delta. Biogeosciences 2022, 19, 2741–2757. [Google Scholar] [CrossRef]
- Yang, J.; Yan, F.; Chen, M. Effects of sea level rise on storm surges in the south Yellow Sea: A case study of Typhoon Muifa. Cont. Shelf Res. 2021, 215, 104346. [Google Scholar] [CrossRef]
- Hasan Tanim, A.; Goharian, E. Developing a hybrid modeling and multivariate analysis framework for storm surge and runoff interactions in urban coastal flooding. J. Hydrol. 2021, 595, 125670. [Google Scholar] [CrossRef]
- Ikeuchi, H.; Hirabayashi, Y.; Yamazaki, D.; Muis, S.; Ward, P.J.; Winsemius, H.C.; Verlaan, M.; Kanae, S. Compound simulation of fluvial floods and storm surges in a global coupled river-coast flood model: Model development and its application to 2007 Cyclone Sidr in Bangladesh. J. Adv. Model. Earth Syst. 2017, 9, 1847–1862. [Google Scholar] [CrossRef]
- Wilson, M.; Bates, P.; Forsberg, B.; Horritt, M.; Melack, J.; Frappart, F.; Famiglietti, J. Modeling large-scale inundation of Amazonian seasonally flooded wetlands. Geophys. Res. Lett. 2007, 34, L15404. [Google Scholar] [CrossRef]
- Yamazaki, D.; Kanae, S.; Kim, H.; Oki, T. A physically based description of floodplain inundation dynamics in a global river routing model. Water Resour. Res. 2011, 47, W4501. [Google Scholar] [CrossRef]
- Yamazaki, D.; Lee, H.; Alsdorf, D.E.; Dutra, E.; Kim, H.; Kanae, S.; Oki, T. Analysis of the water level dynamics simulated by a global river model A case study in the Amazon River. Water Resour. Res. 2012, 48, W9508. [Google Scholar] [CrossRef]
- Ikeuchi, H.; Hirabayashi, Y.; Yamazaki, D.; Kiguchi, M.; Koirala, S.; Nagano, T.; Kotera, A.; Kanae, S. Modeling complex flow dynamics of fluvial floods exacerbated by sea level rise in the Ganges-Brahmaputra-Meghna Delta. Environ. Res. Lett. 2015, 10, 124011. [Google Scholar] [CrossRef]
- Kernkamp, H.W.J.; Van Dam, A.; Stelling, G.S.; De Goede, E.D. Efficient scheme for the shallow water equations on unstructured grids with application to the Continental Shelf. Ocean Dynam. 2011, 61, 1175–1188. [Google Scholar] [CrossRef]
- Eilander, D.; Couasnon, A.; Ikeuchi, H.; Muis, S.; Yamazaki, D.; Winsemius, H.C.; Ward, P.J. The effect of surge on riverine flood hazard and impact in deltas globally. Environ. Res. Lett. 2020, 15, 104007. [Google Scholar] [CrossRef]
- Eilander, D.; Couasnon, A.; Leijnse, T.; Ikeuchi, H.; Yamazaki, D.; Muis, S.; Winsemius, H.C.; Ward, P.J. A globally-applicable framework for compound flood hazard modeling. EGUsphere 2022, 1–40. [Google Scholar] [CrossRef]
- Li, L.; Li, Z.; He, Z.; Yu, Z.; Ren, Y. Investigation of Storm Tides Induced by Super Typhoon in Macro-Tidal Hangzhou Bay. Front. Mar. Sci. 2022, 9, 890285. [Google Scholar] [CrossRef]
- Du, M.; Hou, Y.; Qi, P.; Wang, K. The impact of different historical typhoon tracks on storm surge: A case study of Zhejiang, China. J. Marine Syst. 2020, 206, 103318. [Google Scholar] [CrossRef]
- Lu, Y.; Ren, F.; Zhu, W. Risk zoning of typhoon disasters in Zhejiang Province, China. Nat. Hazard. Earth Sys. 2018, 18, 2921–2932. [Google Scholar] [CrossRef]
- Bates, P.D.; De Roo, A.P.J. A simple raster-based model for flood inundation simulation. J. Hydrol. 2000, 236, 54–77. [Google Scholar] [CrossRef]
- Yamazaki, D.; O’Loughlin, F.; Trigg, M.A.; Miller, Z.F.; Pavelsky, T.M.; Bates, P.D. Development of the Global Width Database for Large Rivers. Water Resour. Res. 2014, 50, 3467–3480. [Google Scholar] [CrossRef]
- Carroll, M.L.; Townshend, J.R.; DiMiceli, C.M.; Noojipady, P.; Sohlberg, R.A. A new global raster water mask at 250 m resolution. Int. J. Digit. Earth 2009, 2, 291–308. [Google Scholar] [CrossRef]
- Carabajal, C.C.; Harding, D.J. ICESat validation of SRTM C-band digital elevation models. Geophys. Res. Lett. 2005, 32, L22S01. [Google Scholar] [CrossRef]
- Hansen, M.C.; Potapov, P.V.; Moore, R.; Hancher, M.; Turubanova, S.A.; Tyukavina, A.; Thau, D.; Stehman, S.V.; Goetz, S.J.; Loveland, T.R.; et al. High-resolution global maps of 21st-century forest cover change. Science 2013, 342, 850–853. [Google Scholar] [CrossRef] [PubMed]
- Simard, M.; Pinto, N.; Fisher, J.B.; Baccini, A. Mapping forest canopy height globally with spaceborne lidar. J. Geophys. Res. Biogeo. 2011, 116, G04021. [Google Scholar] [CrossRef]
- Yamazaki, D.; Ikeshima, D.; Tawatari, R.; Yamaguchi, T.; O’Loughlin, F.; Neal, J.C.; Sampson, C.C.; Kanae, S.; Bates, P.D. A high-accuracy map of global terrain elevations. Geophys. Res. Lett. 2017, 44, 5844–5853. [Google Scholar] [CrossRef]
- Hersbach, H.; Bell, B.; Berrisford, P.; Hirahara, S.; Horányi, A.; Muñoz Sabater, J.; Nicolas, J.; Peubey, C.; Radu, R.; Schepers, D.; et al. The ERA5 global reanalysis. Q. J. Roy. Meteor. Soc. 2020, 146, 1999–2049. [Google Scholar] [CrossRef]
- Liang, H.; Chen, W.; Liu, W.; Cai, T.; Wang, X.; Xia, X. Effects of Sea Level Rise on Tidal Dynamics in Macrotidal Hangzhou Bay. J. Mar. Sci. Eng. 2022, 10, 964. [Google Scholar] [CrossRef]
- Zhou, C.; Chen, P.; Yang, S.; Zheng, F.; Yu, H.; Tang, J.; Lu, Y.; Chen, G.; Lu, X.; Zhang, X.; et al. The impact of Typhoon Lekima (2019) on East China: A postevent survey in Wenzhou City and Taizhou City. Front. Earth Sci. 2022, 16, 109–120. [Google Scholar] [CrossRef]
- Muis, S.; Verlaan, M.; Winsemius, H.C.; Aerts, J.C.J.H.; Ward, P.J. A global reanalysis of storm surges and extreme sea levels. Nat. Commun. 2016, 7, 11969. [Google Scholar] [CrossRef]
- Hoitink, A.J.F.; Jay, D.A. Tidal river dynamics; implications for deltas. Rev. Geophys. 2016, 54, 240–272. [Google Scholar] [CrossRef]
- Spicer, P.; Huguenard, K.; Ross, L.; Rickard, L.N. High-frequency tide-surge-river interaction in estuaries; causes and implications for coastal flooding. J. Geophys. Res. Ocean. 2019, 124, 9517–9530. [Google Scholar] [CrossRef]
- Bates, P.D.; Quinn, N.; Sampson, C.; Smith, A.; Wing, O.; Sosa, J.; Savage, J.; Olcese, G.; Neal, J.; Schumann, G.; et al. Combined Modeling of US Fluvial, Pluvial, and Coastal Flood Hazard Under Current and Future Climates. Water Resour. Res. 2021, 57, e2020WR028673. [Google Scholar] [CrossRef]
- Trigg, M.A.; Birch, C.E.; Neal, J.C.; Bates, P.D.; Smith, A.; Sampson, C.C.; Yamazaki, D.; Hirabayashi, Y.; Pappenberger, F.; Dutra, E.; et al. The credibility challenge for global fluvial flood risk analysis. Environ. Res. Lett. 2016, 11, 94014. [Google Scholar] [CrossRef]
Publisher’s Note: MDPI stays neutral with regard to jurisdictional claims in published maps and institutional affiliations. |
© 2022 by the authors. Licensee MDPI, Basel, Switzerland. This article is an open access article distributed under the terms and conditions of the Creative Commons Attribution (CC BY) license (https://creativecommons.org/licenses/by/4.0/).