Abstract
Azimuth multichannel (AMC) technology is one of the mainstream technical approaches to realize high-resolution wide-swath (HRWS) imaging. It has been successfully applied to several synthetic aperture radar (SAR) satellites in orbit. However, the inevitable imbalance between channels can seriously affect the azimuth reconstruction spectrum, introducing ghost targets into the final imaging results and degrading the SAR image quality. In order to address this issue, this paper proposes a channel imbalance estimation method based on minimizing the sum of the sub-band norm (MSSBN) for the reconstructed azimuth spectrum. First, the amplitude imbalance is calibrated in the range-Doppler domain. Then, the echo in each channel with phase imbalances is reconstructed by filters separately and converted to the range-Doppler domain. Finally, the global optimization algorithm is used to find the phase error of each channel so that the reconstructed postcompensation spectrum has the smallest sub-band spectrum norm sum. By two-dimensional blocking, this method can also estimate the space-varying phase imbalance in the range dimension and the time-varying phase imbalance in the azimuth dimension. Experimental results using simulated and actual AMC SAR data from the GF-3 system validate the proposed algorithm’s high estimation accuracy and excellent computational efficiency.
1. Introduction
Synthetic aperture radar (SAR) is an all-day, all-weather active microwave remote sensing system, which has become an indispensable means for Earth observation [1]. High resolution can provide finer feature information, and wide imaging can provide a broader observation scene. Therefore, high-resolution wide-swath (HRWS) imaging is a significant development direction for a modern SAR system [2,3,4,5,6,7,8]. However, the conventional SAR system cannot realize both azimuth high-resolution and range wide-swath imaging due to the minimum antenna area constraint [4,9,10,11,12]. At present, the basic working modes of SAR systems, such as ScanSAR [13], Spotlight SAR [14], TOPS [15], and Mosaic [16], achieve a compromise between azimuth resolution and range swath by allocating and adjusting the synthetic illumination time of ground scene. However, they cannot fundamentally solve the contradiction between imaging swath and resolution. The displaced phase center multiple azimuth beams (DPC-MAB) SAR system [9,10,12,17,18] arranges multiple phase centers along the azimuth direction with equal spacing to receive scene echoes, which equivalently increases the sampling rate in time dimension by increasing sampling rates in the spatial dimension. Then, the alias-free full azimuth spectrum is reconstructed by the digital beamforming (DBF) technique to alleviate constraints of azimuth resolution and range swath on pulse repetition frequency (PRF) [2,3,4,6,12,17]. The DPC-MAB technique has become one of the effective means for realizing HRWS SAR imaging and has been successfully deployed on TerraSAR-X [19], RADARSAT-2 [20], ALOS-2 [21], GF-3 [22,23], LT-1 [24], and other azimuth multichannel (AMC) SAR systems.
Theoretically, the HRWS SAR image can be well focused after AMC signal reconstruction. However, due to error factors, such as temperature variations, antenna radiation pattern difference, and undesirable receiver components, there are often inconsistencies in amplitude, phase, range sampling time, and antenna phase center locations between channels. These imbalances among channels, especially amplitude and phase inconsistencies, can significantly reduce the suppression effect of spectrum ambiguity in subsequent reconstruction processing algorithms, which, in turn, introduces virtual targets on the final image and seriously degrades the quality of SAR imaging. Therefore, channel imbalance consistency calibration is a crucial step in AMC SAR data processing [19,25]. Amplitude error can be accurately corrected by the channel balancing technique [26]. Generally speaking, range sampling time imbalance (RSTI) can be accurately measured and compensated by an internal calibration system. Meanwhile, the azimuth time-domain cross-correlation (ATC) method can also effectively estimate the RSTI from echo data [27]. For the spaceborne SAR system, the position error of the antenna phase center is tiny, the position error along the track can be ignored, and the radial position error can be regarded as a tiny phase error [28,29,30]. Thus, the main task of channel consistency calibration is the efficient estimation and calibration of phase imbalance between channels.
For the phase imbalance problem between channels, the available channel error calibration methods are divided into two categories in this paper: processing for signal data and processing in the image domain, both of which have various advantages and disadvantages. The approaches based on signal data processing are mainly the following: The ATC method is operationally efficient in estimating the RSTI and phase error [27]. However, the system Doppler center frequency accuracy affects phase error estimation results in more. Although the signal subspace (SSP) method has more accurate estimation results [31], it needs eigen decomposition of the covariance matrix to obtain signal subspace and noise subspace, so it has much computation and is affected by the SNR of echo data. The minimum variance distortionless response (MVDR) method is also an accurate phase imbalance estimation method [32] but is affected by Doppler center frequency estimation accuracy. However, it has a lower computational complexity compared with the SSP method. Then, methods that perform processing in the image domain, including the image weighted minimum entropy (WME) method [33,34], the image least -norm (LLN) method [35], and the maximum normalized image sharpness (MNIS) method [30], are both characterized by high estimation accuracy and robustness, but generally have high computational complexity.
Although existing methods have made significant progress, reducing computational complexity while estimating channel phase errors accurately and robustly remains a challenge due to the complexity of a scene and the need for fast processing in real time. In order to address this challenge, a novel method of minimizing the sum of sub-band norms (MSSBN) for reconstruction azimuth spectrums is proposed to estimate phase errors of the AMC SAR system. Specifically, the reconstructed azimuth spectrum by the DBF technique has the smallest sum of sub-band spectrum norm when channel phases are consistent. In this paper, by modeling phase imbalance estimation as an optimization problem, typical global optimization algorithms, such as optima quest of nonlinear program (OQNLP) [36] and particle swarm algorithms (PSO) [36] can be used to find phase imbalances by the MSSBN method. Meanwhile, the proposed algorithm limits the influence of range samples by range pulse compression, and range-variation phase errors can be fitted by estimating the phase error at different sampling locations in the range direction. The MSSBN method does not require more spatial degrees of freedom for phase error estimation and has a broader range of application scenarios than the SSP method. Meanwhile, the MSSBN method has a higher estimation accuracy than the ATC method and is unaffected by the Doppler center frequency estimation accuracy. Since there is no need to image the reconstructed signal data of each channel, the MSSBN method has higher computational efficiency than the LLN method. The phase information of all scenes is converted to the same Doppler bandwidth using pulse compression and azimuth fast Fourier transform (FFT), and computational efficiency can be further improved by downsampling for azimuth spectrum without degrading estimation accuracy.
The remainder of this paper is organized as follows: Section 2 introduces the signal model and reconstruction algorithm of the AMC SAR system, then analyzes the effect of channel imbalance and performs precompensation for phase error estimation. Section 3 details the derivation of the proposed algorithm. Section 4 reports the simulation and actual experimental results with a discussion. Then, conclusions are provided in Section 5.
2. Material
2.1. Signal Model
The AMC SAR system sets the azimuth antenna as a transmitting subaperture and multiple receiving subapertures. Multiple echo signals can be obtained by transmitting a chirp signal once in a pulse repetition time (PRT) [3]. The echo signals received by subchannels simultaneously can be reconstructed to an azimuth signal sampled sequentially in the time dimension after reconstruction by a filter. The multichannel technique reduces the PRF required by azimuth resolution to times of channel number. It compensates for the lack of sampling in the time dimension by increasing the spatial dimension, thus extending the swath while ensuring that azimuth resolution remains unchanged. Figure 1a shows the imaging geometry of the AMC SAR system, with red boxes indicating transmit and receive subapertures, all other boxes indicating receive subapertures, and a circle indicating the effective phase center (EPC).
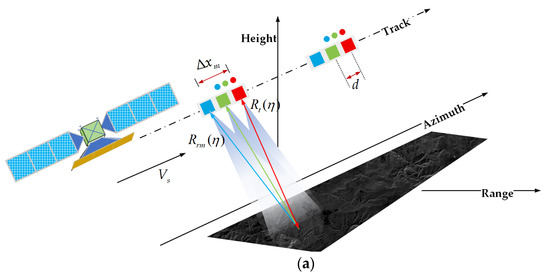
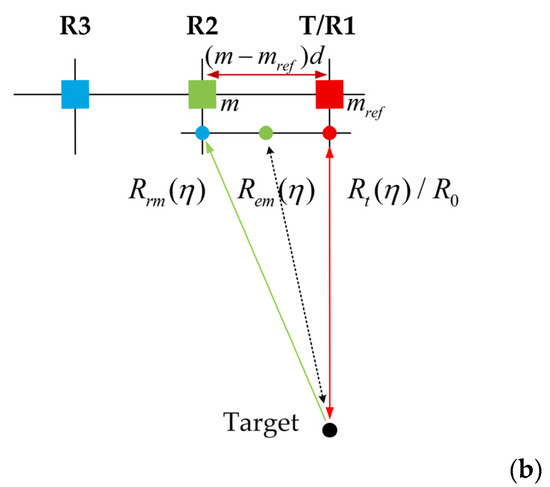
Figure 1.
Illustration of the AMC SAR system. (a) Imaging geometry of AMC SAR; (b) EPC distribution.
For an AMC SAR system, as shown in Figure 1a, the separation between adjacent two channels is . According to the principle, the distance between the and channels (reference channel) is , where denotes the number of channels. , , and represent the orbital flight speed, equivalent radar speed, and azimuth slow time of the AMC SAR platform. As shown in Figure 1b, taking the first channel of the antenna as the transmitting channel, the distance from the ground target to the EPC and propagation history of the echo signal received by the channel can be expressed, respectively, as
where donates the nearest slant range between the platform and ground target. According to Equation (1), the azimuth time dimension echo signal of the EPC in self-transmit self-received mode can be expressed as
where , , and denote the azimuth center time, wavelength, and azimuth signal envelop, respectively. The difference between propagation histories of echo signals received by the channel and the EPC channel is after Taylor expansion of Equations (1) and (2), respectively. Therefore, the azimuth echo signal of the channel can be expressed as
The azimuth spectrum of the reference channel is denoted by . Assuming that its spectrum is band-limited, the PRF design of an azimuth multichannel SAR system satisfies , where is the bandwidth of the azimuth unambiguity spectrum. Therefore, according to the “stop-go-stop” hypothesis, the echo signal is sampled in the azimuth direction at a PRF much smaller than the Doppler bandwidth, and the number of sampling points in the azimuth direction of each channel cannot satisfy the Nyquist sampling theorem, so it works in the sub-Nyquist sampling state. The signal sampled at each frequency point is the superposition of a signal with the frequency with signals whose frequency is apart from with an integer multiple of PRF interval. The alias-free full azimuth spectrum of the reference channel is denoted by , whose sampling frequency is , and represents the Doppler ambiguity numbers. The azimuth spectrum is equally divided into successive sub-bands of the length PRF. Therefore, the signal of the reference channel in the range-Doppler domain is aliased as
where denotes the azimuth sampling frequency range, belongs to the first sub-band, and for convenience of subsequent discussion, is used to represent the frequency variable of the sub-band. The EPC of the reference channel coincides with the reference channel phase center. Therefore, by combining Equations (4) and (5), the range-Doppler domain aliased signal of each channel is derived as
where and , respectively, represent an azimuth time delay and a constant phase shift of the channel relative to the reference channel, which can be derived as
Therefore, signal reconstruction must recover the complete unaliased spectrum for the subsequent SAR imaging operation from the aliased azimuth signals.
2.2. Signal Reconstruction
A multichannel data reconstruction theory is mathematically given for the problem of nonuniform sampling of band-limited signals [3]. A signal with the bandwidth is passed through pre-filters and sampled at a sampling rate of . Then the channel sampled signal can then be recovered to the original lowpass signal by designing a suitable reconstruction filter.
Comparing Equations (5) and (6), the azimuth spectrum of the channel can be obtained from a single-channel SAR spectrum by time-shifting and multiplying by a constant phase term. The last two terms of Equation (6) are transfer functions of the multichannel system, which can be recovered from the original equivalent single-channel signal by building a digital reconstruction filter. In a matrix form, the sampled signals of channels can be reformulated as
with
where the superscript represents the matrix transpose operation, and denotes the operator that rewrites a vector into a diagonal matrix with the vector as a diagonal element. is a diagonal matrix dependent on the Doppler frequency, and is a constant matrix independent of the Doppler frequency. forms the transfer function of the multi-channel SAR system.
From Equation (12), it can be seen that the main diagonal elements of the matrix are in complex exponential form. Hence, the matrix is invertible, and its inverse matrix is its conjugate transpose the matrix . Both sides of Equation (10) are multiplied by simultaneously on the left to obtain a new system transfer equation as
The signal reconstruction process is an inverse process shown in the above equation, where can be considered as a new system transfer function independent of the Doppler frequency, and let ; then Equation (15) can be expressed as
From the matrix, it is known that its inverse the matrix is also a constant matrix independent of the Doppler frequency. By left multiplying the matrix on both sides of Equation (16) simultaneously, the data reconstruction process of the multichannel SAR system can be expressed as
The aliased spectrum of each channel is recovered to the unaliased spectrum through a reconstruction filter . After rearranging each sub-band spectrum in the order of frequency, a full unaliased spectrum is obtained. The AMC SAR system lowers system PRF to achieve extensive bandwidth imaging in the range direction, uses signal reconstruction and spectrum rearrangement algorithms to increase PRF equivalently to solve the azimuth ambiguity problem, and then realizes HRWS imaging.
In order to introduce the phase imbalance estimation method proposed in this paper by the MSSBN, this section analyzes the effect of channel imbalance on the Doppler spectrum and precalibrates the amplitude imbalance and RSTI.
2.3. Channel Imbalance Analysis
Ideally, the effect of channel imbalance should not be considered in the reconstruction of multichannel signals. However, in an actual operation of a spaceborne AMC SAR system, under the influence of multiple factors [37], such as manufacturing process, system implementation mode, and operating environment, relative errors will inevitably appear between echoes of each channel. The change in antenna radiation characteristics will lead to other deviations in amplitude and phase of echo signals received by each channel. The change in the position of the antenna subaperture along the track will lead to additional phase imbalances. Moreover, the RSTI is caused by the inconsistent transmission characteristics of each channel receiver. Therefore, the channel mismatch of the system needs to be preprocessed before signal reconstruction. First, the influence caused by various imbalances is analyzed, and the channel imbalance model is established. Since the attitude error of the antenna [38] varies with azimuth time, the actual phase imbalance is time varying in azimuth and space varying in range. However, in an image, the temporal and spatial variation of the phase imbalance is minimal, which has little impact on the product quality. This paper considers the phase imbalance of the channel to be a constant in an image. Consequently, the channel imbalance is as
where , and represent the range fast time, amplitude imbalance, RSTI, antenna location imbalance, and phase imbalance of other channels relative to the reference channel, respectively.
As shown in Section 2.2, the signal reconstruction filter matrix of the AMC SAR system is designed by inverting the transfer function matrix of the system. However, when the imbalances mentioned above are introduced into the echo signal of each channel, the reconstruction filter becomes mismatched with the echo signal. Using mismatched reconstruction filters to process the spectrum of each channel will introduce other sub-band spectrum components in the reconstruction process of each sub-band spectrum, resulting in aliasing of the reconstructed spectrum and, ultimately, leading to ghosts in the imaging results. Therefore, mismatch of the echo signal between channels is equivalent to mismatch of the reconstruction filter, which can be analyzed by studying the effect of channel errors on the reconstructed filter. The parameters of the AMC SAR system are shown in Table 1, and the influence of channel errors will be analyzed through simulation.

Table 1.
Simulation system parameters.
2.3.1. Influence of Amplitude Imbalance
The simulation parameters in Figure 2 are shown in Table 1 and Table 2. Figure 2 gives the effect of amplitude imbalance on the signal reconstruction of the AMC SAR system through simulation. From Figure 2a, it can be seen that when there is no amplitude imbalance, the reconstruction filter forms a deep null at the ambiguous frequency component, which can effectively suppress the ambiguous frequency component. When the amplitude imbalance exists in the channel, the null position of the reconstruction filter is shifted to both sides of the frequency point. At the same time, the shallower null depth introduces ambiguous spectrum energy, leading to the degradation of the reconstruction filter performance, which is consistent with the result in Figure 2b that the spectrum energy of reconstruction with error is higher than that of reconstruction without error.
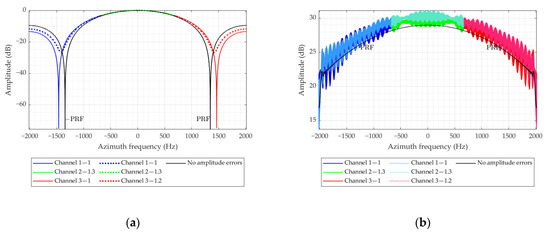
Figure 2.
Effect of channel amplitude imbalance. (a) Effect of channel amplitude imbalance on the reconstructed filter. The solid black line indicates the response of the reconstruction filter without amplitude error. The colored solid line indicates the reconstruction filter response with channel 2 set to 1.3 times the reference channel amplitude. The colored dashed lines indicate the reconstructed filter responses for channels 2 and 3 with 1.3 and 1.2 times the reference channel amplitude, respectively. (b) Effect of channel amplitude imbalance on the reconstructed spectrum.

Table 2.
Amplitude imbalance.
2.3.2. Influence of Phase Imbalance
The simulation parameters in Figure 3 are shown in Table 1 and Table 3. Figure 3a shows that when the channel phase imbalance is consistent, the filter can completely pass the spectrum at the target frequency while forming a very deep null at the aliasing frequency, thus effectively suppressing the ambiguous spectrum. When there is a phase error, although the frequency at the target spectrum can still be filtered, a phase error of just 0.2 rad causes the notch of the reconstructed filter at the ambiguous frequencies to become shallow rapidly. At the same time, the null position is related to the phase imbalance. With the same effect as the amplitude error, the reconstructed azimuth spectrum illustrated in Figure 3b appears to have severe aliasing, but the difference is that the degree of aliasing of each sub-band spectrum is different.
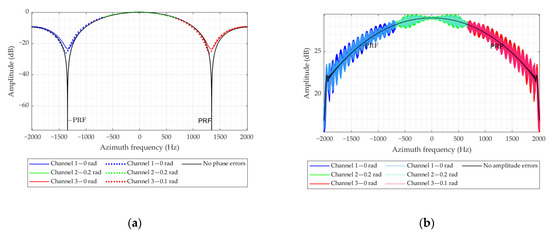
Figure 3.
Effect of channel phase imbalance. (a) Effect of channel phase imbalance on the reconstructed filter. Solid black line: reconstruction filter response without phase error. The colored solid line shows the reconstruction filter response with 0.2 radians set for channel 2. Colored dashed lines represent the reconstruction filter response for channels 2 and 3 with 0.2 and 0.1 radians, respectively. (b) Effect of channel phase imbalance on the reconstructed spectrum.

Table 3.
Phase imbalance.
2.3.3. Influence of RSTI
The RSTI may exist between channels due to imperfect alignment of electronics and satellite attitude. Due to the presence of the RSTI, range migration correction (RMC) cannot be performed perfectly, so the energy of a point target will be spread over two or more range bins, resulting in degraded imaging performance. There are two methods of the RSTI estimation and calibration: the accurate determination and calibration of the RSTI by an internal calibration system; the other uses the ATC method to effectively estimate the RSTI from echo data. Theoretically, the RSTI should not exceed half a sampling interval. For example, the RSTI of the GF-3 azimuth dual-channel SAR system is about 0.2 ns, which is much smaller than its sampling interval of 7.5 ns, and thus has a negligible impact on imaging [39].
2.3.4. Influence of Antenna Position Imbalance
The antenna position error due to antenna attitude can be divided into two parts: along-track antenna position error and radial antenna position error. The radial antenna position error can be equated to phase error and eliminated through phase error correction. As shown in Equation (19) [32], the phase variation caused by the position error of the along-track antenna is limited by the multichannel SAR azimuth resolution:
where and represent the antenna position error along track and azimuth resolution, and is much smaller than the azimuthal resolution . This makes the phase change caused by baseline error tend to be close to zero and can be neglected. Taking the GF-3 azimuth dual-channel SAR system as an example, the estimated along-track position error of the antenna is about 8 cm, much smaller than the azimuth subaperture antenna length of 3.75 m, and its effect on the image is also negligible.
Therefore, the AMC SAR system is mainly affected by amplitude error and phase error. Furthermore, there are already efficient amplitude error and RSTI correction methods, so this paper divides channel imbalance calibration into two independent parts: precorrection of amplitude error and RSTI, followed by the estimation and calibration of phase error by the MSSBN method proposed in this paper.
2.4. Precalibration Processing
This section calibrates the amplitude imbalance and RSTI between channels first. Generally, the first channel is used as the reference channel, and the amplitude imbalance is calibrated in the range-Doppler domain using the channel balancing technique [26]. The amplitude imbalance is estimated as
where and denote the statistical averaging operations in the azimuth and range, respectively. Then, the signal after amplitude calibration is expressed by the following equation:
After the channels are calibrated for amplitude errors, the RSTI is estimated according to the ATC technique. As seen in Equation (22), inconsistent phase information is obtained by the intercorrelation operation of each channel echo data with the reference channel echo data:
where denotes the azimuth inverse fast Fourier transform (IFFT) of the antenna’s two-way power pattern [27]. Thus, it can be seen that the phase is a linear function of the range frequency with the slope . Therefore, the RSTI can be obtained by differentiating the phase of Equation (22) with respect to :
where denotes the operation of finding the phase of a complex number. Finally, the echo signal of each channel after RSTI calibration is represented as
3. Method
When the phase between channels is consistent, the sum of the norm of reconstructed spectrum sub-bands has a minimum value, so the proposed method will be proven and derived based on the subadditivity of the linear normed space [40] in this section. According to the analysis in Section 2, the phase imbalance is treated as a constant error in this paper. As is known, the phase imbalance between channels is a relative quantity, so the first channel is set as the reference channel, and the phase error of the channel is set as , where . Therefore, the phase error matrix is shown as
According to the Krieger reconstruction matrix [3], the echo signal only with a phase error of each channel is reconstructed as
where ,, and denote the reconstructed spectrum with phase error, the aliased echo with phase error for each channel, and the full alias-free spectrum, respectively. As shown in the second equation of Equation (26), the phase error can be considered a part of the filter matrix or echo signal. The matrix related to the Doppler frequency does not have an effect on the analysis.
The reconstructed filter matrix and transmission matrix generate a weighted matrix , and the complete aliasing-free spectrum is mapped to the reconstructed spectrum by . At the same time, it can be seen from Equation (26) that has nothing to do with the Doppler frequency but is only related to the reconstruction filter, the system transmission matrix, and channel errors. Therefore, this paper first analyzes the weighted matrix. The phase errors from to were assigned to channel 2 and channel 3, respectively, to obtain the reconstruction filter with errors, and the weighted matrix with errors was obtained by matrix multiplication.
The simulation parameters in Figure 4 are from Table 1, which shows the schematic diagram of each component of the weighted matrix affected by the channel phase error. As can be seen from the figure, when the phase error of the channel is consistent with that of the reference channel, that is, when the phase error in the figure is simultaneously 0, the diagonal elements of the weighted matrix all reach the maximum value 1, and other elements reach the minimum value 0. However, the reconstruction filter is known in the actual channel phase error estimation. In contrast, the phase error is an unknown quantity present in the echo, and the phase error cannot be estimated directly by the filter matrix. According to Perceval’s theorem [1], when the power of the ambiguous spectrum is minimized, an alias-free reconstructed spectrum can be obtained [41]. However, the ambiguous spectrum cannot be separated from the signal spectrum, so the ambiguous spectrum is considered together with the signal spectrum in this paper. Fortunately, the sub-band of the reconstructed spectrum is obtained by the weighted summation of the sub-band of the aliasing-free full spectrum, so it is necessary to add and analyze the corresponding elements of the weight matrix.
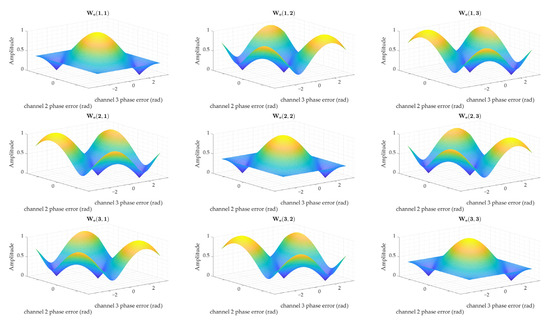
Figure 4.
Weighted matrices affected by different phase errors.
The simulation parameters in Figure 5 are shown in Table 1. It can be seen from Figure 5 that the shift in the position of the reconstructed filter null caused by phase imbalance leads to a change in the amplitude of each spectrum. However, a minimum value exists for their sum of the norm, and the minimum value is obtained when there is no channel phase imbalance. The spectrum of different sub-bands is different, so this paper will mathematically derive the relationship between the sub-band spectrum norm (SBN) and the channel phase imbalance.
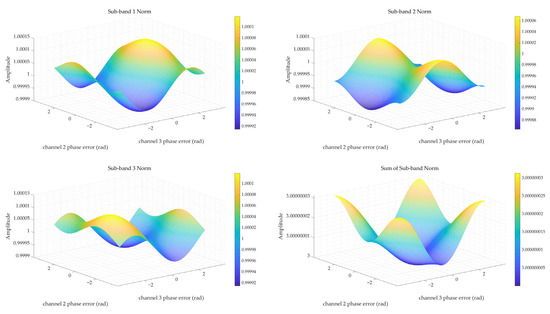
Figure 5.
The norm of the row’s sum of the weight matrix and the sum of the norm.
According to the subadditivity of linear normed space, the SBN satisfies the following equation:
From the above equation, it can be seen that there is a constant lower bound for the sum of the sub-band norm (SSBN), but the minimum cannot be reached because the argument of the sub-band spectral cannot be the same. Again, according to the subadditivity of linear normed space, SBN with error can be written as
where denotes a constant number; the detailed duction can be found in Appendix A. There exists when, and only when, the phase error between channels is consistent, at which time the norm of the sub-band 1 spectrum reaches a minimum value [40]. All sub-band spectral norms satisfy the above equation, so the SSBN with phase errors can be written as
Next, the above equation is verified by simulation experiments of three channels. The simulation parameters of Figure 6 are shown in Table 1. As shown in Figure 6a, the sum of three sub-band spectral norms reaches a minimum value, and the minimum value is equal to the SSBN without phase errors when the phase errors of channels 2 and 3 are 0 at the same time, i.e., when they are in phase with channel 1. As shown in Figure 6b, the norm of the sum of sub-band spectral (NSSB) with errors is also a constant and is less than the SSBN.

Figure 6.
SSBN of the reconstructed spectrum with different phase errors. (a) SSBN has a minimum value when channel phase error is consistent. (b) The NSSB is smaller than the SSBN without phase error.
Now the optimization function is established to estimate channel phase error by the MSSBN. The phase error estimates are shown as
According to Equation (26), the reconstructed spectrum after channel phase error compensation is shown as
where . Then the norm of the sub-band spectrum can be expressed as
Since the number of channels M is equal to the number of spectrum ambiguities N, the SSBN can be further written in the following form:
In this case, the phase error can be estimated by the MSSBN. The estimation model for the MSSBN is developed as
where . Many mature global optimization algorithms, such as OQNLP and PSO, can solve the optimization problem in Equation (34).
The estimation algorithm proposed in this paper is performed in the range-Doppler domain, where the phase information of all sampling points is transformed to the same Doppler frequency band by the azimuth FFT and range pulse compression operations. The phase information of all sampling points is then converted to the same Doppler band. Furthermore, after the range pulse compression, the Doppler spectrum is aggregated into a few range bins, which can significantly reduce the influence of the range dimension on the computational complexity. In order to improve the computational efficiency, downsampling must be uniformly sampled in the whole Doppler band so as not to affect the estimation results.
After estimating the channel phase error, channel error compensation is carried out for the multichannel signal with error reconstruction, and the compensation results are as
The complete process of the algorithm proposed in this paper is shown in Figure 7. The combined flow chart summarizes the main steps of the channel error estimation and calibration process as follows:

Figure 7.
The processing flowchart of the proposed method.
Step 1: Estimate and calibrate the amplitude imbalance between channels using the channel balancing method.
Step 2: Estimate and calibrate the RSTI between channels by using the ATC technique.
Step 3: Perform the spectrum reconstruction of each channel’s echo signal by the reconstruction filters .
Step 4: Transform each channel’s constructed signal into the range-Doppler domain utilizing range pulse compression and azimuth FFT.
Step 5: Uniformly sample the reconstructed azimuth spectrum of each channel echo signal and search for phase error by the MNSSB.
Step 6: The reconstructed azimuth spectrum of each channel echo signal is calibrated for phase error and then summed to obtain the alias-free full azimuth spectrum.
Step 7: Image the reconstructed echo signal after imbalance calibration.
4. Results and Discussions
In this section, the simulation and measured data will be processed and analyzed, and the proposed method’s effectiveness, accuracy, and robustness will be verified by analyzing the processing results. Phase errors are artificially added to different channel echo data in the simulation. By comparing the estimated results with the actual values, the method proposed in this paper can be proved effective. The actual channel imbalance is unknown when processing the accurate data of GF-3, so the method’s effectiveness can be illustrated by comparing the SAR images before and after processing.
4.1. Simulation Experiment and Results
This section uses a three-channel AMC SAR system to generate simulated echo data for simulation experiments. The parameters of the AMC SAR system are shown in Table 1. The platform’s velocity is 7563 m/s, and the nearest distance of the scene center from the radar platform is 900 km. The system transmits a chirp signal with a bandwidth of 300 MHz and a pulse width of 2.5 us. The azimuth antenna length is 11.25 m, with three antenna subapertures uniformly distributed along the radar motion track, and the reference channel is the first. From the transmitting antenna length, the Doppler bandwidth of the system is 3574 Hz, and since the PRF is only 1429 Hz, the ambiguity number of the system is three, which is equal to the number of channels. The two-way antenna pattern weights the azimuth echo signal, and the weighting function is denoted by , where and denote the angle measured from boresight in the slant range plane and azimuth beamwidth, respectively.
In order to generate a simulated echo signal, 9-point targets were placed in the imaging scene to form a 3 × 3 matrix with azimuth and range intervals of 400 and 100 m between points, respectively. The point target’s signal-to-noise ratio (SNR) was set to 20 dB, and the phase errors between channels are shown in Table 4. The top panel of Figure 8a shows the imaging results in the presence of channel errors, and the bottom panel of Figure 8a shows the imaging results after phase error calibration. Figure 8b shows the ambiguity suppression effect after phase calibration, from which it can be seen that the method proposed in this paper effectively suppresses azimuth ambiguity.

Table 4.
Channel phase imbalance estimation results.

Figure 8.
Imaging results after phase error calibration. (a) Phase errors introduce false targets, and ambiguity is suppressed when phase errors are calibrated. (b) Ambiguity suppression effect for point targets.
As shown in Table 4, comparing the estimation accuracy of the method in this paper with that of ATC, MVDR, and LLN, it can be seen that the method proposed in this paper has high estimation accuracy. Its accuracy is consistent with that of the image-domain method. The computational effort can be significantly reduced by uniform sampling operation of the sub-band spectrum without affecting the estimation accuracy. MSSBN-1, MSSBN-2, and MSSBN-3 were processed without sampling operation, 10 times sampling, and 100 times sampling for the azimuth sub-band spectrum, respectively. The method proposed in this paper has high computational efficiency regarding computing time.
The algorithm proposed in this paper finds the global minimum by iteration, so the convergence speed needs to be tested. Figure 9 shows the iterative process of the MSSBN-3 experiment, and simulation results show that the method proposed in this paper has a good convergence effect.
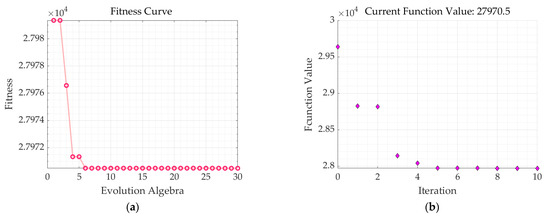
Figure 9.
Iterative process of the MSSBN-3 experiment. (a) PSO. (b) OQNLP.
Monte Carlo experiments test the robustness of the algorithm proposed in this paper. Simulation data are generated using the parameters in Table 1, and the effect of SNR on the estimation accuracy is first considered. An SNR interval of −10 to 20 dB is chosen for evaluation, and the phase error of each channel is set as a random amount from . SNR is varied in steps of 5 dB, and 30 Monte Carlo experiments are performed for each SNR. Average root mean square error (ARMSE) is used to evaluate the estimation accuracy of phase errors, which is defined as
where and represent the number of experiments and the number of channels, respectively. The estimation accuracy of the proposed method is compared with that of the ATC, MVDR, and LLN methods. Figure 10a represents the relationship between ARMSE and SNR, and it is clear that the ARMSE of the proposed method is the smallest among them.
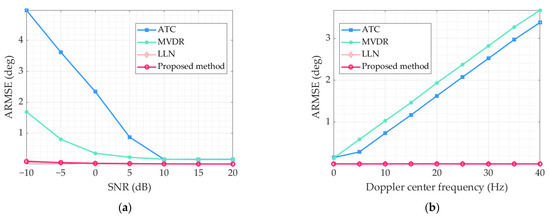
Figure 10.
Comparison of stability of different estimation methods. (a) ARMSE of the phase error versus SNR. (b) ARMSE of the phase error versus Doppler center frequency.
Affected by the antenna attitude, the Doppler frequency in the echo signal is not always zero, and the Doppler center estimation error also impacts the estimation accuracy of the phase error. Therefore, another Monte Carlo experiment is used to test the sensitivity of the proposed algorithm to the Doppler center error in this paper. The Doppler center frequency is set to 0 Hz in the echo data generation. As in the previous experiment, the phase error of each channel is set as a random variable. Furthermore, in the data processing, the estimated error is added to the Doppler center frequency, which is varied from 0 to 40 Hz in steps of 5 Hz. Figure 10b shows the ARMSE of the phase error versus the Doppler center frequency. It can be seen from the figure that the sensitivity of the algorithm proposed in this paper to the Doppler center error is equally low.
In the method proposed in this paper, the phase error estimation results are only related to the Doppler spectrum and are independent of the range direction when RCM is excluded. In order to exclude the effect of range sampling, the proposed method estimates the phase error in the range-Doppler domain. After the range pulse compression, the azimuth spectrum is clustered in a few range bins. Therefore, the phase error at the selected range bin can be accurately estimated by chunking the range direction using the algorithm in this paper. First, the multichannel echo signal is generated according to the phase error settings in Table 5. Then the range direction is chunked into five range bins, and the phase error of each range bin is estimated by the proposed method. The estimation results are shown in Figure 11.

Table 5.
Linear phase error setting of range.
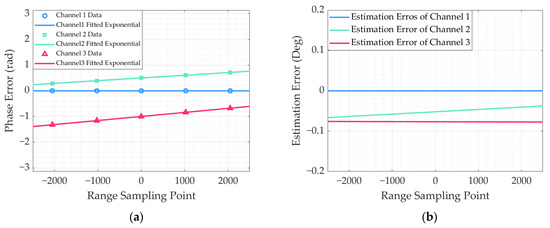
Figure 11.
Range space-variant phase error estimation results. (a) Range chunking estimation and least-squares fitting results. (b) Estimation error of range linear space-variant phase.
Figure 11a represents the phase error results using least squares fitting, and Figure 11b represents the difference between the estimated and actual phase errors. The figure shows that the algorithm proposed in this paper can effectively estimate the range space-variation linear phase error, and the estimation error is within 0.1 Deg.
When the echo signal covers the complete Doppler spectrum, the algorithm proposed in this paper can accurately estimate the phase error. Therefore, when estimating the azimuth time-varying linear phase error, the azimuth blocks need to cover the entire synthetic aperture time. The multichannel echo signal is generated according to the phase error settings in Table 6. The phase error of each azimuth block is estimated by the proposed method.

Table 6.
Linear phase error setting of azimuth.
Figure 12a shows the phase error results using least squares fitting, and Figure 12b indicates the difference between the estimated and actual values of the azimuth time-varying linear phase error. The figure shows that the algorithm proposed in this paper can effectively estimate the phase error of the azimuth time-varying linear phase error. Although the estimation accuracy is lower compared with the range space-varying phase error estimation results, the estimated error is within 0.8 Deg.
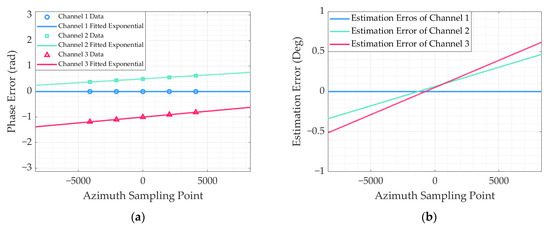
Figure 12.
Azimuth time-variant phase error estimation results. (a) Azimuth chunking estimation and least-squares fitting results (b) Estimation error of azimuth linear time-variant phase.
4.2. Experimental Results of GF-3 Measured Data
This experiment uses satellite-based dual-channel SAR data from the GF-3 system acquired over Lake Inawashiro, the fourth lake northwest of Koriyama, Fukushima, Japan, on 13 March 2018. The main system parameters are listed in Table 7. Figure 13 shows imaging results after the same amplitude but different phase imbalance calibrations. Figure 13a shows imaging results without imbalance calibration, which is severely aliased. The village that should be located up the lake appears in the center of the lake with its ghost’s energy significantly higher than the energy of the actual target. Figure 13b shows the imaging results after compensating for the phase error by the MVDR method, from which it can be seen that the ambiguity is significantly suppressed but still exists. Figure 13c shows the image after compensating for the phase error by the ATC method, the ambiguity is almost invisible, and some ghosting can be seen after magnification. Figure 13d shows the imaging results after phase error correction by the LLN method, and it can be seen that the figure shows that ambiguity is further suppressed compared with the other methods. Figure 13e shows the imaging results after the phase error correction by the proposed method, which has the best ambiguity suppression effect. The compensated phase error in Figure 13f is obtained through 40 times uniform downsampling of the azimuth reconstruction signal, and its value is consistent with the estimated result without downsampling.

Table 7.
GF-3 system parameters.
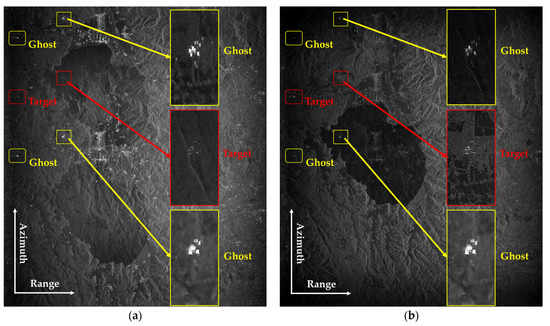
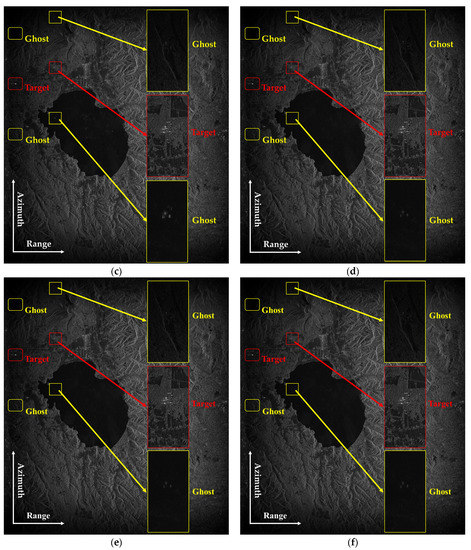
Figure 13.
GF-3 two-channel signal imaging results. (a) imaging results without phase calibration, (b) imaging results after phase calibration using the MVDR method, phase error = 1.96 rad, (c) imaging results after phase calibration using the ATC method, phase error = 2.95 rad, (d) imaging results after phase calibration using the LLN method, phase error = 2.79 rad, (e) imaging results after phase calibration using the method proposed by this paper, phase error = 2.79 rad, and (f) imaging results after phase calibration using the method proposed by this paper with 40 times downsampling for reconstructed azimuth spectrum, phase error = 2.79 rad.
To quantitatively analyze the effectiveness of different methods, the ghost–target energy ratio (GTER) is employed to measure the suppression of ghosts in the final focused image [30], which is defined as
where denotes the maximum amplitude value of the pixels of the ghost, and denotes the maximum value of the target. The more accurate the calibration of phase imbalance between channels, the smaller the value of the GTER. The target and ghost, marked by a box in the image, are selected to calculate the GTER, where the ghost in the lake is GTER1, and the ghost on land is GTER2. The measured results of different images calibrated by different methods are listed in Table 8. GTER1 shows that the best estimation results are obtained using the method proposed in this paper to estimate range space-variant linear phase imbalance. From GTER2, the best estimation results are obtained using the proposed method to estimate the constant phase imbalance. The GTER shows that range space-variant linear phase error estimation results are similar to constant phase error estimation results.

Table 8.
GTER of different methods.
In contrast, azimuth time-variant phase error estimation results are different from the constant phase error estimation results, which shows that the constant phase error estimation can achieve a good compensation effect. The method proposed in this paper improves the computational efficiency by reducing the sample size, and its computational time is mainly spent on range pulse compression and azimuth FFT processing. The global optimization only takes about 2 s. A comprehensive comparison of the above methods shows that the method proposed in this paper has the highest estimation accuracy while having high computational efficiency.
5. Conclusions
This paper proposes a new method for estimating the channel inconsistency of the AMC SAR system, and the influence of channel inconsistency is analyzed. The method mainly calibrates the phase imbalance of channels. Analysis and experiments show that when channel phase imbalances are consistent, the SSBN reaches its minimum value, the norm sum of the unambiguous sub-band spectrum. According to the analysis in Section 3, this minimum value is only affected by the consistency of channel phase imbalance, so phase imbalance can still be accurately estimated even when amplitude imbalance is inconsistent. In this paper, the mathematical model between channel phase imbalance and SSBN is established, and phase imbalance estimation is transformed into the problem of finding the minimum sub-band spectral norm. Channel phase imbalance can be obtained effectively using various global optimal search algorithms. By dividing signal data into two dimensions, the proposed method can also estimate space-varying phase imbalance of range and time-varying phase imbalance of azimuth. The performance of the proposed method is verified by simulation data and actual spaceborne multichannel SAR data and compared with other methods. Results show that this method ensures the accuracy and robustness of estimation and has higher computational efficiency.
Author Contributions
Conceptualization, Z.X.; methodology, Z.X, J.L. and Y.C.; funding acquisition, P.L., T.Y. and R.W.; projection administration, P.L. and R.W.; writing—original draft, Z.X.; writing—review and editing, Z.X., Y.C., R.W. and Y.W. All authors have read and agreed to the published version of the manuscript.
Funding
This research was funded by the National Science Fund for Distinguished Young Scholars, China, grant number No. 61825106.
Data Availability Statement
Not applicable.
Conflicts of Interest
The authors declare no conflict of interest.
Appendix A
Expand Equation (26), and according to the subadditivity of linear normed space, the spectrum recovered by the channel 1 can be written as follows:
When the channel phase error is consistent, the minimum value of the reconstructed signal spectrum norm is obtained. This formula holds for the reconstructed signal spectrum recovered by each channel.
References
- Cumming, I.G.; Wong, F.H. Digital Processing of Synthetic Aperture Radar Data: Algorithms and Implementation; Artech House: Boston, MA, USA, 2005; Volume 1, pp. 108–110. [Google Scholar]
- Li, Z.; Wang, H.; Su, T.; Bao, Z. Generation of Wide-Swath and High-Resolution SAR Images From Multichannel Small Spaceborne SAR Systems. IEEE Geosci. Remote Sens. Lett. 2005, 2, 82–86. [Google Scholar] [CrossRef]
- Krieger, G.; Gebert, N.; Moreira, A. Unambiguous SAR Signal Reconstruction From Nonuniform Displaced Phase Center Sampling. IEEE Geosci. Remote Sens. Lett. 2004, 1, 260–264. [Google Scholar] [CrossRef]
- Krieger, G.; Gebert, N.; Moreira, A. Multidimensional waveform encoding: A new digital beamforming technique for synthetic aperture radar remote sensing. IEEE Trans. Geosci. Remote Sens. 2007, 46, 31–46. [Google Scholar] [CrossRef]
- Jing, W.; Xing, M.; Qiu, C.-W.; Bao, Z.; Yeo, T.-S. Unambiguous reconstruction and high-resolution imaging for multiple-channel SAR and airborne experiment results. IEEE Geosci. Remote Sens. Lett. 2008, 6, 102–106. [Google Scholar] [CrossRef]
- Krieger, G.; Gebert, N.; Younis, M.; Bordoni, F.; Patyuchenko, A.; Moreira, A. Advanced concepts for ultra-wide-swath SAR imaging. In Proceedings of the 7th European Conference on Synthetic Aperture Radar, Friedrichshafen, Germany, 2–5 June 2008; pp. 1–4. [Google Scholar]
- Yunkai, D.; Weidong, Y.; Heng, Z.; Wei, W.; Dacheng, L.; Robert, W. Forthcoming spaceborne SAR development. J. Radars 2020, 9, 1–33. [Google Scholar]
- Fu, Z.; Zhang, H.; Zhao, J.; Li, N.; Zheng, F. A Modified 2-D Notch Filter Based on Image Segmentation for RFI Mitigation in Synthetic Aperture Radar. Remote Sens. 2023, 15, 846. [Google Scholar] [CrossRef]
- Currie, A.; Brown, M.A. Wide-swath SAR. IEE Proc. F 1992, 139, 122–135. [Google Scholar] [CrossRef]
- Callaghan, G.; Longstaff, I. Wide-swath space-borne SAR using a quad-element array. IEE Proc.-Radar Sonar Navig. 1999, 146, 159–165. [Google Scholar] [CrossRef]
- Ender, J.H.; Klare, J. System architectures and algorithms for radar imaging by MIMO-SAR. In Proceedings of the 2009 IEEE Radar Conference, Pasadena, CA, USA, 4–8 May 2009; pp. 1–6. [Google Scholar]
- Süß, M.; Grafmüller, B.; Zahn, R. A novel high resolution, wide swath SAR system. In Proceedings of the IGARSS 2001. Scanning the Present and Resolving the Future. In Proceedings of the IEEE 2001 International Geoscience and Remote Sensing Symposium (Cat. No. 01CH37217), Sydney, Australia, 9–13 July 2001; pp. 1013–1015. [Google Scholar]
- Moore, R.K.; Claassen, J.P.; Lin, Y. Scanning spaceborne synthetic aperture radar with integrated radiometer. IEEE Trans. Aerosp. Electron. Syst. 1981, AES-17, 410–421. [Google Scholar] [CrossRef]
- Soumekh, M. Synthetic Aperture Radar Signal Processing; Wiley: New York, NY, USA, 1999; Volume 7. [Google Scholar]
- De Zan, F.; Guarnieri, A.M. TOPSAR: Terrain observation by progressive scans. IEEE Trans. Geosci. Remote Sens. 2006, 44, 2352–2360. [Google Scholar] [CrossRef]
- Naftaly, U.; Levy-Nathansohn, R. Overview of the TECSAR satellite hardware and mosaic mode. IEEE Geosci. Remote Sens. Lett. 2008, 5, 423–426. [Google Scholar] [CrossRef]
- Younis, M.; Fischer, C.; Wiesbeck, W. Digital beamforming in SAR systems. IEEE Trans. Geosci. Remote Sens. 2003, 41, 1735–1739. [Google Scholar] [CrossRef]
- Yingjie, W.; Robert, W.; Weidong, Y.; Qingchao, Z.; Kaiyu, L.; Dacheng, L.; Yunkai, D.; Naiming, O.; Xiaoxue, J.; Heng, Z.; et al. See-Earth: SAR Constellation with Dense Time-SEries for Multi-dimensional Environmental Monitoring of the Earth. J. Radars 2021, 10, 842–864. [Google Scholar]
- Kim, J.-H.; Younis, M.; Prats-Iraola, P.; Gabele, M.; Krieger, G. First spaceborne demonstration of digital beamforming for azimuth ambiguity suppression. IEEE Trans. Geosci. Remote Sens. 2012, 51, 579–590. [Google Scholar] [CrossRef]
- Luscombe, A. Image quality and calibration of RADARSAT-2. In Proceedings of the 2009 IEEE International Geoscience and Remote Sensing Symposium, Cape Town, South Africa, 12–17 July 2009; pp. II757–II760. [Google Scholar]
- Shimada, M. ALOS-2 science program. In Proceedings of the 2013 IEEE International Geoscience and Remote Sensing Symposium-IGARSS, Melbourne, Australia, 21–26 July 2013; pp. 2400–2403. [Google Scholar]
- Qingjun, Z. System design and key technologies of the GF-3 satellite. Acta Geod. Et Cartogr. Sin. 2017, 46, 269. [Google Scholar]
- Sun, J.; Yu, W.; Deng, Y. The SAR payload design and performance for the GF-3 mission. Sensors 2017, 17, 2419. [Google Scholar] [CrossRef]
- Lin, H.; Deng, Y.; Zhang, H.; Liu, D.; Liang, D.; Fang, T.; Wang, R. On the Processing of Dual-Channel Receiving Signals of the LuTan-1 SAR System. Remote Sens. 2022, 14, 515. [Google Scholar] [CrossRef]
- Gebert, N.; de Almeida, F.Q.; Krieger, G. Airborne demonstration of multichannel SAR imaging. IEEE Geosci. Remote Sens. Lett. 2011, 8, 963–967. [Google Scholar] [CrossRef]
- Yang, T.; Li, Z.; Liu, Y.; Bao, Z. Channel error estimation methods for multichannel SAR systems in azimuth. IEEE Geosci. Remote Sens. Lett. 2012, 10, 548–552. [Google Scholar] [CrossRef]
- Feng, J.; Gao, C.; Zhang, Y.; Wang, R. Phase Mismatch Calibration of the Multichannel SAR Based on Azimuth Cross Correlation. IEEE Geosci. Remote Sens. Lett. 2013, 10, 903–907. [Google Scholar] [CrossRef]
- Zhang, S.-X.; Xing, M.-D.; Xia, X.-G.; Zhang, L.; Guo, R.; Liao, Y.; Bao, Z. Multichannel HRWS SAR imaging based on range-variant channel calibration and multi-Doppler-direction restriction ambiguity suppression. IEEE Trans. Geosci. Remote Sens. 2013, 52, 4306–4327. [Google Scholar] [CrossRef]
- Shang, M.; Qiu, X.; Han, B.; Yang, J.; Zhong, L.; Ding, C.; Hu, Y. The space-time variation of phase imbalance for GF-3 azimuth multichannel mode. IEEE J. Sel. Top. Appl. Earth Obs. Remote Sens. 2020, 13, 4774–4788. [Google Scholar] [CrossRef]
- Yang, W.; Guo, J.; Chen, J.; Liu, W.; Deng, J.; Wang, Y.; Zeng, H. A Novel Channel Inconsistency Estimation Method for Azimuth Multi-channel SAR Based on Maximum Normalized Image Sharpness. IEEE Trans. Geosci. Remote Sens. 2022, 60, 1–16. [Google Scholar]
- Li, Z.; Bao, Z.; Wang, H.; Liao, G. Performance improvement for constellation SAR using signal processing techniques. IEEE Trans. Aerosp. Electron. Syst. 2006, 42, 436–452. [Google Scholar]
- Zhang, L.; Gao, Y.; Liu, X. Robust channel phase error calibration algorithm for multichannel high-resolution and wide-swath SAR imaging. IEEE Geosci. Remote Sens. Lett. 2017, 14, 649–653. [Google Scholar] [CrossRef]
- Xiang, J.; Ding, X.; Sun, G.-C.; Zhang, Z.; Xing, M.; Liu, W. An Efficient Multichannel SAR Channel Phase Error Calibration Method Based on Fine-Focused HRWS SAR Image Entropy. IEEE J. Sel. Top. Appl. Earth Obs. Remote Sens. 2022, 15, 7873–7885. [Google Scholar] [CrossRef]
- Zhang, S.-X.; Xing, M.-D.; Xia, X.-G.; Liu, Y.-Y.; Guo, R.; Bao, Z. A robust channel-calibration algorithm for multi-channel in azimuth HRWS SAR imaging based on local maximum-likelihood weighted minimum entropy. IEEE Trans. Image Process. 2013, 22, 5294–5305. [Google Scholar] [CrossRef] [PubMed]
- Cai, Y.; Deng, Y.; Zhang, H.; Wang, R.; Wu, Y.; Cheng, S. An Image-Domain Least L1-Norm Method for Channel Error Effect Analysis and Calibration of Azimuth Multi-Channel SAR. IEEE Trans. Geosci. Remote Sens. 2022, 60, 1–14. [Google Scholar]
- Ugray, Z.; Lasdon, L.; Plummer, J.; Glover, F.; Kelly, J.; Martí, R. Scatter search and local NLP solvers: A multistart framework for global optimization. INFORMS J. Comput. 2007, 19, 328–340. [Google Scholar] [CrossRef]
- Lun, M.; Guisheng, L.; Zhenfang, L. An approach for Multi-channel SAR Array Error Compension and Its Verification by Measured Data. J. Electron. Inf. Technol. 2009, 31, 1305–1309. [Google Scholar]
- Laskowski, P.; Bordoni, F.; Younis, M. Antenna pattern compensation in multi-channel azimuth reconstruction algorithm. In Proceedings of the Advanced RF Sensors and Remote Sensing Instruments (ARSI), Noordwijk, The Netherlands, 13–15 September 2011; pp. 1–10. [Google Scholar]
- Shang, M.; Qiu, X.; Han, B.; Ding, C.; Hu, Y. Channel Imbalances and Along-Track Baseline Estimation for the GF-3 Azimuth Multichannel Mode. Remote Sens. 2019, 11, 1297. [Google Scholar] [CrossRef]
- Maligranda, L. Some remarks on the triangle inequality for norms. Banach J. Math. Anal. 2008, 2, 31–41. [Google Scholar] [CrossRef]
- Zhang, Y.; Wang, W.; Deng, Y.; Wang, R. Signal reconstruction algorithm for azimuth multichannel SAR system based on a multiobjective optimization model. IEEE Trans. Geosci. Remote Sens. 2020, 58, 3881–3893. [Google Scholar] [CrossRef]
Disclaimer/Publisher’s Note: The statements, opinions and data contained in all publications are solely those of the individual author(s) and contributor(s) and not of MDPI and/or the editor(s). MDPI and/or the editor(s) disclaim responsibility for any injury to people or property resulting from any ideas, methods, instructions or products referred to in the content. |
© 2023 by the authors. Licensee MDPI, Basel, Switzerland. This article is an open access article distributed under the terms and conditions of the Creative Commons Attribution (CC BY) license (https://creativecommons.org/licenses/by/4.0/).