Abstract
Accurate high-resolution soil moisture mapping is critical for surface studies as well as climate change research. Currently, regional soil moisture retrieval primarily focuses on a spatial resolution of 1 km, which is not able to provide effective information for environmental science research and agricultural water resource management. In this study, we developed a quantitative retrieval framework for high-resolution (250 m) regional soil moisture inversion based on machine learning, multisource data fusion, and in situ measurement data. Specifically, we used various data sources, including the normalized vegetation index, surface temperature, surface albedo, soil properties data, precipitation data, topographic data, and soil moisture products from passive microwave data assimilation as input parameters. The soil moisture products simulated based on ground model simulation were used as supplementary data of the in situ measurements, together with the measured data from the Maqu Observation Network as the training target value. The study was conducted in the Zoige region of the Tibetan Plateau during the nonfreezing period (May–October) from 2009 to 2018, using random forests for training. The random forest model had good accuracy, with a correlation coefficient of 0.885, a root mean square error of 0.024 m³/m³, and a bias of −0.004. The ground-measured soil moisture exhibited significant fluctuations, while the random forest prediction was more accurate and closely aligned with the field soil moisture compared to the soil moisture products based on ground model simulation. Our method generated results that were smoother, more stable, and with less noise, providing a more detailed spatial pattern of soil moisture. Based on the permutation importance method, we found that topographic factors such as slope and aspect, and soil properties such as silt and sand have significant impacts on soil moisture in the southeastern Tibetan Plateau. This highlights the importance of fine-scale topographic and soil property information for generating high-precision soil moisture data. From the perspective of inter-annual variation, the soil moisture in this area is generally high, showing a slow upward trend, with small spatial differences, and the annual average value fluctuates between 0.3741 m3/m3 and 0.3943 m3/m3. The intra-annual evolution indicates that the monthly mean average soil moisture has a large geographical variation and a small multi-year linear change rate. These findings can provide valuable insights and references for regional soil moisture research.
1. Introduction
Soil moisture is a crucial variable that plays a role in regulating hydrological changes, the carbon cycle, and energy exchange in terrestrial ecosystems [1,2]. Therefore, it holds significant potential for use in climate change and ecological research. Recognizing the significance of soil moisture in the study of global climate and weather systems, the Global Climate Observing System (GCOS) has listed it as one of the 50 fundamental climate variables [3]. Therefore, obtaining high-resolution soil moisture data is vital for various earth system science research applications, such as monitoring crop growth and drought [4,5], simulating hydrological processes [6,7], monitoring wetlands and riparian zones [8,9], and estimating food security and crop yield [10,11].
Currently, there are three main ways to collect soil moisture data: in situ observation, model simulation, and remote sensing techniques [12]. Each method has its own advantages and limitations. In general, in situ measurements can provide highly accurate and timely soil moisture data at various depths. This strategy lacks spatial continuity due to its limited applicability, high economic costs for both human and materials resources, and poor representation in sampling [13]. The soil moisture value can be obtained at any time and spatial resolution using land surface models, which simulate the water balance equation or other quantitative methods. However, the spatial resolution of these models is relatively low and their accuracy is significantly influenced by input data, calibration procedures, model physics, and parameterization errors [14]. In contrast, remote sensing technology offers the advantages of a broad detection field, as well as time-efficient and dynamic observation, which makes it a viable option for mapping at both regional and global levels. Specifically, active and passive microwave remote sensing can observe the planet in all weather and lighting conditions and can use longer bands for Earth observation than the visible and infrared bands [15]. The Advanced Microwave Scanning Radiometer 2 (AMSR2) [16], the Soil Moisture and Ocean Salinity Satellite (SMOS) [17], and the Soil Moisture Active Passive (SMAP) [18] are all examples of current microwave-based large-scale worldwide soil moisture monitoring systems. However, the spatial resolution of these microwave remote sensing satellites is typically lower (25 km–50 km). These satellites are more sensitive to surface roughness and soil topography variability. They are unable to provide more precise information for local-scale soil moisture researches.
Due to the low spatial and temporal resolution of remote sensing satellite soil moisture products, numerous studies have emerged to downscale the soil moisture and to obtain high-resolution soil moisture datasets. Currently, there are various methods available for soil moisture downscaling. Scholars have roughly categorized them into three categories [19]: model-based methods, methods based on fusion of multisource remote sensing satellite data, and methods assisted by geographic information data. Among these categories, the more classical methods are the combination of active and passive microwave remote sensing data [20], coarse-resolution passive microwave data and fine-scale optical data [21], a moving window [22], and the general concept of a triangle [23]. Ranney et al. (2015) proposed a downscaling model that utilized high-resolution terrain, vegetation, and soil data. They compared it with the Empirical Orthogonal Function (EOF) model in different catchment areas and found it to be a more promising approach, especially for catchments with significant variations in vegetation cover [24]. Park et al. (2017) employed machine learning algorithms to downscale the Advanced Microwave Scanning Radiometer for EOS (AMSR-E) data to a 1 km spatial resolution using several Moderate Resolution Imaging Spectroradiometer (MODIS) products, such as the surface albedo, surface temperature, and vegetation index [25]. Wei et al. (2019) downscaled the SMAP soil moisture products based on gradient-enhanced decision trees using 26 indices related to soil moisture to generate high spatial resolution soil moisture data (1 km) on the Tibetan Plateau [26]. By examining the direct or indirect correlations between various data sources and soil moisture, the resolution of coarse-scale soil moisture products can be significantly enhanced, providing more detailed information for regional soil moisture research.
In the past decades, machine learning has attracted extensive attention in the field of soil moisture downscaling because of its nonlinearity, strong generalization ability, and excellent adaptability [27]. Machine learning can process large amounts of data quickly and effectively. It has the ability to capture temporal and spatial variations in soil moisture and soil characteristics, as well as to predict the behavior of complex interactions [28]. Therefore, many studies are now utilizing machine learning to generate high-precision soil moisture data by integrating multisource auxiliary data and environmental variables. Currently, 1 km spatial resolutions are the primary focus of soil moisture research scales [29,30,31,32,33]. For instance, Zhao et al. (2018) and Im et al. (2016) used the random forest downscaling method and various MODIS surface variables and band information to downscale the coarse resolution microwave products SMAP and AMSR-E to 1 km [30,31]. Additionally, previous studies by Wang et al. (2022), Zhang et al. (2022), and Chen et al. (2019) revealed that random forest outperformed a wide range of machine learning techniques in simulating complex interactions between different surface variables and soil moisture [34,35,36]. Long-term remote sensing data accumulation has allowed it to become a viable alternative method for soil moisture research [37]. The advent of machine learning has opened up avenues for a deeper investigation into the underlying correlations between soil moisture and other characteristic variables. This is particularly significant in the context of the unclear physical mechanisms, as it can help address the current obstacles and challenges faced in satellite soil moisture retrieval.
To overcome the limitations posed by different remote sensing sensors, such as modeling errors in simulations and the low spatial resolution of passive microwave sensors, this study proposes a framework for high-resolution soil moisture retrieval. The framework combines multisource data fusion, machine learning algorithms, and field measurement data to generate soil moisture maps with a resolution of 250 m. Specifically, we used various data sources, including the MODIS surface variables (normalized difference vegetation index, surface temperature, evapotranspiration, and surface albedo), soil properties data, precipitation data, topographic data, and soil moisture products from passive microwave data assimilation as input parameters. The soil moisture products simulated based on the ground model were used as supplementary data of the in situ measurements, together with the measured data of the Maqu Observation Network as the training target value. Experiments were carried out in the Zoige region of the Tibetan Plateau using random forest for training. The model was evaluated and validated using field data and the fifth generation ECMWF atmospheric reanalysis of the global climate (ERA5) reanalysis product. Parameter variables that significantly contributed to regional soil moisture inversion were identified, and the regional spatiotemporal variation pattern was analyzed. This study aims to exploit the benefits of multisource data and mitigate the issue of uncertainty in the machine learning inversion process, leading to an enhancement in the inversion accuracy of remote sensing and machine learning.
2. Study Area and Datasets
2.1. Study Area
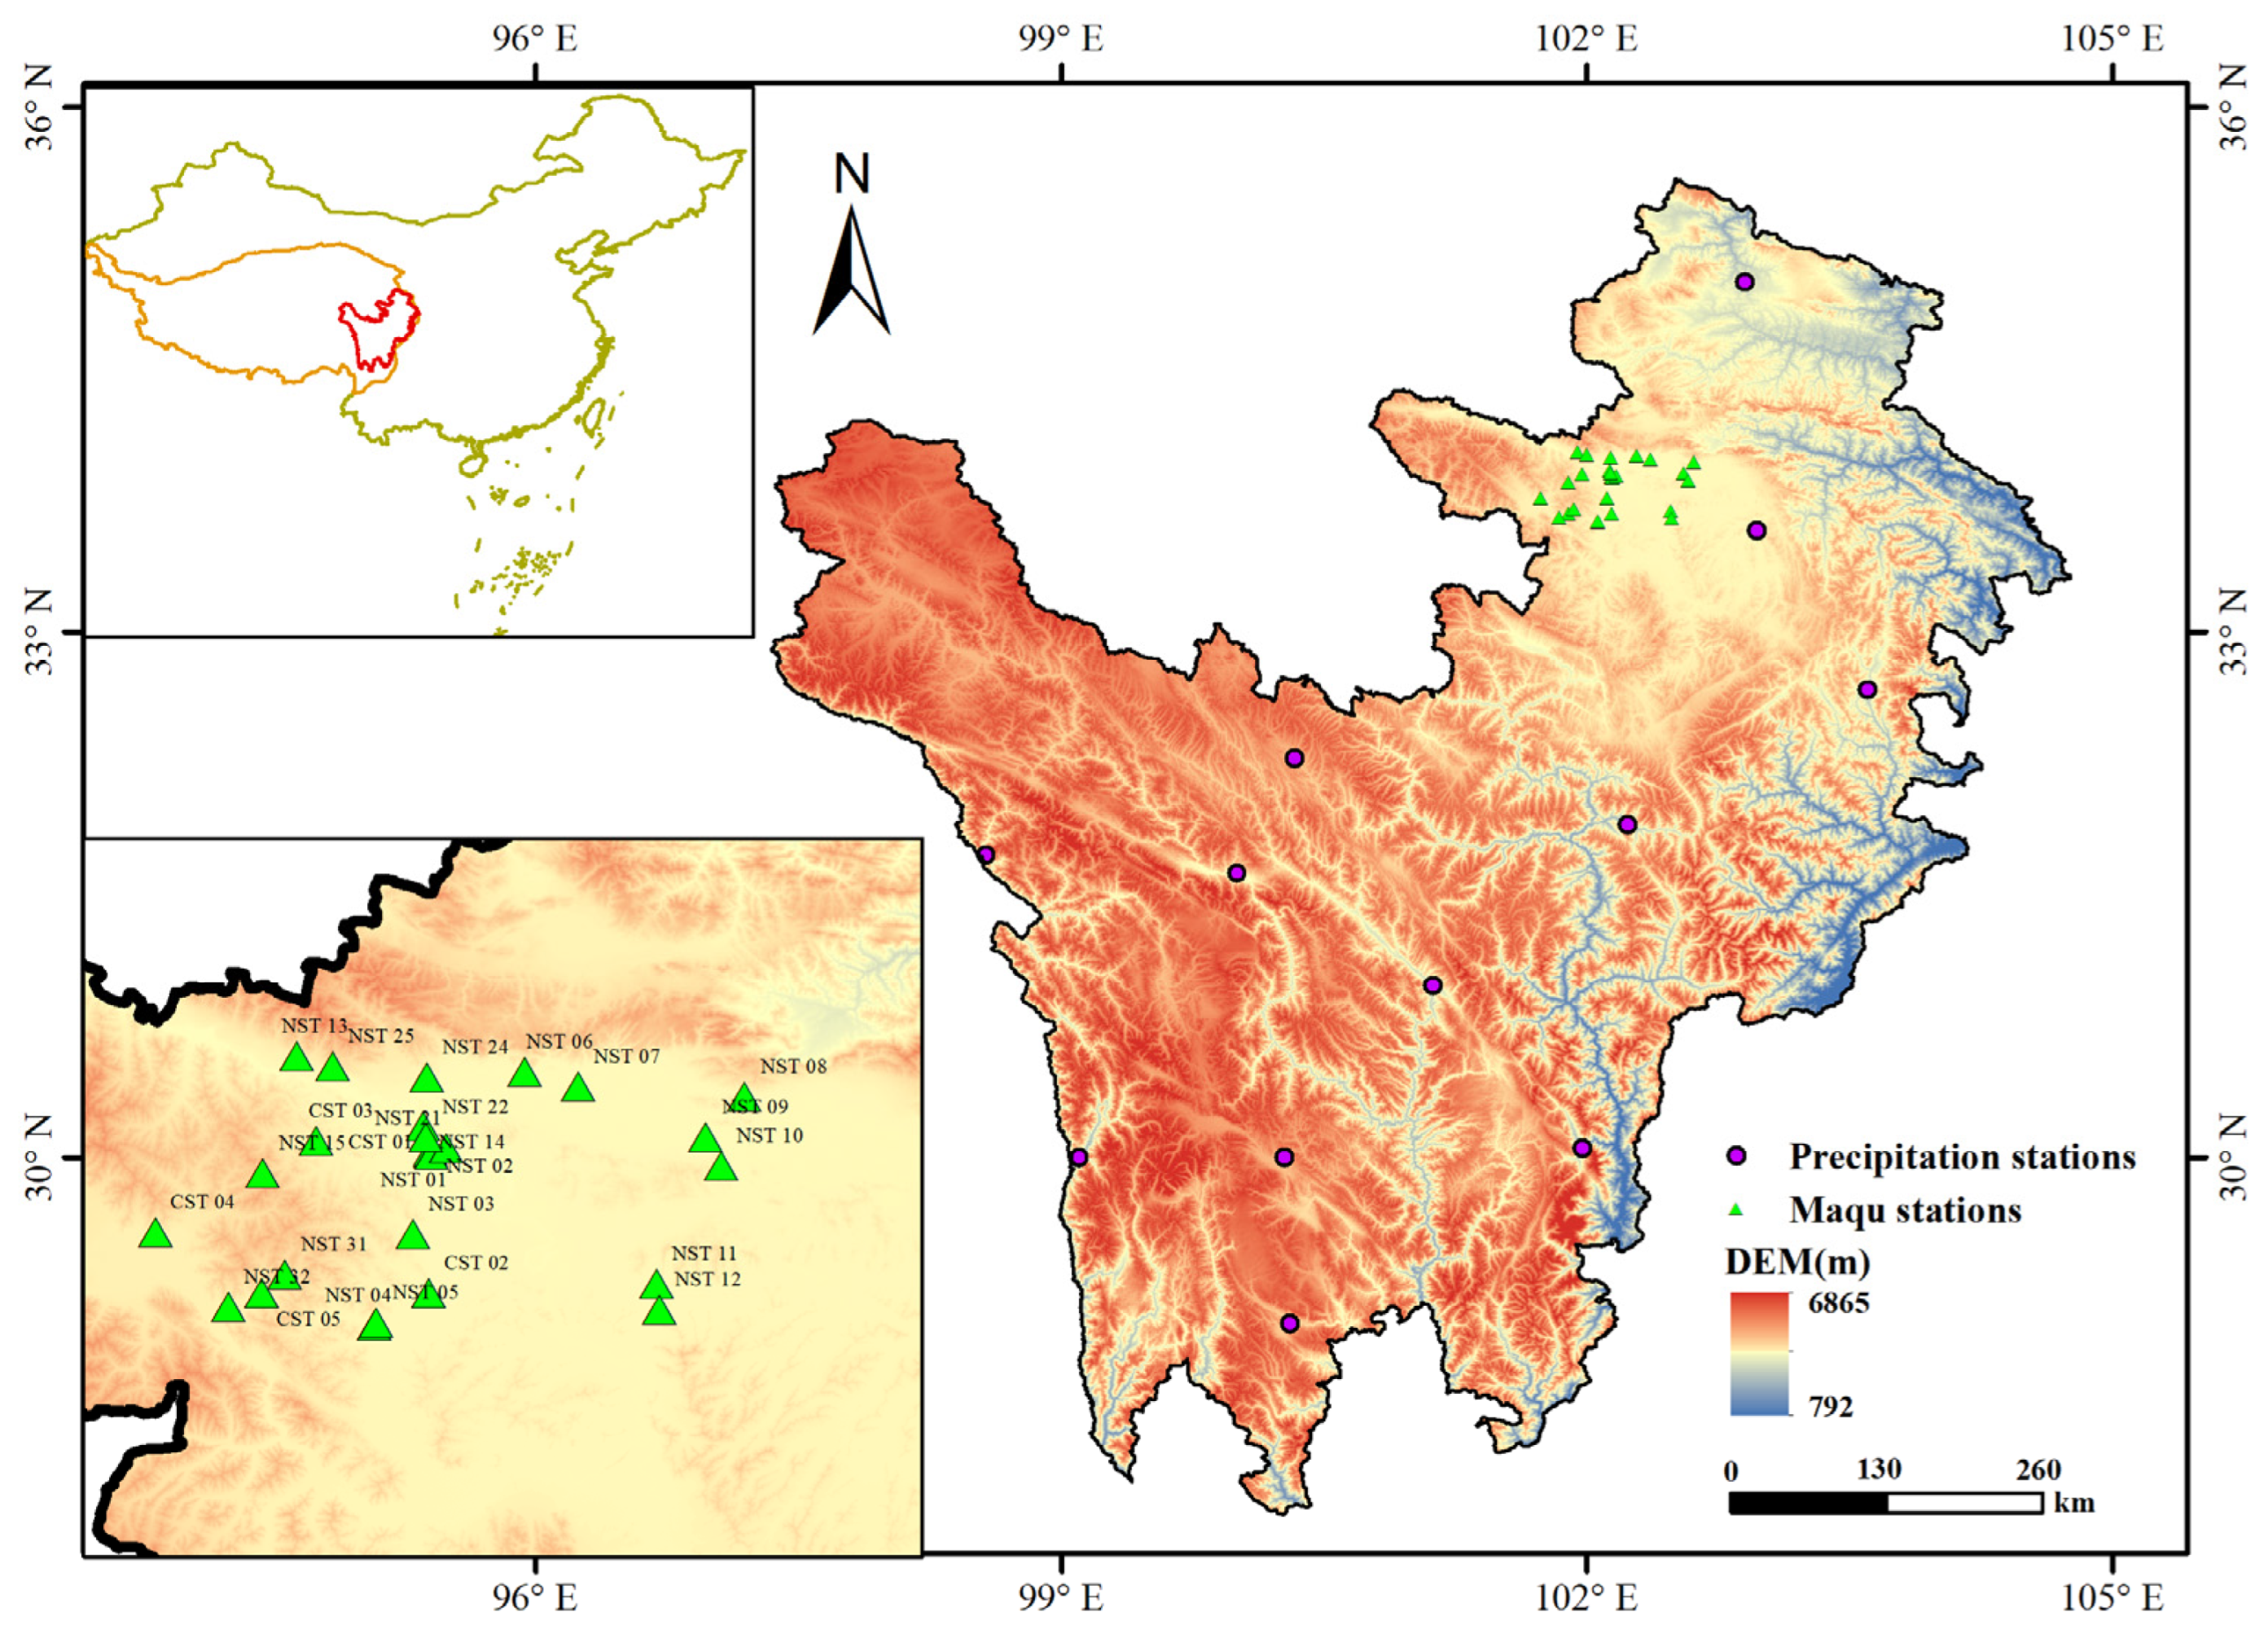
The study area for this research is the southeastern margin of the Tibetan Plateau, specifically the Northwest Sichuan Plateau and Zoige prairie region (27°96′–35°58′N, 97°34′–104°75′E, Figure 1). This region plays an essential role in conserving water for the Yangtze and Yellow Rivers. It is also an important ecological function area and a typical fragile ecological environment in Sichuan Province. The area covers approximately 269,000 km2 with an average altitude of around 3900 m. The topography of this region is complex and diverse, with a general pattern of decreasing elevation from west to east. The region receives strong solar radiation and has abundant light energy resources. The majority of rainfall is concentrated in the warm season, spanning from May to October each year, during which vegetation growth is more pronounced. Additionally, the climate in this area is dynamic and complex, with significant variations in soil moisture and vegetation cover. The area is characterized by its three-dimensional changes with typical geomorphological features such as hills, canyons, rivers, wetlands, grasslands, forests, deserts, and glaciers.
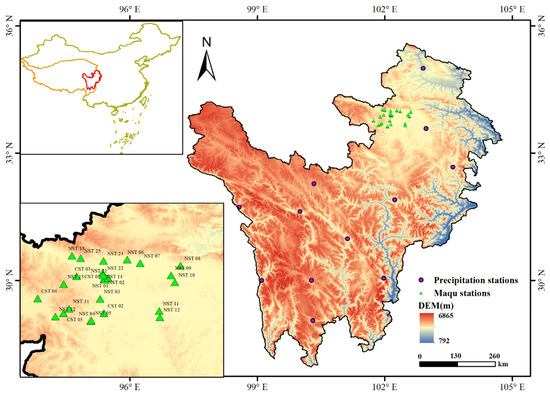
Figure 1.
Overview map of the study area and distribution of Maqu observation stations and meteorological stations. The purple circles represent the distribution of precipitation stations, while the green triangles indicate the distribution of stations in the Maqu observation network that provide in situ measurements.
2.2. Datasets
During the data preparation and collection phase, we selected various data sources including MODIS surface variables, soil properties data, topographic and precipitation data, and various soil moisture data. This was based on a review of literature research data and a summary of previous research results [38,39,40,41,42,43]. The specifics of these multisource data are presented in Table 1. Furthermore, to facilitate readers’ comprehension of the research variables’ abbreviations and symbols, we have compiled an index of notations and abbreviations. Please refer to Table A1 for more information.

Table 1.
Multisource datasets and auxiliary data used in this study.
2.2.1. MODIS Dataset
The Moderate Resolution Imaging Spectroradiometer (MODIS) has garnered significant interest for estimating soil moisture due to its high temporal and spatial coverage, extensive time series, diverse product offerings, and simple data acquisition [44]. In this research, we used four MODIS products: the normalized difference vegetation index (MOD13Q1, NDVI, 16-Day L3 Global 250 m), land surface temperature (MOD11A2, LST, 8-Day L3 Global 1 km), evapotranspiration (MOD16A2, ET, 8-Day L4 Global 500 m), and albedo (MCD43A3, Albedo, Daily L3 Global 500 m). These surface variables have shown significant potential in soil moisture retrieval, and they are readily available for download from the National Aeronautics and Space Administration’s (NASA) official website (https://modis.gsfc.nasa.gov, accessed on 22 July 2022). The MODIS Reprojection Tool (MRT) tool was used for batch processing. We used the nearest-neighbor interpolation method to resample the different spatial resolution products of MODIS to a uniform 250 m. Using the Python programming language and considering the impact of vegetation growth season, monthly data for the 16-day NDVI were synthesized using the maximum value method. For the remaining variables, corresponding monthly data were obtained through mean value synthesis.
2.2.2. Soil Properties Dataset
The soil properties data were obtained from the SoilGrids version 2.0 product [45] with a spatial resolution of 250 m and can be downloaded from https://soilgrids.org (accessed on 9 May 2022). Only the average sand, clay, silt content of the top 0–5 cm of soil was extracted and the available water content was calculated using Formula 1. The available water-holding capacity (AWC) refers to the water storage capacity that can be maintained without losing water balance under specific soil conditions and is determined by the soil texture properties [46]. However, it should be noted that the AWC model may not be applicable for soil types in other regions due to the differences in physical properties of soil types across different regions. The AWC was estimated using an empirical linear fitting model for soil sand and soil clay content with the following equation [47].
where is the soil sand content (%) and is the soil clay content (%).
2.2.3. Topographic Dataset
Elevation, as a key aspect of topographic data, is closely linked to changes in soil moisture [48]. To acquire the topographic data, we used the high-resolution digital elevation model (DEM) data from NASA’s Shuttle Radar Topography Mission (SRTM). It has a spatial resolution of 90 m and can be acquired from the Geospatial Information Data Center (http://www.gscloud.cn, accessed on 15 April 2022). We extracted the slope and slope direction of the study area for the DEM and included them as topographic auxiliary variables in the analysis.
2.2.4. Precipitation Data
In this study, precipitation data were collected from daily measurements of land standard weather stations in China, which were published by the National Oceanic and Atmospheric Administration (NOAA) and can be accessed at https://ladsweb.modaps.eosdis.nasa.gov (accessed on 21 June 2022). We utilized data from 12 available weather stations in the study area, with detailed information shown in Table 2. The locations of these stations are indicated by purple circles in Figure 1. After evaluating various precipitation interpolation methods, we employed the kriging interpolation method provided by ArcGIS to create a precipitation distribution map of the study area [49,50,51], which was used as an input variable for the random forest model.

Table 2.
Details of precipitation stations in the study area.
2.2.5. Soil Moisture Dataset
The in situ measurement site data of the Maqu Observation Network were obtained from the long-term surface soil moisture dataset (2009–2019) of the Tibetan Plateau Soil Temperature and Moisture Observation Network [52]. The Maqu Network was established in 2008 and spans an area of approximately 40 × 80 km2, with 26 soil moisture and soil temperature (SMST) monitoring stations. The measurements ranged from 5 cm to 80 cm in depth and data were collected every 15 min. The selection of observation sites was based on the altitude, slope, and different soil characteristics of the region. A random stratified sampling method was used to establish uniformly good observation sites in each layer. Detailed site information about Maqu Network can be found in Table 3. As a result of variations in site establishment timing, some of the data on the sites were incomplete, leading to an incomplete time series and limited availability of actual soil moisture data. In this study, we used the mean synthesis method to convert the 15-min raw observation data from the Maqu Network sites into monthly averages as the original field measurement data.

Table 3.
Site Information of the Maqu Observation Network.
The Soil Moisture of China based on In situ data (SMCI) is a soil moisture product that is generated using a combination of in situ measurements and machine learning [53]. The dataset was generated using a random forest algorithm and trained on in situ measurement data collected from 1789 stations across China. The spatial resolution of this dataset is 1 km and the temporal resolution is daily. Studies have shown that the accuracy of this product is high, with an R value greater than 0.866 and an RMSE of less than 0.052 m³/m³. The accuracy and performance capability of this dataset is superior to the current soil moisture products such as ERA5-Land and SMAP Level-4. This product is based on ground model simulations and can be used as a complementary dataset for high-resolution soil moisture requirements. For more detailed information on the SMCI soil moisture product, the reader is referred to the article by Li et al. (2022). For the SMCI soil moisture product, we used the mean composite method to combine daily data into monthly data.
The SMC (Soil Moisture in China dataset) is a soil moisture product with a temporal resolution of months and a spatial resolution of 0.05° based on passive microwave background [54]. The product is highly consistent in both time and space with the measured site data. (R > 0.78 and RMSE < 0.05 m³/m³). The dataset is generated from three passive microwave remote sensing products in m3/m3 and can be used as an important input parameter for geophysical studies and ecological modeling. For more detailed information about SMC soil moisture products, readers can refer to Meng et al. (2021). The soil moisture products, SMC and SMCI, can both be downloaded from the Earth System Science Data (ESSD) website at https://www.earth-system-science-data.net (accessed on 28 September 2022).
3. Methodology
3.1. Random Forest
Random forest (RF) is an enhanced decision tree model that is used to solve regression and classification problems [55]. RF is an ensemble algorithm that generates multiple classification and regression trees by constructing different subsets in the sample data using random sampling [56]. Each decision tree is separately distributed, and each subset is independent of the others. In each leaf node of the decision tree, a simple and accurate model is created to simulate the connection between the feature values and the label values. When a new sample is input to the established random forest, the sample attributes are determined by voting selection [57]. Compared to linear models, RF has stronger randomness and a better generalization ability, which allows for efficient and quick processing of high-dimensional and multi-linear data [58]. Random forest models are also more tolerant to outliers and noise.
When predicting soil moisture, the main idea behind the RF model is to divide the independent feature space into several regression trees, and to construct a forest using two-thirds of the sample set. The remaining one-third is used to validate each tree. The final result of RF is to establish a nonlinear correlation between the input independent features and the target soil moisture by averaging the predictions of multiple independent regression trees [59]. The random forest model for soil moisture inversion used in this paper can be represented by the following formulas [29]:
where denotes soil moisture data; denotes various input variables of the random forest model, and is a nonlinear function formed by establishing a correlation between the feature value and the output ; is an ensemble decision tree, is the number of regression trees, and is the subdecision tree given the corresponding soil moisture from the training input variable ().
The most crucial hyperparameters in the RF model are the number of decision trees (n), the maximum depth of a single tree (max_depth), and the number of randomly selected features at each split (max_features). In this study, we used the open-source machine learning library Scikit-learn package to construct the random forest model using the Python language and the Pycharm platform. The grid search and ten-fold cross-validation were applied to optimize the hyperparameters and evaluate the model’s accuracy.
3.2. RF Model Construction
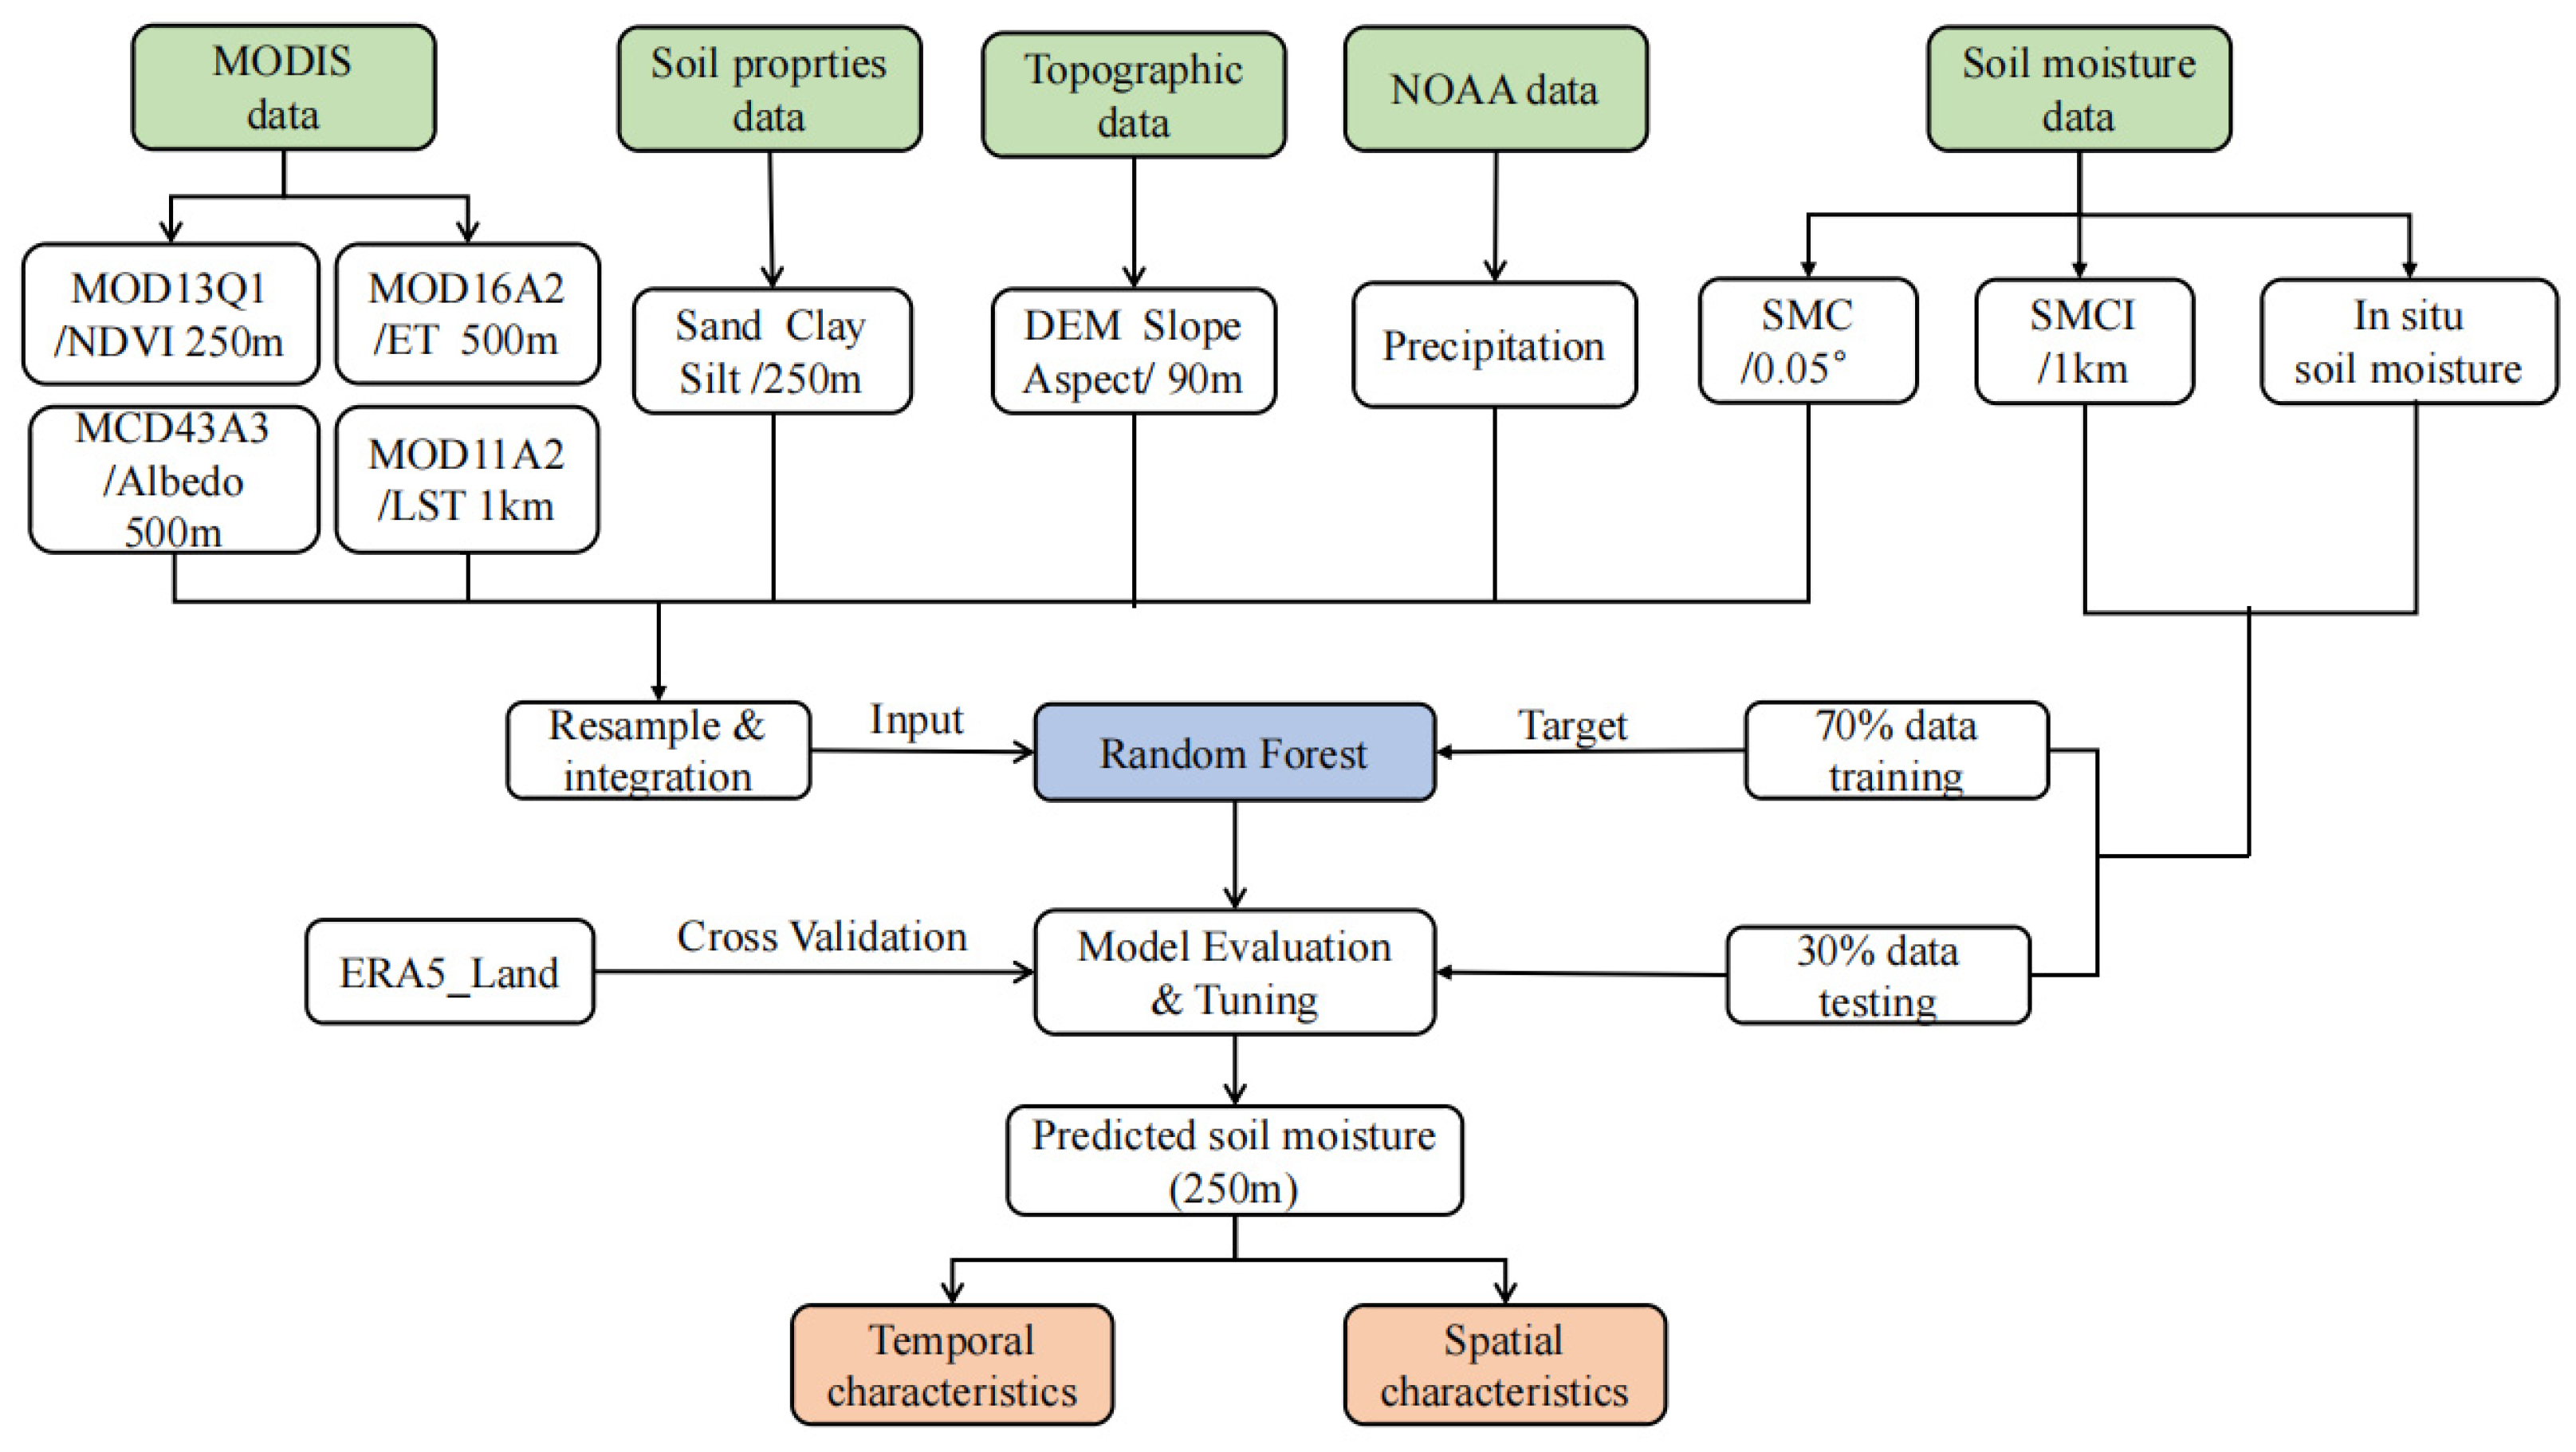
The flowchart in Figure 2 illustrates the process of using a random forest algorithm for soil moisture prediction in this study. The dataset used in this research consisted of 9606 samples, spanning from 2009 to 2018 during the nonfreezing period from May to October. To begin, various data sources were collected and processed, including MODIS surface variables (NDVI, LST, albedo, and ET), soil texture data, topographic and precipitation data, and in situ measurements and soil moisture products (SMCI and SMC). The in situ measurement data were used to extract the values of corresponding independent variables according to the latitude and longitude of the measurement site. The SMCI soil moisture product data were used to extract the mean value of each input feature variable within the SMCI pixel range (1 km × 1 km) from the corresponding input dataset. These values were integrated with the in situ measurement data as the training target value. The SMC soil moisture product and the remaining parameter variables were used as the feature values to create a sample set that matched the temporal and spatial scales. The sample set was then divided into 70% for training (from May to October in 2009–2015) and 30% for testing (from May to October in 2016–2018). The random forest algorithm was used to construct the complex correlation between the feature variables and target values. The input variables were then resampled to the same cell (250 m) and imported into the trained random forest model to generate high-precision soil moisture data. The results were spatio-temporally validated using measured data and ERA5_Land reanalysis products. Finally, the spatial and temporal variation characteristics of the final soil moisture data (250 m) were analyzed.
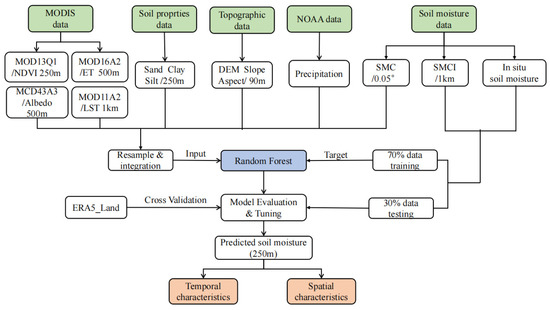
Figure 2.
Flowchart of soil moisture inversion based on random forest.
In order to account for the presence of missing data in the in situ measurement data, the research period was limited to the nonfreezing months from May to October in 2009–2018. This period was chosen to ensure consistency in the research and to focus on the inversion of surface liquid water, as the Tibetan Plateau is characterized by low temperatures and permafrost during the winter months. To ensure that only unfrozen soil was included in the sample set, conditions were established to screen for surface temperature greater than 0 °C and albedo values less than 0.4. This approach was used to accurately distinguish between frozen and unfrozen soil [60].
3.3. Evaluation Metrics
To assess the accuracy of the random forest model, three metrics were employed: correlation coefficient (R), root mean square error (RMSE), and bias. These metrics are standard techniques for model evaluation and validation [61]. The formulas for calculating these metrics are as follows:
where is the number of sample points in the model, represents the i-th predicted value of surface soil moisture, and represents the corresponding true value of surface soil moisture at the sample point.
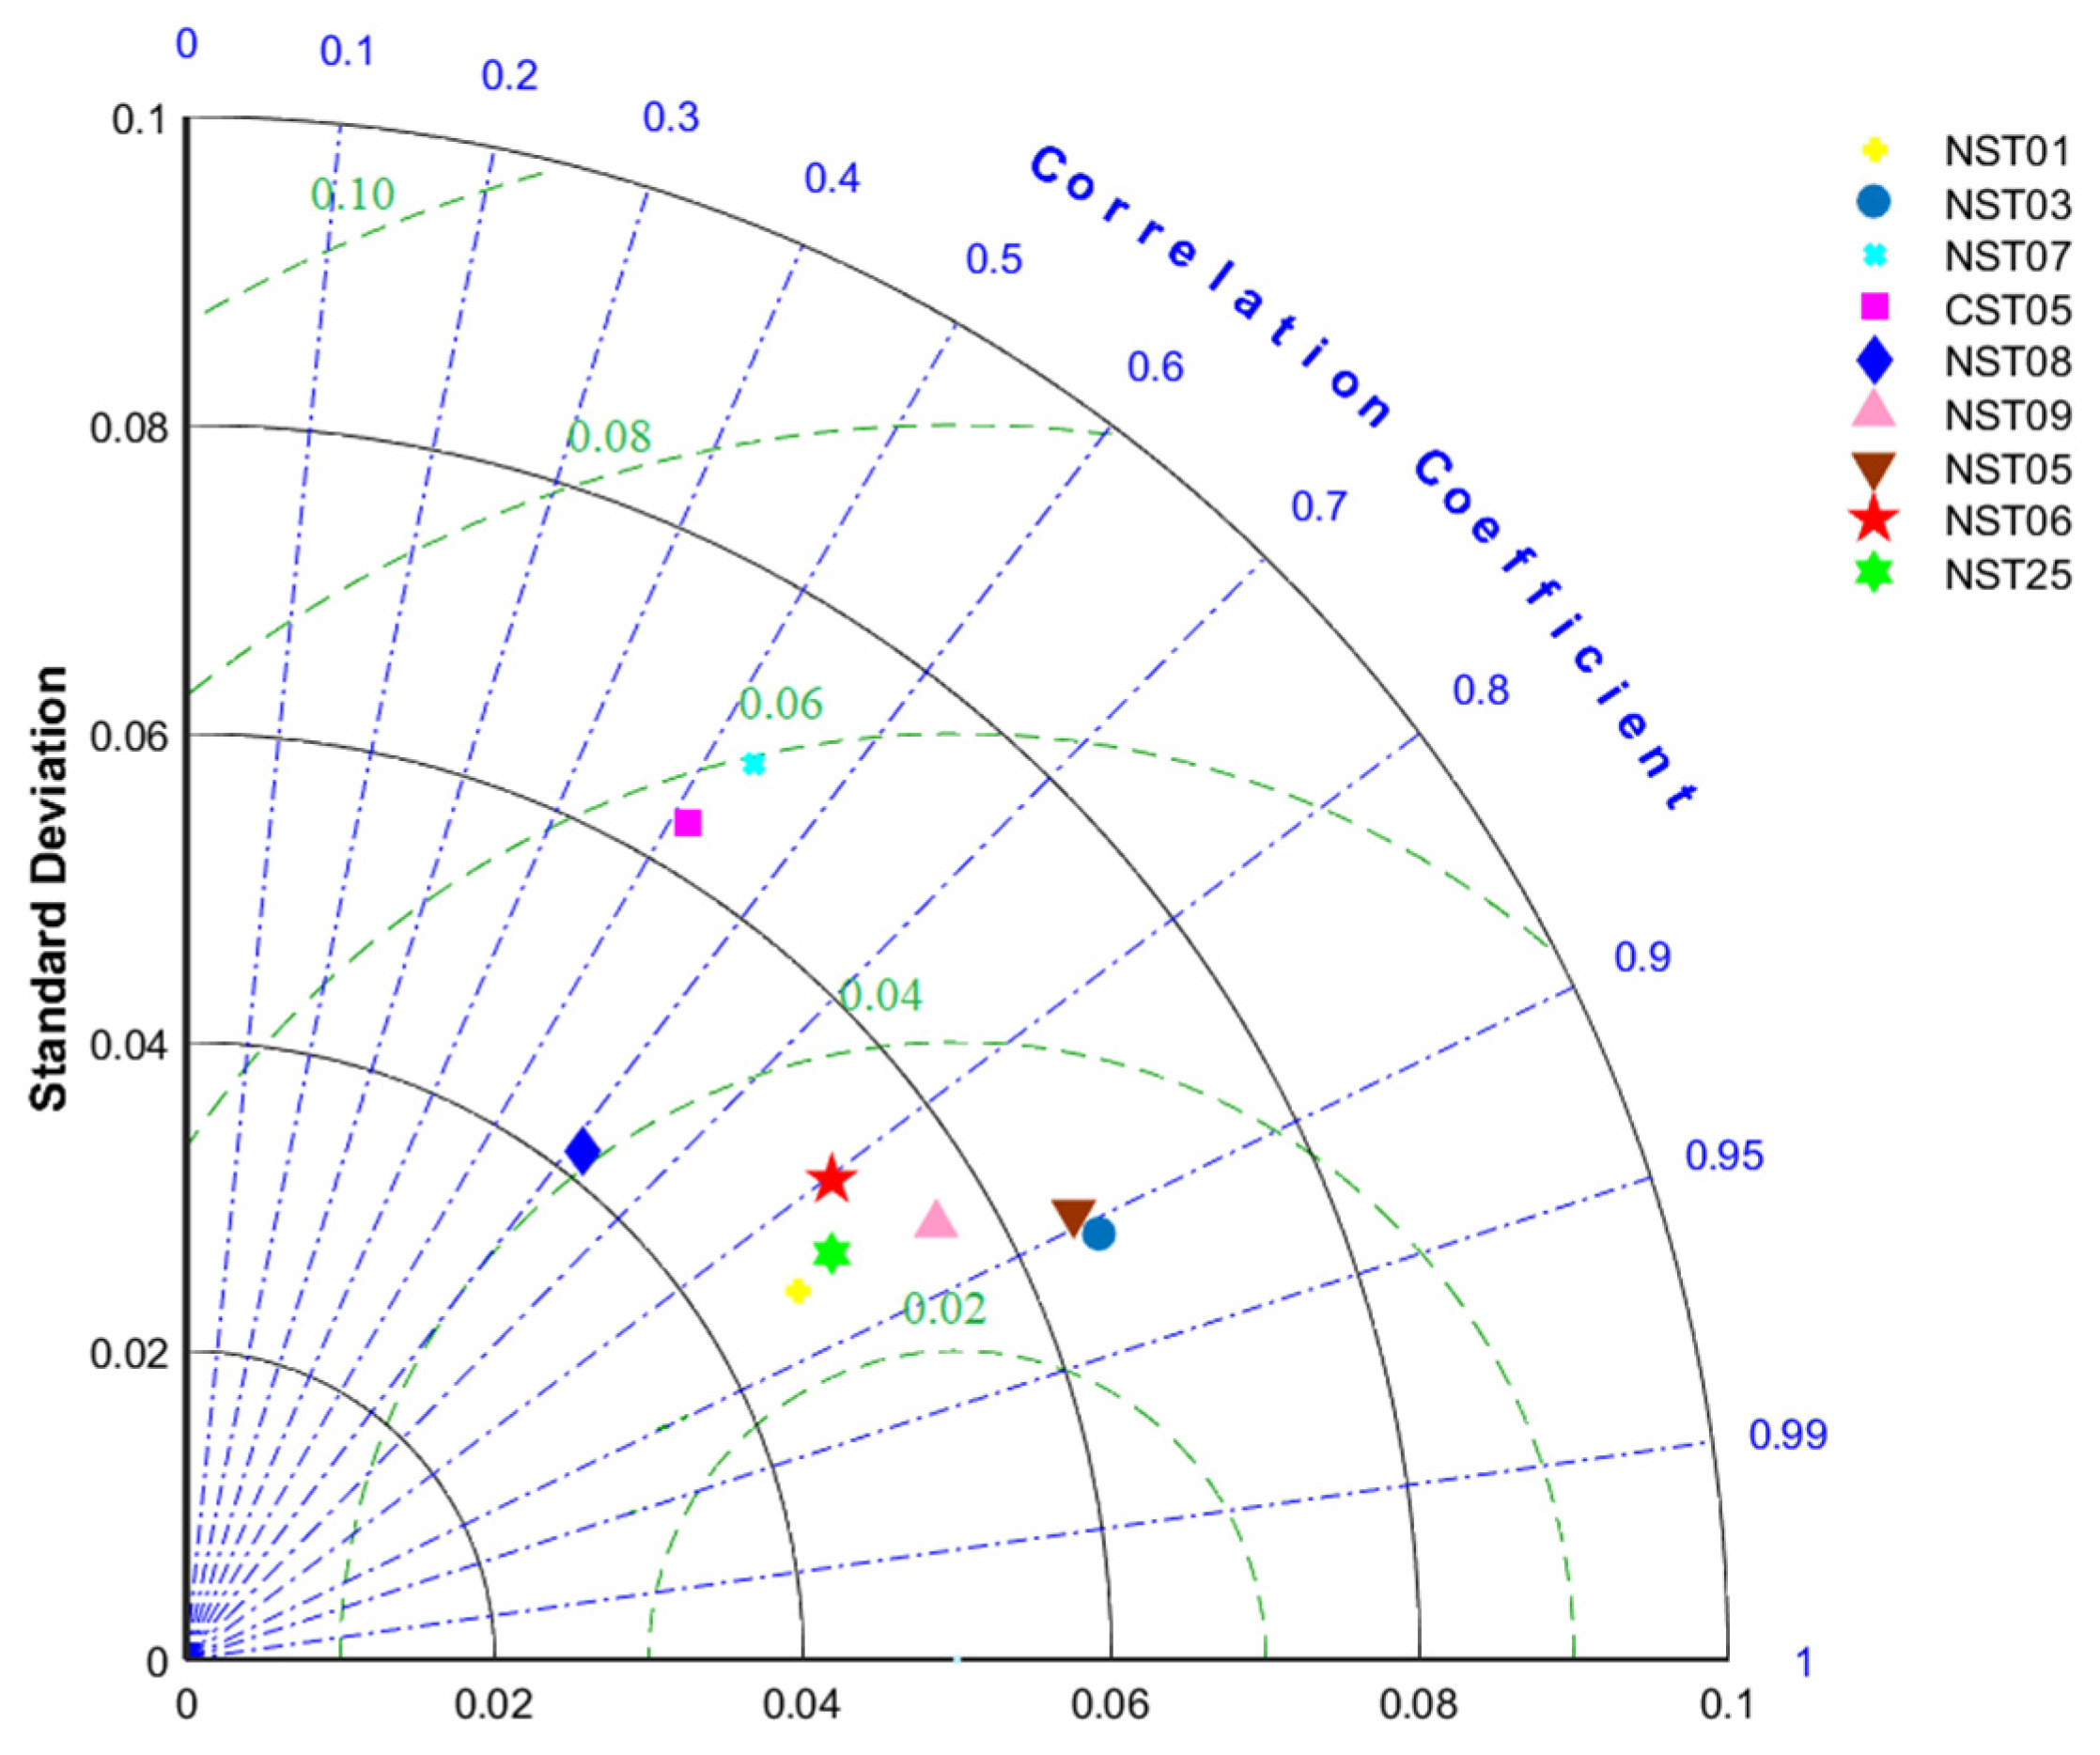
A Taylor diagram is a graphical tool used to compare the agreement between model simulation results and observational data, illustrating the bias and correlation of the model simulations in different directions. To evaluate the accuracy and differences between the random forest model predictions and the in situ measurement sites, we employed Taylor diagrams [62], which included three distinct statistical measures: correlation coefficient, standard deviation, and central root mean square error.
The trend analysis is a method of predicting the trend of change by using linear regression analysis on variables that change over time [63]. The fundamental assumption is that the change in data can be represented by a linear equation. To investigate the relationship between monthly soil moisture and temporal variables, we used univariate linear regression and the least squares method to fit the grid values of remote sensing image pixel by pixel. The formula we used for this calculation is as follows:
where is the regression slope, is the length of time, is the soil moisture, and is the time variable. When > 0, it means that the soil moisture of the pixel shows an increasing trend; otherwise, it shows a decreasing trend.
4. Results
4.1. Accuracy and Evaluation of the RF Prediction Model
4.1.1. Time-Series Validation
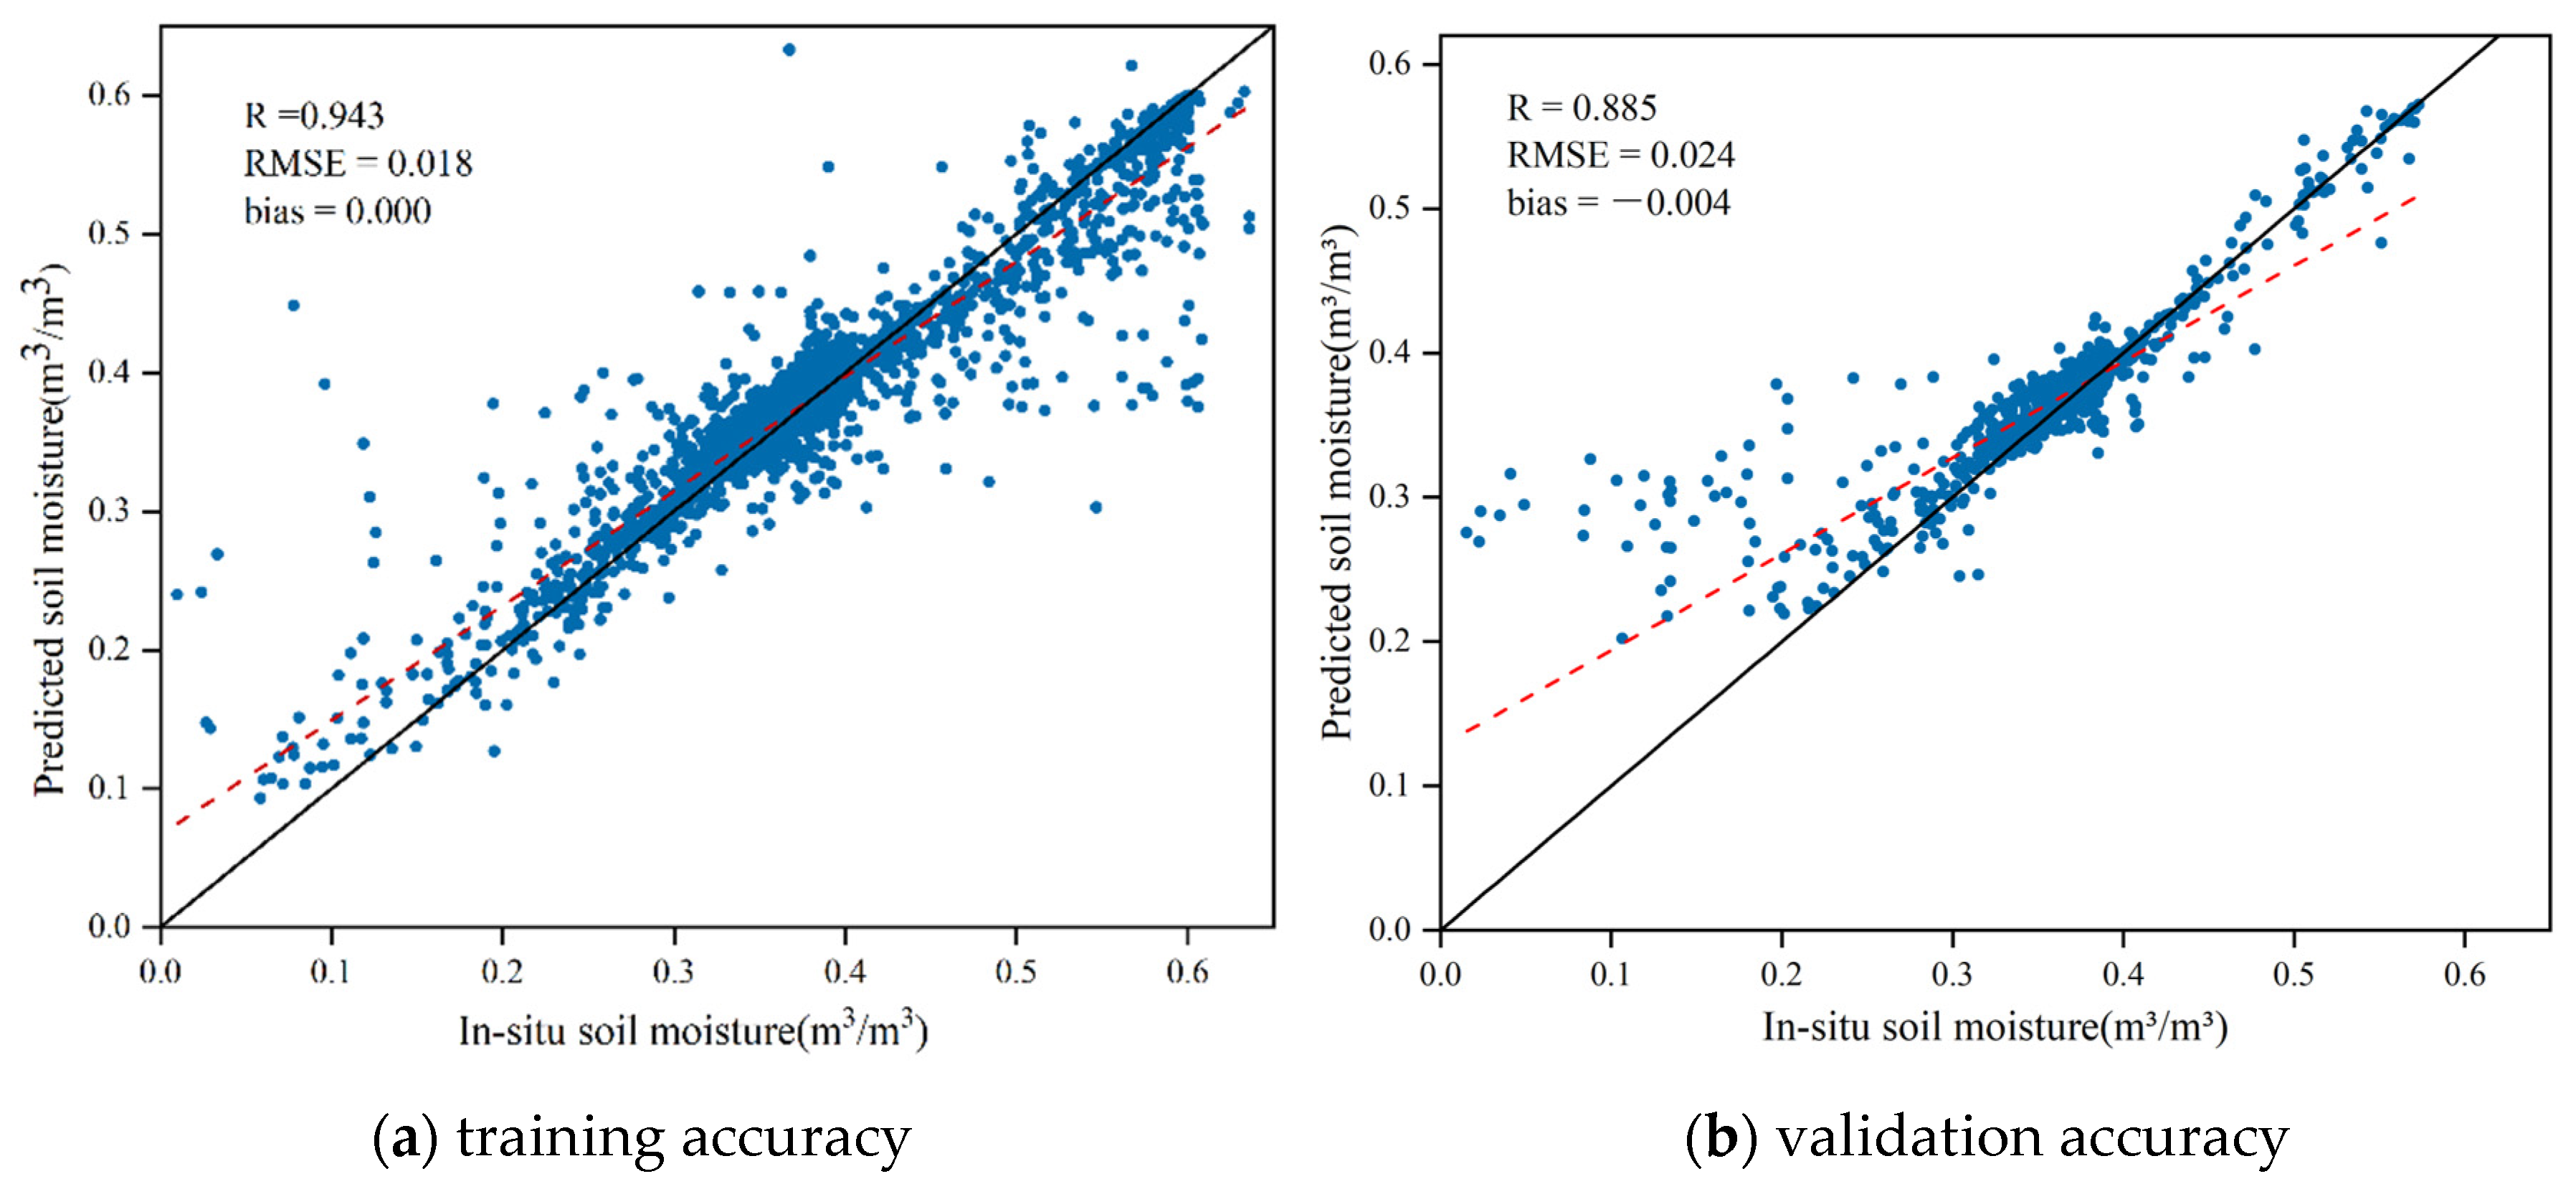
In this research, we used a mean synthesis method to transform 15-min original observation data from the Maqu network sites into monthly averages as in situ measurement data. Similarly, we applied the mean synthesis method to the SMCI soil moisture product to convert daily averages into monthly averages, and integrated them as the training target value. As shown in Figure 3a, the accuracy of the random forest model on the training set is highly satisfactory with a correlation coefficient (R) of 0.943, and a root mean square error (RMSE) of 0.018 m³/m³. The model’s performance was also validated and evaluated using the validation dataset, as shown in Figure 3b, with a R of 0.885, RMSE of 0.024 m³/m³, and bias of −0.004. The results indicate that the model is stable and has a good ability to predict soil moisture values, mainly concentrated in the range of 0.3 m³/m³–0.4 m³/m³. The performance of the random forest model exhibits some bias in regions of extreme soil moisture. Specifically, at low soil moisture levels with a small number of samples, the model tends to overestimate the value, while at high soil moisture levels, it exhibits a low state. Despite this, the overall evaluation of the random forest model demonstrated very good performance.
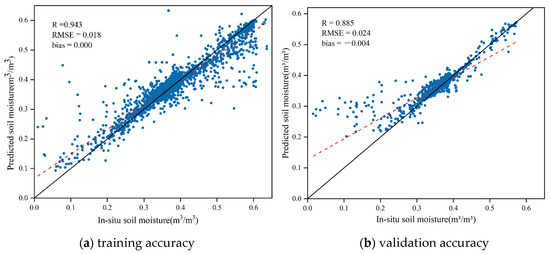
Figure 3.
Scatterplot of the comparison between random forest predictions and in situ measurements: (a) Illustrates the model’s accuracy on the training set; (b) shows the model’s accuracy on the validation set.
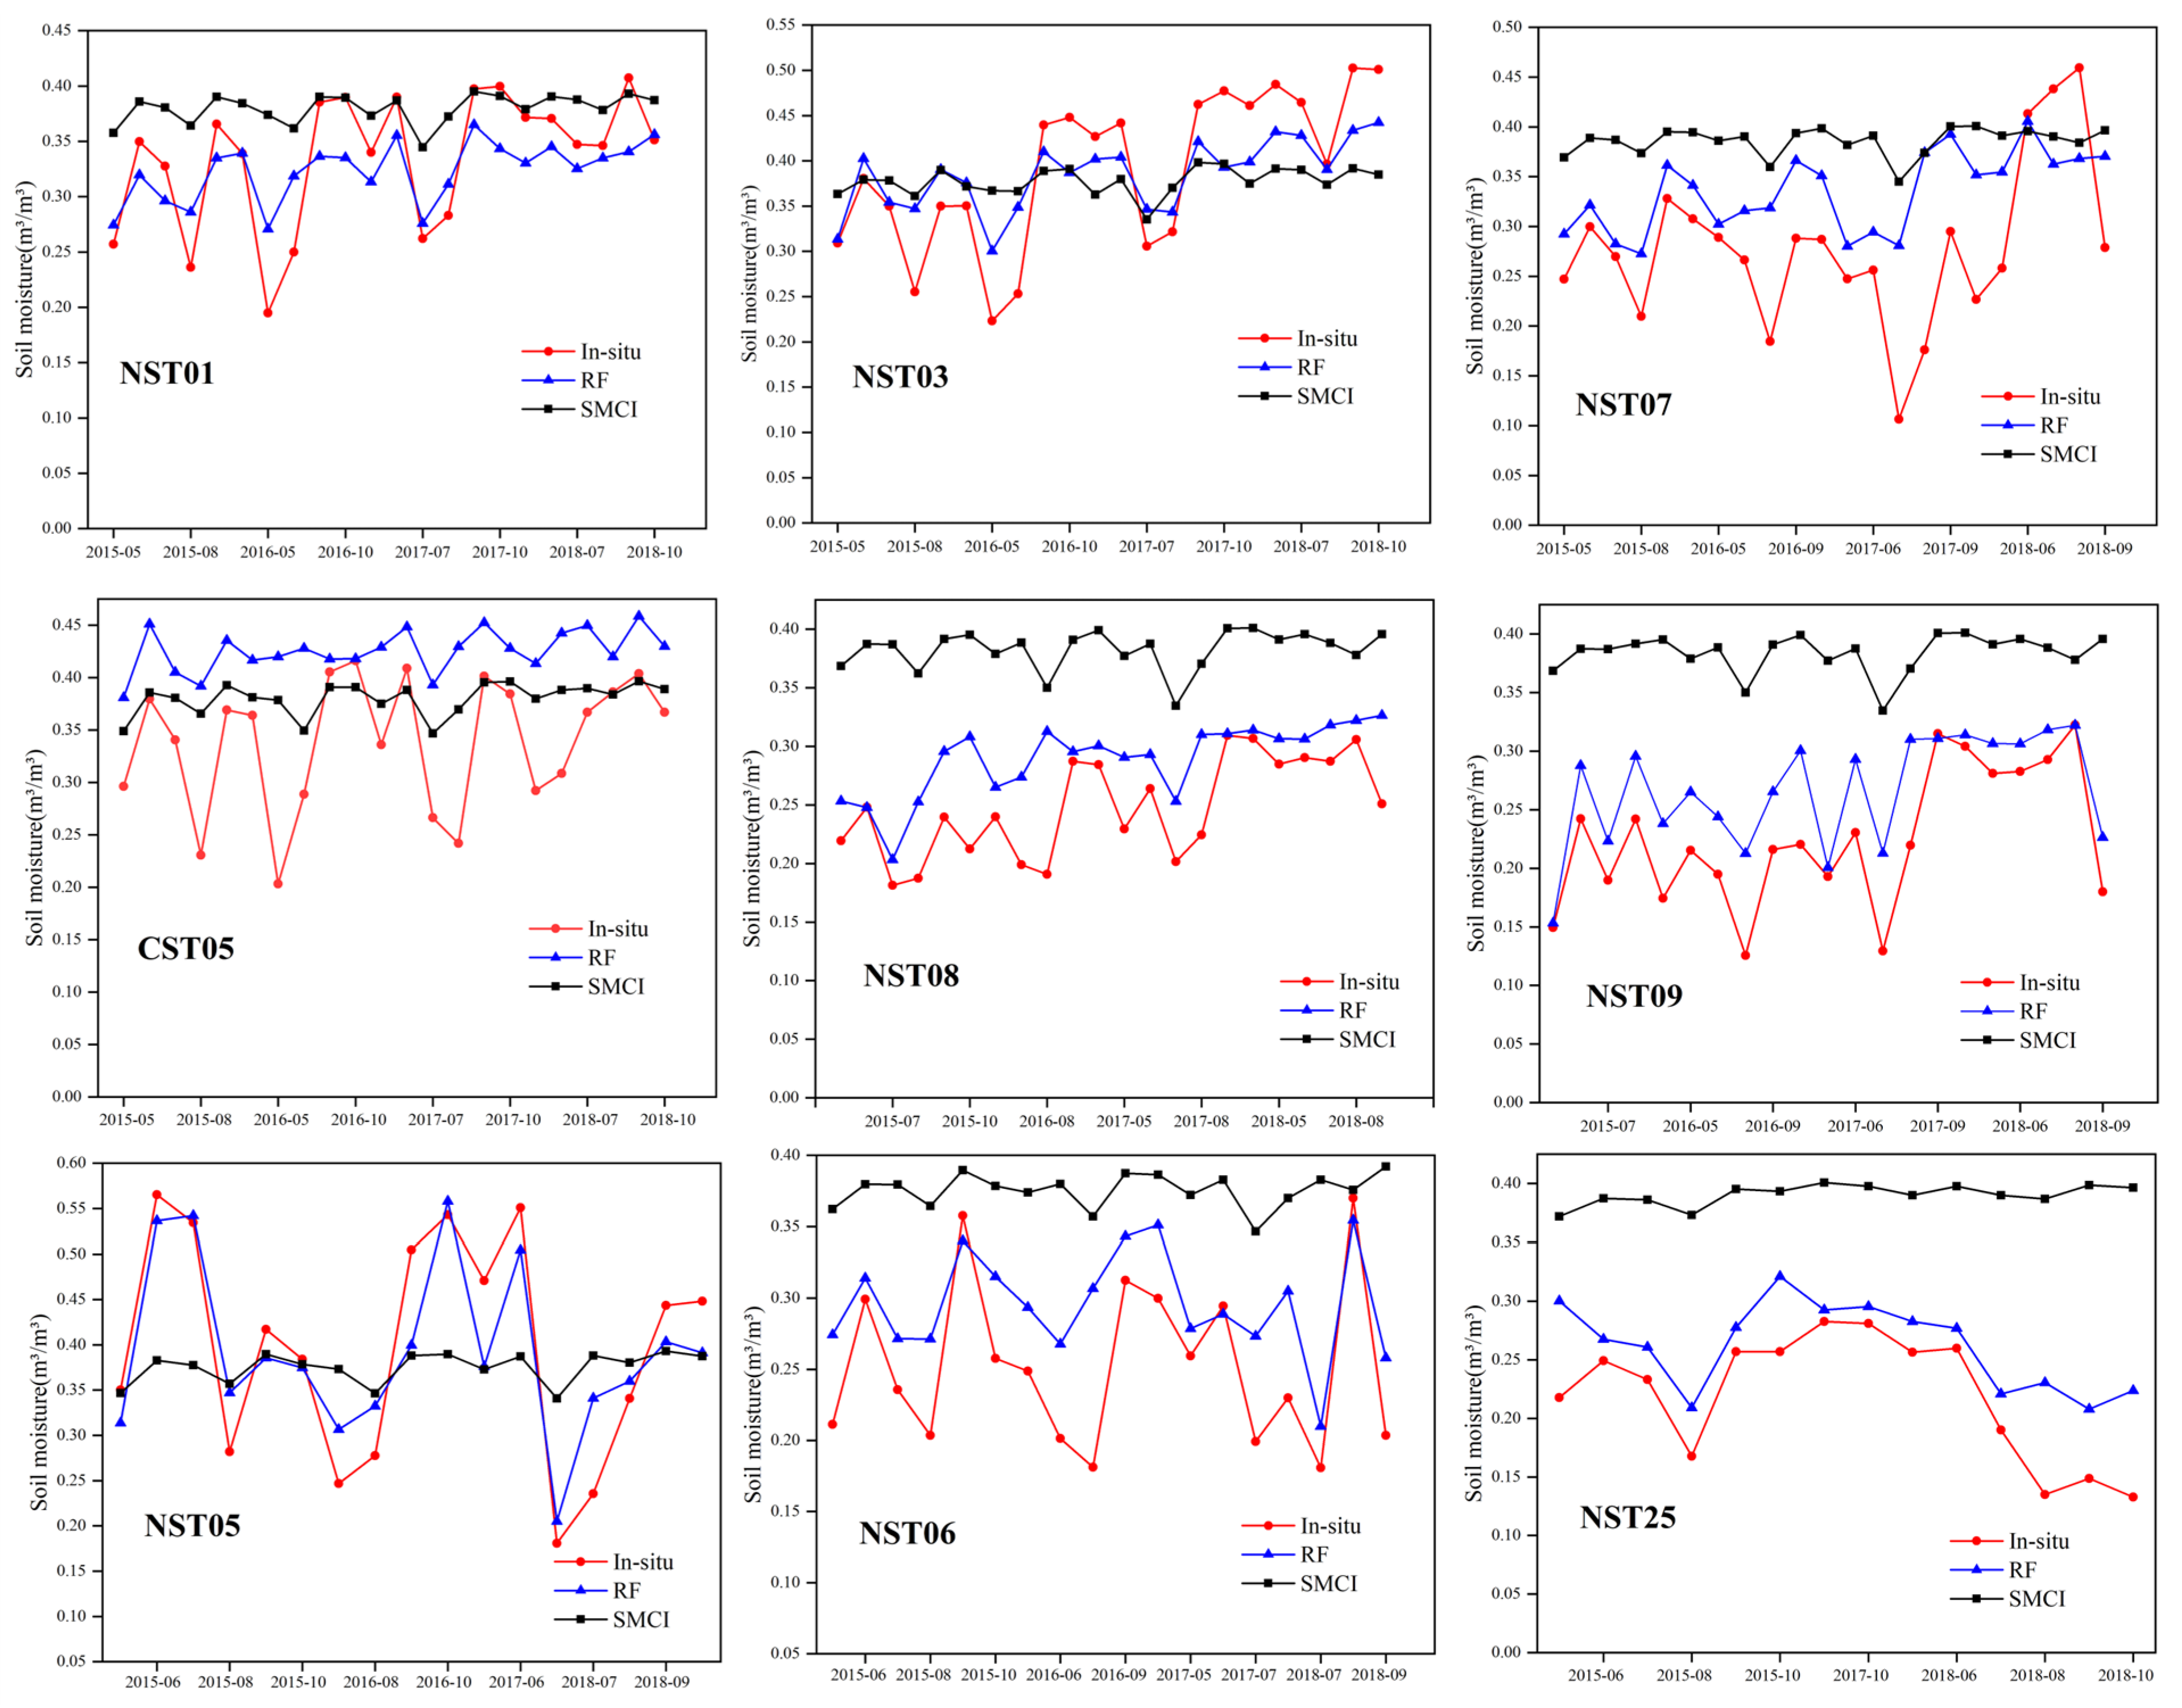
Due to the limitations of the in situ measurements, there were only nine sites with sufficient data for the current study period. We selected nine sites with sufficient in situ measurement data, namely NST01, NST03, NST05, NST06 NST07, NST08, NST09, NST25, and CST05, and compared the time-series changes of the in situ data, random forest (RF) prediction models, and SMCI soil moisture products. As shown in Figure 4, the study area is affected by terrain and climate factors, leading to significant fluctuations in ground measurement soil moisture. The RF prediction model performed well at the NST01, NST03, NST05, and NST09 stations, capturing changes in soil moisture data measured in the field more accurately. Furthermore, our model’s predicted values were found to be in closer agreement with field soil moisture than the SMCI soil moisture products. However, the overall performances of the remaining stations were unsatisfactory. Although the RF prediction value could capture the in situ data’s fluctuations, there were significant discrepancies in the values, especially in the high and low soil moisture range. This may be due to a bias in the training samples resulting from the lack of labels for a large range of high and low samples.
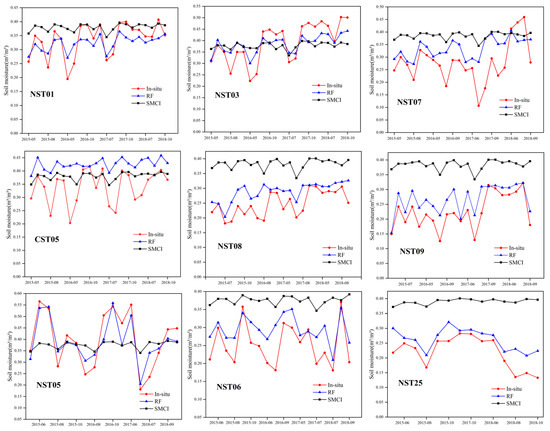
Figure 4.
Comparison of in situ measurements, SMCI, and the RF model predicted soil moisture time series from nine representative stations (NST01, NST03, NST07, CST05, NST08, NST09, NST05, NST06, and NST25) with relatively complete data from the Maqu observation network.
To further assess the predicted soil moisture performance by RF, we utilized Taylor diagrams to display the error statistical analysis of the in situ measurement sites in Figure 4. Taylor diagrams are useful visual tools that can simultaneously exhibit three indicators, namely standard deviation, root mean square error, and correlation coefficient. By extension, a Taylor diagram can be extended to applications that require a two-dimensional plane to present three-dimensional data. As illustrated in Figure 5, the performances of four sites (NST01, NST03, NST05, and NST09) were relatively good, with R values ranging between 0.80 and 0.90, RMSE values ranging between 0.02 m³/m³ and 0.04 m³/m³, and standard deviations between 0.04 and 0.06. However, the error statistics for the remaining sites are larger in the Taylor plots. The Maqu observation network is located in a cold and humid area covered by short grasses, which exacerbates the challenges in accurately estimating soil moisture during this transitional period between the freezing and nonfreezing seasons.
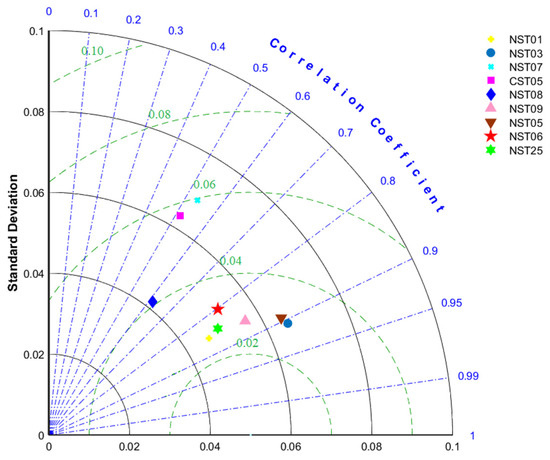
Figure 5.
Taylor plots further show a comparison of the accuracy of in situ measurements and random forest predictions of soil moisture at nine relatively independent and complete measured sites (NST01, NST03, NST07, CST05, NST08, NST09, NST05, NST06, and NST25).
4.1.2. Importance of Parameter Variables
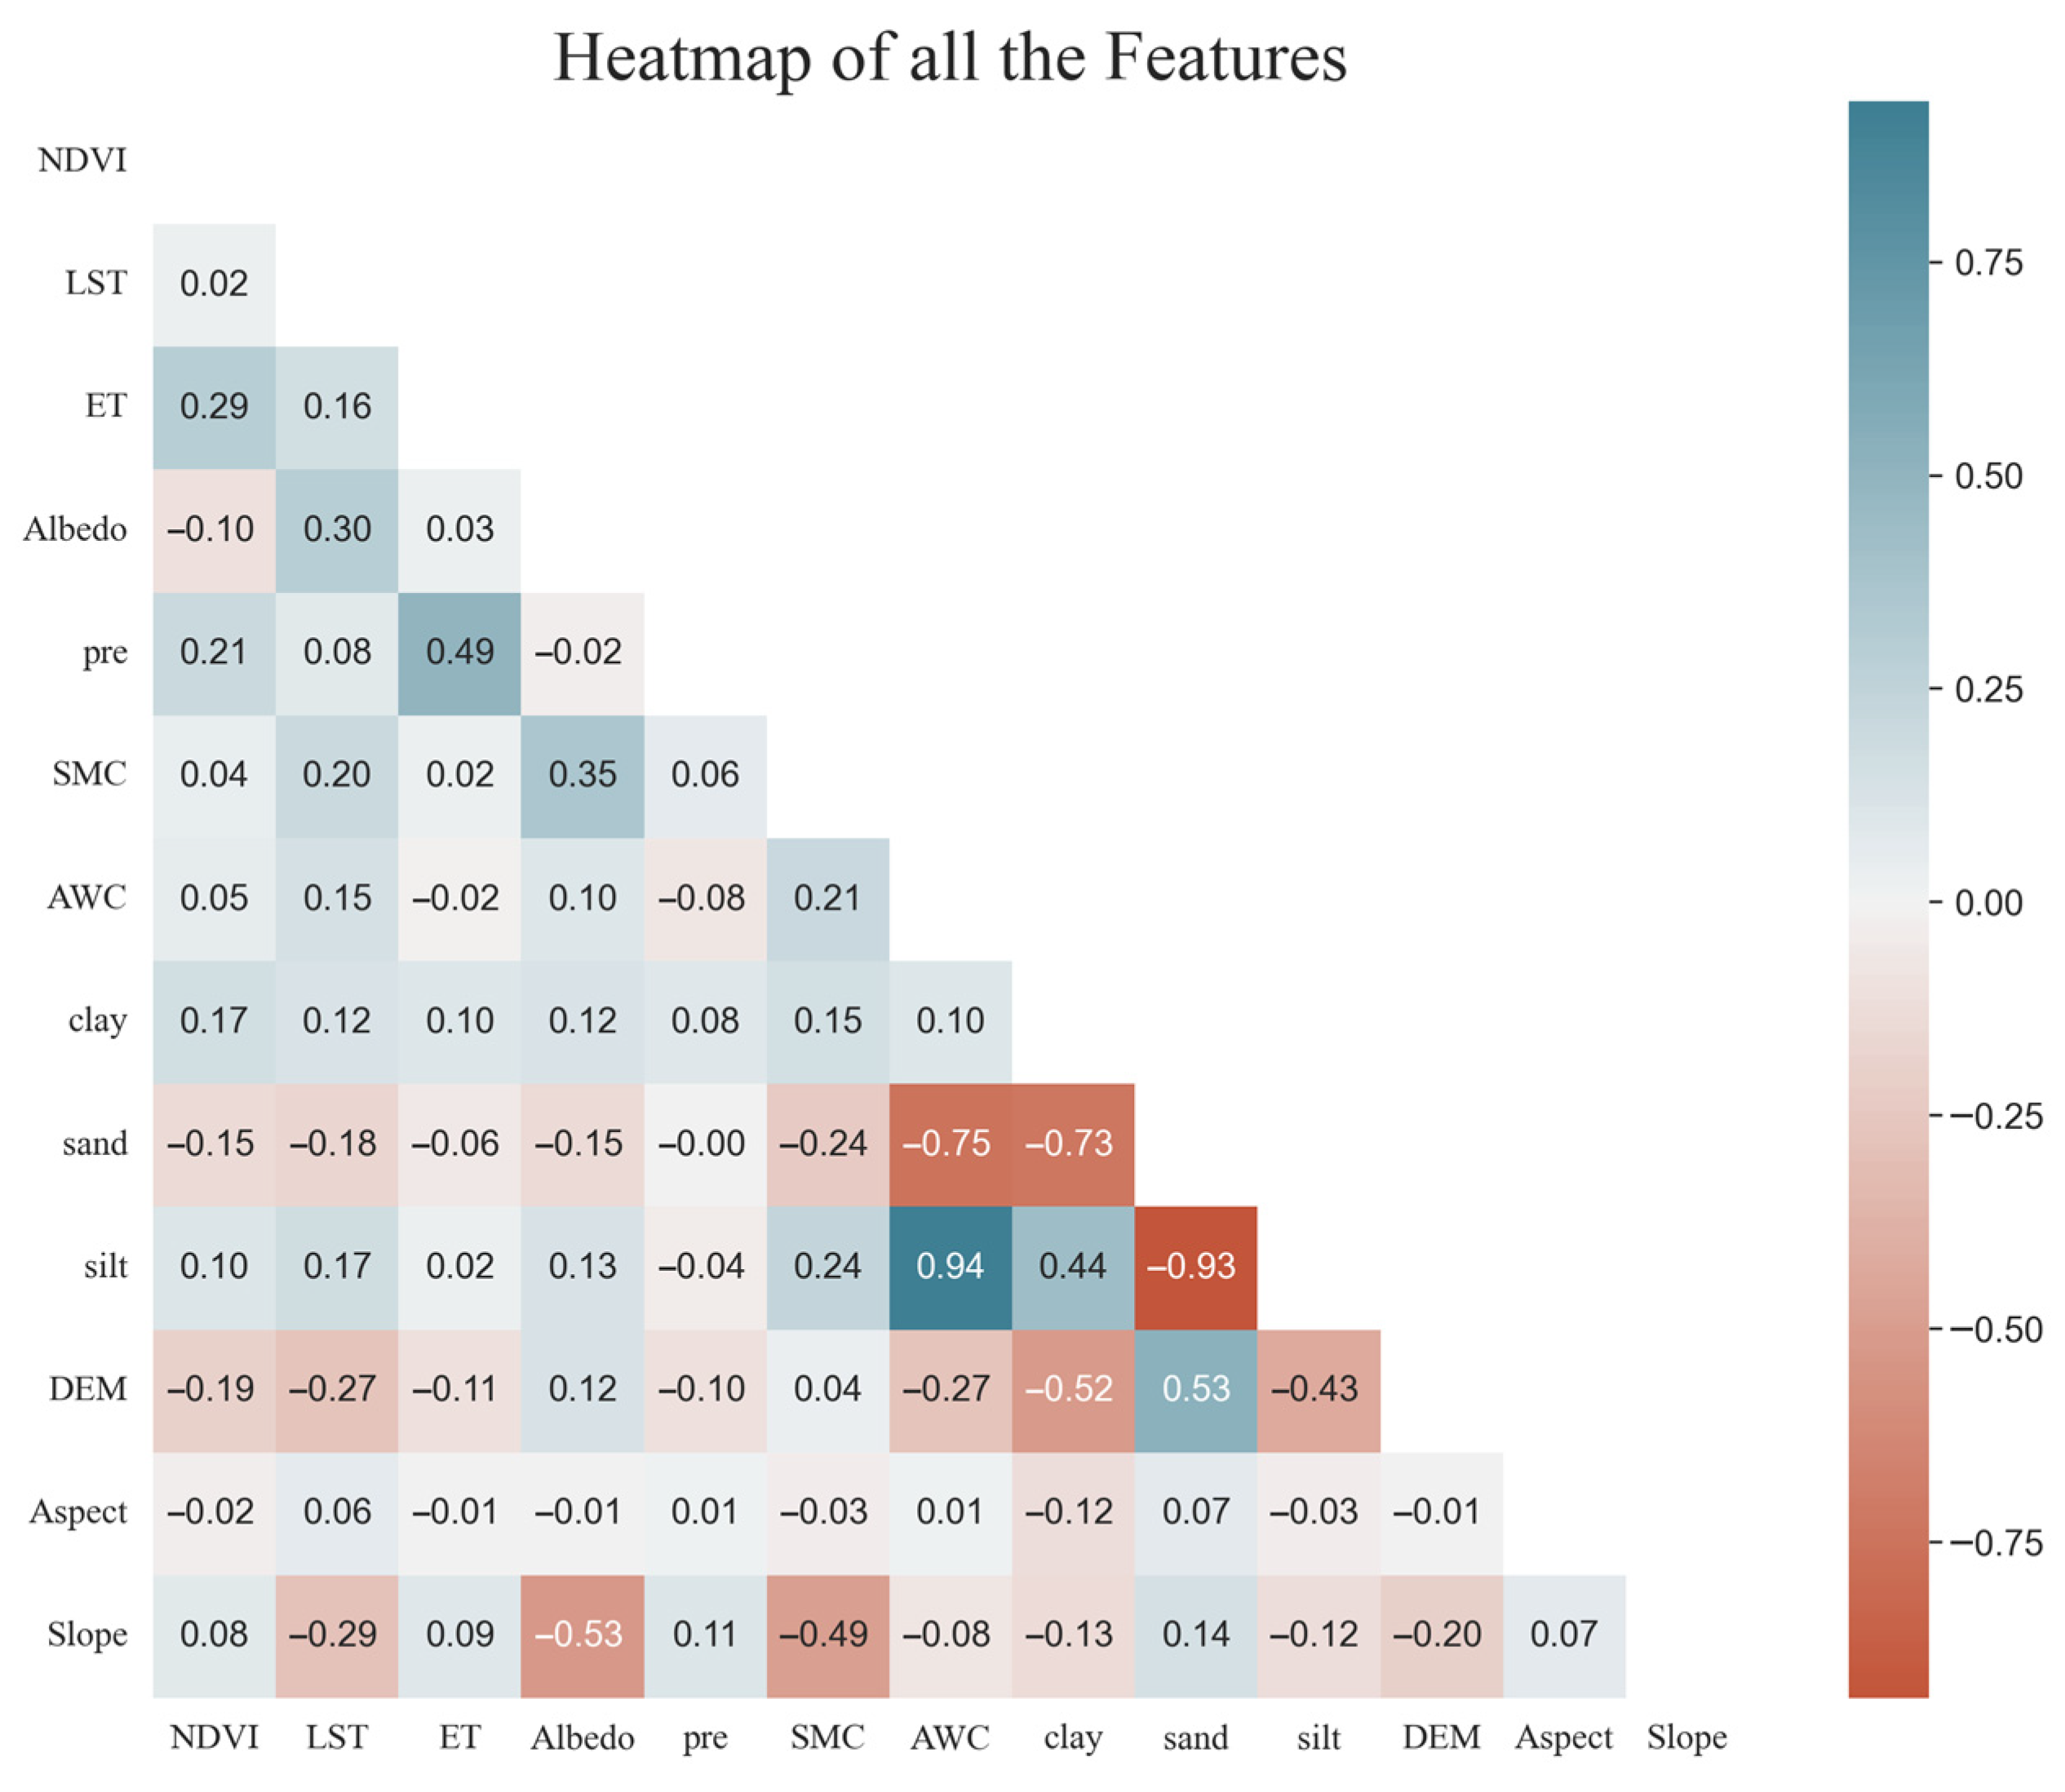
To evaluate the correlations between the independent variables in the RF model, we used the Pearson correlation coefficient. As illustrated in Figure 6, there is a strong negative correlation between the characteristics of soil texture such as sand and silt (−0.93), clay and sand (−0.73), with correlation coefficient values surpassing −0.7. In general, there is a high positive correlation between individual MODIS product data (NDVI, LST, ET, and albedo). There is a correlation coefficient of 0.3 between the land surface temperature (LST) and albedo. Additionally, the correlation coefficient between the normalized difference vegetation index (NDVI) and evapotranspiration (ET) is 0.29. It is worth noting that there exists a robust association between evapotranspiration (ET) and precipitation (pre), as indicated by a correlation coefficient of 0.49.
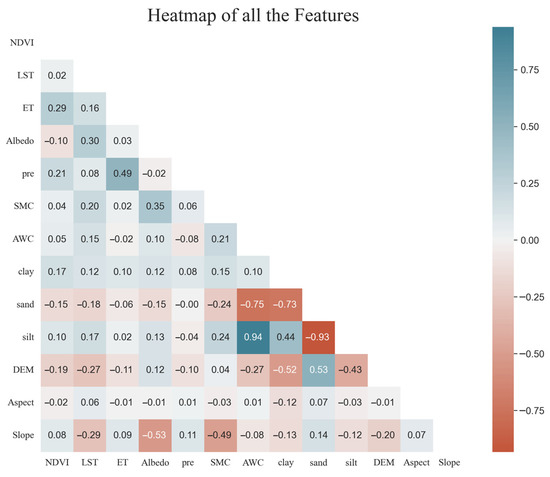
Figure 6.
Pearson’s correlation heatmap for all independent variables of the RF model.
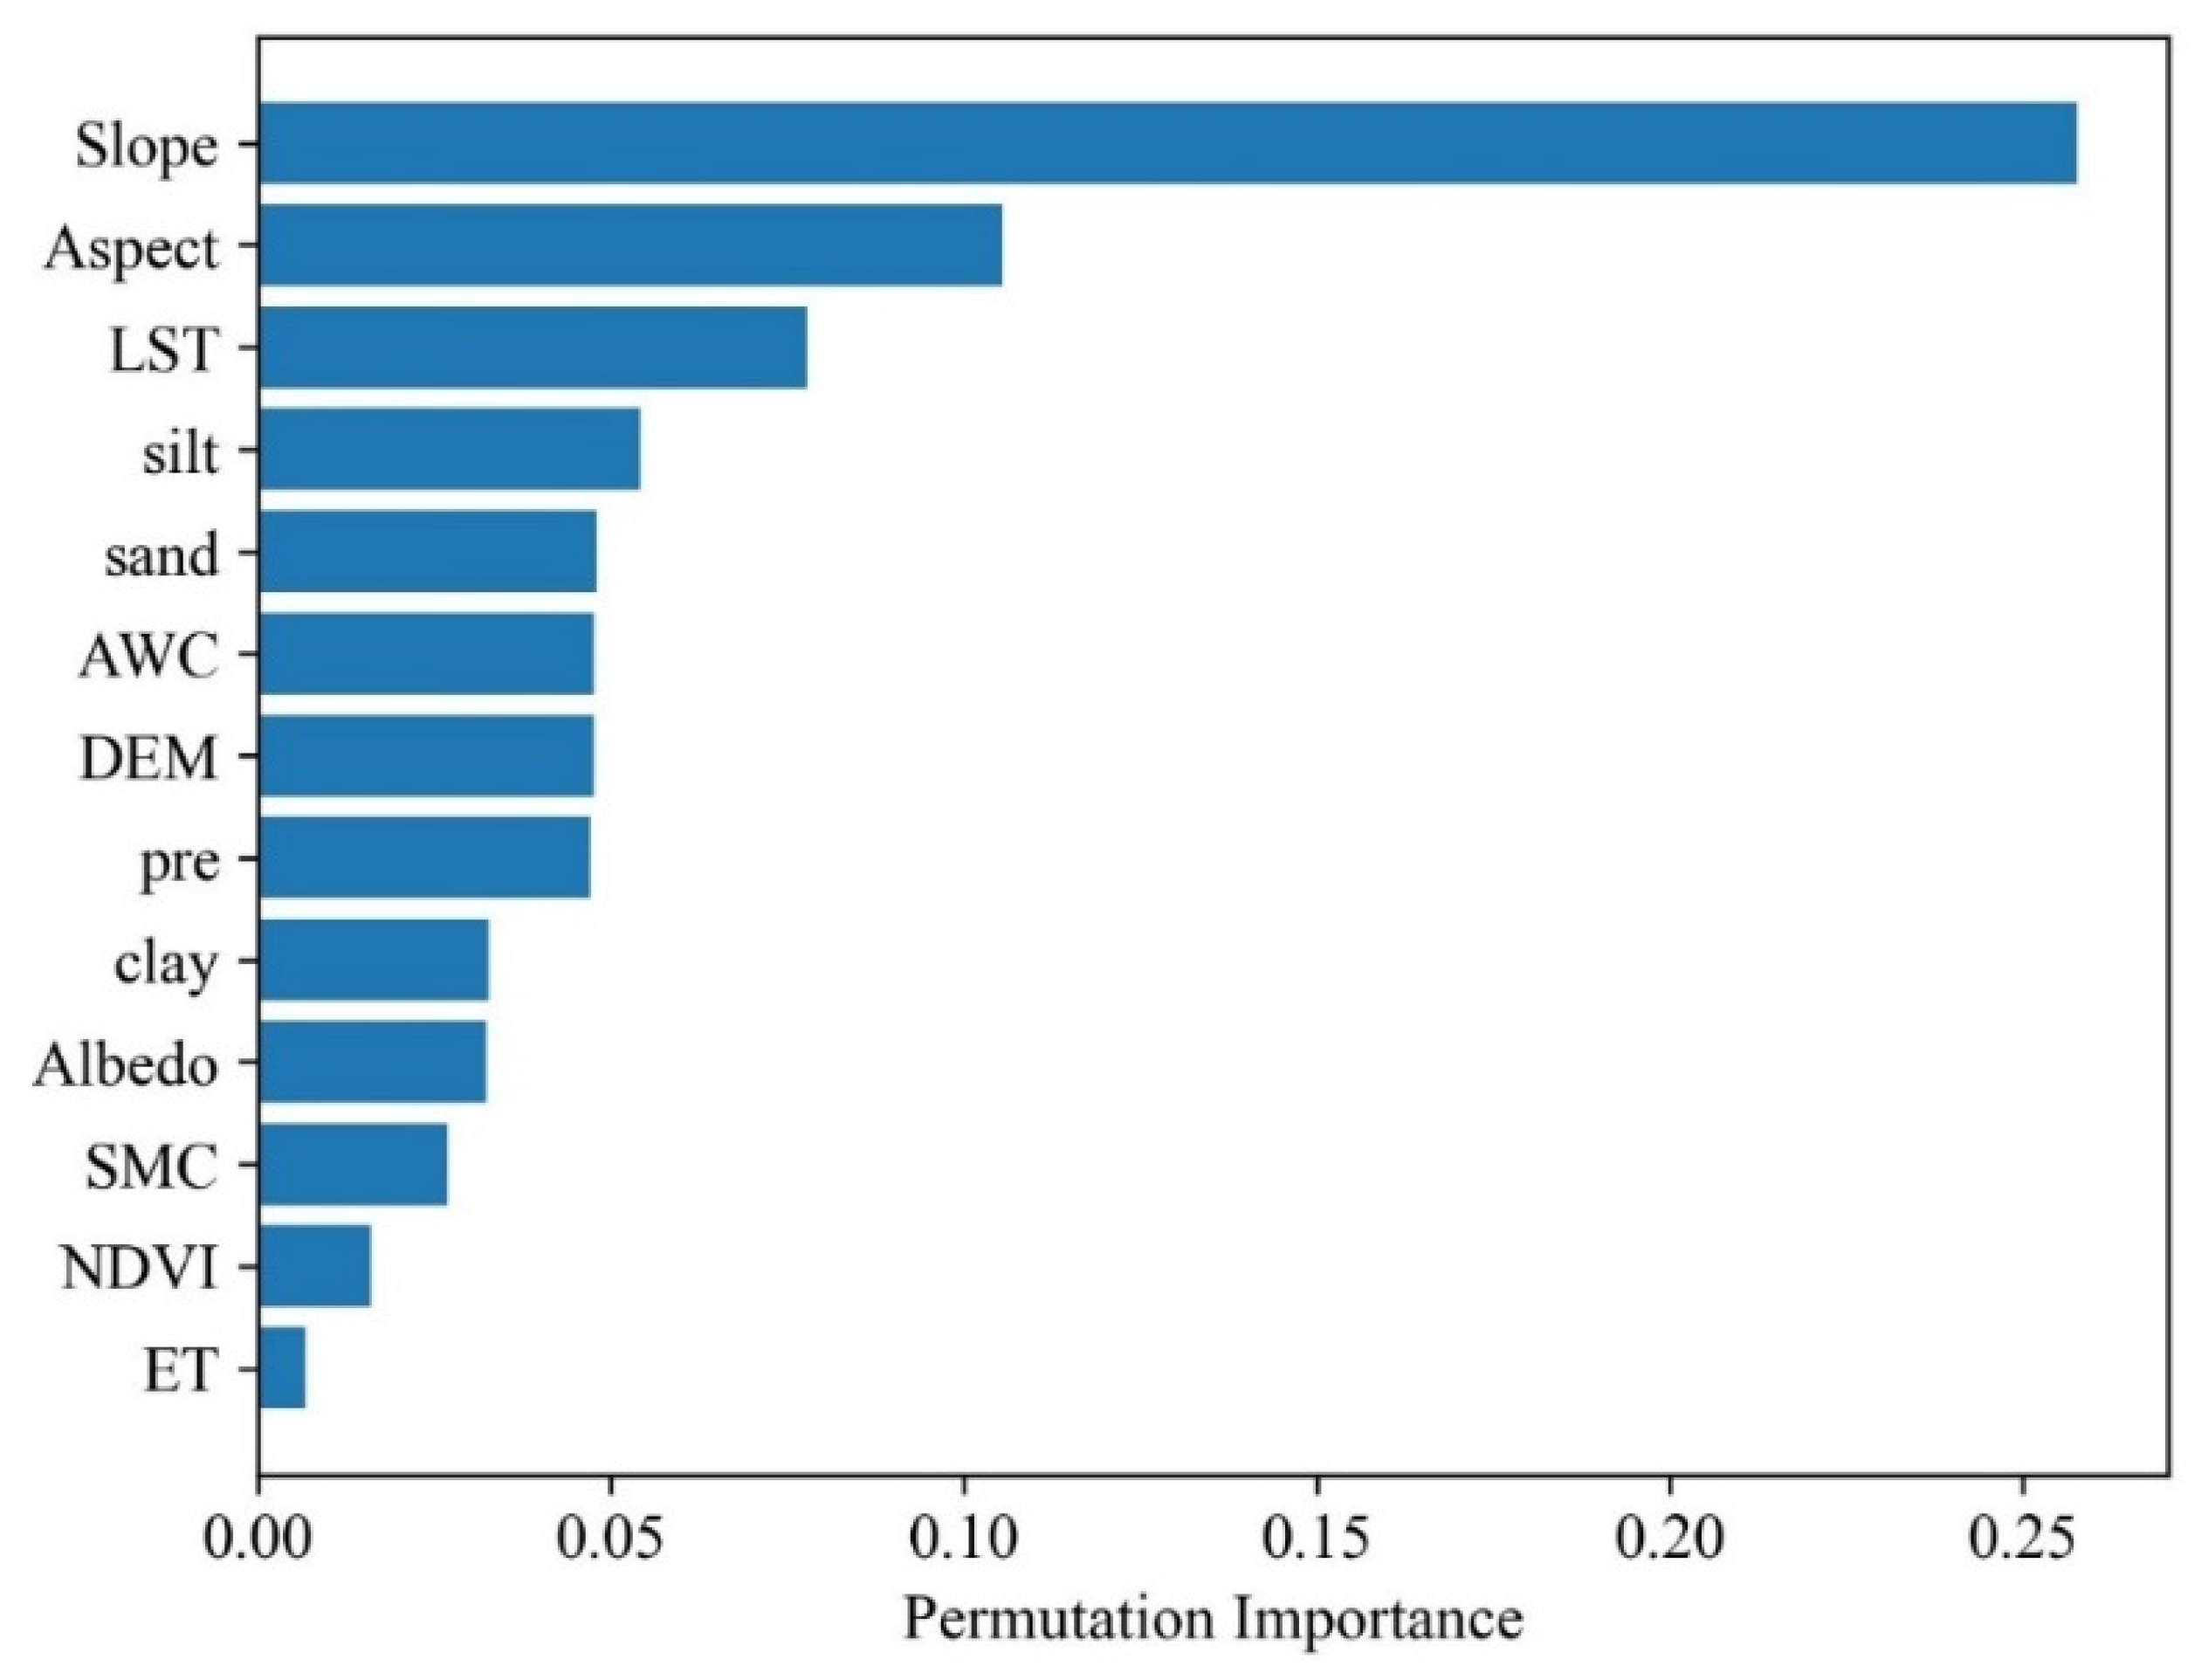
To further analyze the importance of different variables, we used the permutation importance method, as shown in Figure 7. The permutation importance method was used to determine the significance of different variables in the RF model by evaluating the decrease in model performance when individual feature values were randomly shuffled. This is a model-independent method that and can be repeatedly computed with different combinations of features on the hold-out test set [64]. The results show that fine-scale topographic data (slope and aspect) have the highest level of importance, followed by soil texture data (silt and sand) in the RF model. This suggests that fine-scale topographic and soil texture information are crucial in generating high-precision soil moisture data. In contrast, NDVI and ET data played a minimal role in the soil moisture retrieval process. Additionally, the importance of the SMC soil moisture product was also low, which may be attributed to its coarser spatial resolution. It is worth noting that LST ranked third and that we also considered the effect of surface temperature when selecting the nonfreezing period for our analysis.
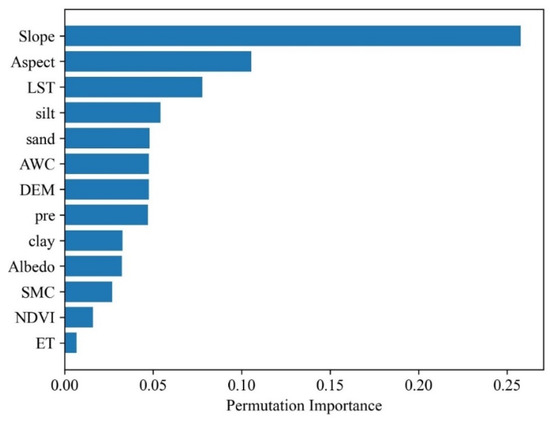
Figure 7.
Permutation-based feature importance results for RF models.
4.1.3. Spatial Pattern Comparison
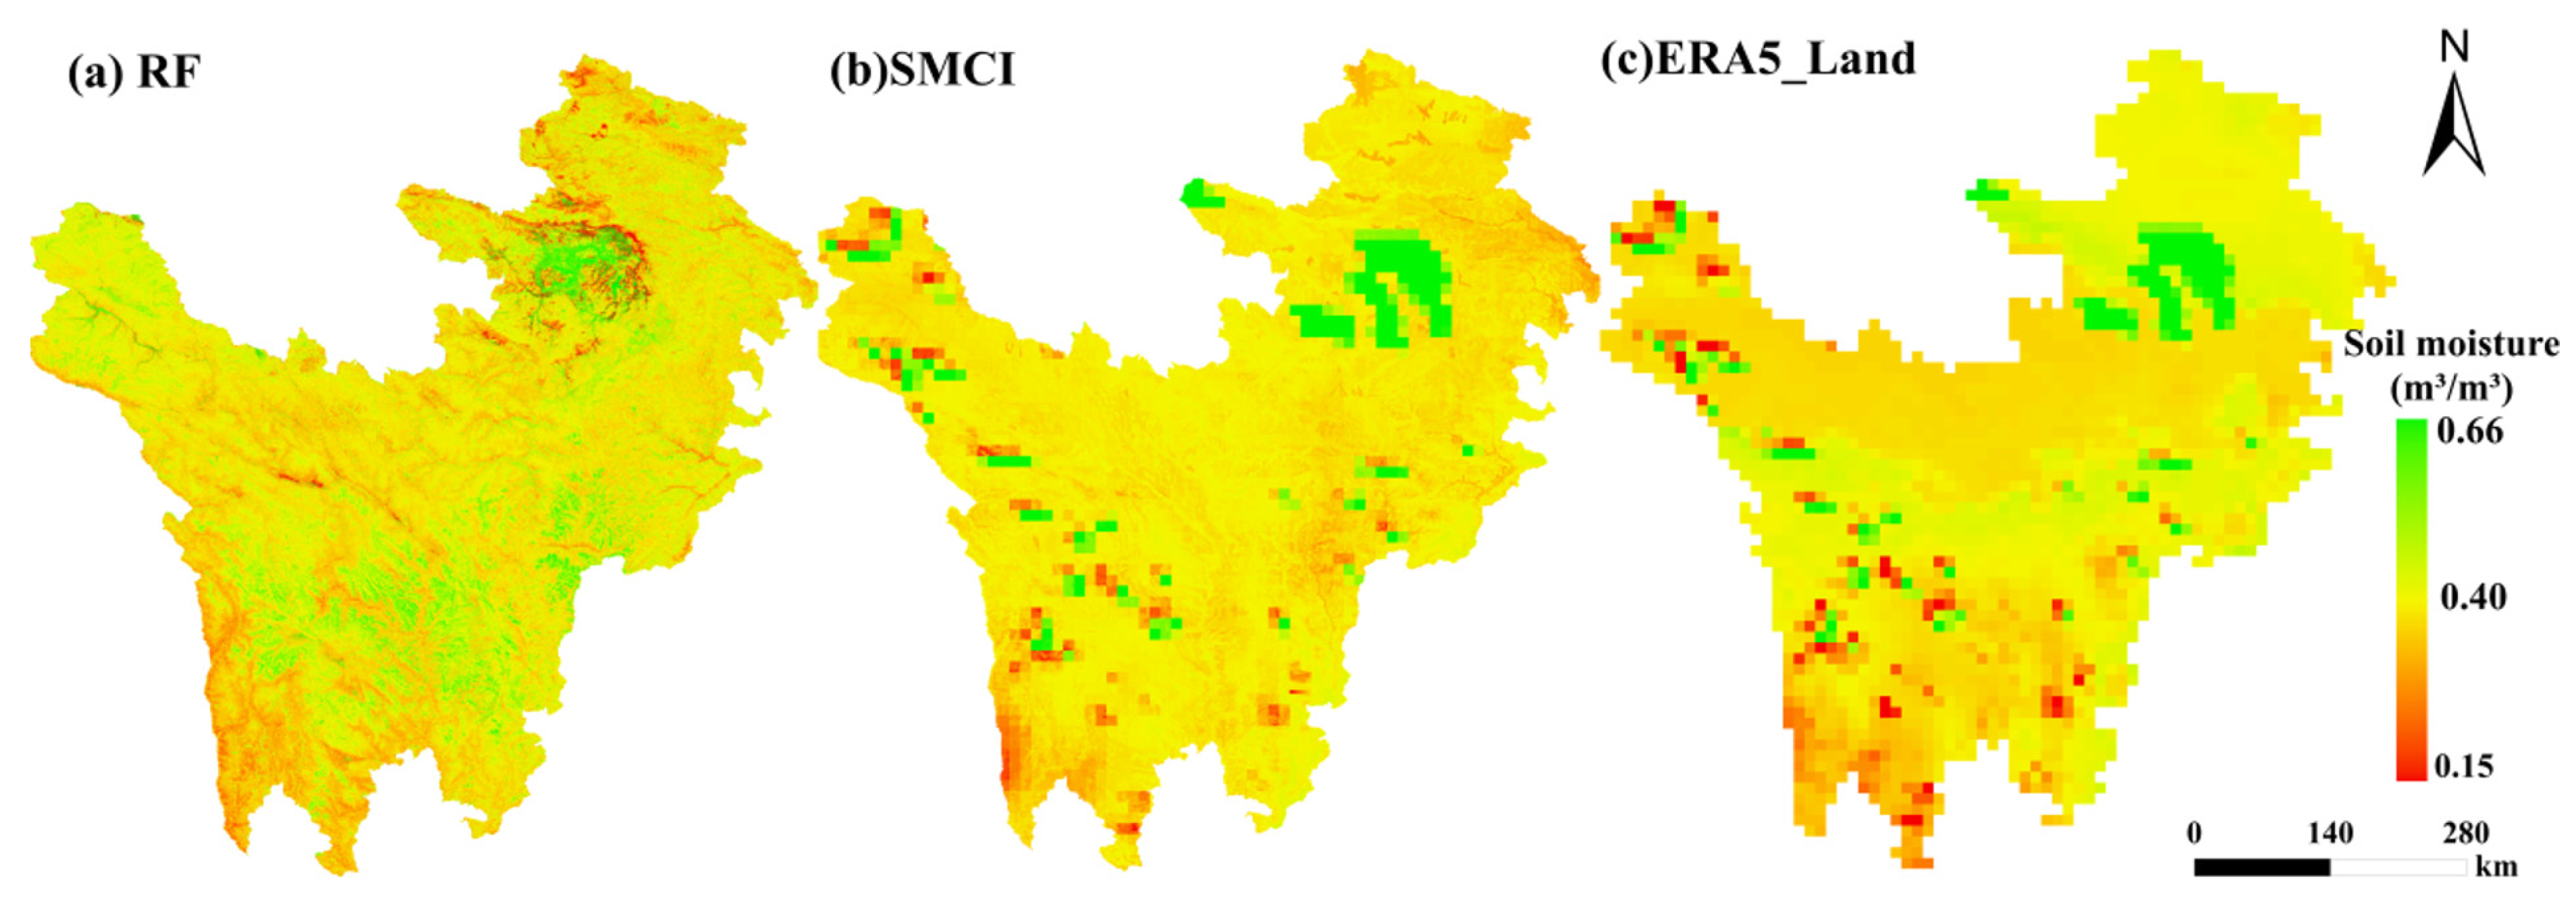
In this study, we present the spatial distribution of soil moisture from the Random Forest model compared with the SMCI and ERA5_Land soil moisture products in 2018 (Figure 8). The SMCI soil moisture product has a spatial resolution of 1 km, and the ERA5_Land soil moisture product has a spatial resolution of 0.1°. The results of the study found that these three products have similar spatial patterns of soil moisture. The soil moisture content within the study area exhibits significant variation, ranging from 0.15 m³/m³ to 0.66 m³/m³. High soil moisture values are mainly distributed in areas with dense vegetation coverage, such as river valleys, wetlands, and other low-lying areas. The coarse-resolution soil moisture products have many noise points in the extreme soil moisture regions, while the Random Forest model product has better spatial continuity. The prediction outputs of the RF model are generally smoother, more stable, less noisy, and reflect more detailed regional soil moisture information since random forest has a good tolerance to outliers and noise. Although there is an overestimation in some regions, the results provide a more detailed and fine-resolution spatial distribution of soil moisture compared to the coarser resolution products.
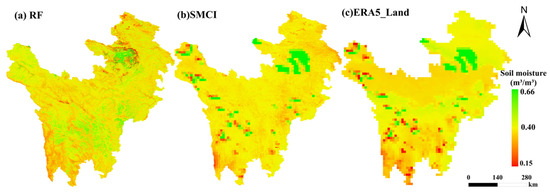
Figure 8.
Spatial analysis of random forest compared with SMCI and ERA5_Land soil moisture products in 2018: (a) Shows the RF result map with a spatial resolution of 250 m; (b) illustrates the SMCI soil moisture product map with a spatial resolution of 1 km; (c) presents the product image of ERA5_Land at a spatial resolution of 0.1°.
4.2. Analysis of Spatial and Temporal Variation of Soil Moisture
4.2.1. Inter-Annual Variation
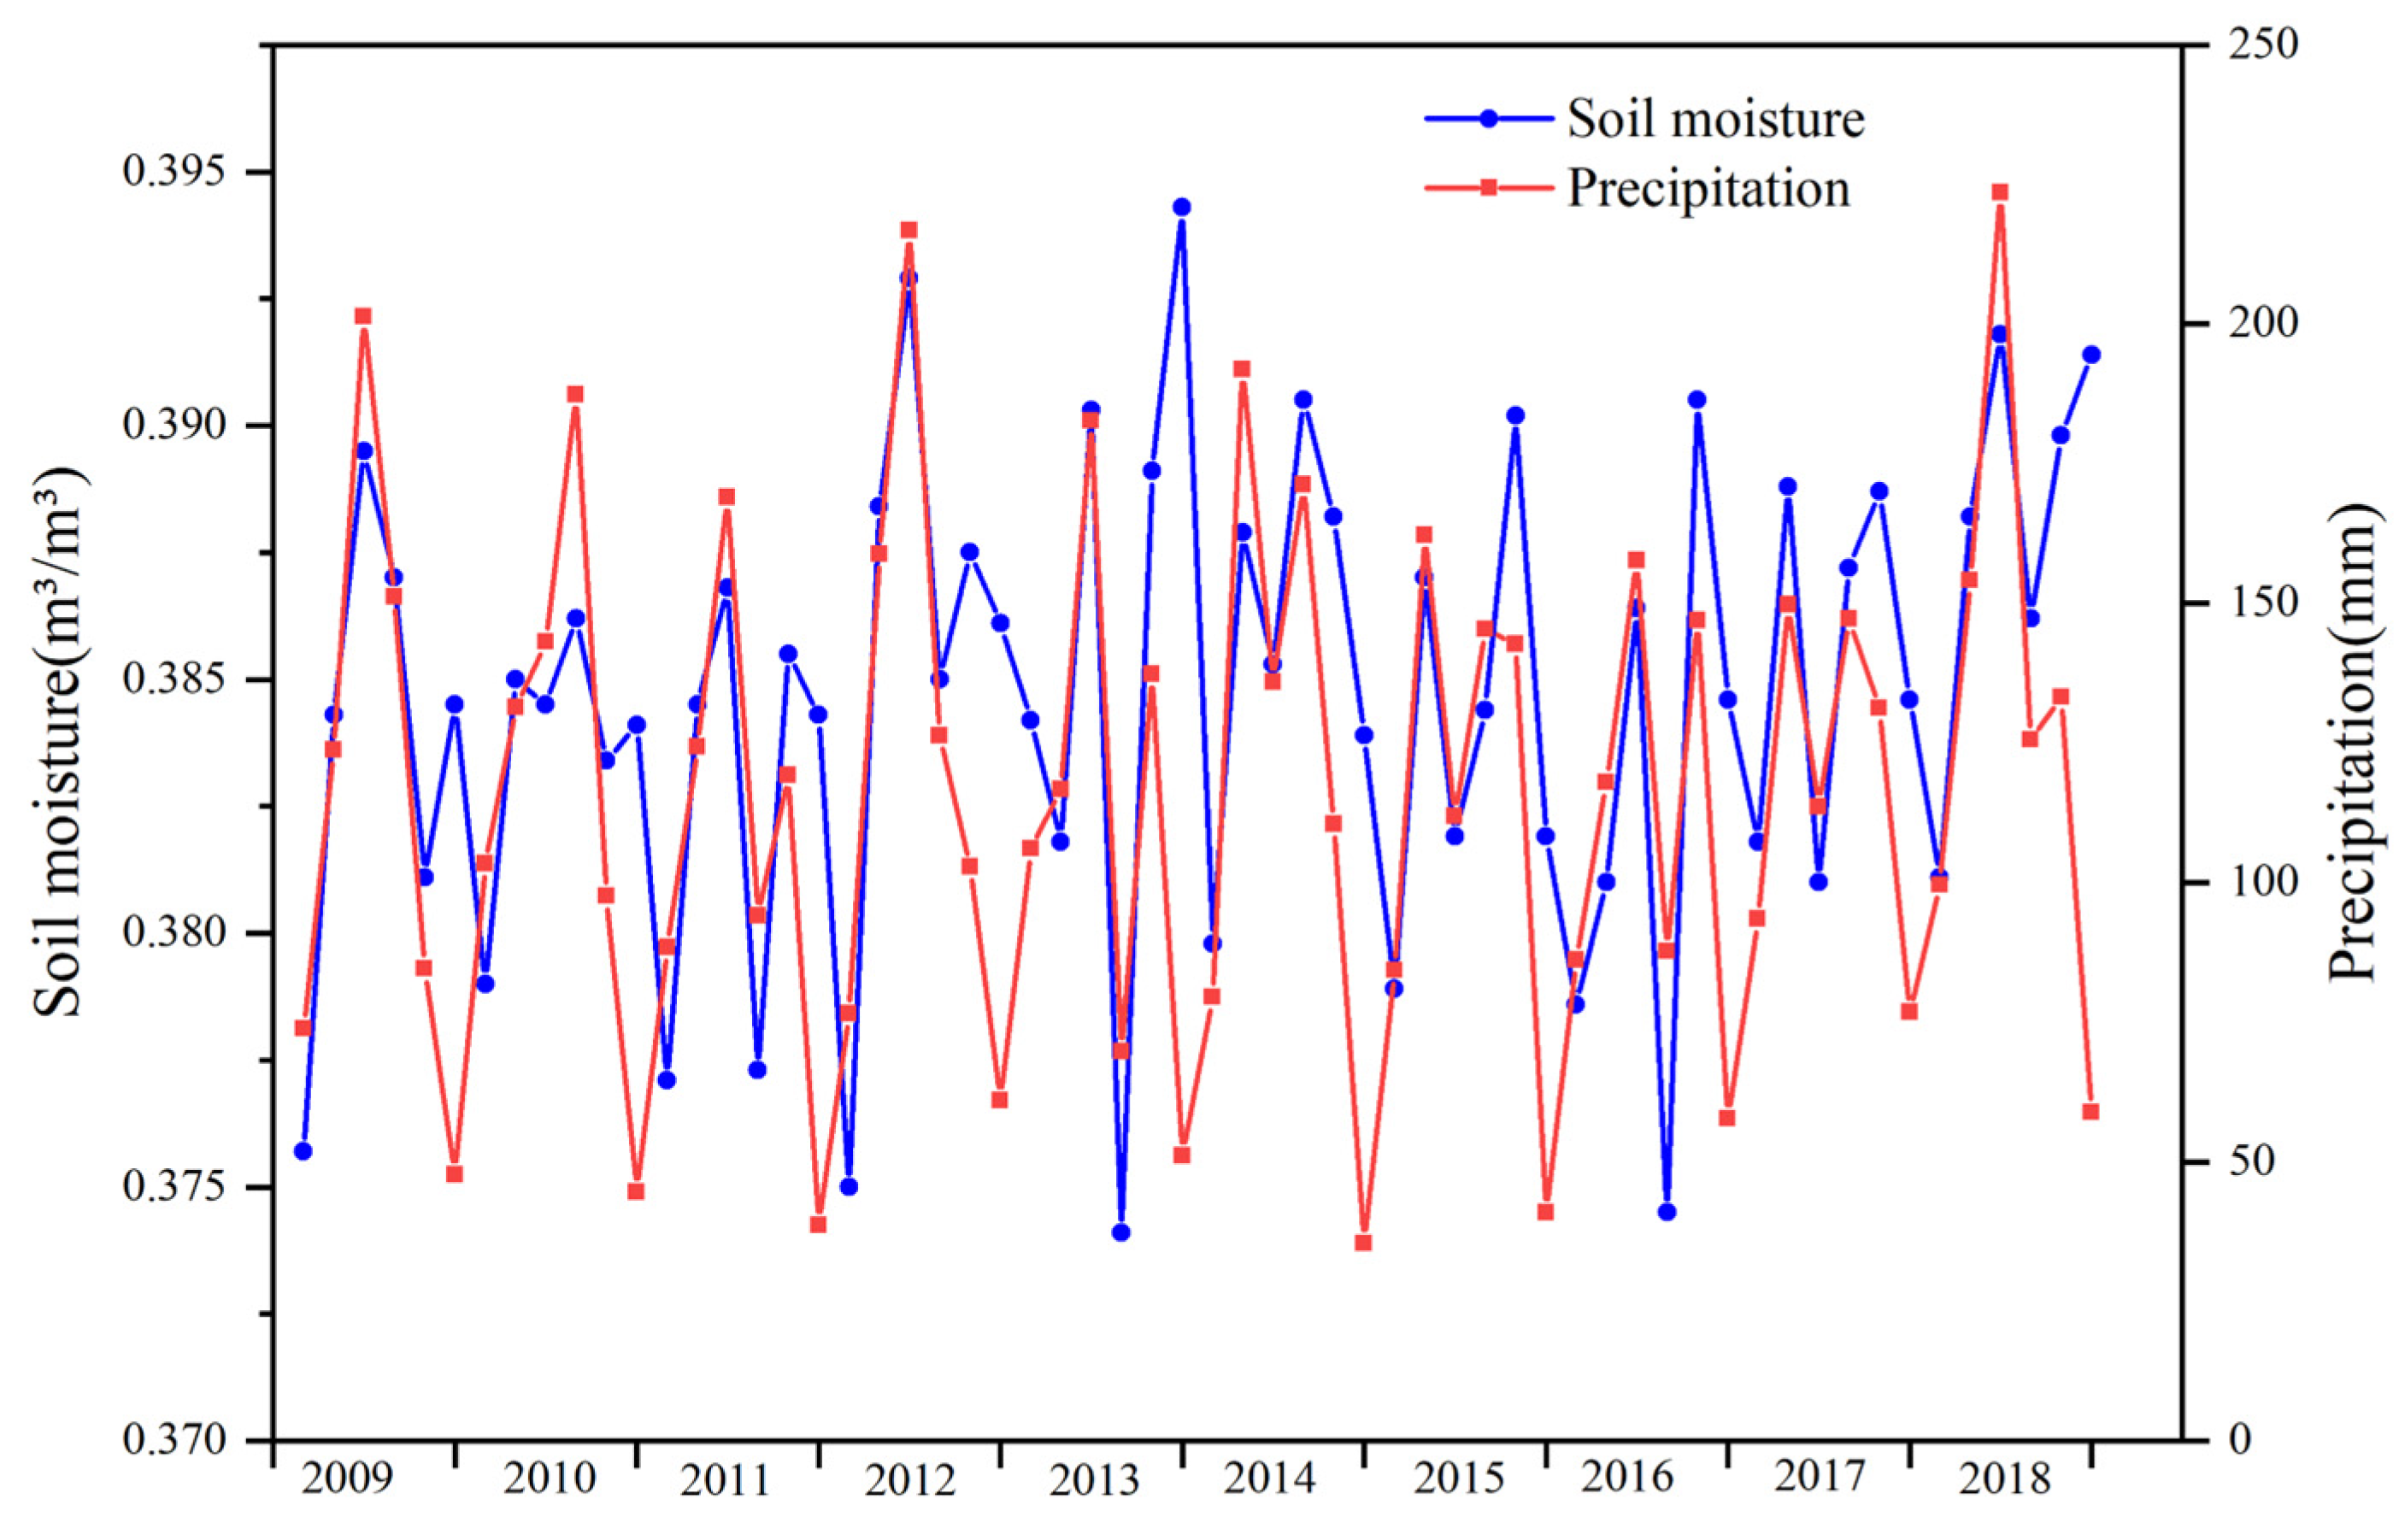
There is a strong association between rainfall and soil moisture [65]. The relationship between precipitation and soil moisture over the period from 2009 to 2018 in the study area was further examined by plotting their inter-annual variation. As illustrated in Figure 9, the soil moisture in the study area exhibited periodic fluctuations from year to year and had a strong correlation with precipitation. The soil moisture values fluctuated between 0.3741 m³/m³ and 0.3943 m³/m³, and the precipitation values fluctuated between 35 mm and 223 mm. Throughout the study period spanning from May to October, there was a discernible pattern in the precipitation levels, which initially showed an upward trend before gradually decreasing. The highest amounts of precipitation were recorded during the months of July and August. Concurrently, the soil moisture content also exhibited a similar trend, with its peak values occurring during the months of July and August.
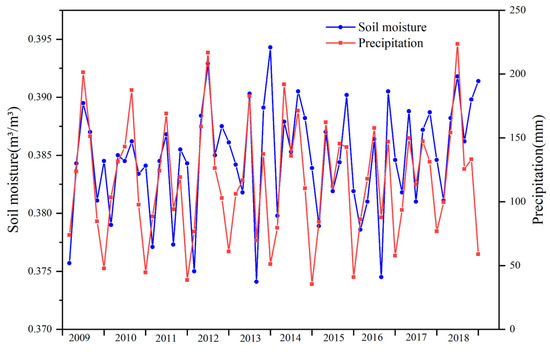
Figure 9.
Inter-annual variation of soil moisture and precipitation in the study region from 2009 to 2018.
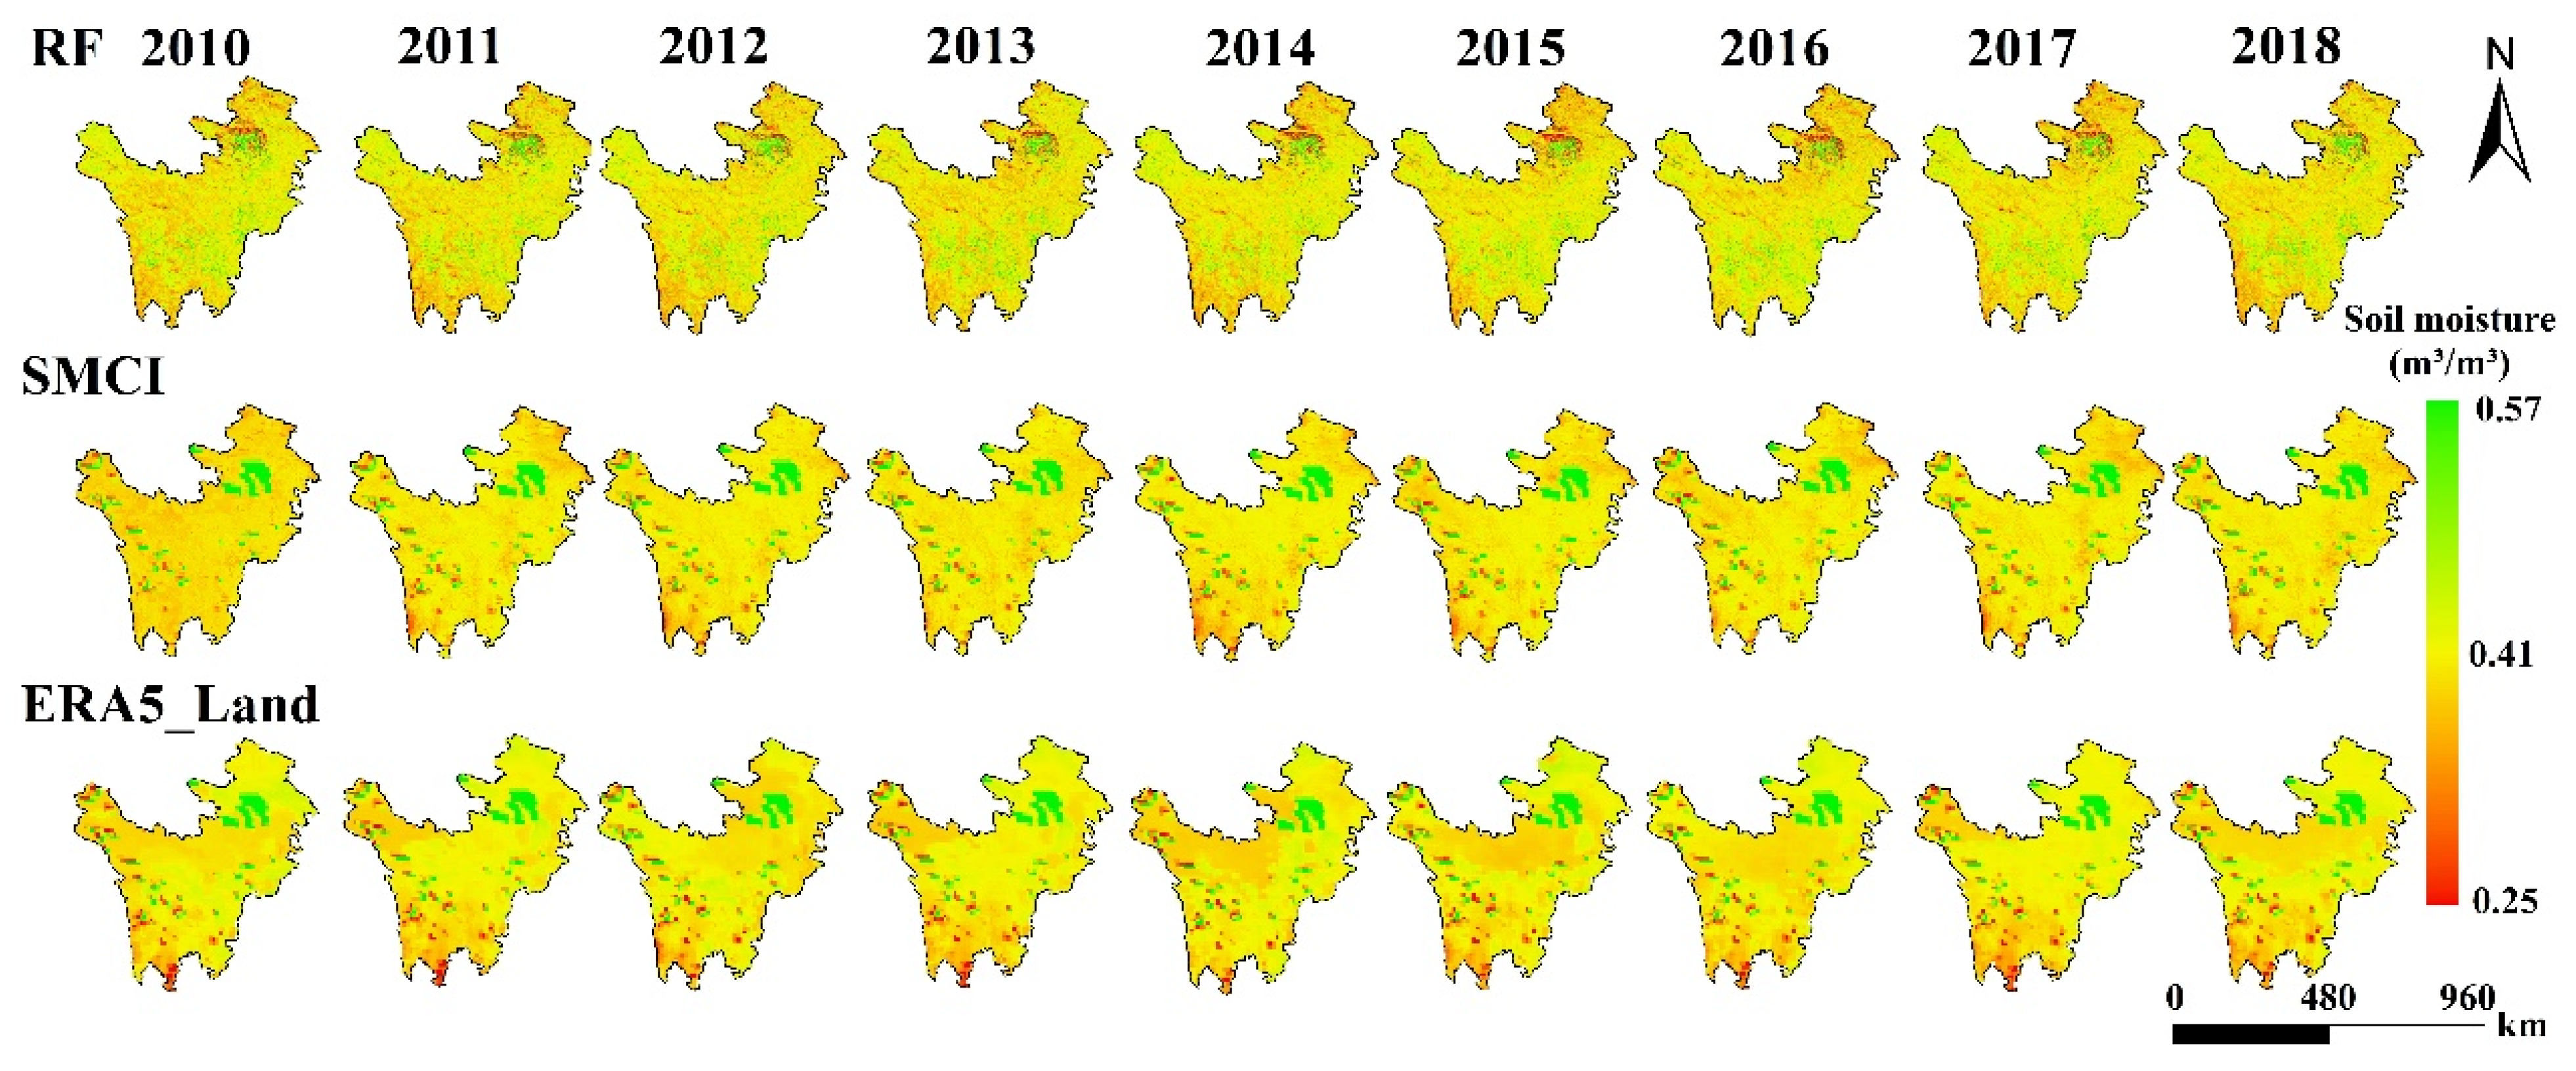
Our trained random forest model generated a multi-year average soil moisture variation for the study region by averaging values from May to October each year. We compared this with the soil moisture products SMCI and ERA5_Land (Figure 10). While there were minimal spatial differences among the three products, our model provided a more detailed spatial pattern of soil moisture. In terms of inter-annual evolution, the overall distribution of soil moisture in the study area was high in the center and low at the margins, which may be related to the terrain elevation. The spatial pattern did not differ significantly from year to year, with soil moisture values ranging from 0.25 m³/m³ to 0.57 m³/m³. This is likely due to the high density of vegetation coverage in this area, which creates hot and humid conditions. The monsoon season also leads to increasing rainfall in the summer, resulting in overall high soil moisture, with higher values mainly concentrated in the Zoige grassland and alpine forest areas.
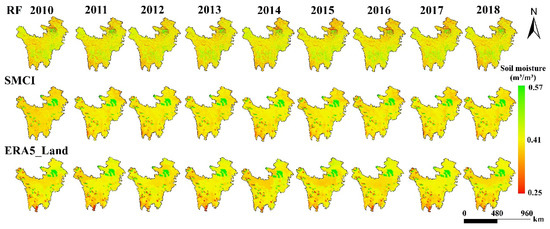
Figure 10.
Variation of soil moisture in the multi-year average (May–October) from 2010 to 2018.
4.2.2. Intra-Annual Evolution
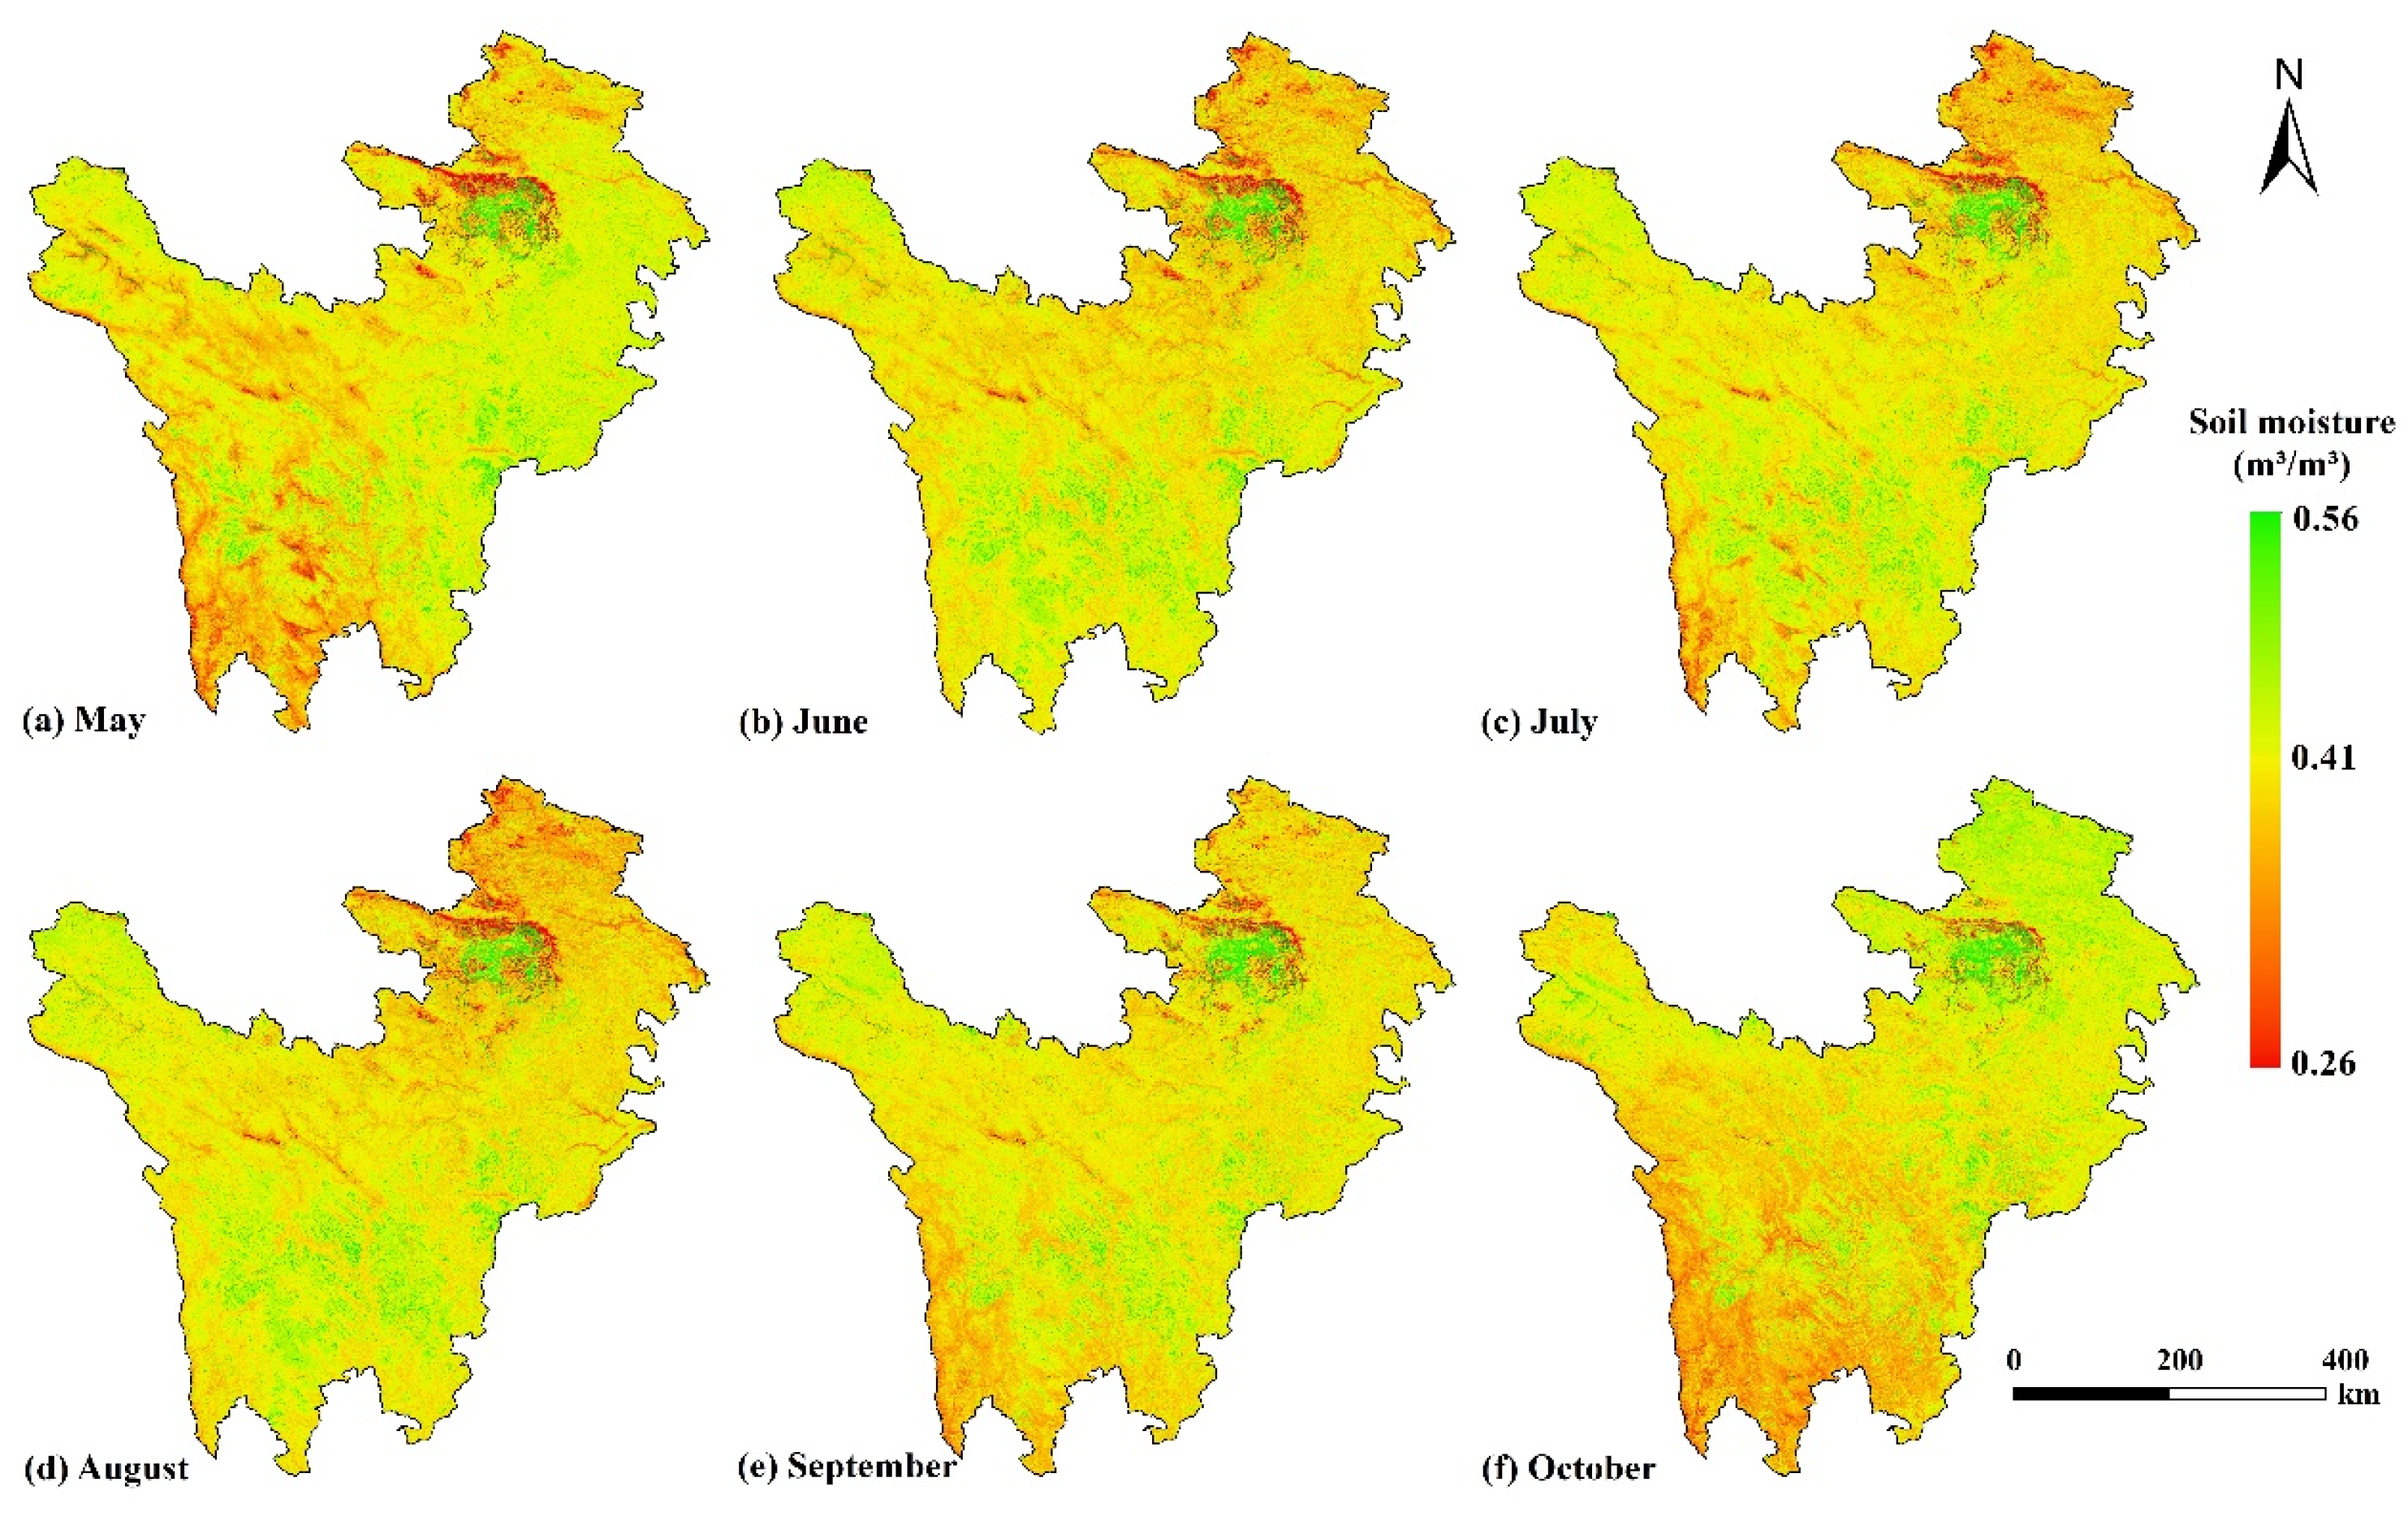
Figure 11 compares the multi-year monthly averages in the study area from 2009 to 2018. During the intra-annual period from May to October, the southwestern and northeastern regions of the study area exhibit trends with more pronounced geographical differences. These variations may be caused by the altitude, precipitation distribution, and surface types in these regions. The southwestern part of the region is characterized by complex terrain and high altitude. From May to August, as the temperature rises, the precipitation season arrives, and glaciers and snow cover melt, soil moisture levels continue to increase, reaching a peak in August. However, in September and October, the dry and cold climate results in reduced precipitation, leading to a gradual decrease in soil moisture.
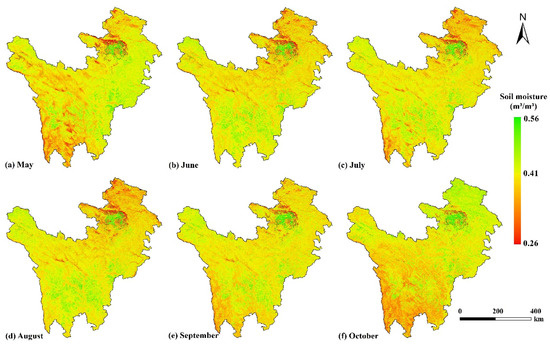
Figure 11.
Comparison of multi-year monthly averages for the study area from 2009 to 2018.
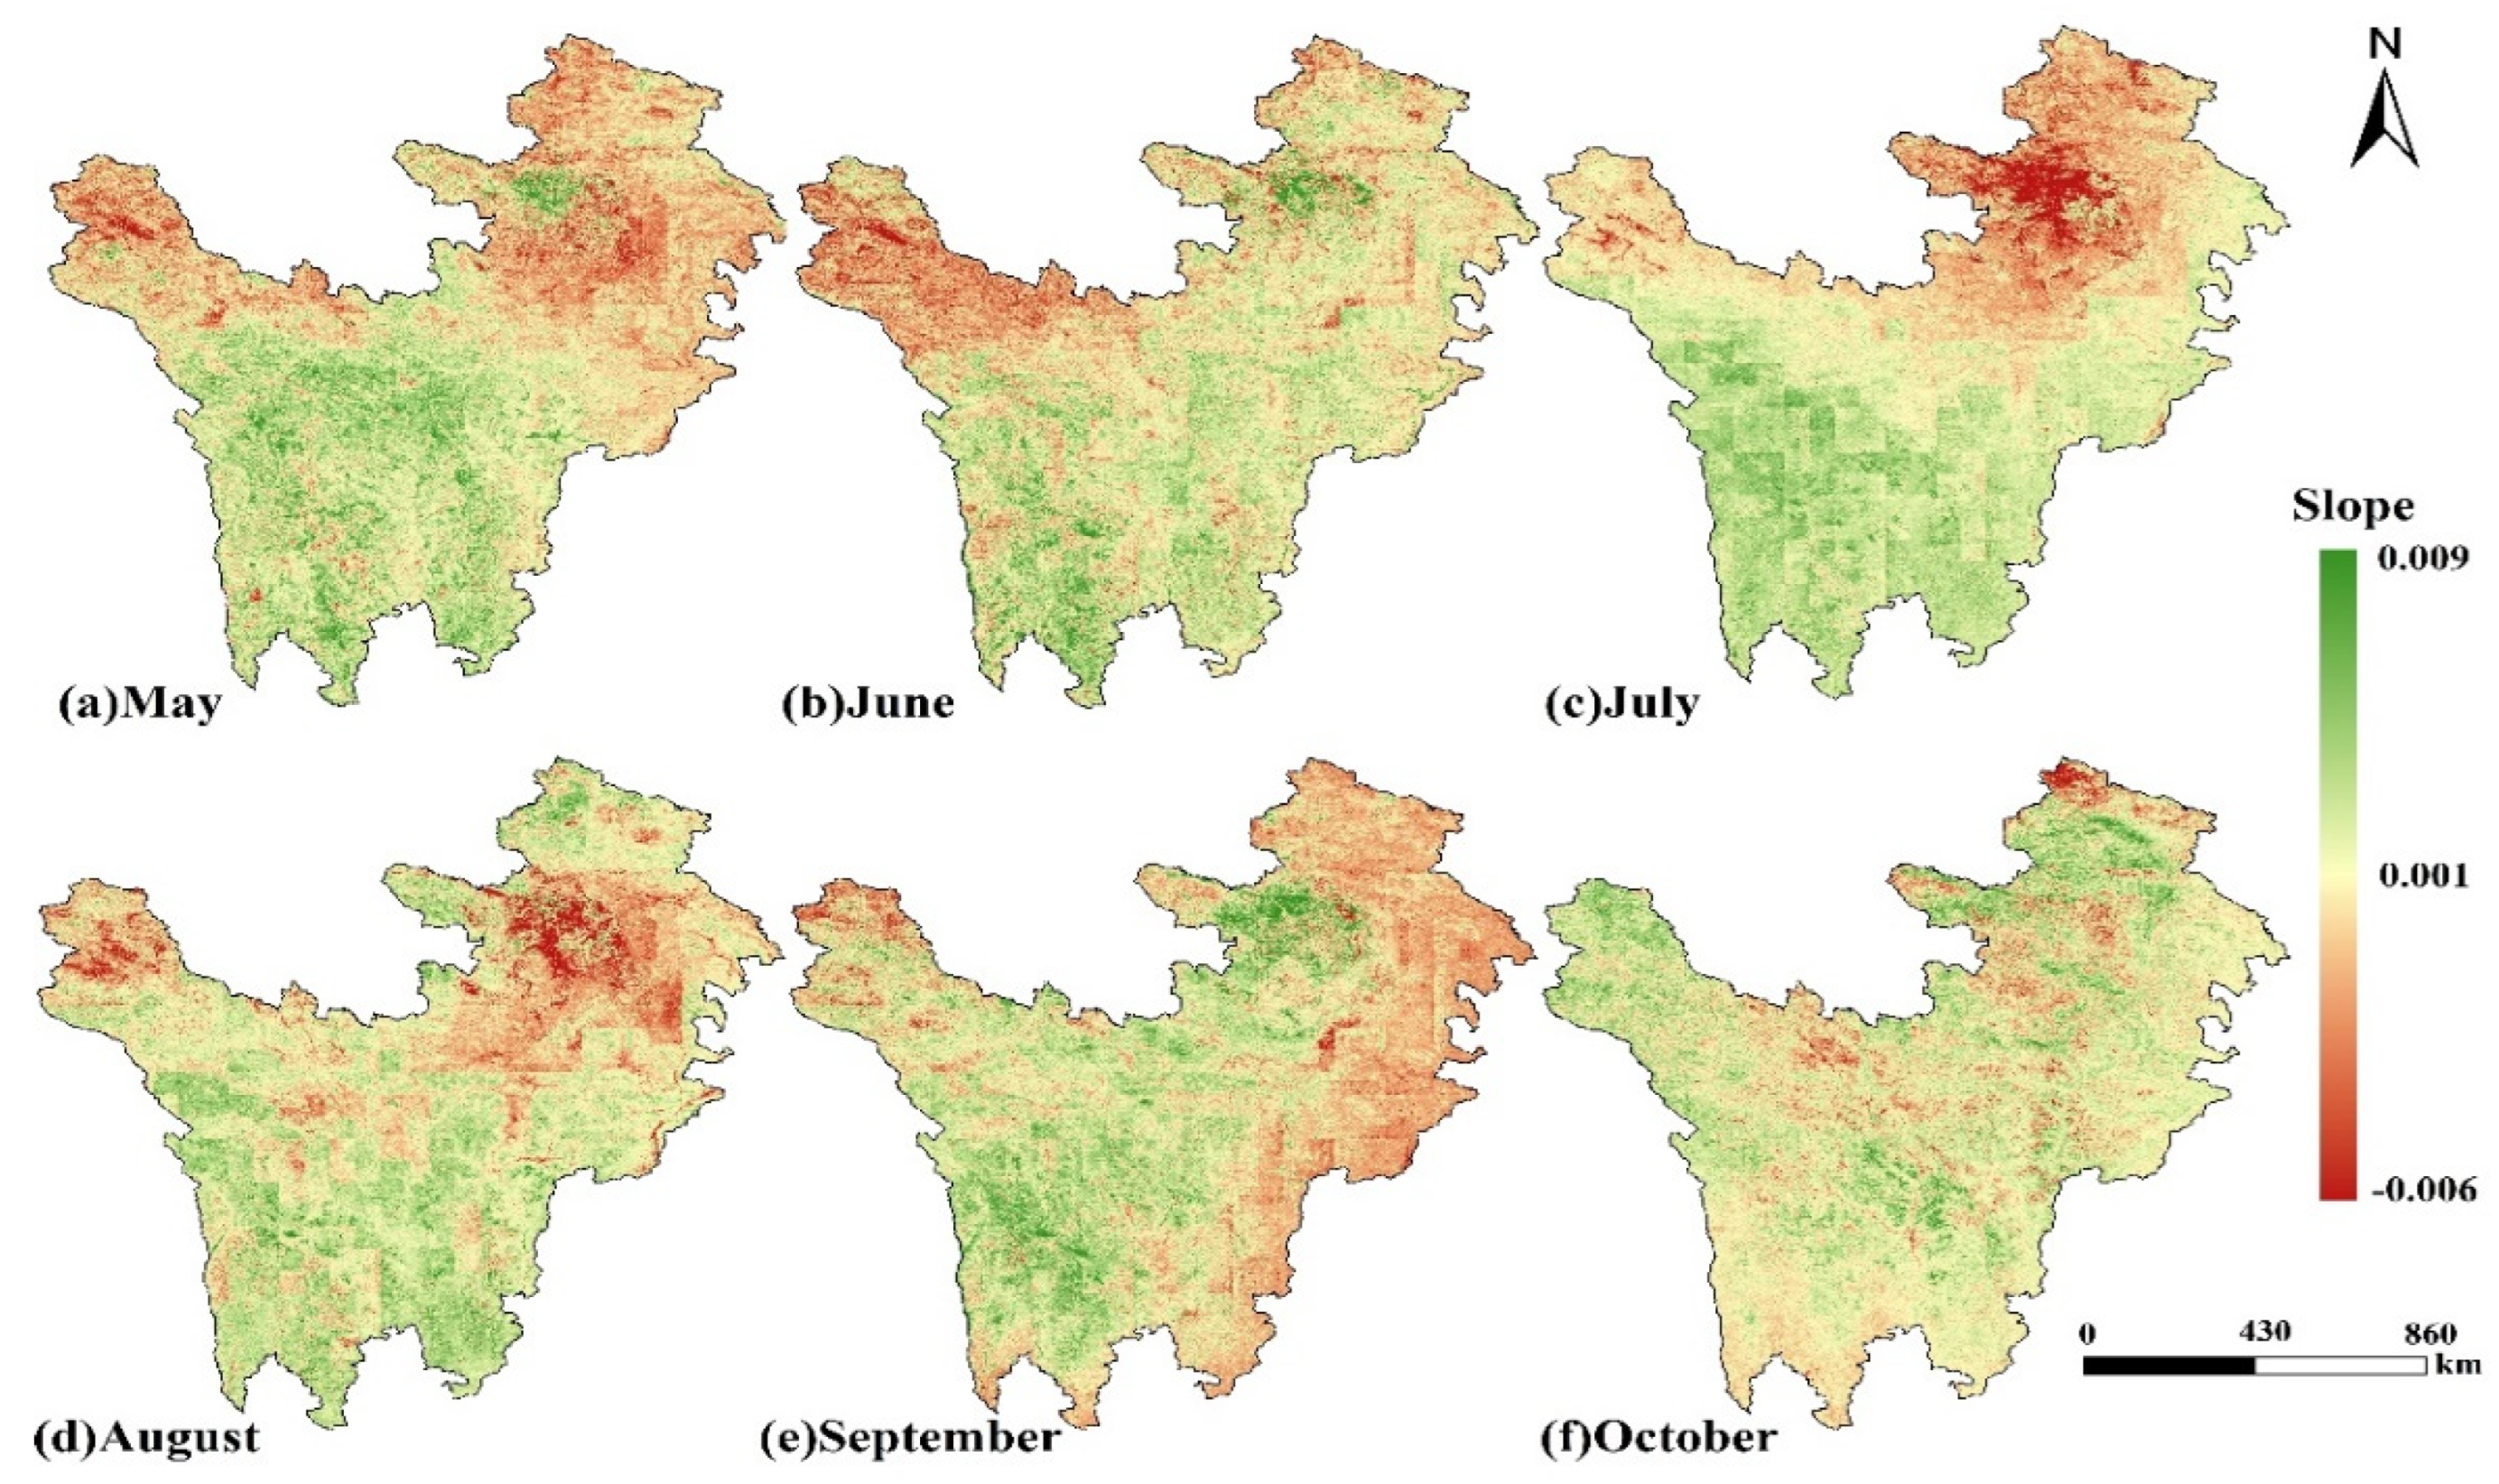
The overall trend of soil moisture change in the study area during the nonfreezing period from 2009 to 2018, as determined through linear trend analysis, was a gradual increase, with variations seen in different months. As shown in Figure 12, the rate of change was small, with values fluctuating between −0.006 and 0.009, and the differences were not significant. On the one hand, in May and June, the southwestern region showed a gradual increase in soil moisture, with area ratios of 77.46% and 70.34%, respectively. On the other hand, the northwest and northeast regions showed a decrease in soil moisture. In July and August, the increase in soil moisture was mainly concentrated in the southwestern region, and in September there was a significant increase in soil moisture, with an area of 82.45% increase, except for the low-altitude edge areas. The overall change in soil moisture in October was relatively small.
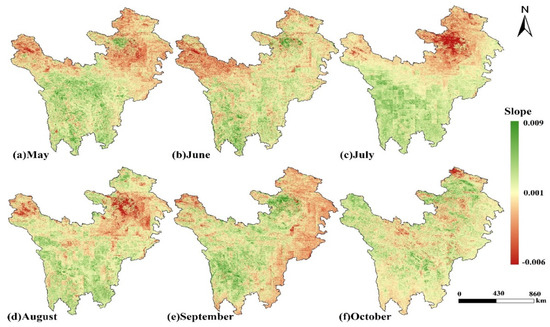
Figure 12.
Linear trend of monthly mean soil moisture in different months from 2009 to 2018.
5. Discussion
It should be noted that many previous studies on soil moisture downscaling have typically combined land surface variables and coarse-scale remote sensing soil product data, modeled direct or indirect relationships, and then used higher spatial resolution parameter variables as input to generate fine-scale soil moisture data [29,30,31,32]. However, the accuracy of the generated soil moisture downscaling results is heavily influenced by the uncertainty of the original coarse spatial resolution soil moisture products, especially in the absence of validation information from ground truth data [26,30]. In previous studies, regional soil moisture downscaling has been mainly focused on a spatial resolution of 1 km, which may not be sufficient for effective water resources management. To address this issue, we propose a novel method to generate a high-resolution (250 m) soil moisture dataset by combining multisource data, machine learning algorithms, and in situ measurements. Our approach maximizes the potential of the combination of the three and alleviates the limitations of different remote sensing sensors, such as the driving error of model simulations and the low spatial resolution of passive microwave sensors [66].
To achieve this, we use the soil moisture products based on ground model simulation as the supplement of in situ measurement data, and the soil moisture products assimilated based on microwave remote sensing as the parameter variable background. By introducing different data sources, we strengthen the quantitative relationship between input characteristic variables and field observation data, which leads to the generation of a high-accuracy soil moisture distribution map consistent with in situ measurements. Furthermore, our method alleviates the sensitive issue of uncertainty in the machine learning inversion process, making remote sensing and machine learning inversion more precise [40]. This approach has not been commonly used in previous studies and can overcome the current limitations of satellite soil moisture retrieval, thereby providing new opportunities for exploring the complex relationships between soil moisture and other parameters [15].
It is important to consider potential sources of errors that could affect the accuracy of our experiment. Although the random forests demonstrate good performance, they are regarded as black boxes that lack interpretability. Particularly when the sample size is limited, the final model accuracy could be affected by the proportional division of the training and test sets [29]. Due to the unequal number and distribution of in situ measurement sites, we included SMCI soil moisture products based on ground model simulations to supplement the missing field observation data. However, uncertainty remains at the regional scale inversion because of the imbalance between ground measurement and SMCI data. Further, errors caused by instrument or human errors in the field measured data could also introduce inaccuracies in the results. The special geographical location and extreme climate of the Qinghai-Tibet Plateau, coupled with the lack of long-term field survey and measurement data, further complicate the verification of the results. Additionally, the spatial-temporal scale matching and conversion of remote sensing data and multiple data sources might introduce errors in soil moisture prediction, and the data deviation between observation data and model simulation may be difficult to eliminate completely, particularly in arid or saturated regions where a large and reliable training sample set is lacking [67]. Finally, the framework proposed in this study for regional soil moisture retrieval is built upon region-specific characteristic variables, including soil properties, evapotranspiration, and surface temperature. While this framework may be applicable to regions with similar environmental and climatic conditions, characteristic variables specific to new regions, such as topographic data and soil texture property data, must be thoroughly considered during the migration process. This will enable us to test and validate the model’s applicability in different regions, and to ensure its accuracy when applied to areas outside of its original scope.
With the availability of more data and information from various sources including satellites, state-of-the-art observation techniques, and land surface modeling, future research should strive to comprehensively utilize these resources to generate more accurate and comprehensive soil moisture datasets [68]. This can be achieved through the integration of multisource remote sensing satellite products, field survey soil moisture data, artificial intelligence, and deep learning [11]. Furthermore, researchers should include additional relevant features such as geographic location information and land cover classification, expand the number of samples, and should aim to generate long-term and easily accessible soil moisture datasets with higher temporal and spatial resolutions. Such datasets will provide valuable information for ecological and environmental scientific research, as well as for managing agricultural water resources.
6. Conclusions
In this study, a novel framework is proposed for high-resolution regional soil moisture retrieval using multisource data fusion, machine learning algorithms, and field measurements. The framework effectively combines MODIS surface variables, in situ measurements, SMCI soil moisture products, microwave remote sensing assimilation products, and ancillary data (soil texture properties, topography, and rainfall) to maximize the potential of each data source. This research was conducted in the southeastern part of the Tibetan Plateau during the nonfreezing period from 2009 to 2018, using a random forest for training. The results indicated that the trained random forest model performs well on unseen data, with an RMSE of 0.024 m³/m³, a bias of −0.004, and an R of 0.885. The predictions of the random forest model are more accurate and closer to field soil moisture than SMCI soil moisture products, particularly for temporal variation. Moreover, we compared our soil moisture maps with the ERA5_Land soil moisture product and the SMCI soil moisture product, and found that all three products were effective in describing the spatial variability of soil moisture. However, our product generated smoother, more stable, and less noisy results, providing a more detailed spatial pattern of soil moisture. Overall, the proposed framework has great potential for practical applications in ecological and environmental scientific research, as well as agricultural water resource management.
Our study revealed that topographic factors such as slope and aspect, as well as soil attributes such as silt and sand have a more significant impact on soil moisture in the southeastern Tibetan Plateau compared to changes in surface variables such as NDVI, ET, and albedo. This highlights the importance of obtaining detailed information on topography and soil texture to generate high-precision soil moisture data in the region. Inter-annual variation analysis indicates that the spatial variation of the annual average soil moisture in the area is small, and the soil moisture value fluctuates between 0.3841 m3/m3 and 0.3943 m3/m3. Generally, soil moisture is relatively high in the center and low at the edge of the region due to altitude, topography, and precipitation distribution. Multi-year monthly averages show an increasing trend from May to October, followed by a decreasing trend. However, the monthly average linearization rate over the years is low. Our results are consistent with previous studies that have found a slow increasing trend in overall soil moisture in the region. Cheng et al. (2019) also suggested that changes in soil moisture could be attributed to the shrinking cryosphere and global warming [69]. Future work will concentrate on integrating higher resolution multisource satellite remote sensing data and developing a deep learning framework, such as a Deep Belief Network (DBN), to enhance the spatio-temporal resolution of soil moisture even further.
Author Contributions
Conceptualization, Y.M. and P.H.; methodology, Y.M., P.H., L.Z. and L.S.; software, Y.M.; validation, Y.M., S.P. and J.B.; formal analysis, Y.M. and P.H.; investigation, Y.M., G.C., S.P. and J.B.; resources, Y.M., G.C. and S.P.; data curation, Y.M., G.C., S.P. and J.B.; writing—original draft preparation, Y.M.; writing—review and editing, Y.M.; visualization, Y.M., P.H. and L.S.; supervision, P.H., L.Z. and L.S.; project administration, P.H., L.Z. and L.S. All authors have read and agreed to the published version of the manuscript.
Funding
This research received no external funding.
Data Availability Statement
The data supporting the findings of this research are publicly available in (Earth System Science Data (ESSD)) at [https://www.earth-system-science-data.net] (accessed on 6 September 2022).
Acknowledgments
We are grateful to the National Aeronautics and Space Administration (NASA) provided for their MOD13Q1, MOD11A2, MOD16A2, and MCD43A3 products. We also gratefully acknowledge the soil moisture products from the Earth System Science Data (ESSD). We express our gratitude to the anonymous reviewers for their valuable feedback and constructive suggestions.
Conflicts of Interest
The authors declare that they have no conflict of interest.
Appendix A

Table A1.
Index of notations and abbreviations.
Table A1.
Index of notations and abbreviations.
| Detailed Name | Abbreviations |
|---|---|
| Normalized vegetation index | NDVI |
| Land surface temperature | LST |
| Evapotranspiration | ET |
| Albedo | albedo |
| Digital elevation model | DEM |
| Slope | slope |
| Aspect | aspect |
| Sand, clay, silt | sand, clay, silt |
| Available water-holding capacity | AWC |
| Precipitation | pre |
| Soil moisture products based on ground model simulations | SMCI |
| Soil moisture products based on passive microwave data assimilation | SMC |
References
- Sabaghy, S.; Walker, J.P.; Renzullo, L.J.; Jackson, T.J. Spatially enhanced passive microwave derived soil moisture: Capabilities and opportunities. Remote Sens. Environ. 2018, 209, 551–580. [Google Scholar] [CrossRef]
- Peng, J.; Albergel, C.; Balenzano, A.; Brocca, L.; Cartus, O.; Cosh, M.H.; Crow, W.T.; Dabrowska-Zielinska, K.; Dadson, S.; Davidson, M.W.; et al. A roadmap for high-resolution satellite soil moisture applications–confronting product characteristics with user requirements. Remote Sens. Environ. 2021, 252, 112162. [Google Scholar] [CrossRef]
- Bojinski, S.; Verstraete, M.; Peterson, T.C.; Richter, C.; Simmons, A.; Zemp, M. The concept of essential climate variables in support of climate research, applications, and policy. Bull Am. Meteorol. Soc. 2014, 95, 1431–1443. [Google Scholar] [CrossRef]
- Bolten, J.D.; Crow, W.T.; Zhan, X.; Jackson, T.J.; Reynolds, C.A. Evaluating the utility of remotely sensed soil moisture retrievals for operational agricultural drought monitoring. IEEE J.-STARS 2009, 3, 57–66. [Google Scholar] [CrossRef]
- Ghulam, A.; Qin, Q.; Teyip, T.; Li, Z.L. Modified perpendicular drought index (MPDI): A real-time drought monitoring method. ISPRS-J. Photogramm. Remote Sens. 2007, 62, 150–164. [Google Scholar] [CrossRef]
- Sheffield, J.; Goteti, G.; Wen, F.; Wood, E.F. A simulated soil moisture based drought analysis for the United States. J. Geophys. Res. Atmos. 2004, 109, D24108. [Google Scholar] [CrossRef]
- Vereecken, H.; Huisman, J.A.; Bogena, H.; Vanderborght, J.; Vrugt, J.A.; Hopmans, J.W. On the value of soil moisture measurements in vadose zone hydrology: A review. Water Resour. Res. 2008, 44, W00D06. [Google Scholar] [CrossRef]
- Gabiri, G.; Diekkrüger, B.; Leemhuis, C.; Burghof, S.; Näschen, K.; Asiimwe, I.; Bamutaze, Y. Determining hydrological regimes in an agriculturally used tropical inland valley wetland in Central Uganda using soil moisture, groundwater, and digital elevation data. Hydro. Process. 2018, 32, 349–362. [Google Scholar] [CrossRef]
- Chignell, S.M.; Luizza, M.W.; Skach, S.; Young, N.E.; Evangelista, P.H. An integrative modeling approach to mapping wetlands and riparian areas in a heterogeneous Rocky Mountain watershed. Remote Sens. Ecol. Conserv. 2018, 4, 150–165. [Google Scholar] [CrossRef]
- Holzman, M.E.; Carmona, F.; Rivas, R.; Niclòs, R. Early assessment of crop yield from remotely sensed water stress and solar radiation data. ISPRS-J. Photogramm. Remote Sens. 2018, 145, 297–308. [Google Scholar] [CrossRef]
- Ochsner, T.E.; Cosh, M.H.; Cuenca, R.H.; Dorigo, W.A.; Draper, C.S.; Hagimoto, Y.; Kerr, Y.H.; Njoku, E.G.; Zreda, M. State of the art in large-scale soil moisture monitoring. Soil Sci. Soc. Am. J. 2013, 77, 1888–1919. [Google Scholar] [CrossRef]
- Wang, L.; Qu, J.J. Satellite remote sensing applications for surface soil moisture monitoring: A review. Front. Earth Sci. 2009, 3, 237–247. [Google Scholar] [CrossRef]
- Crow, W.T.; Berg, A.A.; Cosh, M.H.; Loew, A.; Mohanty, B.P.; Panciera, R.; de Rosnay, P.; Ryu, D.; Walker, J.P. Upscaling sparse ground-based soil moisture observations for the validation of coarse-resolution satellite soil moisture products. Rev. Geophys. 2012, 50, 1–20. [Google Scholar] [CrossRef]
- Rahimzadeh-Bajgiran, P.; Berg, A.A.; Champagne, C.; Omasa, K. Estimation of soil moisture using optical/thermal infrared remote sensing in the Canadian Prairies. ISPRS-J. Photogramm. Remote Sens. 2013, 83, 94–103. [Google Scholar] [CrossRef]
- Li, Z.L.; Leng, P.; Zhou, C.; Chen, K.S.; Zhou, F.C.; Shang, G.F. Soil moisture retrieval from remote sensing measurements: Current knowledge and directions for the future. Earth Sci. Rev. 2021, 218, 103673. [Google Scholar] [CrossRef]
- Parinussa, R.M.; Holmes, T.R.; Wanders, N.; Dorigo, W.A.; de Jeu, R.A. A preliminary study toward consistent soil moisture from AMSR2. J. Hydrometeorol. 2015, 16, 932–947. [Google Scholar] [CrossRef]
- Kerr, Y.H.; Waldteufel, P.; Wigneron, J.P.; Martinuzzi, J.A.M.J.; Font, J.; Berger, M. Soil moisture retrieval from space: The Soil Moisture and Ocean Salinity (SMOS) mission. IEEE Trans. Geosci. Remote Sens. 2001, 39, 1729–1735. [Google Scholar] [CrossRef]
- Entekhabi, D.; Njoku, E.G.; O’Neill, P.E.; Kellogg, K.H.; Crow, W.T.; Edelstein, W.N.; Entin, J.K.; Goodman, S.D.; Jackson, T.J.; Johnson, J.; et al. The soil moisture active passive (SMAP) mission. Proc. IEEE Inst. Electr. Elecrton. Eng. 2010, 98, 704–716. [Google Scholar] [CrossRef]
- Peng, J.; Loew, A.; Merlin, O.; Verhoest, N.E. A review of spatial downscaling of satellite remotely sensed soil moisture. Rev. Geophys. 2017, 55, 341–366. [Google Scholar] [CrossRef]
- Das, N.N.; Entekhabi, D.; Dunbar, R.S.; Chaubell, M.J.; Colliander, A.; Yueh, S.; Jagdhuber, T.; Chen, F.; Crow, W.; O’Neill, P.E.; et al. The SMAP and Copernicus Sentinel 1A/B microwave active-passive high resolution surface soil moisture product. Remote Sens. Environ. 2019, 233, 111380. [Google Scholar] [CrossRef]
- Merlin, O.; Chehbouni, A.; Kerr, Y.H.; Goodrich, D.C. A downscaling method for distributing surface soil Moisture within a microwave pixel: Application to the monsoon ’90 data. Remote Sens. Environ. 2006, 101, 379–389. [Google Scholar] [CrossRef]
- Portal, G.; Vall-llossera, M.; Piles, M.; Camps, A.; Chaparro, D.; Pablos, M.; Rossato, L. A spatially consistent downscaling approach for SMOS using an adaptive moving window. IEEE J. Sel. Top. Appl. Earth Obs. Remote Sens. 2018, 11, 1883–1894. [Google Scholar] [CrossRef]
- Piles, M.; Camps, A.; Vall-llossera, M.; Corbella, I.; Panciera, R.; Rudiger, C.; Kerr, Y.H.; Walker, J. Downscaling SMOS-derived soil moisture using MODIS visible/infrared data. IEEE Trans. Geosci. Remote Sens. 2011, 49, 3156–3166. [Google Scholar] [CrossRef]
- Ranney, K.J.; Niemann, J.D.; Lehman, B.M.; Green, T.R.; Jones, A.S. A method to downscale soil moisture to fine resolutions using topographic, vegetation, and soil data. Adv. Water Resour. 2015, 76, 81–96. [Google Scholar] [CrossRef]
- Park, S.; Im, J.; Park, S.; Rhee, J. Drought monitoring using high resolution soil moisture through multi-sensor satellite data fusion over the Korean peninsula. Agric. Meteorol. 2017, 237, 257–269. [Google Scholar] [CrossRef]
- Wei, Z.; Meng, Y.; Zhang, W.; Peng, J.; Meng, L. Downscaling SMAP soil moisture estimation with gradient boosting decision tree regression over the Tibetan Plateau. Remote Sens. Environ. 2019, 225, 30–44. [Google Scholar] [CrossRef]
- Jordan, M.I.; Mitchell, T.M. Machine learning: Trends, perspectives, and prospects. Science 2015, 349, 255–260. [Google Scholar] [CrossRef]
- Heung, B.; Ho, H.C.; Zhang, J.; Knudby, A.; Bulmer, C.E.; Schmidt, M.G. An overview and comparison of machine-learning techniques for classification purposes in digital soil mapping. Geoderma 2016, 265, 62–77. [Google Scholar] [CrossRef]
- Abbaszadeh, P.; Moradkhani, H.; Zhan, X. Downscaling SMAP radiometer soil moisture over the CONUS using an ensemble learning method. Water Resour. Res. 2019, 55, 324–344. [Google Scholar] [CrossRef]
- Zhao, W.; Sánchez, N.; Lu, H.; Li, A. A spatial downscaling approach for the SMAP passive surface soil moisture product using random forest regression. J. Hydrol. 2018, 563, 1009–1024. [Google Scholar] [CrossRef]
- Im, J.; Park, S.; Rhee, J.; Baik, J.; Choi, M. Downscaling of AMSR-E soil moisture with MODIS products using machine learning approaches. Environ. Earth Sci. 2016, 75, 1–19. [Google Scholar] [CrossRef]
- Choi, M.; Hur, Y. A microwave-optical/infrared disaggregation for improving spatial representation of soil moisture using AMSR-E and MODIS products. Remote Sens. Environ. 2012, 124, 259–269. [Google Scholar] [CrossRef]
- Fang, B.; Lakshmi, V.; Bindlish, R.; Jackson, T.J.; Cosh, M. Passive microwave soil moisture downscaling using vegetation index and skin surface temperature. Vadose Zone J. 2013, 12, 3. [Google Scholar] [CrossRef]
- Wang, L.; Fang, S.; Pei, Z.; Wu, D.; Zhu, Y.; Zhuo, W. Developing machine learning models with multisource inputs for improved land surface soil moisture in China. Comput. Electron. Agric. 2022, 192, 106623. [Google Scholar] [CrossRef]
- Zhang, C.; Zhao, J.; Min, L.; Li, N. Cooperative Inversion of Winter Wheat Covered Surface Soil Moisture by Multi-Source Remote Sensing. IEEE Intern. Geosci. Remote Sens. Symp. 2022, 43, 4192–4195. [Google Scholar] [CrossRef]
- Chen, S.; She, D.; Zhang, L.; Guo, M.; Liu, X. Spatial downscaling methods of soil moisture based on multisource remote sensing data and its application. Water 2019, 11, 1401. [Google Scholar] [CrossRef]
- Ali, I.; Greifeneder, F.; Stamenkovic, J.; Neumann, M.; Notarnicola, C. Review of machine learning approaches for biomass and soil moisture retrievals from remote sensing data. Remote Sens. 2015, 7, 16398–16421. [Google Scholar] [CrossRef]
- Zhang, Y.; Liang, S.; Zhu, Z.; Ma, H.; He, T. Soil moisture content retrieval from Landsat 8 data using ensemble learning. ISPRS-J. Photogramm. Remote Sens. 2022, 185, 32–47. [Google Scholar] [CrossRef]
- Zhang, L.; Zeng, Y.; Zhuang, R.; Szabó, B.; Manfreda, S.; Han, Q.; Su, Z. In Situ Observation-Constrained Global Surface Soil Moisture Using Random Forest Model. Remote Sens. 2021, 13, 4893. [Google Scholar] [CrossRef]
- Long, D.; Bai, L.; Yan, L.; Zhang, C.; Yang, W.; Lei, H.; Quan, J.; Meng, X.; Shi, C. Generation of spatially complete and daily continuous surface soil moisture of high spatial resolution. Remote Sens. Environ. 2019, 233, 111364. [Google Scholar] [CrossRef]
- Tramblay, Y.; Quintana Seguí, P. Estimating soil moisture conditions for drought monitoring with random forests and a simple soil moisture accounting scheme. Nat. Hazards Earth Syst. Sci. 2022, 22, 1325–1334. [Google Scholar] [CrossRef]
- de Oliveira, V.A.; Rodrigues, A.F.; Morais, M.A.V.; Terra, M.D.C.N.S.; Guo, L.; de Mello, C.R. Spatiotemporal modelling of soil moisture in an A tlantic forest through machine learning algorithms. Eur. J. Soil Sci. 2021, 72, 1969–1987. [Google Scholar] [CrossRef]
- Montzka, C.; Rötzer, K.; Bogena, H.R.; Sanchez, N.; Vereecken, H. A new soil moisture downscaling approach for SMAP, SMOS, and ASCAT by predicting sub-grid variability. Remote Sens. 2018, 10, 427. [Google Scholar] [CrossRef]
- Zhao, W.; Li, A.; Huang, P.; Juelin, H.; Xianming, M. Surface soil moisture relationship model construction based on random forest method. In Proceedings of the 2017 IEEE International Geoscience and Remote Sensing Symposium, Fort Worth, TX, USA, 23–28 July 2017. [Google Scholar] [CrossRef]
- Poggio, L.; De Sousa, L.M.; Batjes, N.H.; Heuvelink, G.; Kempen, B.; Ribeiro, E.; Rossiter, D. SoilGrids 2.0: Producing soil information for the globe with quantified spatial uncertainty. Soil 2021, 7, 217–240. [Google Scholar] [CrossRef]
- Du, L.; Tian, Q.; Wang, L.; Huang, Y.; Nan, L. A synthesized drought monitoring model based on multi-source remote sensing data. Trans. CSAE 2014, 30, 126–132. [Google Scholar] [CrossRef]
- Gupta, S.; Larson, W.E. Estimating soil water retention characteristics from particle size distribution, organic matter percent, and bulk density. Water Resour. Res. 1979, 15, 1633–1635. [Google Scholar] [CrossRef]
- Han, J.; Mao, K.; Xu, T.; Guo, J.; Zuo, Z.; Gao, C. A soil moisture estimation framework based on the CART algorithm and its application in China. J. Hydrol. 2018, 563, 65–75. [Google Scholar] [CrossRef]
- Vicente-Serrano, S.M.; Saz-Sánchez, M.A.; Cuadrat, J.M. Comparative analysis of interpolation methods in the middle Ebro Valley (Spain): Application to annual precipitation and temperature. Clim. Res. 2003, 24, 161–180. [Google Scholar] [CrossRef]
- Atkinson, P.M.; Lloyd, C.D. Mapping precipitation in Switzerland with ordinary and indicator kriging. J. Geogr. Inf. Decis. Anal. 1998, 2, 72–86. [Google Scholar]
- Tabios III, G.Q.; Salas, J.D. A comparative analysis of techniques for spatial interpolation of precipitation 1. Am. Water Resour. Assoc. 1985, 21, 365–380. [Google Scholar] [CrossRef]
- Zhang, P.; Zheng, D.; van der Velde, R.; Wen, J.; Zeng, Y.; Wang, X.; Chen, J.; Su, Z. Status of the Tibetan Plateau observatory (Tibet-Obs) and a 10-year (2009–2019) surface soil moisture dataset. Earth Syst. Sci. Data 2021, 13, 3075–3102. [Google Scholar] [CrossRef]
- Li, Q.; Shi, G.; Shangguan, W.; Li, J.; Li, L.; Huang, F.; Zang, Y.; Wang, C.; Wang, D.; Qiu, J.; et al. A 1km daily soil moisture dataset over China using in situ measurement and machine learning. Earth Syst. Sci. Data 2022, 14, 5267–5286. [Google Scholar] [CrossRef]
- Meng, X.; Mao, K.; Meng, F.; Shi, J.; Zeng, J.; Shen, X.; Cui, Y.; Jiang, L.; Guo, Z. A fine-resolution soil moisture dataset for China in 2002–2018. Earth Syst. Sci. Data 2021, 13, 3239–3261. [Google Scholar] [CrossRef]
- Breiman, L. Random forests. Mach Learn. 2001, 45, 5–32. [Google Scholar] [CrossRef]
- Cutler, A.; Cutler, D.R.; Stevens, J.R. Random Forests. Ensemble. Machine Learning; Springer: Boston, MA, USA, 2012; pp. 157–175. [Google Scholar] [CrossRef]
- Díaz-Uriarte, R.; Alvarez de Andrés, S. Gene selection and classification of microarray data using random forest. BMC Bioinform. 2006, 7, 1–13. [Google Scholar] [CrossRef] [PubMed]
- Belgiu, M.; Drăguţ, L. Random forest in remote sensing: A review of applications and future directions. ISPRS-J. Photogramm. Remote Sens. 2016, 114, 24–31. [Google Scholar] [CrossRef]
- Grimm, R.; Behrens, T.; Märker, M.; Elsenbeer, H. Soil organic carbon concentrations and stocks on Barro Colorado Island—Digital soil mapping using Random Forests analysis. Geoderma 2008, 146, 102–113. [Google Scholar] [CrossRef]
- Cui, Y.; Xiong, W.; Hu, L.; Liu, R.; Chen, X.; Geng, X.; Lv, F.; Fan, W.; Hong, Y. Applying a machine learning method to obtain long time and spatio-temporal continuous soil moisture over the Tibetan Plateau. In Proceedings of the 2019 IEEE International Geoscience and Remote Sensing Symposium, Yokohama, Japan, 28 July–2 August 2019; pp. 6986–6989. [Google Scholar] [CrossRef]
- Entekhabi, D.; Reichle, R.H.; Koster, R.D.; Crow, W.T. Performance metrics for soil moisture retrievals and application requirements. J. Hydrometeorol. 2010, 11, 832–840. [Google Scholar] [CrossRef]
- Taylor, K.E. Summarizing multiple aspects of model performance in a single diagram. J. Geophys. Res. Atmos. 2001, 106, 7183–7192. [Google Scholar] [CrossRef]
- Hirsch, R.M.; Slack, J.R.; Smith, R.A. Techniques of trend analysis for monthly water quality data. Water Resour. Res. 1982, 18, 107–121. [Google Scholar] [CrossRef]
- Strobl, C.; Boulesteix, A.L.; Zeileis, A.; Hothorn, T. Bias in random forest variable importance measures: Illustrations, sources and a solution. BMC Bioinform. 2007, 8, 1–21. [Google Scholar] [CrossRef] [PubMed]
- Pan, F.; Peters-Lidard, C.D.; Sale, M.J. An analytical method for predicting surface soil moisture from rainfall observations. Water Resour. Res. 2003, 39, 1314. [Google Scholar] [CrossRef]
- Zeng, L.; Hu, S.; Xiang, D.; Zhang, X.; Li, D.; Li, L.; Zhang, T. Multilayer soil moisture mapping at a regional scale from multisource data via a machine learning method. Remote Sens. 2019, 11, 284. [Google Scholar] [CrossRef]
- Carranza, C.; Nolet, C.; Pezij, M.; van der Ploeg, M. Root zone soil moisture estimation with Random Forest. J. Hydrol. 2021, 593, 125840. [Google Scholar] [CrossRef]
- Albergel, C.; De Rosnay, P.; Gruhier, C.; Muñoz-Sabater, J.; Hasenauer, S.; Isaksen, L.; Kerr, Y.; Wagner, W. Evaluation of remotely sensed and modelled soil moisture products using global ground-based in situ observations. Remote Sens. Environ. 2012, 118, 215–226. [Google Scholar] [CrossRef]
- Cheng, M.; Zhong, L.; Ma, Y.; Zou, M.; Ge, N.; Wang, X.; Hu, Y. A study on the assessment of multi-source satellite soil moisture products and reanalysis data for the Tibetan Plateau. Remote Sens. 2019, 11, 1196. [Google Scholar] [CrossRef]
Disclaimer/Publisher’s Note: The statements, opinions and data contained in all publications are solely those of the individual author(s) and contributor(s) and not of MDPI and/or the editor(s). MDPI and/or the editor(s) disclaim responsibility for any injury to people or property resulting from any ideas, methods, instructions or products referred to in the content. |
© 2023 by the authors. Licensee MDPI, Basel, Switzerland. This article is an open access article distributed under the terms and conditions of the Creative Commons Attribution (CC BY) license (https://creativecommons.org/licenses/by/4.0/).

