Article

How Sensitive Is Thermal Image-Based Orchard Water Status Estimation to Canopy Extraction Quality?

1
Institute of Agricultural Engineering, Agricultural Research Organization, The Volcani Institute, Rishon-LeZion 7505101, Israel
2
Department of Soil and Water Sciences, The Robert H. Smith Faculty of Agriculture, Food & Environment, The Hebrew University of Jerusalem, Rehovot 7610001, Israel
3
Department of Precision Agriculture, MIGAL Galilee Research Institute, Kiryat Shmona 1101602, Israel
4
Environmental Physics and Irrigation, Agricultural Research Organization, Gilat Research Center, Mobile Post Negev 8528000, Israel
5
Department of Environmental Sciences, Tel Hai College, Upper Galilee, Qiryat Shemona 1220800, Israel
6
TerraVision Lab, Midreshet Ben-Gurion 8499000, Israel
7
School of Architecture, SCE Shamoon College of Engineering, Beer Sheva 8410802, Israel
8
Department of Industrial Engineering and Management, Ben-Gurion University of the Negev, Beer Sheva 8410501, Israel
*
Author to whom correspondence should be addressed.
Remote Sens. 2023, 15(5), 1448; https://doi.org/10.3390/rs15051448
Submission received: 12 January 2023 / Revised: 17 February 2023 / Accepted: 21 February 2023 / Published: 4 March 2023
(This article belongs to the Special Issue Crops and Vegetation Monitoring with Remote/Proximal Sensing)

Abstract

:
Accurate canopy extraction and temperature calculations are crucial to minimizing inaccuracies in thermal image-based estimation of orchard water status. Currently, no quantitative comparison of canopy extraction methods exists in the context of precision irrigation. The accuracies of four canopy extraction methods were compared, and the effect on water status estimation was explored for these methods: 2-pixel erosion (2PE) where non-canopy pixels were removed by thresholding and morphological erosion; edge detection (ED) where edges were identified and morphologically dilated; vegetation segmentation (VS) using temperature histogram analysis and spatial watershed segmentation; and RGB binary masking (RGB-BM) where a binary canopy layer was statistically extracted from an RGB image for thermal image masking. The field experiments occurred in a four-hectare commercial peach orchard during the primary fruit growth stage (III). The relationship between stem water potential (SWP) and crop water stress index (CWSI) was established in 2018. During 2019, a large dataset of ten thermal infrared and two RGB images was acquired. The canopy extraction methods had different accuracies: on 12 August, the overall accuracy was 83% for the 2PE method, 77% for the ED method, 84% for the VS method, and 90% for the RGB-BM method. Despite the high accuracy of the RGB-BM method, canopy edges and between-row weeds were misidentified as canopy. Canopy temperature and CWSI were calculated using the average of 100% of canopy pixels (CWSI_T100%) and the average of the coolest 33% of canopy pixels (CWSI_T33%). The CWSI_T33% dataset produced similar SWP–CWSI models irrespective of the canopy extraction method used, while the CWSI_T100% yielded different and inferior models. The results highlighted the following: (1) The contribution of the RGB images is not significant for canopy extraction. Canopy pixels can be extracted with high accuracy and reliability solely with thermal images. (2) The T33% approach to canopy temperature calculation is more robust and superior to the simple mean of all canopy pixels. These noteworthy findings are a step forward in implementing thermal imagery in precision irrigation management.

1. Introduction

Crop water status estimation is significantly affected by canopy temperature [1]. Accurate classification of canopy pixels within an image is central to crop water status estimation. The misclassification of non-canopy pixels, such as soil and mixed pixels, can significantly alter the canopy temperature and crop water status estimation [2] and, thus, may affect orchard irrigation decision making.

1.1. Crop Water Status Estimation for Precision Irrigation Management

Crop water stress index (CWSI) is an indirect measurement of crop water status derived from a thermal image. Absolute canopy temperature is a function of stomata opening and cooling by subsequent crop transpiration and is affected by meteorological factors, including ambient temperature, vapor pressure, wind speed, and radiation [3]. To compare thermal images and eliminate the need to measure all of the meteorological parameters, normalization of canopy temperature via CWSI was proposed as a proxy of crop water status [4,5]:
CWSI = T c a n o p y T w e t T d r y T w e t
where Tcanopy is the temperature of the canopy, Twet is the temperature of a fully transpiring canopy, and Tdry is the temperature of a non-transpiring (stressed) canopy. CWSI ranges from zero to one, where higher values indicate higher water stress. The difference between Tcanopy (°C) and Tair (°C) is dependent on vapor pressure deficit (VPD) [4,5]. Tdry is typically calculated using an empirical method [6,7], while Twet is determined by employing empirical, theoretical, and statistical methods [6,8] or, for commercial plot scale, by calculating the average temperature of the coolest 5–10% of canopy pixels of each individual thermal image [7,8,9].
The calculation of Tcanopy involves two steps. First, canopy pixels need to be extracted from the image and separated from non-canopy pixels, including “mixed pixels” (combinations of canopy, soil, weeds, foreign objects, and shade). The second step is the calculation of canopy temperature. A common approach for calculating Tcanopy of an area of interest (a whole plot or a management zone) is by using the mean [10] or the median [7] temperature of extracted canopy pixels. Meron et al. [6] proposed using the coldest 33% of canopy pixels for the calculation. Cohen et al. [8] reported an over-estimation of water stress in cotton with the mean of all canopy extracted pixels. When the mean of the coldest 33% was used, water status was better estimated. No such comparison between the approaches used for calculating canopy temperature was found for orchards.

1.2. Approaches of Thermal Image-Based Canopy Extraction

Canopy extraction approaches incorporating thermal imagery include methods that use a single thermal infrared image (1-source) and other methods that use a thermal infrared image and additional remotely sensed images, usually RGB (multi-source). One-source methods include purely threshold-based statistical analysis on the one hand and coupled statistical and spatial analyses on the other hand. Statistical analysis of a temperature histogram to identify canopy pixels within a thermal image has been performed in orchards [11,12] where canopy can be distinguished from soil. In such cases, temperature histograms are characterized by a bimodal distribution, where the canopy and soil pixels are represented by cooler and warmer peaks, respectively. Mixed pixels, which include combinations of canopy, soil, weeds, foreign objects, and shade in a single pixel, are generally composed of a “saddle” area between the two peaks. Depending on the crop architecture, the distance between plants, the degree of complexity, and pixel resolution, there can be significant overlap between mixed pixels, pure-canopy pixels, and pure-soil pixels, creating a challenge in identifying pure-canopy pixels. Additionally, water-stressed trees may have higher canopy temperatures and could be misidentified as mixed or soil pixels [13].
An additional group of 1-source methods incorporates statistical and spatial analyses of a single thermal image. Spatial watershed segmentation has been coupled with binary thresholding to extract pure-canopy pixels in palm trees [14] and in vineyards [15]. Camino et al. [16] incorporated watershed segmentation and quartile histogram analysis in an almond orchard. Superpixel algorithms are used to differentiate meaningful regions of interest in an image [17], such as tree crowns in a forest system [18] and fruit detection in orchards [19]. In peach orchards, one technique involved thresholding to remove non-canopy pixels and then morphological erosion to remove mixed pixels and to extract pure-canopy pixels [20]. A second method used edge detection algorithms followed by morphological dilation to remove mixed pixels [21]. Additional methods include delineation of regions of interest of a single canopy [2] as well as pure edge detection analysis [22]. The incorporation of two types of analyses, statistical and spatial, on thermal images alone has been claimed to improve the quality of canopy extraction in comparison to merely statistical-based analysis [23].
In general, multi-source methods are based on statistical analysis of a visible (RGB) or multispectral image to extract canopy pixels, which is then used as a binary mask that is superimposed on a thermal image. This technique has been implemented in crops including potato [9], mint [24], and grape [25]. Additional feature layers, such as maps of irrigation pipes, can be incorporated to improve canopy extraction [26]. However, poor overlap of RGB and thermal images can cause misidentification of canopy pixels.
Currently, there are many methods of canopy extraction, but, to the best of our knowledge, there is no comprehensive quantitative comparison of canopy extraction methods in the context of orchard water status estimation. Thus, the decision of which canopy extraction method to incorporate and how to calculate canopy temperature may be arbitrary and not based on experimental data. Accurate canopy extraction and temperature calculations are crucial to minimizing inaccuracies in thermal image-based estimation of orchard water status that may directly affect irrigation decisions. This study tested the hypothesis that thermal image-based orchard water status estimation is significantly sensitive to the canopy extraction quality and to the temperature calculation approach. The objective was to determine the sensitivity of thermal image-based orchard water status estimation to canopy extraction methodology and quality. Four canopy extraction methods were evaluated. Three methods followed the 1-source approach (thermal images), incorporating both statistical and spatial analyses: (1) 2-pixel erosion (2PE), where non-canopy pixels were removed by thresholding followed by morphological erosion; (2) edge detection (ED), where edges were identified and then morphologically dilated; and (3) vegetation segmentation (VS) using statistical analysis of the temperature histogram followed by spatial watershed segmentation. A fourth method, denoted RGB-BM, followed the multi-source approach and used an RGB image to statistically extract a binary canopy layer to mask the thermal image. Additionally, two approaches to canopy temperature calculation were assessed by calculating the following: (1) the average of 100% of canopy pixels (T100%), and the average of the coolest 33% of canopy pixels (T33%).

2. Materials and Methods

2.1. Research Area

A field experiment was conducted during the 2019 season in a 4 ha commercial late-harvest peach orchard (Prunus persica cv. 1881) located near Mishmar Hayarden, Israel (33.01°N; 35.60°E) (Figure 1). The elevation of the orchard ranges from 171 to 188 m above sea level, the average slope is 5% to the northwest, and within the orchard, the slope ranges from 0 to 11.3%. The orchard was planted in 2007 with spacing of 2.6 m and 5 m between trees and rows, respectively, and was divided into 22 management cells (MC) of 35 m × 35 m to monitor various orchard parameters, including canopy area and SWP. A precision drip irrigation regime was implemented in the north subplot (MC 1–11), while the south subplot (MC 12–22) was uniformly irrigated. A detailed description of the irrigation design of the entire orchard and the decision-making process in the north subplot using thermal image-based tree water status estimation following the 2PE canopy extraction method is reported in [27]. The experiment was conducted during stage III of fruit development, which is the primary stage of fruit growth and period when most of the annual irrigation is applied.
The major steps of data acquisition and analysis are presented as a flow chart in Figure 2.

2.2. Image Acquisition

Ten high-resolution thermal images were acquired between 21 July and 26 August 2019. A sensitive (±2 °C) uncooled FLIR SC655 camera (FLIR® Systems, Inc., Billerica, MA, USA) with 640 × 480 resolution was mounted on a six-engine drone (Datamap Group, Bnei Brak, Israel). The flight height for all campaigns was 100 m, and the subsequent ground spatial resolution was approximately 7 cm. All campaigns were conducted midday between 12:30 and 15:15 on cloudless days. Mosaics were created using the ThermCam software (FLIR® Systems, Inc., Billerica, MA, USA) and Pix4D mapper software (Pix4D, Prilly, Switzerland). All of the thermal images were resampled to the average pixel size of the ten images, which was 7.3737 cm.
Two RGB images were acquired on 21 July and 12 August 2019 immediately prior to the respective thermal image campaign using a Phantom 4 Pro V2 (DJI Technology Co., Ltd., Shenzhen, China). The ground spatial resolution was approximately 3 cm.

2.3. Canopy Extraction Methods

Four methods of canopy extraction from thermal images were applied and evaluated, representing a range of techniques found in the literature. In this study, they were executed primarily using the ArcGIS Pro software (ESRI, Redlands, CA, USA).
Three methods followed the 1-source approach, incorporating both statistical and spatial analyses, using only thermal images:
(1)
2-pixel erosion (2PE):
  • Extraction of the coolest two-thirds of temperature pixels from the whole orchard histogram to separate canopy from non-canopy (mixed and soil) pixels [27] (statistical).
  • Morphological erosion of the two pixels [28] (spatial).
(2)
Edge detection (ED) based on [21]:
  • Image sharpening with high pass filter (spatial).
  • Determination of edges (statistical).
  • Morphological expansion of three pixels (spatial).
  • Thresholding to extract only canopy pixels (statistical).
(3)
Vegetation segmentation (VS) based on [29] written in the Matlab R2020a (Mathworks Inc., Matick, MA, USA):
  • Temperature histogram analysis using the Otsu [30] and full-width-half-maximum [11] algorithms to differentiate between canopy and non-canopy pixels (statistical).
  • Watershed segmentation to define the basin of each peach tree [14] (spatial).
The temperature values per pixel of the 2PE, ED, and VS methods were retrieved by multiplying the respective final layer of canopy pixels by the original thermal image.
A fourth method followed the multi-source approach, using a thermal and an RGB image:
(4)
RGB-based binary masking (RGB-BM):
  • Resampling of the RGB to 7.3737 cm.
  • Georeferencing between the RGB and thermal layers.
  • The excess green index (ExG) (2G-R-B) is calculated per pixel and effectively differentiates between plant and soil pixels [31].
  • Binary thresholding of the ExG layer to separate canopy from non-canopy pixels [30] (statistical).
  • Thermal image masking using the ExG layer (post-binary thresholding) [24] to retrieve the temperature values of each pixel (spatial).

2.4. Canopy Extraction Quality Evaluation

The quality of canopy extraction was determined by measuring the canopy area consistency throughout the study as well as assessing the accuracy of each method (ArcGIS Pro 2.9.0 software, ESRI, Redlands, CA, USA).

2.4.1. Canopy Area Consistency

During stage III, vegetative growth of deciduous fruit trees, including peaches, is minimal to non-existent [32]. Hence, canopy area consistency can be used as a measure of extraction quality. The canopy area (m2) per MC (n = 22) per image was calculated for all four canopy extraction methods. On two dates, 21 July and 12 August, the median values were calculated, and the Student’s t-test was used to determine significant differences in the mean canopy area on these dates for each method (JMP statistical software, JMP Inc., Cary, NC, USA). Additionally, the coefficient of variation (CV) was calculated for the canopy area median values per image for the 2PE, ED, and VS methods.

2.4.2. Accuracy Assessment

Accuracy assessment was performed per canopy extraction method on the datasets for 21 July and 12 August. All orchard pixels were reclassified into two categories using the final extraction layer per image as pure-canopy and non-canopy pixels. Synchronization between the final extraction layer (thermal or other) and the RGB ground truth image was verified. One hundred sample points were divided equally between these categories. A different set of 100 sample points was distributed for each of the four methods and two dates. A total of 800 sample points were used in the analysis. Ground truth validation was visually determined per sample point with the original RGB image from each respective date, 21 July and 12 August. The ensuing confusion matrix included the following: sample points that were correctly classified as canopy pixels (true positive—TP); sample points that were classified as canopy but were actually non-canopy pixels (false positive—FP); sample points that were correctly classified as non-canopy pixels (true negative—TN); and sample points that were classified as non-canopy but were actually canopy pixels (false negative—FN). The following parameters were calculated, enabling the evaluation of canopy extraction quality: overall accuracy (Equation (2)); precision (Equation (3)); recall (Equation (4)); and F1-score, which is the harmonic mean of precision and recall [33] (Equation (5)):
O v e r a l l   a c c u r a c y = ( T P + T N ) / ( T P + T N + F P + F N )
P r e c i s i o n = T P / ( T P + F P )
R e c a l l = T P / ( T P + F N )
F 1 s c o r e = 2 × ( P r e c i s i o n × R e c a l l ) / ( P r e c i s i o n + R e c a l l )

2.5. Canopy Temperature Calculation

The temperature of all extracted orchard canopy pixels was retrieved, and a histogram was built for each method. Descriptive statistics were calculated for the histograms, including mean, median, standard deviation, minimum, and maximum. The canopy temperature of each MC was estimated using two methods: the average of 100% of canopy pixels (T100%), and the average of the coolest 33% of canopy pixels (T33%). The calculations used the raster [34], rgdal [35], and reshape2 [36] packages in R [37], and the canopy temperature graphs were constructed using the ggplot2 package in R [38].

2.6. Orchard Water Status Estimation

The CWSI was calculated per MC following Equation (1): Twet was calculated based on the average of the coolest 5% of canopy pixels of the whole orchard [9]; Tdry was calculated empirically as Tair + 2 °C [7,27]; and Tcanopy was calculated using the methods described in the previous section for T100% and T33%. The CWSI was denoted CWSI_T100% and CWSI_T33%, respectively. Air temperature values for the day and time of each thermal image campaign were acquired from the nearby Gadot meteorological station (33.03°N; 35.62°E). The CWSI graphs were constructed using the ggplot2 package in R [38].

2.6.1. Establishment of the Relationship between SWP and CWSI

Linear regression models were developed based on a field experiment that took place during the fruit growth stage III of season 2018. Different irrigation levels were applied to the three plots in the orchard to create a range of soil water contents and respective plant water status. A campaign, including stem water potential (SWP) measurements of five trees per plot (n = 15) and thermal imaging, took place on 05 August 2018 during stage III. Plant water status was evaluated by measuring SWP using a Scholander-type pressure chamber (Arimad, MRC Ltd., Holon, Israel). Two shaded leaves were covered with an aluminum foil zip-lock bag 1.5 h before the measurement. Measurements were performed on each measurement tree between the hours of 12:30–15:15, and the results were averaged per tree.
For each canopy extraction method (2PE, ED, VS, and RGB-BM), CWSI_T100% and CWSI_T33% were calculated per measurement tree using the method described in the previous section. Linear regression models were created using the SWP measurements and the CWSI calculations and evaluated using the following parameters: correlation coefficient (R2), root-mean-square error (RMSE), p-value, and the lower and upper 95% confidence intervals of the intercept and slope using the JMP statistical software (JMP Inc., Cary, NC, USA).

2.6.2. Estimated Stem Water Potential

The linear regression models were the basis for calculating the estimated SWP (SWPe). The SWPe was calculated from the CWSI_T100% and CWSI_T33% values per MC for the entire dataset, and its values were denoted SWPe_T100% and SWPe_T33%, respectively. Additionally, SWP was measured on three to four healthy trees of representative canopy size per MC in the north subplot and three trees per MC in the south subplot for each day of data collection. The SWP measurements served as a reference indicating the actual water status of each MC. The specific method and time of measurement is described in Section 2.6.1. The SWPe was subtracted from the measured SWP per MC per day, and descriptive statistics were used to evaluate the datasets: average, standard deviation, maximum, minimum, median, 25% and 75% quartile, mean squared error (MSE), and RMSE. Additionally, each measured SWP and SWPe value was compared to the optimal water status range of stage III, which was defined between −1.17 and −1.43 MPa and based roughly on [39]. Above-range values (>−1.17 MPa) indicated excessive moisture and possible over-irrigation; within-range (optimal) SWP values (between −1.17 and −1.43 MPa) indicated sufficient water status; and below-range values (<−1.43 MPa) specified orchard water stress. The variance of each distribution was calculated.

3. Results

3.1. Evaluation of Canopy Extraction Quality

3.1.1. Canopy Area Consistency

A difference in canopy area was evident between the two RGB-BM images on 21 July and 12 August (Figure 3): the median values were 414 and 474 m2, respectively. This is a difference of 60 m2, while slight differences were observed between these dates with the 2PE, ED, and VS methods: 6, 4, and 3 m2, respectively. Accordingly, a significant difference in canopy area mean (increase) was calculated between the two RGB-BM images (p < 0.001, n = 22 MC per date), while no difference was detected for the 2PE, ED, or VS methods (p > 0.05, n = 22 MC per date).
The canopy area consistency of the 2PE, ED, and VS methods was evaluated using ten thermal images (Figure 3). The 2PE and VS methods were more consistent compared to the ED method. The median values per date of the 2PE ranged from 374 to 430 m2 (a difference of 56 m2), and the values ranged from 555 m2 to 626 m2 (a difference of 71 m2) with the VS method. In contrast, the median values of the ED method ranged from 288 to 460 m2 (a difference of 172 m2, 3-fold of the 2PE method), indicating less consistency over time. The coefficient of variation (CV) values of the 2PE, VS, and ED methods were 0.05, 0.04, and 0.13, respectively, highlighting the differences in consistency.

3.1.2. Accuracy Assessment

The differences in canopy area identification accuracy were evident between the canopy extraction methods (Figure 4). The RGB-BM method was found to be the most accurate among the canopy extraction methods, as demonstrated through the overall accuracy and the F1-score values on both 21 July and 12 August. On 21 July, the recall values of all of the methods were high (90–97%), indicating that most of the actual canopy was correctly classified. The precision, or the degree to which the classified map correctly identified canopy, however, varied according to extraction method: the 2PE and RGB-BM methods’ precision was fairly high (84%), while the VS method’s precision was the lowest (62%). On 12 August, the recall values of the VS and RGB-BM methods were higher than the 2PE and ED methods. The precision of the 2PE method was slightly less than the RGB-BM method (78%), and the ED method’s precision was the lowest (68%).

3.2. Canopy Temperature Calculation

The differences in estimated canopy temperature between the four canopy extraction methods were evident at both the whole orchard and MC scales (Figure 5). The most striking difference between the methods in the whole orchard histograms of canopy temperature was the range of values. The temperature ranges of the extracted canopy pixels using the RGB-BM method was substantially wider (30–64 °C) than that of the 2PE (30–42 °C), ED (30–46 °C), and VS (30–47 °C) methods. The “tail” of the warm pixels of the RGB-BM histogram is the result of non-tree canopy being misclassified as canopy. These warm pixels were located between tree rows that contained grasses and soil but were free of tree canopy material, and they are illustrated in the RGB-BM temperature map of the MC 5 (Figure 5 left image column). The ExG index, which is the basis for the RGB-BM method, seemingly had difficulty differentiating between the different types of plant material. However, this method was noticeably able to detect slight differences between canopy and non-canopy pixels within the tree canopy, in contrast to the 2PE, ED, and VS methods which pixels were all relatively coarse.
The VS method histogram is characterized by a larger number of pixels between 38 and 47 °C compared to the other methods (Figure 5), indicating that not all mixed pixels have been properly removed. The edges of canopy material (between one and three pixels) are noticeably warmer than other parts of the canopy throughout the orchard. Additionally, many between-row pixels of the MC 4 (not shown) were misidentified as canopy pixels. The MC 4 was defined as stressed and irrigated according to the SWPe value. Over-irrigation supposedly caused waterlogging in specific locations and relatively wet soil in others, and it directly affected the pixel temperature in this MC (Figure 3 outlier).
Visible differences were evident between the spatial patterns of the extracted canopy pixels and the coolest 33% of the canopy pixels for each canopy extraction method (Figure 5); however, relatively small differences were noted in the spatial patterns between the coolest 33% canopy pixels of all extraction methods (Figure 5 right image column). Notable differences were found between the canopy temperatures calculated using the average 100% of canopy pixels (T100%) and the average of the coolest 33% of canopy pixels (T33%) (Figure 6). The average T100% values were higher than those of T33% for each canopy extraction method: 1.28 °C (ED), 1.37 °C (2PE), 2.85 °C (RGB-BM), and 3.02 °C (VS). Additionally, the T100% calculation emphasized the differences between the extraction methods. The RGB-BM and VS methods yielded considerably higher T100% than the 2PE and ED methods. The value of the VS method was, on average, 1.91 °C higher than the 2PE method, while the average differences between the 2PE and ED methods were minimal (0.13 °C). The T33% dataset was characterized by minimal to slight differences between the canopy extraction methods: an average difference of 0.04 °C between the 2PE and ED methods and of 0.26 °C between the VS and 2PE methods.

3.3. Orchard Water Status Estimation

The CWSI_T100% values were substantially higher than the CWSI_T33% values per MC, per date, and per canopy extraction method, and they mirrored the trends found in the canopy temperature calculated using T100% and T33% (Figure 7). The average difference between the CWSI_100% and CWSI_T33% values for each canopy extraction method was as follows: 0.28 (ED), 0.30 (2PE), 0.67 (RGB-BM), and 0.68 (VS). Within the CWSI_T100% dataset, minimal differences were recorded between the 2PE and ED methods (0.02), while large differences were calculated between the 2PE and VS methods (0.42). In the CWSI_T33% dataset, no difference was found between the 2PE and ED methods, and a difference of 0.03 was calculated between the VS and 2PE methods.

3.3.1. SWP-CWSI Model Comparison

The relationship between the measured SWP and CWSI was modeled for all four canopy extraction methods and the two temperature calculations (Figure 8). The CWSI_T100% values are higher than the CWSI_T33% values per tree as expected. The R2 is higher and the RMSE is lower for all of the CWSI_T33%-based models in comparison to the CWSI_T100%-based models, regardless of extraction method, which possibly resulted from the higher variability of canopy temperature per tree with the CWSI_T100% calculation. The intercept of the CWSI_T100%-based models is significantly higher than CWSI-T33% for all canopy extraction methods. There is a significant difference in slope between the CWSI_T100%-based and CWSI_T33%-based models for the 2PE and ED methods (p < 0.0001), while no significant difference is detected for the VS and RGB-BM methods (p > 0.05). The slope signifies the sensitivity of CWSI in relation to the change in measured SWP. Within the CWSI_T100%-based models, the slopes of the 2PE and ED methods are significantly different (steeper) than the VS and RGM-BM methods (p < 0.0001) when each model was compared to the other models. No difference is found between the intercepts of these models. Within the CWSI_T33%-based models, no difference is found in the slope or intercept. All eight models are significant (p < 0.0001), enabling the estimation of SWP based on these relationships.

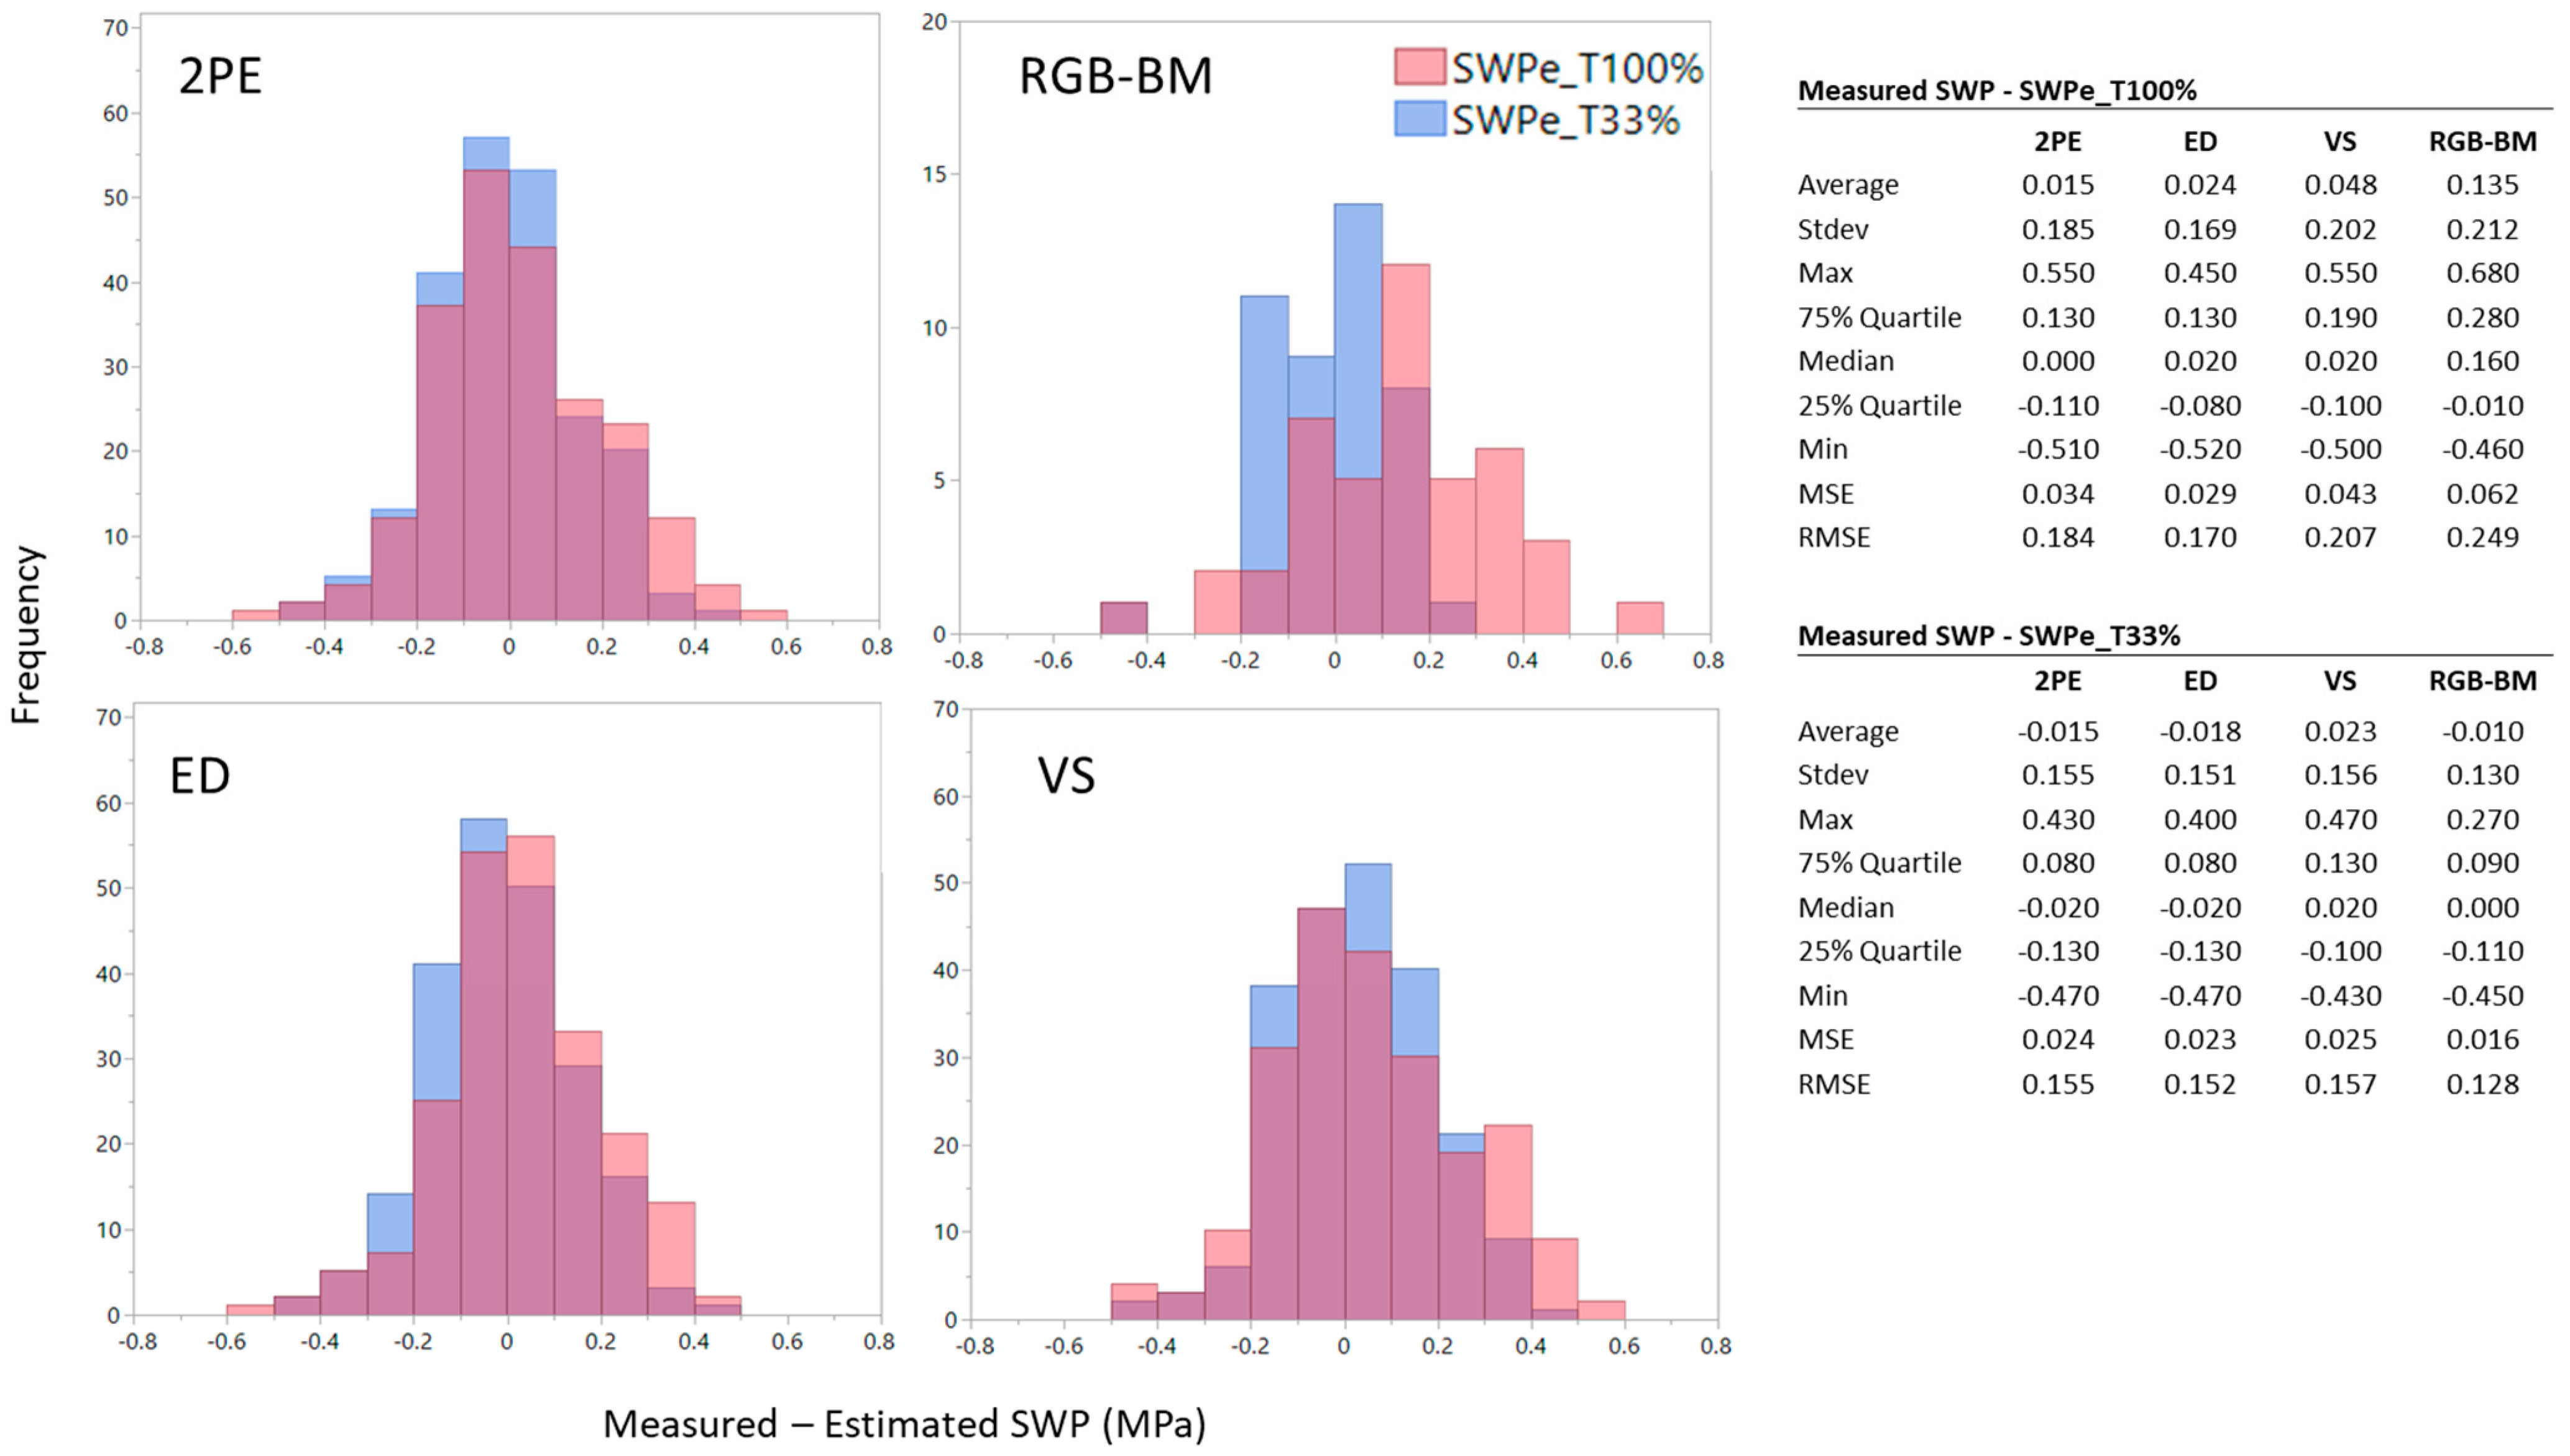
3.3.2. Estimated Stem Water Potential

The difference between the measured and estimated SWP values was calculated per MC for each canopy extraction and temperature calculation method, highlighting the differences between the datasets (Figure 9). A value of zero indicates no difference between the measured and estimated SWP. Positive values indicate that the estimated SWP is lower (more negative, the MC more stressed) than the measured SWP. Conversely, negative values indicate that the estimated SWP value is higher (less negative, the MC less stressed) than the measured SWP values. The average difference between the measured and estimated SWP (SWPe_T100%) in the RGB-BM dataset is substantially higher in comparison to the other canopy extraction methods and indicates a shift to more positive values, in comparison to the SWPe_T33% values. The MSE and RMSE values reinforce this point and indicate that the SWPe_T100% values of both the RGB-BM and the VS extraction methods are higher than the measured SWP values, indicating that the extraction quality is poorer than the 2PE and ED methods. The average differences between the measured and estimated SWP (SWPe_T33%) for each extraction method are mostly negative and close to zero. The histogram analysis, MSE, and RMSE all indicate that the 2PE, ED, and VS methods are similar to each other, while the RGB-BM is slightly different. These results suggest that theoretical irrigation decisions based on the SWPe_T33% values of the 2PE, ED, and VS methods would yield similar results.
The distribution of the SWPe_T100% and SWPe_T33% values for each canopy extraction method were compared to the defined optimal SWP range for stage III (between −1.17 and −1.43 MPa) (Figure 10). Within the SWPe_T100% dataset, the RGB-BM distribution is noticeably offset to more negative SWP values, and a substantially high percentage of below-range values (75%) were calculated, indicating that the orchard was estimated to be under greater stress in comparison to the 2PE and ED methods. Forty-three percent of the VS method’s SWPe values are below the optimum range. The majority of the SWPe values of the 2PE and ED (63%) methods are within the optimal range of orchard water status. The SWPe_T33% dataset is characterized by a higher percentage of values within the optimal range of orchard water status for each canopy extraction method in comparison to the SWPe_T100% dataset. Additionally, the variance of the SWPe_T33% values is substantially smaller in comparison to the SWPe_T100% dataset for each extraction method. A negligible percentage of above-range SWPe values was calculated, indicating that the orchard is theoretically not over-irrigated. The measured SWP distribution is similar to the SWPe_T100% ED method dataset.

4. Discussion

Canopy extraction that is based purely on the temperature attribute assumes a distinct difference between soil and canopy temperatures. While this is largely true, canopy temperature can be similar to shadowed or wet soil [40], and the temperature of mixed pixels can be similar to canopy suffering from water stress [16]. In comparison, the canopy of RGB images has a different multispectral signature than soil, enabling the use of spectral vegetation indices for canopy classification. Accordingly, the ExG index, a popular index for vegetation identification [41], served as the basis for binary thresholding in this study. RGB images also have higher spatial resolution in comparison to thermal images. These two characteristics led to the assumption that RGB-based canopy extraction would be more accurate than using a single thermal image. This assumption was supported to some extent by this study. Higher accuracy of canopy extraction was obtained by the RGB-based method compared to the thermal-based methods. However, between-row weeds were misclassified as tree canopy with the RGB-based method, leading to an atypical increase in canopy area during stage III. Additionally, inaccuracies in geographical and geometrical fit between the RGB mask and the thermal image are a known drawback with multi-source methods, such as RGB-BM [2], and explain the inclusion of warm canopy edges in the canopy mask.
Between-row weeds and canopy edges are highly affected by surrounding high soil temperatures, therefore leading to the overestimation of canopy temperature and CWSI in this study. Camino et al. [16] also found that warm edge pixels cause significant errors in almond tree canopy temperature and CWSI values. The VS method also included warm temperature pixels on the edges of all trees in the orchard. Similar to the RGB-BM method, the VS canopy temperature and CWSI values were higher in comparison to the 2PE and ED methods. Conversely, the 2PE and ED methods were both able to adequately remove canopy edge pixels by incorporating morphological erosion and edge detection algorithms, respectively. The difference between these two groups of methods, 2PE–ED and VS–RGB-BM, was also evident in the SWP–CWSI linear models calculated using the CWSI_T100% values. The superiority of the 2PE and ED extraction methods over the RGB-BM method implies that the multispectral nature and the high spatial resolution of the RGB images do not obviate the need to incorporate spatial analyses, such as morphological erosion and edge detection algorithms. This suggests that the contribution of the RGB images is not significant for the canopy extraction stage and canopy pixels can be extracted with high accuracy and reliability merely with thermal images. Furthermore, the multi-source approach is slightly more complex and time consuming than the one-source approach, primarily due to the critical georeferencing step. Thus, it is concluded that one-source thermal-based approaches can be preferably used for canopy extraction.
Canopy temperature was estimated in this study using the average of all canopy pixels (T100%) [7,10] and of the coolest 33% canopy pixels (T33%) [6,26,27]. The T100% values were substantially higher than the T33% values for all MCs, dates, and canopy extraction methods. Within-crown temperature variability has been documented for almond trees [16,42] and is partially affected by the inclusion of pixels at the edge of the canopy. The T33% approach is less influenced by canopy temperature heterogeneity [6] and minimizes the effect of mixed pixels. This idea is reinforced in the present study by the similar spatial patterns and canopy temperatures between the canopy extraction methods using the T33% calculation approach. The significant effect on temperature using the T100% approach resulted in a pronounced effect on the CWSI.
Substantial differences were apparent between the extraction methods within the CWSI_T100% dataset (Figure 7). The VS and RGB-BM values reached unexpectedly high values for well-watered peach trees: 0.53–1.37 (VS) and 0.45–1.39 (RGB-BM). Furthermore, the maximum CWSI_T100% values of the 2PE and ED methods were extremely high: 0.77 (2PE) and 0.82 (ED). A CWSI value of one indicates an extremely stressed peach tree with closed stomata. For reference, in one of the experimental plots that formed the basis for the SWP–CWSI models in this study, irrigation was suspended for a total of three weeks prior to the imaging campaign. In this plot, and in stark contrast to the VS method, the CWSI_T100% values of the measurement trees ranged between 0.58 and 0.96. CWSI values higher than one imply that non-canopy pixels are included in the calculation. In contrast, no significant differences were found between the CWSI values that were calculated using the T33% approach. Additionally, and similar to the findings of Cohen et al. (2017) in cotton, the SWP–CWSI models using the T100% approach were inferior in comparison to the T33% approach. Most importantly, the T33% dataset produced similar SWP–CWSI models irrespective of the canopy extraction method used, while the T100% yielded very different models. These results highlight the robustness of the T33% approach and indicate that it is not sensitive to the canopy extraction accuracy.
The robustness of the T33% approach is further emphasized by comparing the SWPe values to the optimal water status range. This optimal range of SWP constitutes the basis for irrigation decision making [27]. Therefore, a comparison of the SWPe distribution to the optimal range can indicate the extent to which a specific canopy extraction method is prone to water stress overestimation and leads to hypothetical over-irrigation as a result. Within the SWPe_T33%, a large percentage of the estimated SWP values were within range for the 2PE, ED, and VS methods, indicating a theoretical irrigation policy that adequately brings and maintains the MC in the optimal range. Higher percentages of above-range SWP values were calculated with the VS and RGM-BM methods (compared to additional extraction methods), indicating that the orchard was supposedly under a higher degree of stress, necessitating increased irrigation.
The comparison of the SWPe_T100% distribution of values to the optimal water status range further reinforces the fact that the estimated SWP values calculated with the T100% method, and in particular using the RGB-BM canopy extraction method, possibly overestimate orchard water status, hypothetically resulting in more-than-optimal irrigation application with subsequent agronomic and economic consequences [32]. It should be noted that none of the canopy extraction methods or temperature calculation methods sufficiently estimated above-range (less negative) water status or below-range extremely stressed (more negative) values in the SWPe_T33% dataset. This result, rather than indicating the quality of the canopy extraction, signifies a general limitation of water status assessment using thermal images. Thermal-based water status estimation suffers from different types of inaccuracies, including the effect of meteorological conditions and different approaches for determination of Twet and Tdry values.

5. Conclusions

The current study explored the sensitivity of thermal image-based orchard water status estimation to canopy extraction quality using four canopy extraction methods, which was previously unaddressed in scientific literature. Three methods used a single thermal image (1-source) (2PE, ED, and VS), while a fourth method incorporated a thermal and an RGB image (multi-source) (RGB-BM). Two approaches to canopy temperature calculation were also evaluated: the average of all canopy pixels (T100%) and the average of the coolest 33% of canopy pixels (T33%). This study found that canopy pixels can be extracted with high accuracy and reliability using only thermal images, primarily using the 2PE and ED methods. The incorporation of an RGB image reduces the overall quality, as between-row weeds and warm canopy edges are misidentified as tree canopy. Additionally, the T33% approach to canopy temperature calculation was found to be robust and not sensitive to canopy extraction accuracy. In comparison, the T100% approach, specifically for the VS and RGB-BM methods, overestimated orchard water stress. These findings indicate that orchard water status is sensitive to canopy extraction quality but is affected to a greater degree by the canopy temperature calculation approach. Future research should explore the relationship between SWP and CWSI on additional days, under different meteorological conditions, and over seasons to strengthen the estimation of orchard water status. Future research should also explore the sensitivity of orchard water status to canopy extraction quality in additional varieties of peach and other fruit trees located in different environments. Such research studies will widen the scope of impact and scale of the main findings from this study, improving irrigation management based on thermal images.

Author Contributions

Conceptualization, L.K. and Y.C.; Methodology, L.K. and Y.C.; Software, E.G.; Validation, L.K.; Formal Analysis, L.K. and S.M.; Investigation, L.K., G.L., O.K. and V.A.; Resources, G.L., O.K. and V.A.; Data Curation, L.K., S.M. and E.G.; Writing—Original Draft Preparation, L.K.; Writing—Review and Editing, L.K., Y.C., A.B.-G., M.I.L., A.P. and E.G.; Visualization, L.K.; Supervision Y.C., A.B.-G. and M.I.L.; Project Administration, L.K., A.N. and V.A.; Funding Acquisition, Y.C., A.B.-G. and V.A. All authors have read and agreed to the published version of the manuscript.

Funding

This research was a part of the “Eugene Kendel” Project for the Development of Precision Drip Irrigation funded via the Ministry of Agriculture and Rural Development in Israel (Grant No. 20-12-0030). The project also received funding from the European Union’s Horizon 2020 research and innovation program under Project SHui, grant agreement No 773903.

Data Availability Statement

Data sharing not applicable.

Acknowledgments

The authors would like to thank the grower, Shlomo Cohen, for collaborating and allowing the research to be conducted in his peach orchard; Reshef Elmakais, Tomer Hagai, and Ohad Masad, for field measurements and technical support; and Datamap company for imagery acquisition and pre-processing.

Conflicts of Interest

The authors declare that they have no conflict of interest.

Abbreviations

CWSIcrop water stress index
CWSI_T33%crop water stress index calculated with the average temperature of the coolest 33% of canopy pixels
CWSI_T100%crop water stress index calculated with the average temperature of 100% of canopy pixels
EDedge detection
ExGexcess green index
MCmanagement cell
RGB-BMred –green–blue binary masking
SWPstem water potential (MPa)
SWPe_T33%estimated stem water potential using the average temperature of the coolest 33% of canopy pixels (MPa)
SWPe_T100%estimated stem water potential using the average temperature of 100% of canopy pixels (MPa)
T33%average temperature of the coolest 33% of canopy pixels
T100%average temperature of 100% of canopy pixels
VSvegetation segmentation
2PE2-pixel erosion

References

  1. Gonzalez-Dugo, V.; Zarco-Tejada, P.J. Assessing the Impact of Measurement Errors in the Calculation of CWSI for Characterizing the Water Status of Several Crop Species. Irrig. Sci. 2022, 1–13. [Google Scholar] [CrossRef]
  2. Zhou, Z.; Majeed, Y.; Diverres Naranjo, G.; Gambacorta, E. Assessment for Crop Water Stress with Infrared Thermal Imagery in Precision Agriculture: A Review and Future Prospects for Deep Learning Applications. Comput. Electron. Agric. 2021, 182, 106019. [Google Scholar] [CrossRef]
  3. Jones, H.G. Use of Infrared Thermometry for Estimation of Stomatal Conductance as a Possible Aid to Irrigation Scheduling. Agric. For. Meteorol. 1999, 95, 139–149. [Google Scholar] [CrossRef]
  4. Idso, S.B.; Jackson, R.D.; Pinter, P.J.; Reginato, R.J.; Hatfield, J.L. Normalizing the Stress-Degree-Day Parameter for Environmental Variability. Agric. Meteorol. 1981, 24, 45–55. [Google Scholar] [CrossRef]
  5. Jackson, R.D.; Idso, S.B.; Reginato, R.J.; Pinter, P.J. Canopy Temperature as a Crop Water Stress Indicator. Water Resour. Res. 1981, 17(4), 1133–1138. [Google Scholar] [CrossRef]
  6. Meron, M.; Tsipris, J.; Orlov, V.; Alchanatis, V.; Cohen, Y. Crop Water Stress Mapping for Site-Specific Irrigation by Thermal Imagery and Artificial Reference Surfaces. Precis. Agric. 2010, 11, 148–162. [Google Scholar] [CrossRef]
  7. Gonzalez-Dugo, V.; Zarco-Tejada, P.; Nicolás, E.; Nortes, P.A.; Alarcón, J.J.; Intrigliolo, D.S.; Fereres, E. Using High Resolution UAV Thermal Imagery to Assess the Variability in the Water Status of Five Fruit Tree Species within a Commercial Orchard. Precis. Agric. 2013, 14, 660–678. [Google Scholar] [CrossRef]
  8. Cohen, Y.; Alchanatis, V.; Saranga, Y.; Rosenberg, O.; Sela, E. Mapping Water Status Based on Aerial Thermal Imagery: Comparison of Methodologies for Upscaling from a Single Leaf to Commercial Fields. Precis. Agric. 2017, 18, 801–822. [Google Scholar] [CrossRef]
  9. Rud, R.; Cohen, Y.; Alchanatis, V.; Levi, A.; Brikman, R.; Shenderey, C.; Heuer, B.; Markovitch, T.; Dar, Z.; Rosen, C.; et al. Crop Water Stress Index Derived from Multi-Year Ground and Aerial Thermal Images as an Indicator of Potato Water Status. Precis. Agric. 2014, 15, 273–289. [Google Scholar] [CrossRef]
  10. Gonzalez-Dugo, V.; Goldhamer, D.; Zarco-Tejada, P.J.; Fereres, E. Improving the Precision of Irrigation in a Pistachio Farm Using an Unmanned Airborne Thermal System. Irrig. Sci. 2015, 33, 43–52. [Google Scholar] [CrossRef]
  11. Rud, R.; Cohen, Y.; Alchanatis, V.; Beiersdorf, I.; Klose, R.; Presnov, E.; Levi, A.; Brikman, R.; Agam, N.; Dag, A.; et al. Characterization of Salinity-Induced Efects in Olive Trees Based on Thermal Imagery. In Proceedings of the 10th European Conference on Precision Agriculture; Stafford, J.V., Ed.; Wageningen Academic Publishers: Rishon-LeZion, Israel, 2015; pp. 511–518. [Google Scholar]
  12. Egea, G.; Padilla-Díaz, C.M.; Martinez-Guanter, J.; Fernández, J.E.; Pérez-Ruiz, M. Assessing a Crop Water Stress Index Derived from Aerial Thermal Imaging and Infrared Thermometry in Super-High Density Olive Orchards. Agric. Water Manag. 2017, 187, 210–221. [Google Scholar] [CrossRef] [Green Version]
  13. Agam, N.; Cohen, Y.; Berni, J.A.J.; Alchanatis, V.; Kool, D.; Dag, A.; Yermiyahu, U.; Ben-Gal, A. An Insight to the Performance of Crop Water Stress Index for Olive Trees. Agric. Water Manag. 2013, 118, 79–86. [Google Scholar] [CrossRef]
  14. Cohen, Y.; Alchanatis, V.; Prigojin, A.; Levi, A.; Soroker, V.; Cohen, Y. Use of Aerial Thermal Imaging to Estimate Water Status of Palm Trees. Precis. Agric. 2012, 13, 123–140. [Google Scholar] [CrossRef]
  15. Baluja, J.; Diago, M.P.; Balda, P.; Zorer, R.; Meggio, F.; Morales, F.; Tardaguila, J. Assessment of Vineyard Water Status Variability by Thermal and Multispectral Imagery Using an Unmanned Aerial Vehicle (UAV). Irrig. Sci. 2012, 30, 511–522. [Google Scholar] [CrossRef]
  16. Camino, C.; Zarco-Tejada, P.J.; Gonzalez-Dugo, V. Effects of Heterogeneity within Tree Crowns on Airborne-Quantified SIF and the CWSI as Indicators of Water Stress in the Context of Precision Agriculture. Remote Sens. 2018, 10, 604. [Google Scholar] [CrossRef] [Green Version]
  17. Nixon, M.S.; Aguado, A.S. Region-Based Analysis. In Feature Extraction and Image Processing for Computer Vision, 4th ed.; Nixon, M.S., Aguado, A.S., Eds.; Academic Press: Cambridge, MA, USA, 2020; pp. 399–432. [Google Scholar]
  18. Zhou, Y.; Wang, L.; Jiang, K.; Xue, L.; An, F.; Chen, B.; Yun, T. Individual Tree Crown Segmentation Based on Aerial Image Using Superpixel and Topological Features. J. Appl. Remote Sens. 2020, 14, 1. [Google Scholar] [CrossRef]
  19. Maheswari, P.; Raja, P.; Apolo-Apolo, O.E.; Pérez-Ruiz, M. Intelligent Fruit Yield Estimation for Orchards Using Deep Learning Based Semantic Segmentation Techniques—A Review. Front. Plant Sci. 2021, 12, 684328. [Google Scholar] [CrossRef]
  20. Katz, L.; Ben-Gal, A.; Litaor, M.I.; Naor, A.; Peres, M.; Bahat, I.; Netzer, Y.; Peeters, A.; Alchanatis, V.; Cohen, Y. Spatiotemporal Normalized Ratio Methodology to Evaluate the Impact of Field-Scale Variable Rate Application. Precis. Agric. 2022, 23, 1125–1152. [Google Scholar] [CrossRef]
  21. Park, S.; Ryu, D.; Fuentes, S.; Chung, H.; Hernández-Montes, E.; O’Connell, M. Adaptive Estimation of Crop Water Stress in Nectarine and Peach Orchards Using High-Resolution Imagery from an Unmanned Aerial Vehicle (UAV). Remote Sens. 2017, 9, 828. [Google Scholar] [CrossRef] [Green Version]
  22. Bian, J.; Zhang, Z.; Chen, J.; Chen, H.; Cui, C.; Li, X.; Chen, S.; Fu, Q. Simplified Evaluation of Cotton Water Stress Using High Resolution Unmanned Aerial Vehicle Thermal Imagery. Remote Sens. 2019, 11, 267. [Google Scholar] [CrossRef] [Green Version]
  23. Cohen, Y.; Alchanatis, V.; Meron, M.; Saranga, Y.; Tsipris, J. Estimation of Leaf Water Potential by Thermal Imagery and Spatial Analysis. J. Exp. Bot. 2005, 56, 1843–1852. [Google Scholar] [CrossRef] [PubMed] [Green Version]
  24. Osroosh, Y.; Khot, L.R.; Peters, R.T. Economical Thermal-RGB Imaging System for Monitoring Agricultural Crops. Comput. Electron. Agric. 2018, 147, 34–43. [Google Scholar] [CrossRef]
  25. Zhou, Z.; Diverres, G.; Kang, C.; Thapa, S.; Karkee, M.; Zhang, Q.; Keller, M. Ground-Based Thermal Imaging for Assessing Crop Water Status in Grapevines over a Growing Season. Agronomy 2022, 12, 322. [Google Scholar] [CrossRef]
  26. Bahat, I.; Netzer, Y.; Grünzweig, J.M.; Alchanatis, V.; Peeters, A.; Goldshtein, E.; Ohana-Levi, N.; Ben-Gal, A.; Cohen, Y. In-Season Interactions between Vine Vigor, Water Status and Wine Quality in Terrain-Based Management-Zones in a ‘Cabernet Sauvignon’ Vineyard. Remote Sens. 2021, 13, 1636. [Google Scholar] [CrossRef]
  27. Katz, L.; Ben-Gal, A.; Litaor, M.I.; Naor, A.; Peres, M.; Peeters, A.; Alchanatis, V.; Cohen, Y. A Spatiotemporal Decision Support Protocol Based on Thermal Imagery for Variable Rate Drip Irrigation of a Peach Orchard. Irrig. Sci. 2022, 42, 1118–1126. [Google Scholar] [CrossRef]
  28. Dag, A.; Alchanatis, V.; Zipori, I.; Sprinstin, M.; Cohen, A.; Maravi, T.; Naor, A. Automated Detection of Malfunctions in Drip-Irrigation Systems Using Thermal Remote Sensing in Vineyards and Olive Orchards. In Precision Agriculture ’15; Wageningen Academic Publishers: Rishon-LeZion, Israel, 2015; pp. 12–23. [Google Scholar]
  29. Kalo, N.; Edan, Y.; Alchanatis, V. Detection of Irrigation Malfunctions Based on Thermal Imaging. In Proceedings of the Precision Agriculture’21; Wageningen Academic Publishers: Noordwijk, The Netherlands, 2021; pp. 2217–2224. [Google Scholar]
  30. Otsu, N. A Threshold Selection Method from Gray-Level Histograms. IEEE Trans. Syst. Man. Cybern. 1979, 9, 62–66. [Google Scholar] [CrossRef] [Green Version]
  31. Hamuda, E.; Glavin, M.; Jones, E. A Survey of Image Processing Techniques for Plant Extraction and Segmentation in the Field. Comput. Electron. Agric. 2016, 125, 184–199. [Google Scholar] [CrossRef]
  32. Steduto, P.; Hsiao, T.C.; Fereres, E.; Raes, D. Crop Yield Response to Water; Food and Agriculture Organization of the United Nations: Rome, Italy, 2012; Volume 1028. [Google Scholar]
  33. Zhong, L.; Hu, L.; Zhou, H. Deep Learning Based Multi-Temporal Crop Classification. Remote Sens. Environ. 2019, 221, 430–443. [Google Scholar] [CrossRef]
  34. Hijmans, R.J. Raster: Geographic Data Analysis and Modeling. 2019. Available online: https://rspatial.org/raster (accessed on 10 January 2022).
  35. Bivand, R.; Keitt, T.; Rowlingson, B. Rgdal: Bindings for the “Geospatial” Data Abstraction Library. 2019. Available online: http://rgdal.r-forge.r-project.org/ (accessed on 10 January 2022).
  36. Wickham, H. Reshaping Data with the {reshape} Package. J. Stat. Softw. 2007, 21, 1–20. [Google Scholar] [CrossRef]
  37. R Core Team R: A Language and Environment for Statistical Computing; R Core Team: Vienna, Austria, 2019.
  38. Wickham, H. Ggplot2: Elegant Graphics for Data Analysis; Springer-Verlag: New York, NY, USA, 2016; ISBN 978-3-319-24277-4. [Google Scholar]
  39. Shimshowitz, E. The Effect of Irrigation and Crop Load on Crop Yield Anf Fruit Size Distribution in Nectarine Cv. Arctic Mist. Master’s Thesis, Tel Hai Academic College, Upper Galilee, Qiryat Shemona, Israel, 2018. [Google Scholar]
  40. Meron, M.; Sprintsin, M.; Tsipris, J.; Alchanatis, V.; Cohen, Y. Foliage Temperature Extraction from Thermal Imagery for Crop Water Stress Determination. Precis. Agric. 2013, 14, 467–477. [Google Scholar] [CrossRef]
  41. Lee, M.K.; Golzarian, M.R.; Kim, I. A New Color Index for Vegetation Segmentation and Classification. Precis. Agric. 2021, 22, 179–204. [Google Scholar] [CrossRef]
  42. Gonzalez-Dugo, V.; Zarco-Tejada, P.; Berni, J.A.J.; Suárez, L.; Goldhamer, D.; Fereres, E. Almond Tree Canopy Temperature Reveals Intra-Crown Variability That Is Water Stress-Dependent. Agric. For. Meteorol. 2012, 154–155, 156–165. [Google Scholar] [CrossRef]
Figure 1. Mishmar Hayarden peach orchard (green line) divided into 22 management cells (MC) (black dashed squares).
Remotesensing 15 01448 g001
Figure 2. Data acquisition and analysis of orchard canopy extraction accuracy, canopy temperature, and orchard water status using the 2-pixel erosion (2PE), edge detection (ED), vegetation segmentation (VS), and RGB binary masking (RGB-BM) canopy extraction methods (green boxes). Canopy temperature per management cell (MC) was calculated using the average of 100% of canopy pixels (T100%) (orange boxes) and the average of the coolest 33% of canopy pixels (T33%) (blue boxes). Orchard water status was estimated using the crop water stress index (CWSI) and the estimated stem water potential (SWPe). The SWPe was based on a tree-scale stem water potential (SWP) and CWSI relationship established using each canopy extraction method and each canopy temperature calculation approach.
Remotesensing 15 01448 g002
Figure 3. Canopy area (m2) per management cell (MC) (black dots) and box plot (red) per day of image acquisition (21 July–26 August 2019). The black horizontal line is the grand mean. The green boxes indicate data from 21 July and 12 August of the 2-pixel erosion (2PE), edge detection (ED), and vegetation segmentation (VS) methods. The RGM binary masking (RGB-BM) method was performed only on these dates. Note: the Y-axis range of the VS method is specifically different from the other methods.
Remotesensing 15 01448 g003
Figure 4. Overall accuracy (blue bars) of canopy/non-canopy classification and precision (red bars), recall (yellow bars), and F1-score (grey bars) parameters of canopy classification as measured with a confusion matrix per date for the 2-pixel erosion (2PE), edge detection (ED), vegetation segmentation (VS), and RGB binary masking (RGB-BM) canopy extraction methods.
Remotesensing 15 01448 g004
Figure 5. Canopy temperature histogram of the whole orchard for the 2-pixel erosion (2PE), edge detection (ED), vegetation segmentation (VS), and RGB binary masking (RGB-BM) canopy extraction methods on 12 August 2019. Images of all extracted canopy temperature pixels (T100%) of the management cell (MC) 5 (left image column) and the highlighted (turquoise) coolest 33% of canopy temperature pixels (T33%) (right image column) for all canopy extraction methods.
Remotesensing 15 01448 g005
Figure 6. Canopy temperature (°C) calculated by the average 100% (T100%) and by the average of the coolest 33% (T33%) of canopy pixels per management cell (MC) between 21 July and 26 Aug 2019 for the canopy extraction methods: 2-pixel erosion (2PE) (turquoise), edge detection (dark blue), vegetation segmentation (VS) (coral), and RGB binary masking (RGB-BM) (brick red).
Remotesensing 15 01448 g006
Figure 7. Crop water status index (CWSI) with Tcanopy (°C) calculated using the average 100% (CWSI_T100%) and the average of the coolest 33% (CWSI_T33%) of canopy pixels. Twet = lowest 5% of canopy pixels, and Tdry = Tair + 2 °C. Values per management cell (MC) between 21 July and 26 August 2019 for the canopy extraction methods: 2-pixel erosion (2PE) (turquoise), edge detection (ED) (dark blue), vegetation segmentation (VS) (coral), and RGB binary masking (RGB-BM) (brick red). The table insert shows the air temperature (Tair (°C)) values.
Remotesensing 15 01448 g007
Figure 8. Linear regression model of SWP and CWSI for the 2-pixel erosion (2PE), edge detection (ED), vegetation segmentation (VS), and RGB binary masking (RGB-BM) canopy extraction methods. Crop water status index (CWSI) with Tcanopy (°C) calculated using the average 100% (CWSI_T100%) (red points and lines) and the average of the coolest 33% (CWSI_T33%) (blue points and lines) of canopy pixels. Twet = lowest 5% of canopy pixels, and Tdry = Tair + 2 °C. Each point represents a measurement tree (n = 15).
Remotesensing 15 01448 g008
Figure 9. The histogram of the difference between the measured and estimated stem water potential (SWPe) calculated using the canopy temperature data of the average 100% (SWPe_T100%) (pink bars) and the average of the coolest 33% (SWPe_T33%) (blue bars) of canopy pixels for the 2-pixel erosion (2PE), edge detection (ED), vegetation segmentation (VS), and RGB binary masking (RGB-BM) canopy extraction methods. The frequency refers to the number of management cells (MC). The table insert provides the descriptive statistics of each dataset. Note: the Y-axis range of the RGB-BM method is specifically different from the other methods.
Remotesensing 15 01448 g009
Figure 10. Histogram of percent estimated stem water potential (SWPe) (MPa) calculated using the canopy temperature data of the average 100% (SWPe_T100%) and the average of the coolest 33% (SWPe_T33%) of canopy pixels in comparison to the defined optimal SWP range for stage III: upper (−1.17 Mpa, blue dashed line) and lower (−1.43 Mpa, red dashed line) thresholds. Below-range SWP values indicate orchard stress, while above-range water status values indicate theoretical over-irrigation. The canopy extraction methods tested were 2-pixel erosion (2PE, turquoise polygon), edge detection (ED, blue polygon), vegetation segmentation (VS, pink polygon), and RGB binary masking (RGB-BM, red polygon).
Remotesensing 15 01448 g010
Disclaimer/Publisher’s Note: The statements, opinions and data contained in all publications are solely those of the individual author(s) and contributor(s) and not of MDPI and/or the editor(s). MDPI and/or the editor(s) disclaim responsibility for any injury to people or property resulting from any ideas, methods, instructions or products referred to in the content.

