Article

Performance Analysis of Precipitation Datasets at Multiple Spatio-Temporal Scales over Dense Gauge Network in Mountainous Domain of Tajikistan, Central Asia

by
Manuchekhr Gulakhmadov
1,2,3,4,5,
Xi Chen
1,2,*,
Aminjon Gulakhmadov
1,2,4,
Muhammad Umer Nadeem
6,7,
Nekruz Gulahmadov
1,3 and
Tie Liu
1,2
1
State Key Laboratory of Desert and Oasis Ecology, Xinjiang Institute of Ecology and Geography, Chinese Academy of Sciences, Urumqi 830011, China
2
Research Center for Ecology and Environment of Central Asia, Xinjiang Institute of Ecology and Geography, Chinese Academy of Sciences, Urumqi 830011, China
3
University of Chinese Academy of Sciences, Beijing 100049, China
4
Institute of Water Problems, Hydropower and Ecology of the National Academy of Sciences of Tajikistan, Dushanbe 734042, Tajikistan
5
Committee for Environmental Protection under the Government of the Republic of Tajikistan, Dushanbe 734034, Tajikistan
6
Climate, Energy and Water Research Institute, National Agriculture Research Center, Islamabad 44000, Pakistan
7
Department of Land and Water Conservation Engineering, Faculty of Agricultural Engineering and Technology, PMAS-Arid Agriculture University, Rawalpindi 46000, Pakistan
*
Author to whom correspondence should be addressed.
Remote Sens. 2023, 15(5), 1420; https://doi.org/10.3390/rs15051420
Submission received: 5 February 2023 / Revised: 28 February 2023 / Accepted: 1 March 2023 / Published: 2 March 2023

Abstract

:
Cryospheric and ecological studies become very complicated due to the absence of observed data, particularly in the mountainous regions of Central Asia. Performance analysis of Satellite-Based Precipitation Datasets (SBPD) is very critical before their direct hydro-climatic applications. This study assessed the ground validation of four SBPDs (IMERG, TRMM, PERSIANN-CDR, and PERSIANN-CSS). From January 2000 to December 2013, all SBPD data were analyzed on daily, monthly, seasonal (winter, spring, summer, autumn), and annual scales at the entire spatial domain and point-to-pixel scale. The performance of SBPD was analyzed by using evaluation indices (root mean square error (RMSE), correlation coefficient (CC), bias, and relative bias (r-Bias)) along with categorical indices (false alarm ratio (FAR), probability of detection (POD), success ratio (SR), and critical success index (CSI). Results revealed that: (1) IMERG’s spatiotemporal tracking ability is better as compared to other datasets with appropriate ranges (CC > 0.8 and r-BIAS (±10)). The performance of all SBPDs is more capable on a monthly scale as compared to a daily scale. (2) In terms of POD, the IMERG outperformed all other SBPD on daily and seasonal scales. All SBPD showed underestimations in the summer season, and PERSIANN-CCS showed the most significant underestimation (−70). Moreover, the IMERG signposted the most satisfactory performance in all seasons. (3) All SBPD showed better performance in capturing the light precipitation events as indicated by the Probability Density Function (PDF%). Moreover, the performance of PERSIANN-CDR and TRMM is acceptable at low topography; the performance of PERSIANN-CCS is very poor in diverse topographical and climatic conditions over Tajikistan. Therefore, we advocate the use of daily, monthly, and seasonal estimations of IMERG precipitation product for hydro-climatic applications over the mountainous domain of Central Asia.

1. Introduction

Precipitation is a key component of the global water cycle [1]. Precipitation fills our lakes and rivers, replenishes underground aquifers, and provides water for plants and animals. The most significant climate variable is precipitation, which can increase agricultural productivity, provide drinking water, and stabilize our environmental system [2]. However, heavy precipitation could also trigger crop damage, soil erosion, severe drought events, and an increased risk of flooding, which in turn can lead to injury, drowning, and other disastrous flood-related impacts [3]. As a result, it is crucial to quantify and track precipitation magnitude, regional distribution, and temporal variability [4,5]. As a tradition, researchers and specialists in the field of hydrology and climatology believe that precipitation data, which are based on measurements at ground-based recording points, are the most reliable source of precipitation measurements [6]. However, it is very difficult to maintain a uniform gauge network over rugged topography [7]. Moreover, multi-satellites and reanalysis products were introduced to overcome the scarcity of precipitation data [8]. The accuracy of satellite-based data is affected by a variety of variables, including terrain, altitude, geographical characteristics, precipitation, geological causes, and most importantly, the spatial resolution of SBPD [6]. Generally, higher spatial and temporal resolutions are provided by satellites with more advanced sensors. However, very few studies have looked at how the choice of data source (such as relatively high-resolution satellite imagery versus relatively low-resolution satellite imaging) affects accuracy analyses [6,8]. Higher spatial resolution data have typically resulted in more accurate estimates where accuracy has been evaluated, even though those studies have frequently assumed that higher-resolution data are superior, and that discrepancies in coarser-resolution data are errors [4,5,6,7,8].
However, due to complex topography and the uneven placement of weather stations [9,10], it becomes very difficult to acquire reliable data [11]. In the Pamir-Allay Mountains in Tajikistan, there are also similar limitations to acquiring precipitation data due to the infrequent or uneven installation of weather stations. Therefore, additional reliable and consistent sources of precipitation information need to be explored. In the future, it is expected that the SBPD will overcome the sparseness of precipitation data [11,12]. Although the SBPD provides continuous information related to precipitation, it is very important to assess its performance before direct application [12]. Many SBPDs have been introduced, which are freely available on their official websites [10,13]. SBPD now uses an improved precipitation estimation method. The rugged surface and in situ climatic conditions forces us to evaluate the performance of the latest SBPD (IMERG, TRMM, PERSIANN-CDR, and PERSIANN-CSS) over the dense gauge network to overcome the limitation of precipitation data. Moreover, Tajikistan is prone to natural disasters such as floods, avalanches, landslides, extreme temperatures, and droughts. Such events damage and destroy land, crops, and infrastructure, reducing sources of income and affecting the livelihoods of people. Recent research has shown that the lack of gauge data availability or scarcity is the main cause of the paucity of studies on the effects of climate change. Therefore, it becomes critical to explore different sources of precipitation products in developing countries, especially the rugged surface causing the uneven distribution of gauge networks [6]. Moreover, the literature review indicated that the detailed performance analysis of the latest SBPD (IMERG, TRMM, PERSIANN-CDR, and PERSIANN-CSS) at multiple spatiotemporal scales over the Pamir-Alay Mountains of Central Asia (Tajikistan) has not yet been conducted. Therefore, this study is evaluated to fill this major research gap. Moreover, the Ministry of Energy and Water Resources of the Republic of Tajikistan is planning to develop many hydrological structures (dams, spillways) over the entire country. According to a literature assessment, the lack of in situ meteorological stations has made it difficult to use their data for a variety of hydro-meteorological applications in the Tajikistan area [14,15]. Therefore, this study was carried out to evaluate and compare the error characteristics of four SBPD (IMERG, TRMM, PERSIANN-CDR, and PERSIANN-CSS) with observations from the available meteorological stations in the Tajikistan region. This will be the first performance analysis of the four SBPD (IMERG, TRMM, PERSIANN-CDR, and PERSIANN-CSS) over the limited gauge network of Tajikistan.
Today, SBPD uses signals from infrared (IR) and microwave (MW) sensors to feed an advanced precipitation estimating algorithm, which produces reliable data on a fine spatiotemporal scale [16]. The many SBPDs for a variety of hydro-climatic applications are available from organizations (NASA and JAXA) [9]; IMERG and TRMM are two examples of these datasets [17]. Additionally, the products in the Precipitation Estimation from Remotely Sensed Information using Artificial Neural Network PERSIANN-CDR and CCS can combine data from IR and MW sensors to produce continuous precipitation estimations [18,19,20]. In the past, several scholars have validated the SBPD’s accuracy to gauge estimations of precipitation in various domains of the world; for instance, Anjum et al. [12] evaluated PERSIANN’s products along with CHIRPS and SM2Rain. Similarly, many hydrologists have evaluated the performance of many SBPDs in different regions of the world, such as in Asia [14,15,19,20,21,22,23,24,25,26], Europe [4], Austria [10], Australia [27,28], China [7,17,26,29], and Pakistan [5,6,11,12,26].
Among the considered SBPD, PERSIANN-CCS has cloud categorization system customizable initializations [21]. The variable threshold technique used in PERSIANN-CCS, as opposed to the conventional approach, permits the identification and isolation of cloud computing spots [22]. Using information from the Global Precipitation Measurement (GPM) satellite constellation, the IMERG product offers uninterrupted estimates of precipitation. It offers quasi-global coverage and has a resolution of 0.25. The IMERG offers different forms of products (early run, late run, and final run) [10]. Previously, many researchers have analyzed the performance of many SBPDs in different parts of the world [10,23]. The findings showed the common conclusion that the accuracy of precipitation datasets mainly depends upon the in situ topographical and climatic conditions [24]. Therefore, it is very important to evaluate the performance of SBPD. The findings of this investigation will be extremely helpful to algorithmic developers, meteorologists, hydrologists, SBPD data consumers, water conservation practices, and Tajikistan policymakers.

2. Materials and Methods

2.1. Study Region

Tajikistan is one of the mountainous countries of Central Asia, and due to geographical factors, it is landlocked and stretches 700 km from west to east and 350 km from north to south. Tajikistan is located in the southeast of Central Asia between 36°40′ and 41°05′ north latitude and 67°31′ and 75°14′ east longitude. Tajikistan borders Afghanistan in the south, Kyrgyzstan in the north, China in the east, and Uzbekistan in the west. The area of the country is 142,100 km2. It should be noted that Tajikistan is separated from India and Pakistan in the southeast by the territory of Afghanistan, which is 15 to 65 km wide [1]. Tajikistan, due to its mountainous conditions and the natural precipitation in this mountainous region, has a significant impact on the hydrological system. The digital elevation model (DEM) and the available meteorological stations are evaluated in Figure 1. The general annual climate regime at an altitude of less than 1000 m is characterized by an average annual positive air temperature and relatively little precipitation. The average annual precipitation at an altitude of 1200–3200 m is 560–650 mm. Eastern Pamirs (Murgab region) precipitation is only 80 mm at an altitude of 4000 m. In the Central part of Tajikistan, at an altitude of 1500–2000 m, precipitation annually reaches 1800–2000 mm. There are differences in the amount of annual precipitation in individual regions of Tajikistan. In most of the plains and foothills of Tajikistan, the lowest precipitation of an annual cycle is typical for the eastern summer of the region. At the same time, a large amount of precipitation falls in the foothills and valleys in March-April, and in the highlands in April–May.

2.2. Datasets

In Tajikistan, in situ gauge stations are very limited and managed by many Tajikistan meteorological department weather stations. The daily data from 18 in situ gauging stations were collected. However, for this performance analysis, the daily estimations of only 18 meteorological stations were found to be reliable due to missing values (more than 30%) in other meteorological stations. Table 1 presents the locations of all meteorological stations installed in the Pamir-Allay region of Tajikistan, which were considered for this research. Previously, many studies have used these measurement-based datasets in hydro-climatic studies in mountainous areas of Central Asia [14,15]. Similarly, the detailed information (period, spatiotemporal resolutions, and data sources of SBPD (IMERG, TRMM, PERSIANN-CDR, and PERSIANN-CSS) are described in Table 2. The PERSIANN-CDR and CCS datasets are managed by the Center for Hydrometeorology and Remote Sensing (CHRS) at the University of California [25].

2.3. Methods

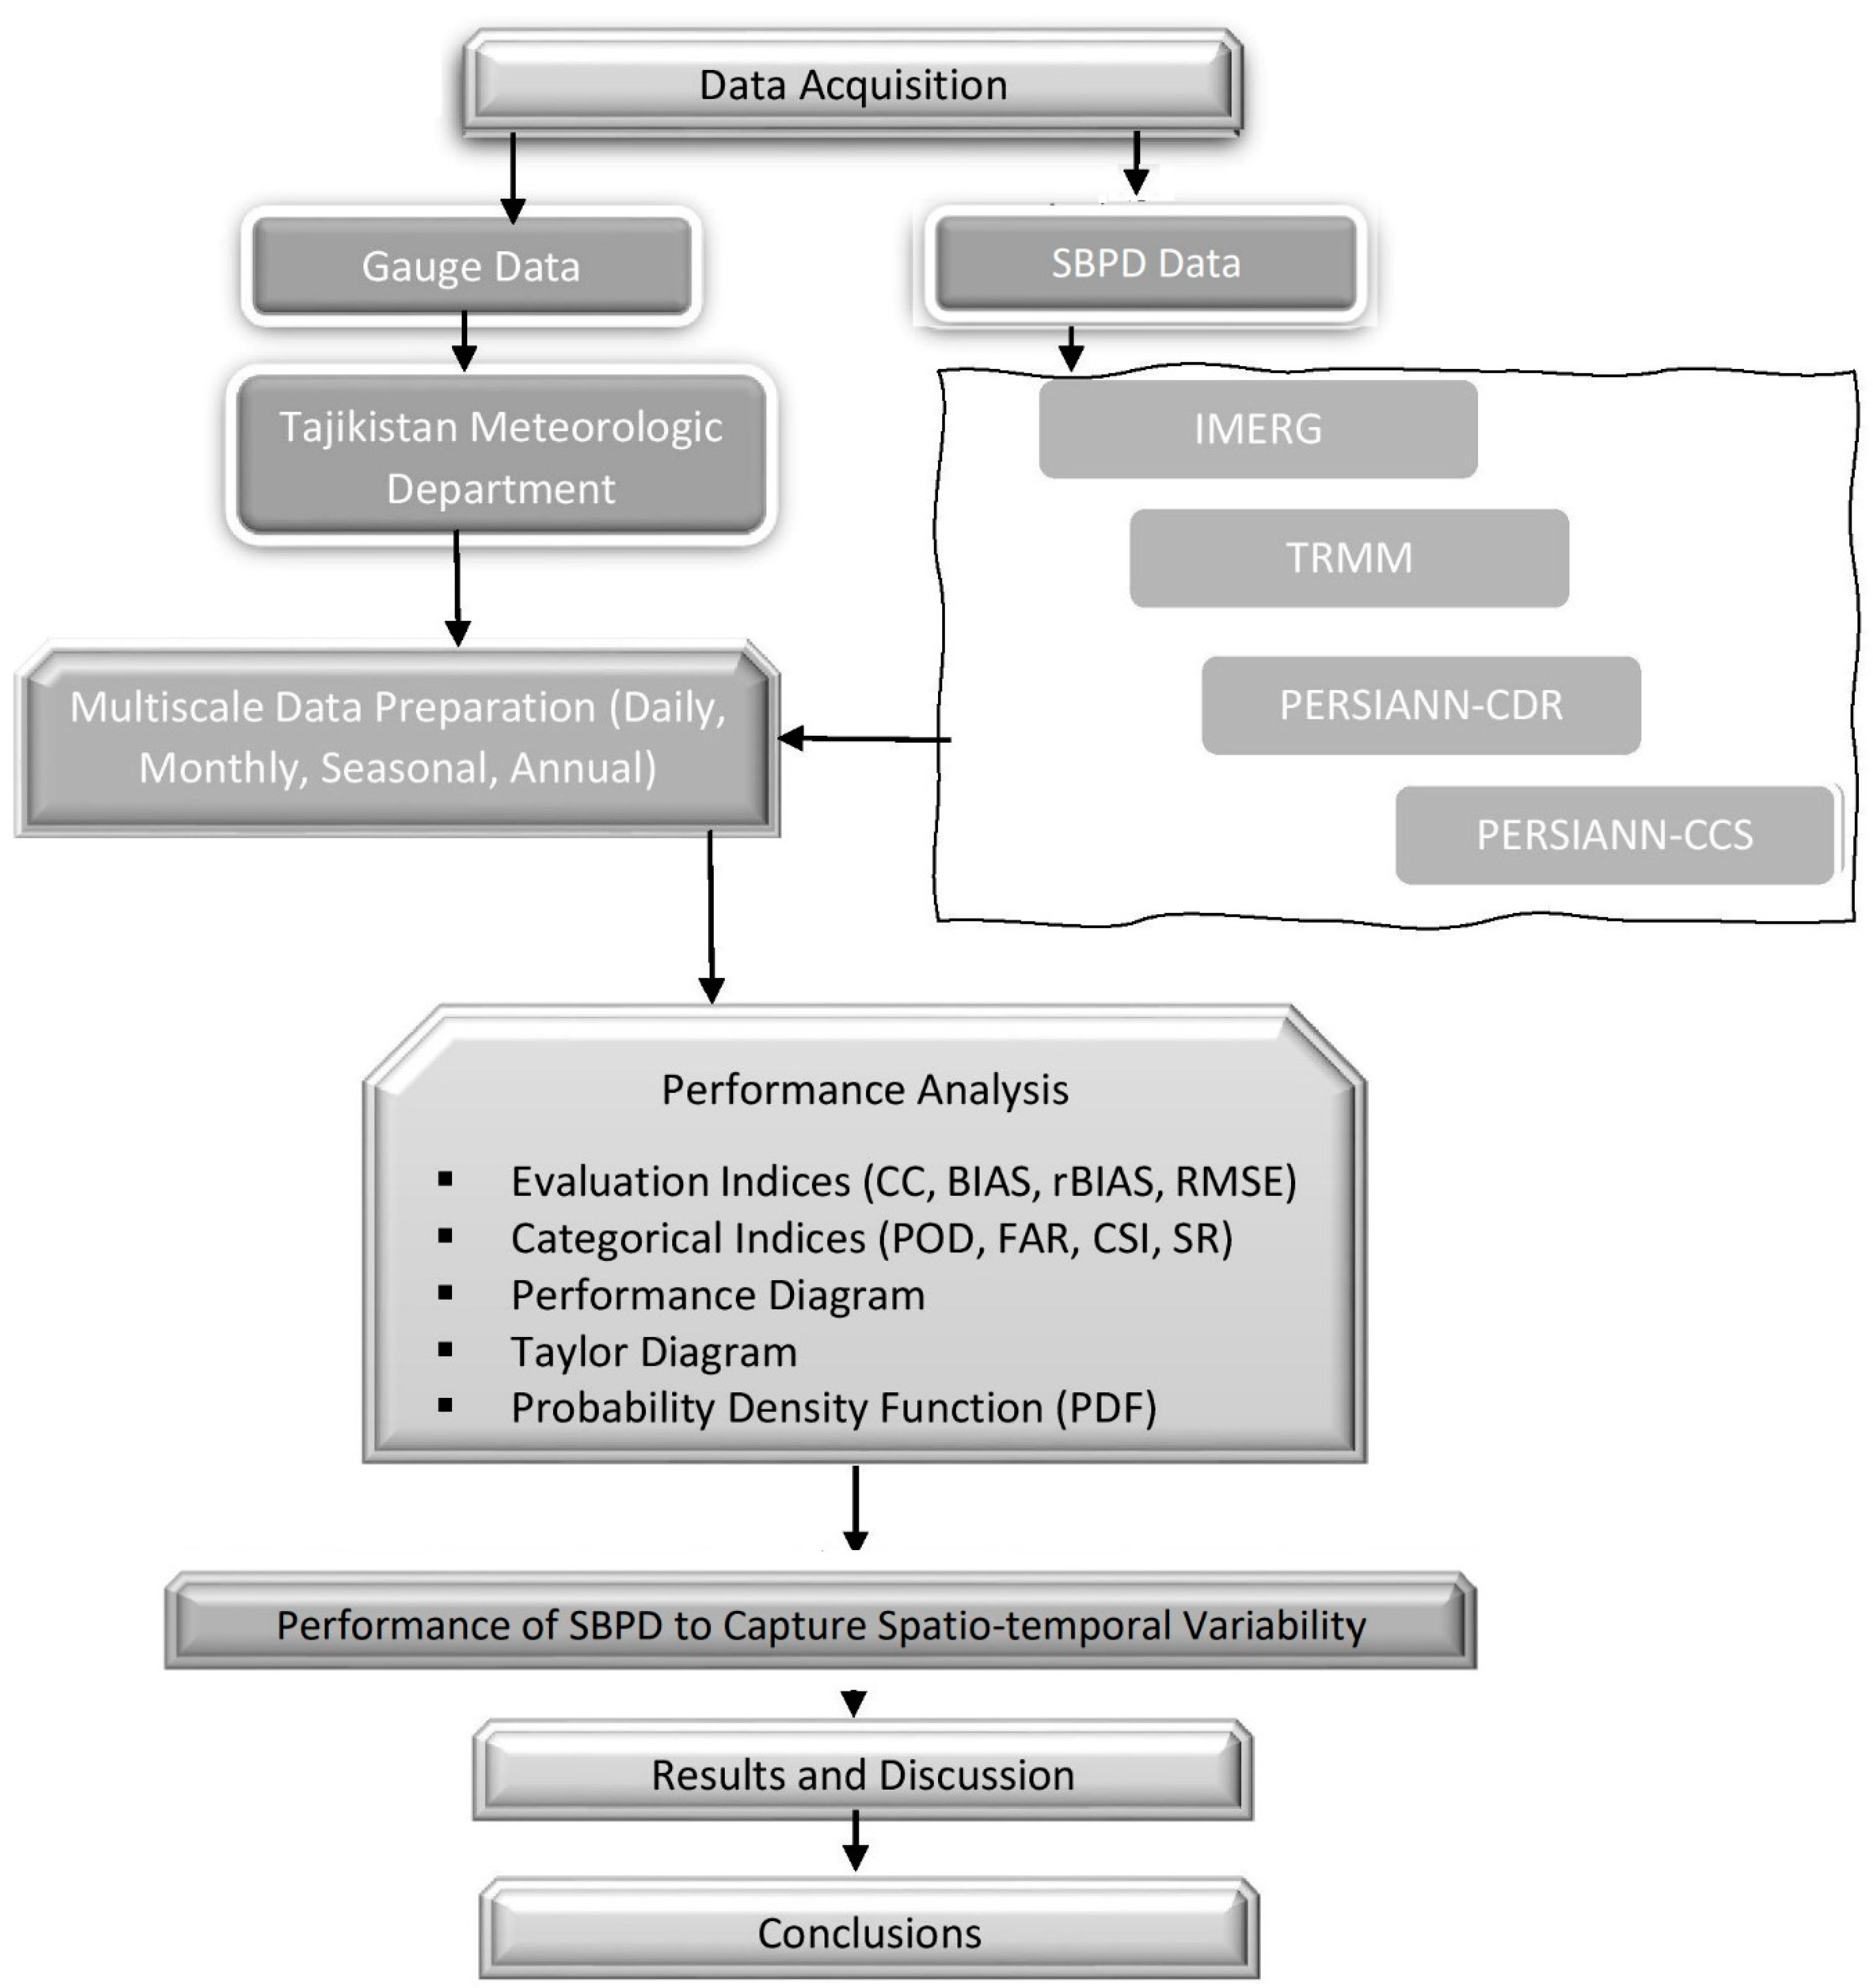
The performance in the estimations of four (SBPD) satellite-based precipitation datasets (IMERG, TRMM, PESIANN-CCS, and PERSIANN-CDR) was evaluated in anticipation of observed-based datasets. According to the methodology of previous evaluations of SBPD, only SBPD grids with at least one rain gauge were factored into the equation for this evaluation [26]. To supplement the SBPD with weather stations, a grid-to-point matching approach is used; the SBPD grid with a central location closest to the weather station is matched to this station. Figure 2 illustrates the overall process for the performance analysis of SBPD [27]. Therefore, for those stations where two or more stations were built in a single grid, simple averaging of the measurements of in gauge estimations was taken into consideration. This method was also applied in several earlier investigations [28]. The estimations of the considered SBPD were compared with each other at multiple spatiotemporal scales over the dense network of Central Asia. The information related to evaluation indices [4] and categorical indices used for the validation of SBPD with gauge estimations is described in Table 3.
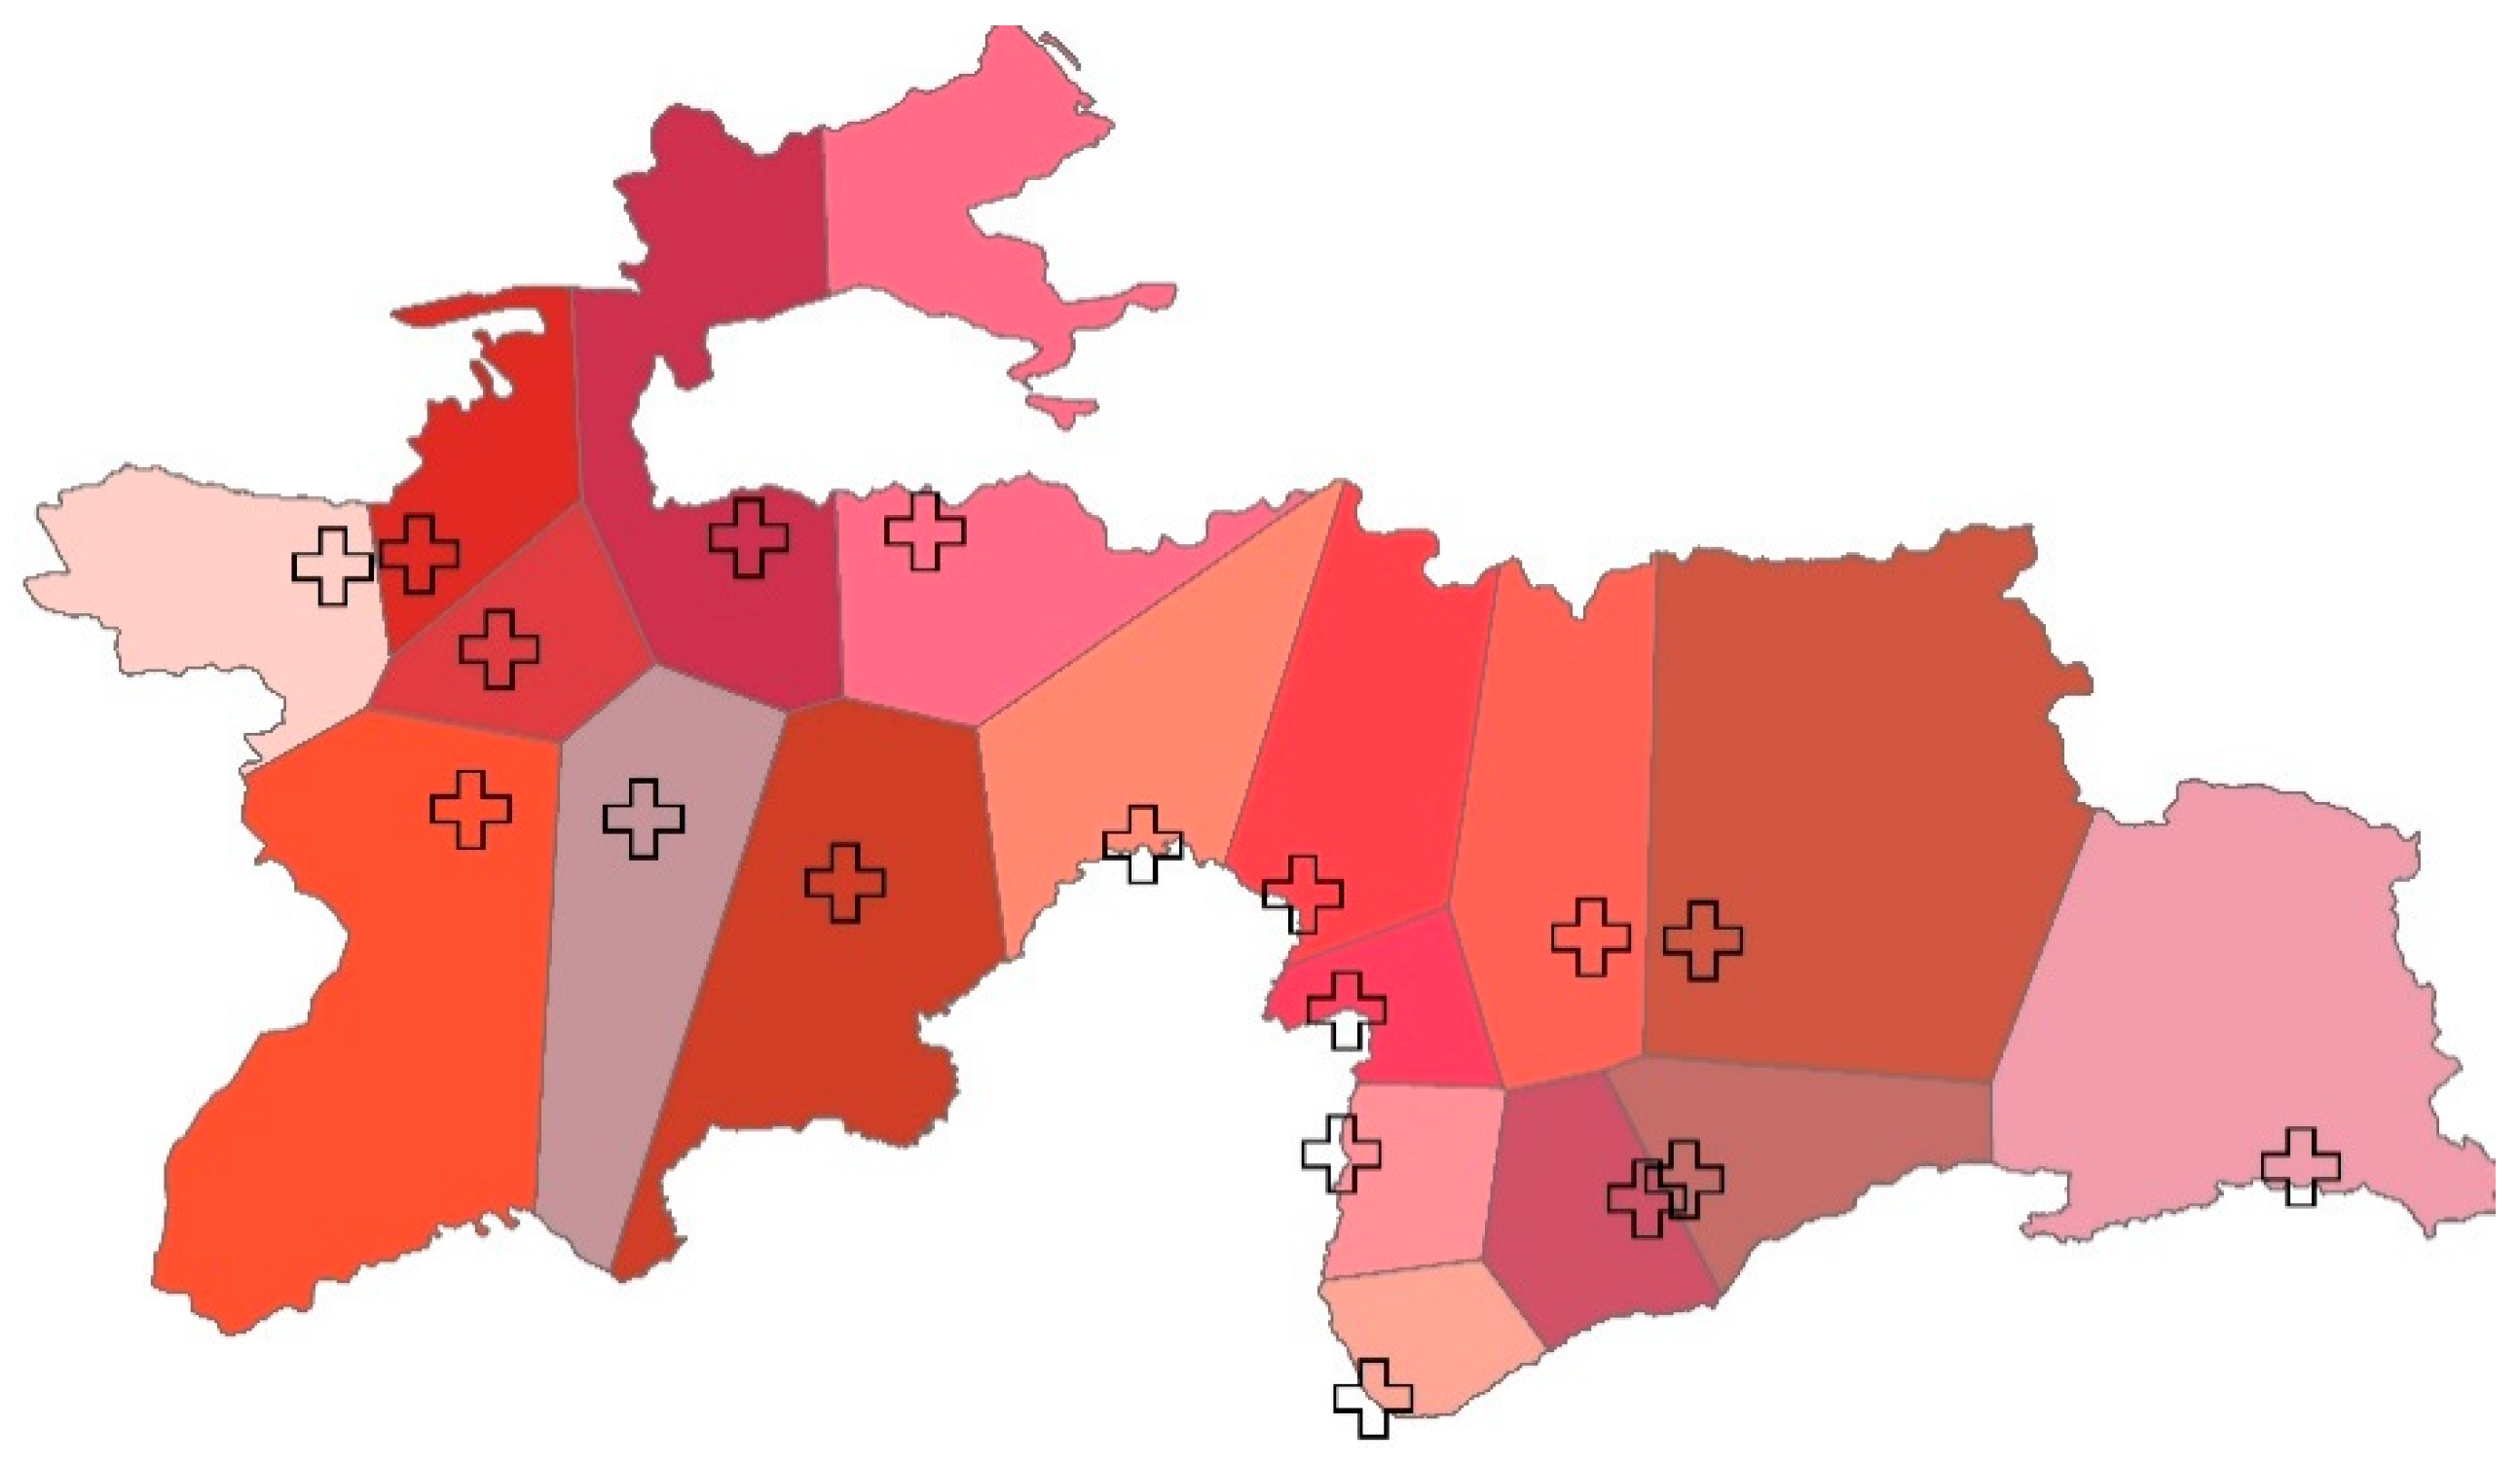
The Thiessen polygon method is described in Figure 3 for the calculation of aerial precipitation. The Thiessen polygon method [30] is first used in ArcGIS10.7.1 to determine the gauge weight for each meteorological station. Each station’s gauge weight is multiplied by its precipitation to determine the estimated amount of airborne precipitation. The Thiessen polygon approach assumes that each pixel will record the amount of precipitation in a particular area (A). Hence, the amount of precipitation recorded at pixel I only applies to that area. The region of the Thiessen polygon that each pixel belongs to determines its weight. According to the World Meteorological Organization (WMO) protocol, the criteria for daily precipitation rates for light (<2 mm/day), medium (2–10 mm/day), and heavy precipitation are (>10 mm/day) used for the performance analysis of SBPD. Furthermore, the capability of each analyzed precipitation product in Tajikistan is represented in terms of the likelihood that it would be detected (POD). Roebber [4] created the presentation graph for assessing outcomes of categories indices using classed indices. For appropriate results, the moving average graphs, performance diagrams, box schemes, Taylor diagrams, and probability density function (PDF%) are used for the performance analysis of IMERG, TRMM, PESIANN-CCS, and PERSIANN-CDR.

3. Results

3.1. Spatial and Temporal Capability of SBPD

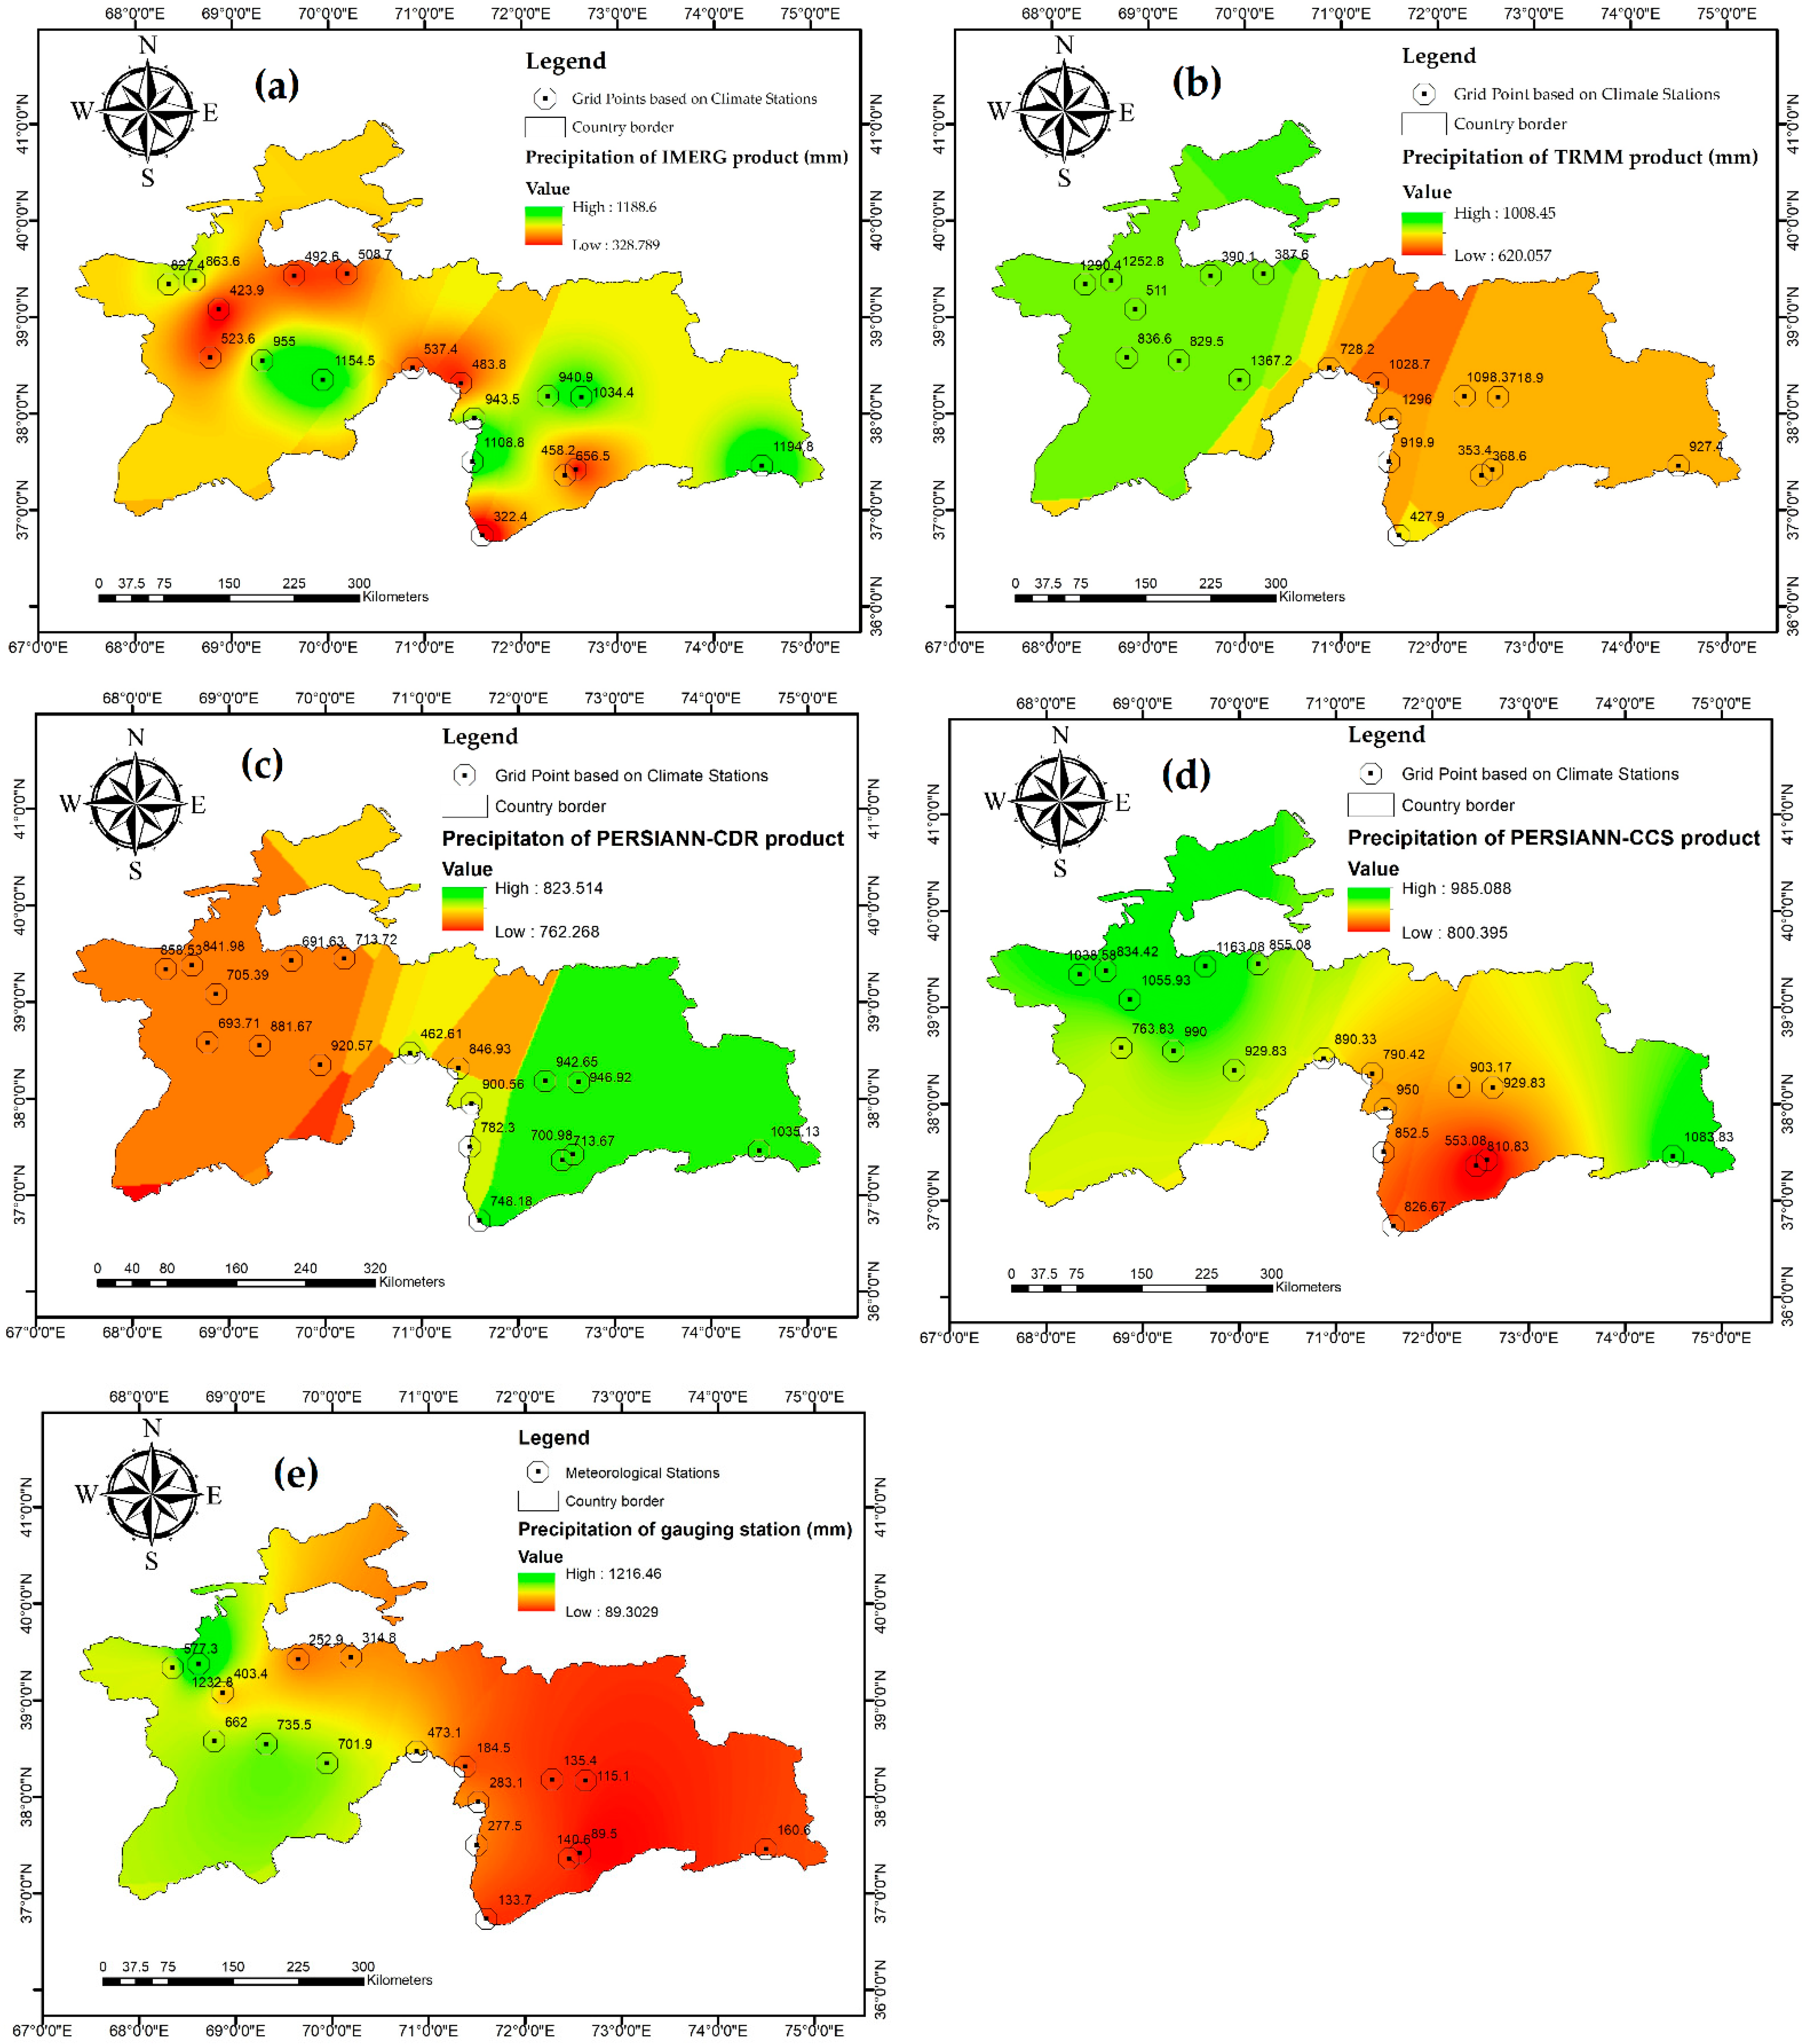
The spatial variability of annual precipitation datasets (IMERG, TRMM, PESIANN-CCS, and PERSIANN-CDR) is depicted in Figure 4. Using geostatistical spatial interpolation methods (Kriging with external drift (KED)), a map of the yearly average precipitation over the study domain was created. In mountainous areas, KED is advised for interpolation [31]. The gauge observation identifies that the rocky topography in hilly places activates the fronts, and cyclonic activity is also visible here in the summer. Western and northern Tajikistan’s valley regions, as well as the high-mountain region of the Eastern Pamir, are all covered by a dry climate zone (75–300 mm of precipitation per year). The rainy climate zone is found in the region that is situated on the southern windward slopes of the Gissar spots mark range (more than 1200 mm per year). Moreover, precipitation peaks in foothills and valleys in March–April and in highlands in April–May. The IMERG and TRMM performance is very satisfactory as compared to other datasets (CDR and CCS) in response to tracking spatial variability of humidity (<500 mm). Over high topography, the PERSIANN-CDR shows a significant amount of overestimation and underestimation at low elevations. In arid conditions (precipitation > 300 mm), all SBPD capability to track spatial variability is better as compared to semi-arid and humid conditions. In semi-arid (precipitation (300–500 mm), the TRMM dataset outperforms all other SBPD. The IMERG performance is unmatchable compared to other SBPD in humid conditions (precipitation < 500 mm). However, the overall performance of IMERG is not as good as PERSIANN-CCS on yearly spatial estimations.
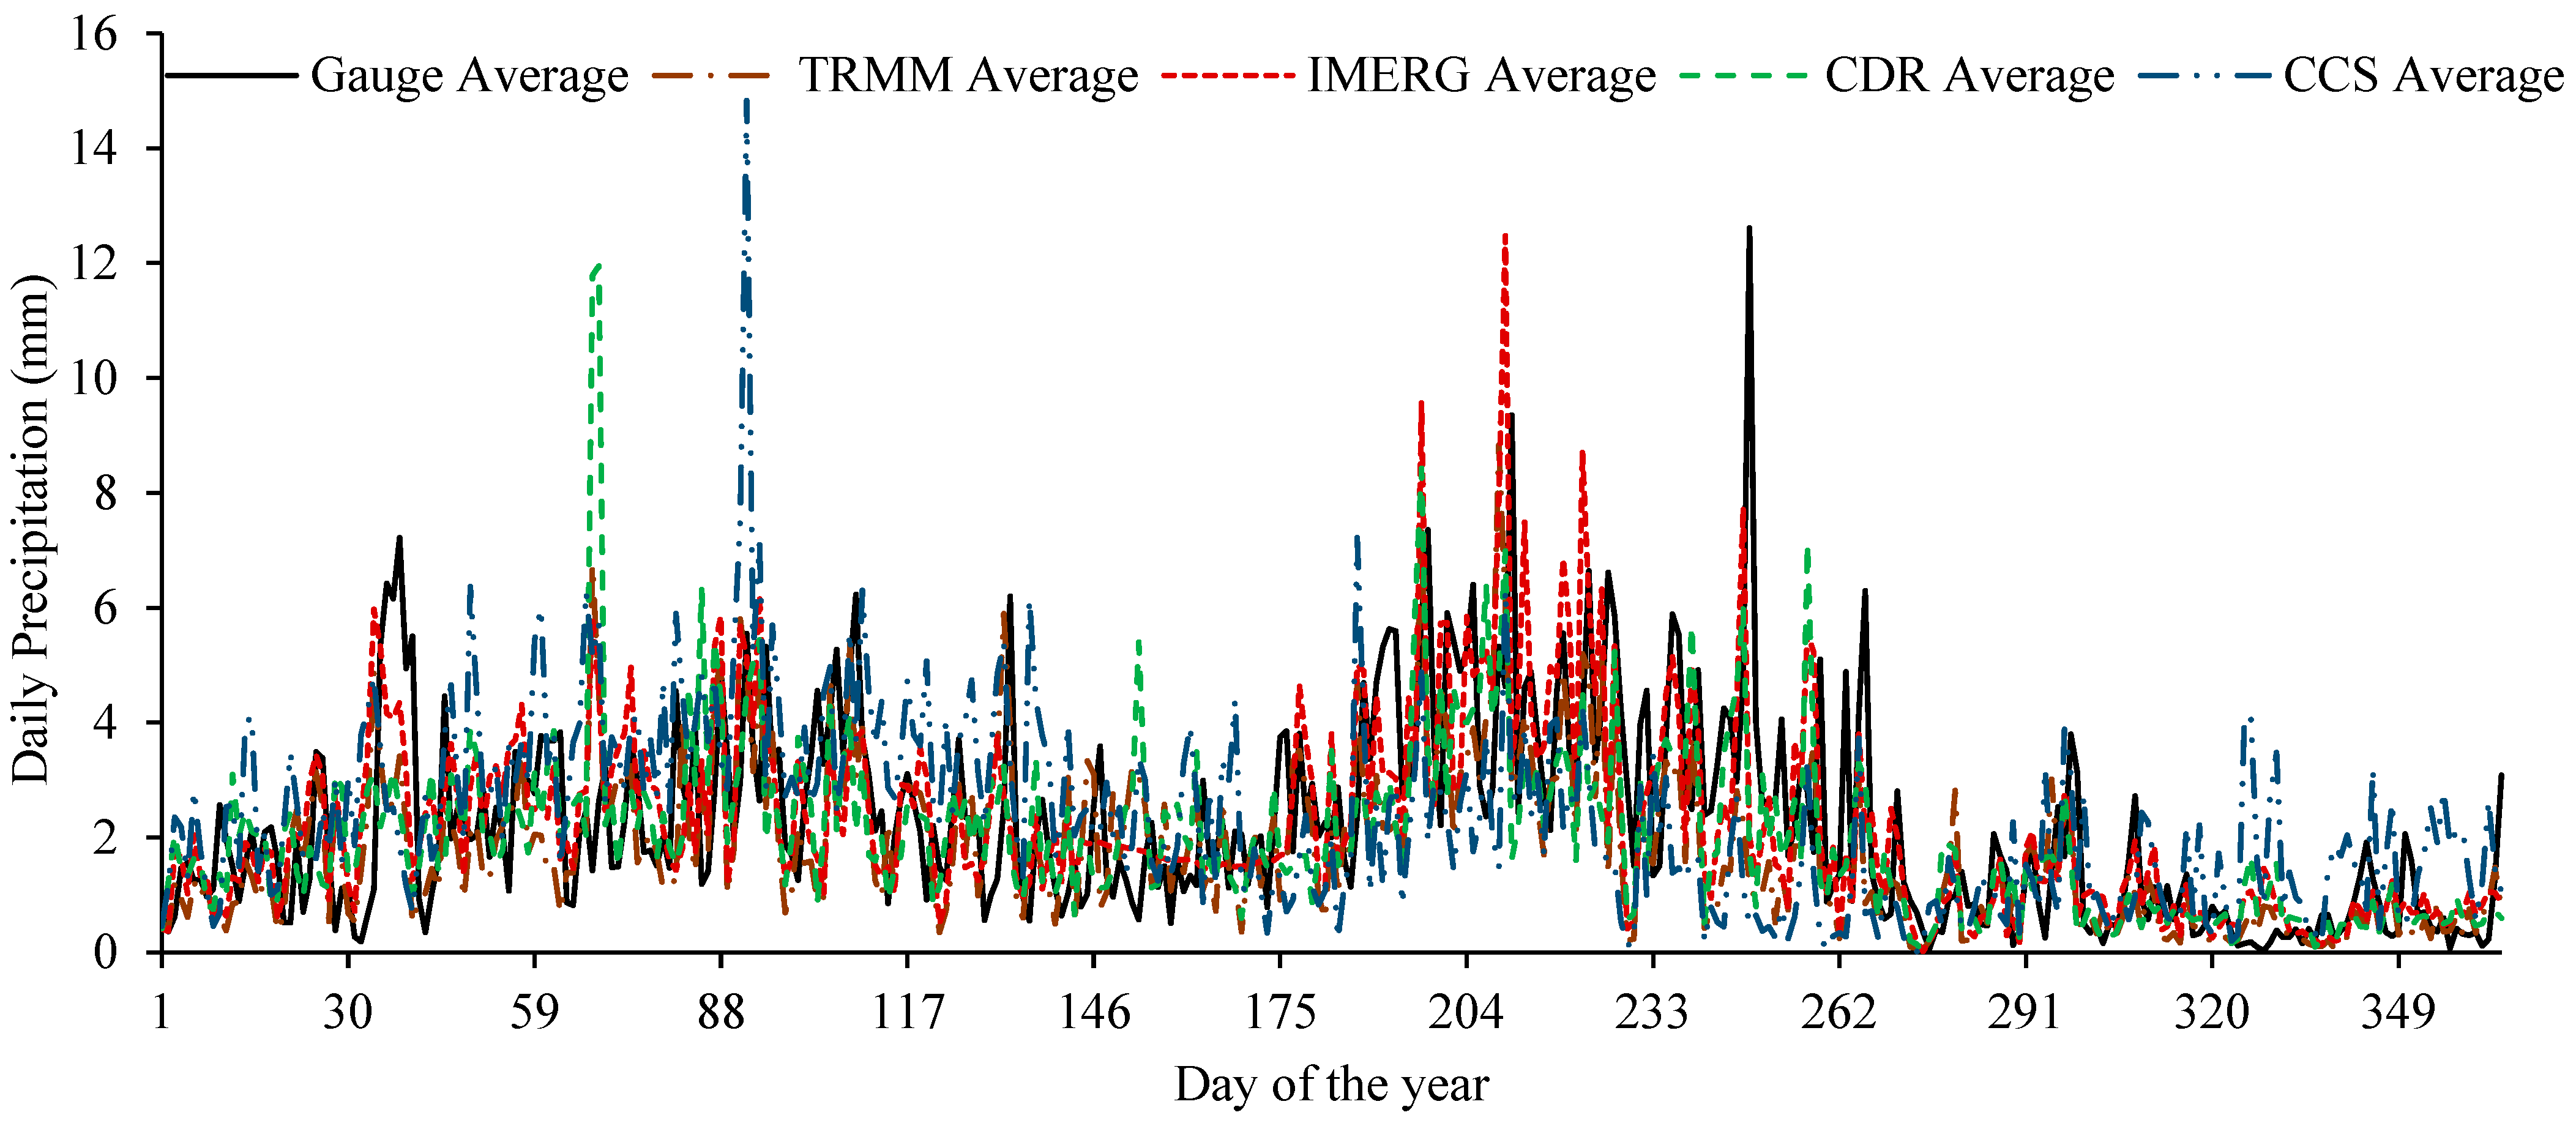
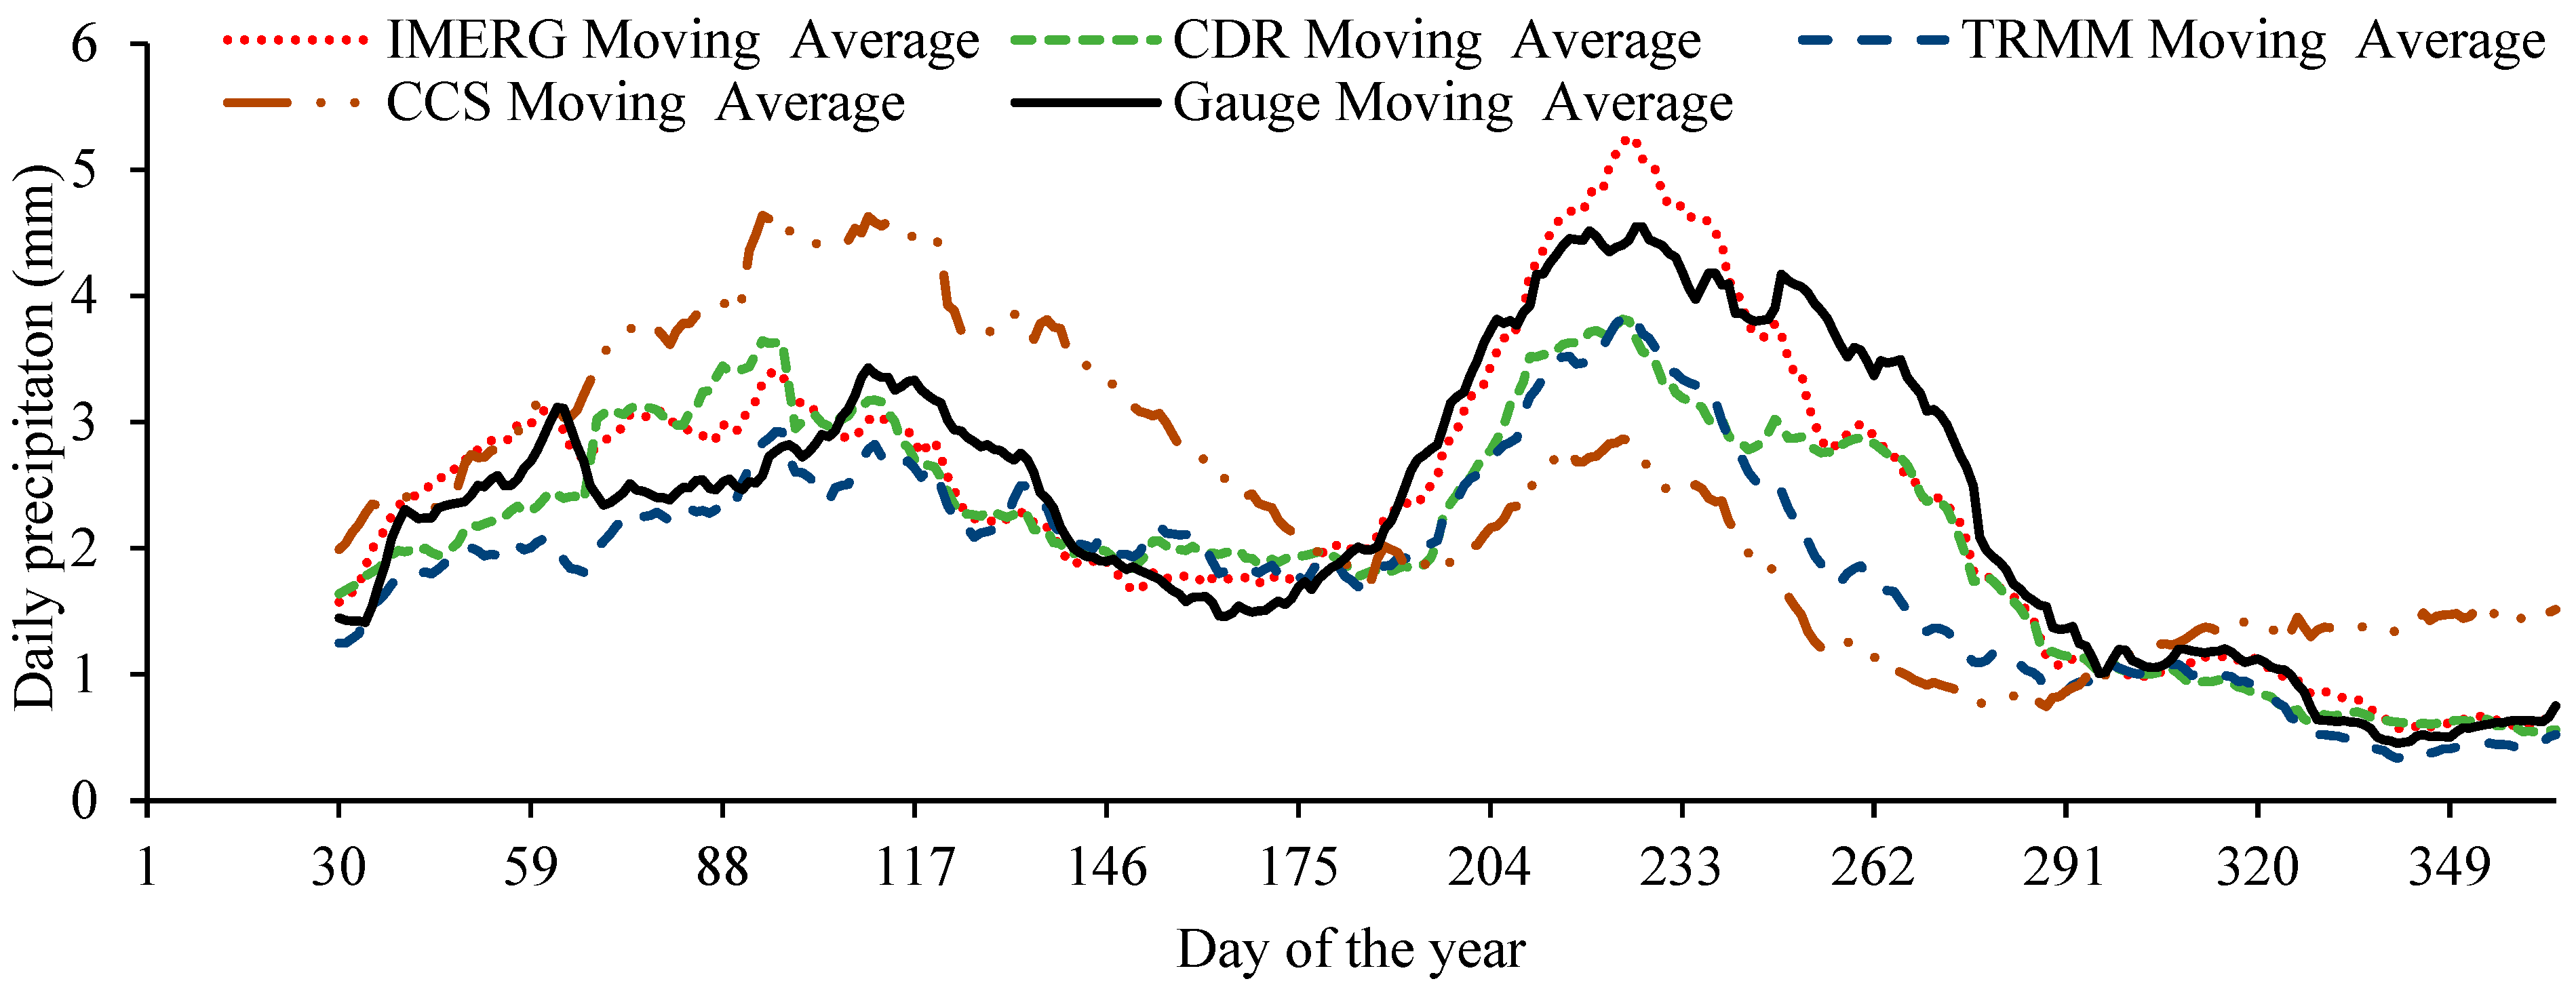
Figure 5 illustrates the temporal variability of all SBPD and gauge estimations. The average estimations of (TRMM, IMERG, PERSIANN-CDR, and CCS) are compared with the gauge estimations. In general, two peaks are shown by the gauge estimations. PERSIANN-CCS showed the highest peak in the early days of April, while the gauge data showed the maximum peak in mid-November. The CDR and CCS showed a significant amount of overestimation in the starting days of the year (mid-January to mid-March). The temporal variability of IMERG is very comparable to the gauge estimations. Only the IMERG dataset tracked the highest peak of gauge temporal variability, which is produced in mid-September. The TRMM performance is more satisfactory as compared to PERSIANN-CDR and CCS in response to tracking temporal variability of observed data. Figure 6 describes the comparison of temporal variability of all SBPD’s moving average estimations for temporal estimations generated by in situ ground datasets. The average of all daily data (2000–2013) of SBPD (TRMM, IMERG, PERSIANN-CDR, and CCS) and gauge data is calculated, and the 30-day lag time is provided for a better understanding of the results. Hamza et al. [31] used a similar method to track the temporal variability of satellite datasets over the rugged surface of Hindu Kush in Central and South Asia, the product showed underestimation in all months, while a (July–August) slight overestimation was shown for the TRMM dataset. The PERSIANN-CCS exposed a significant amount of overestimation until mid-August; after August, a significant amount of underestimation was tracked by CCS. The CDR shows the series of (over/under estimations) to track the temporal variability of gauge data. The IMERG performed better in response to capturing the temporal variability of observed data. Slight overestimation is tracked by the IMERG in September. Overall, the IMERG’s skills are better compared to all other SBPD (TRMM, CDR, and CC) in response to tracking the temporal variability of observed estimations.

3.2. Ability of SBPD on a Daily Scale

Figure 7 defines the spatial variability of all datasets (TRMM, IMERG, PERSIANN-CDR, and CCS) and gauge observations over the mountainous domain of Tajikistan. Due to the mountainous region of the study area, a significant amount of precipitation is illustrated by each dataset and gauging station. Northern Tajikistan and the Eastern Pamir highland region (75–300 mm of precipitation per year). Spots delineate the area with a rainy climate (more than 1200 mm per year) in the Gissar range’s southern windward slopes. The southern part of the country receives more rainfall in the winter season. Over low elevations, the maximum amount of precipitation is captured by all datasets and gauge observations. All SBPDs were unable to track precipitation over the northern highlands of the study area. Results indicated that the CCS dataset revealed poor skill to capture the daily spatial variability produced by gauge precipitation; a significant amount of underestimation is shown over the northern mountains. The performance of TRMM and CDR is reasonable over plain topography, but their performance is not satisfactory over hill topography, as indicated by the significant amount of overestimation. IMERG outperformed all other selected datasets to capture spatial variability over the rugged surface of the study area.
The spatial distributions of all evaluation indices (CC, BIAS, rBIAS, and RMSE) produced from TRMM, IMERG, PERSIANN-CDR, and CCS are described in Figure 8. We observed a significant number of changes in the ranges of evaluation indices all over the country. The IMERG product showed maximum spatial variation in CC values. The CDR and CCS showed less spatial variation compared to TRMM and IMERG. The maximum variation in CC between gauge and SBPD datasets was observed where the precipitation rate was high. The TRMM product shows the least variation in terms of RMSE, followed by the IMERG and PERSIANN products. IMERG’s ability to track high and low precipitation events is comparable to the gauge’s spatial variability, as demonstrated by CC, BIAS, and RMSE values of the IMERG product.
The box schemes of all daily evaluation indices are described in Figure 9. As indicated by box plots, the CC values for all SBPD (IMERG, TRMM, CDR, and CCS) are 0.61, 0.48, 0.37, and 0.29, respectively. The values of CC revealed the poor relationship between SBPD and gauge estimations; only IMERG performance was up to the mark. While the performance of CCS and CDR is very poor, as described by the CC box plots. Moreover, the error values are also maximum for CCS followed by CDR and TRMM. The IMERG shows the least error values, as described in the box size of RMSE. As indicated by box plots of rBIAS, the significant amount of over/underestimation is revealed by CCS and CDR, which indicates the unsatisfactory performance of these products against the daily gauge estimations.
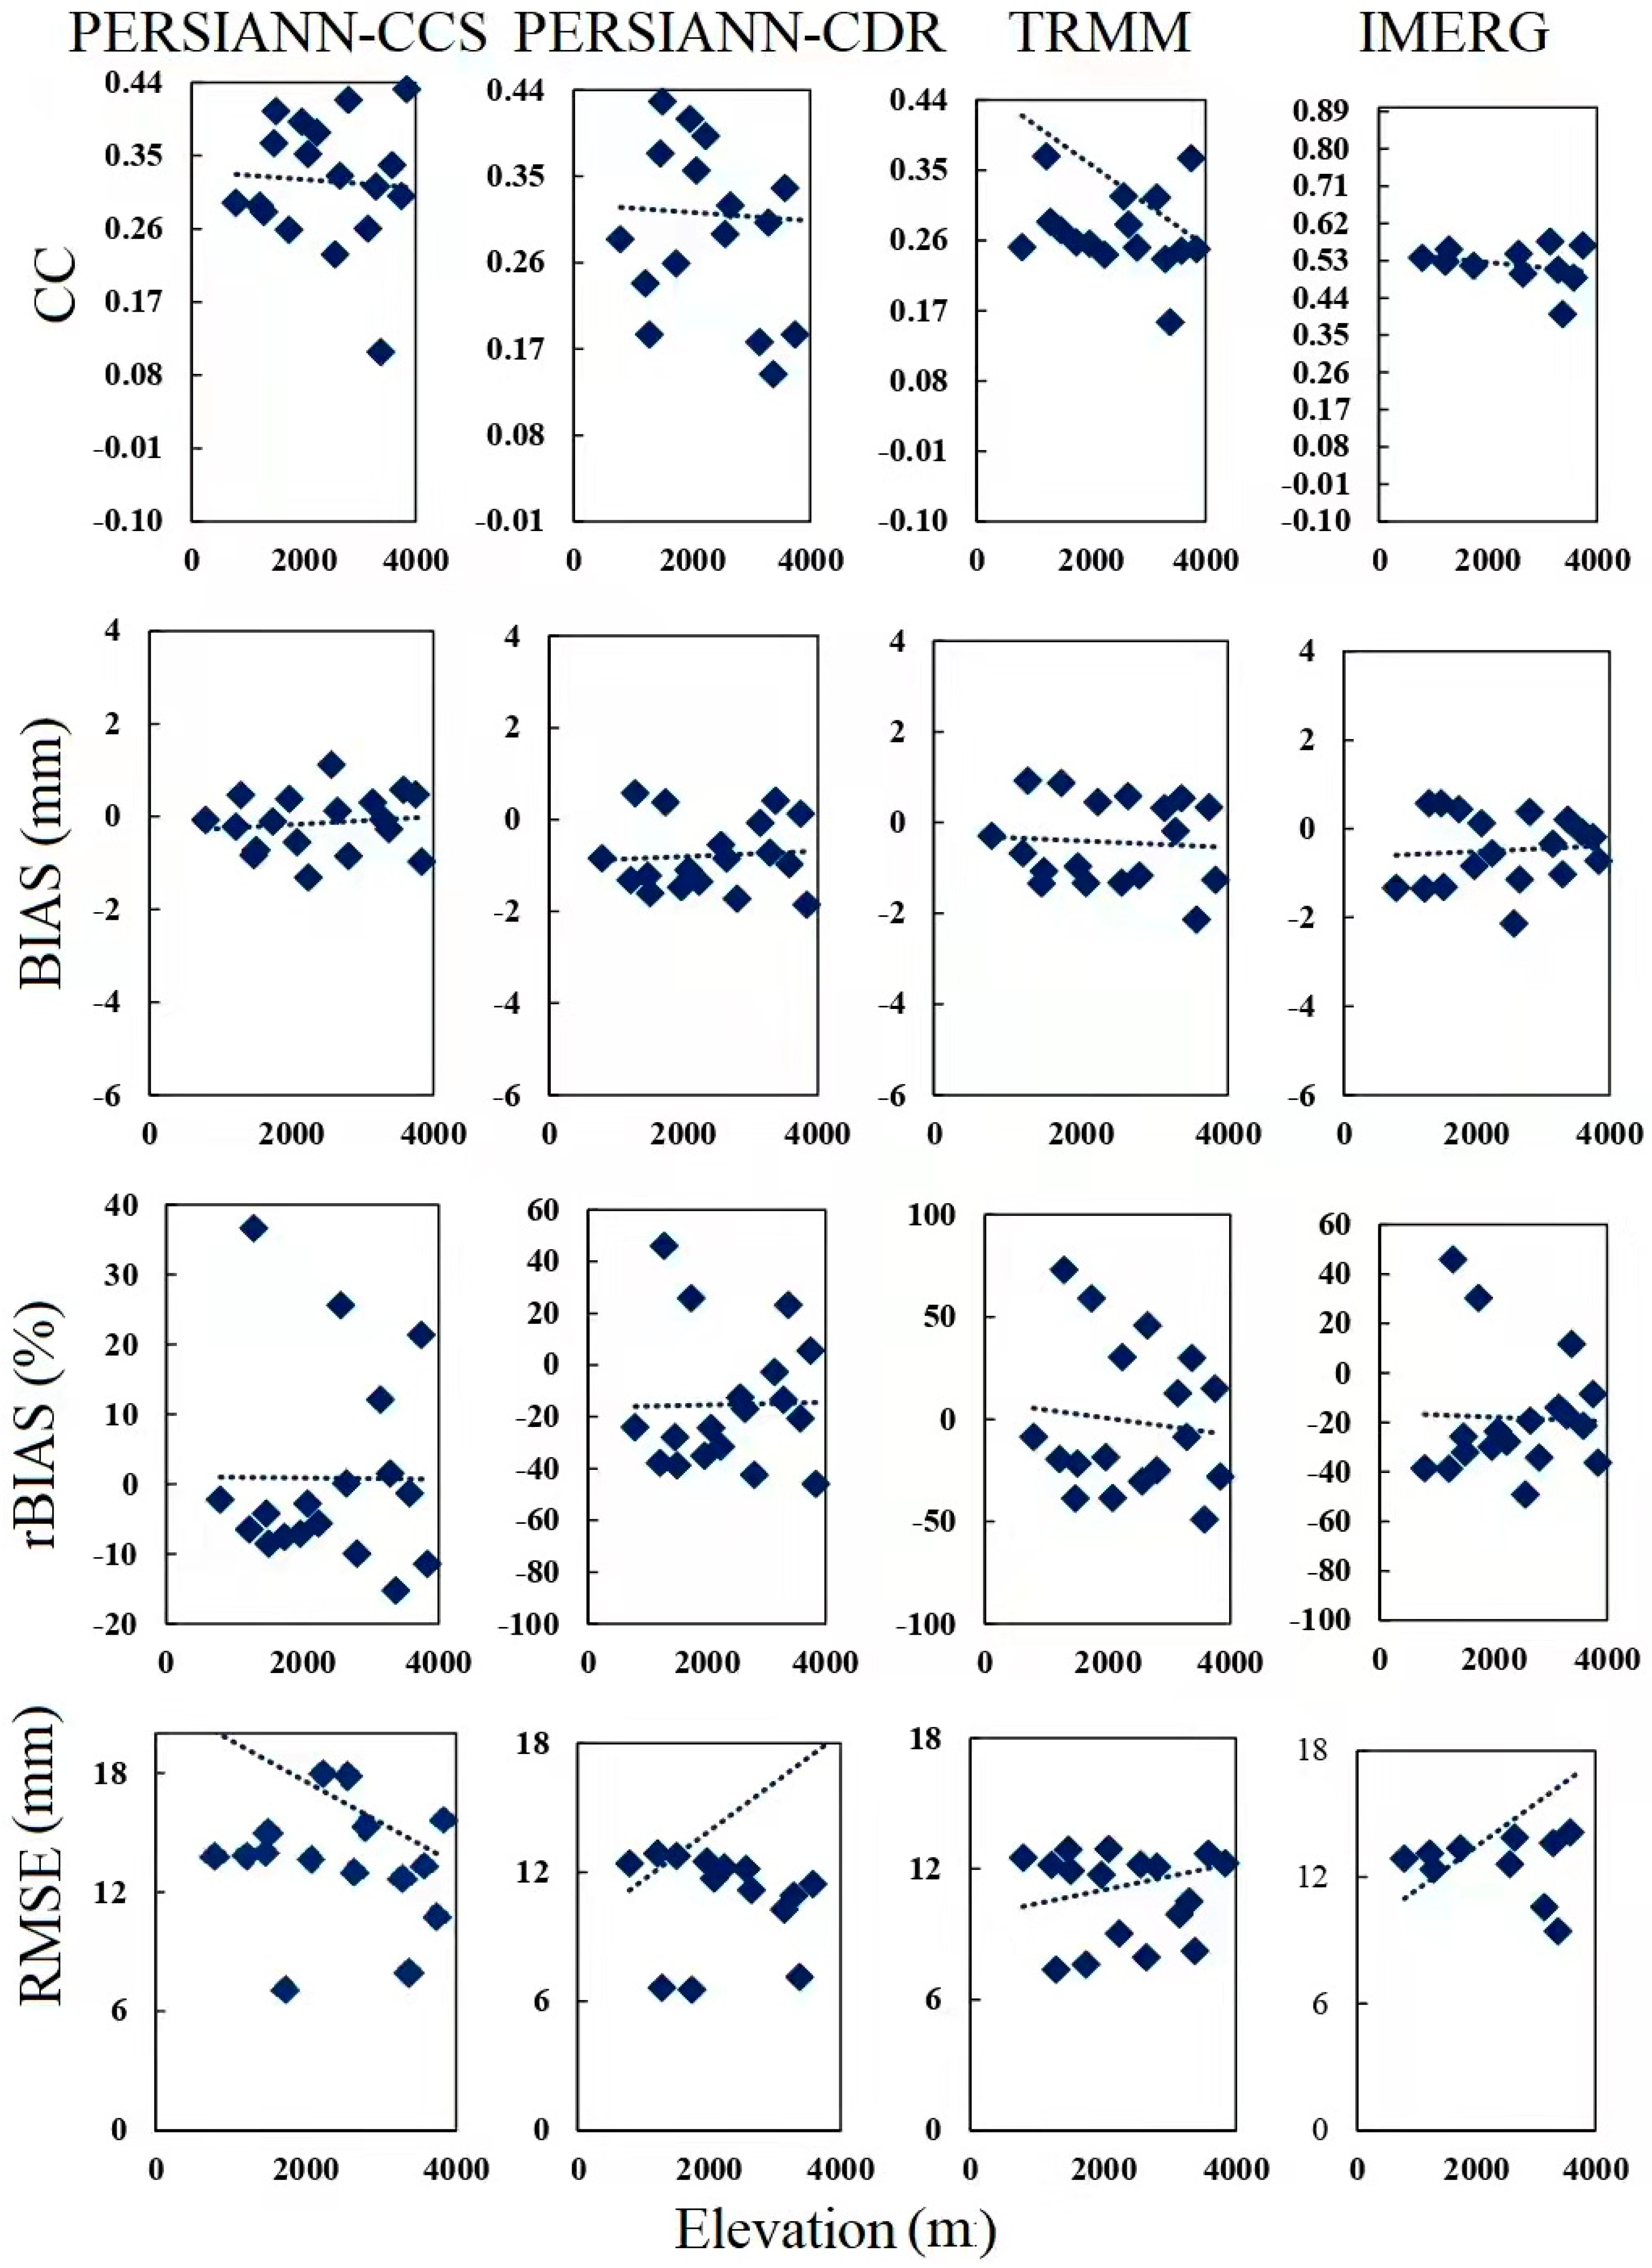
Figure 10 illustrates the impact of altitude on the evaluation indices (CC, BIAS, rBIAS, and RMSE) for all selected SBPD (TRMM, IMERG, PERSIANN-CDR, and CCS). The results show that CC values decreased with an increase in elevation. Similarly, error values are in direct relation to the elevation. The CC’s values of CDR, CCS, and TRMM illustrated the poor agreement against the gauge estimations. The IMERG showed better results even at higher elevations. The BIAS values appear unaffected by elevation variation across all datasets. The TRMM also showed comparable variations in response to elevation; its error values are also in good agreement at higher elevations.
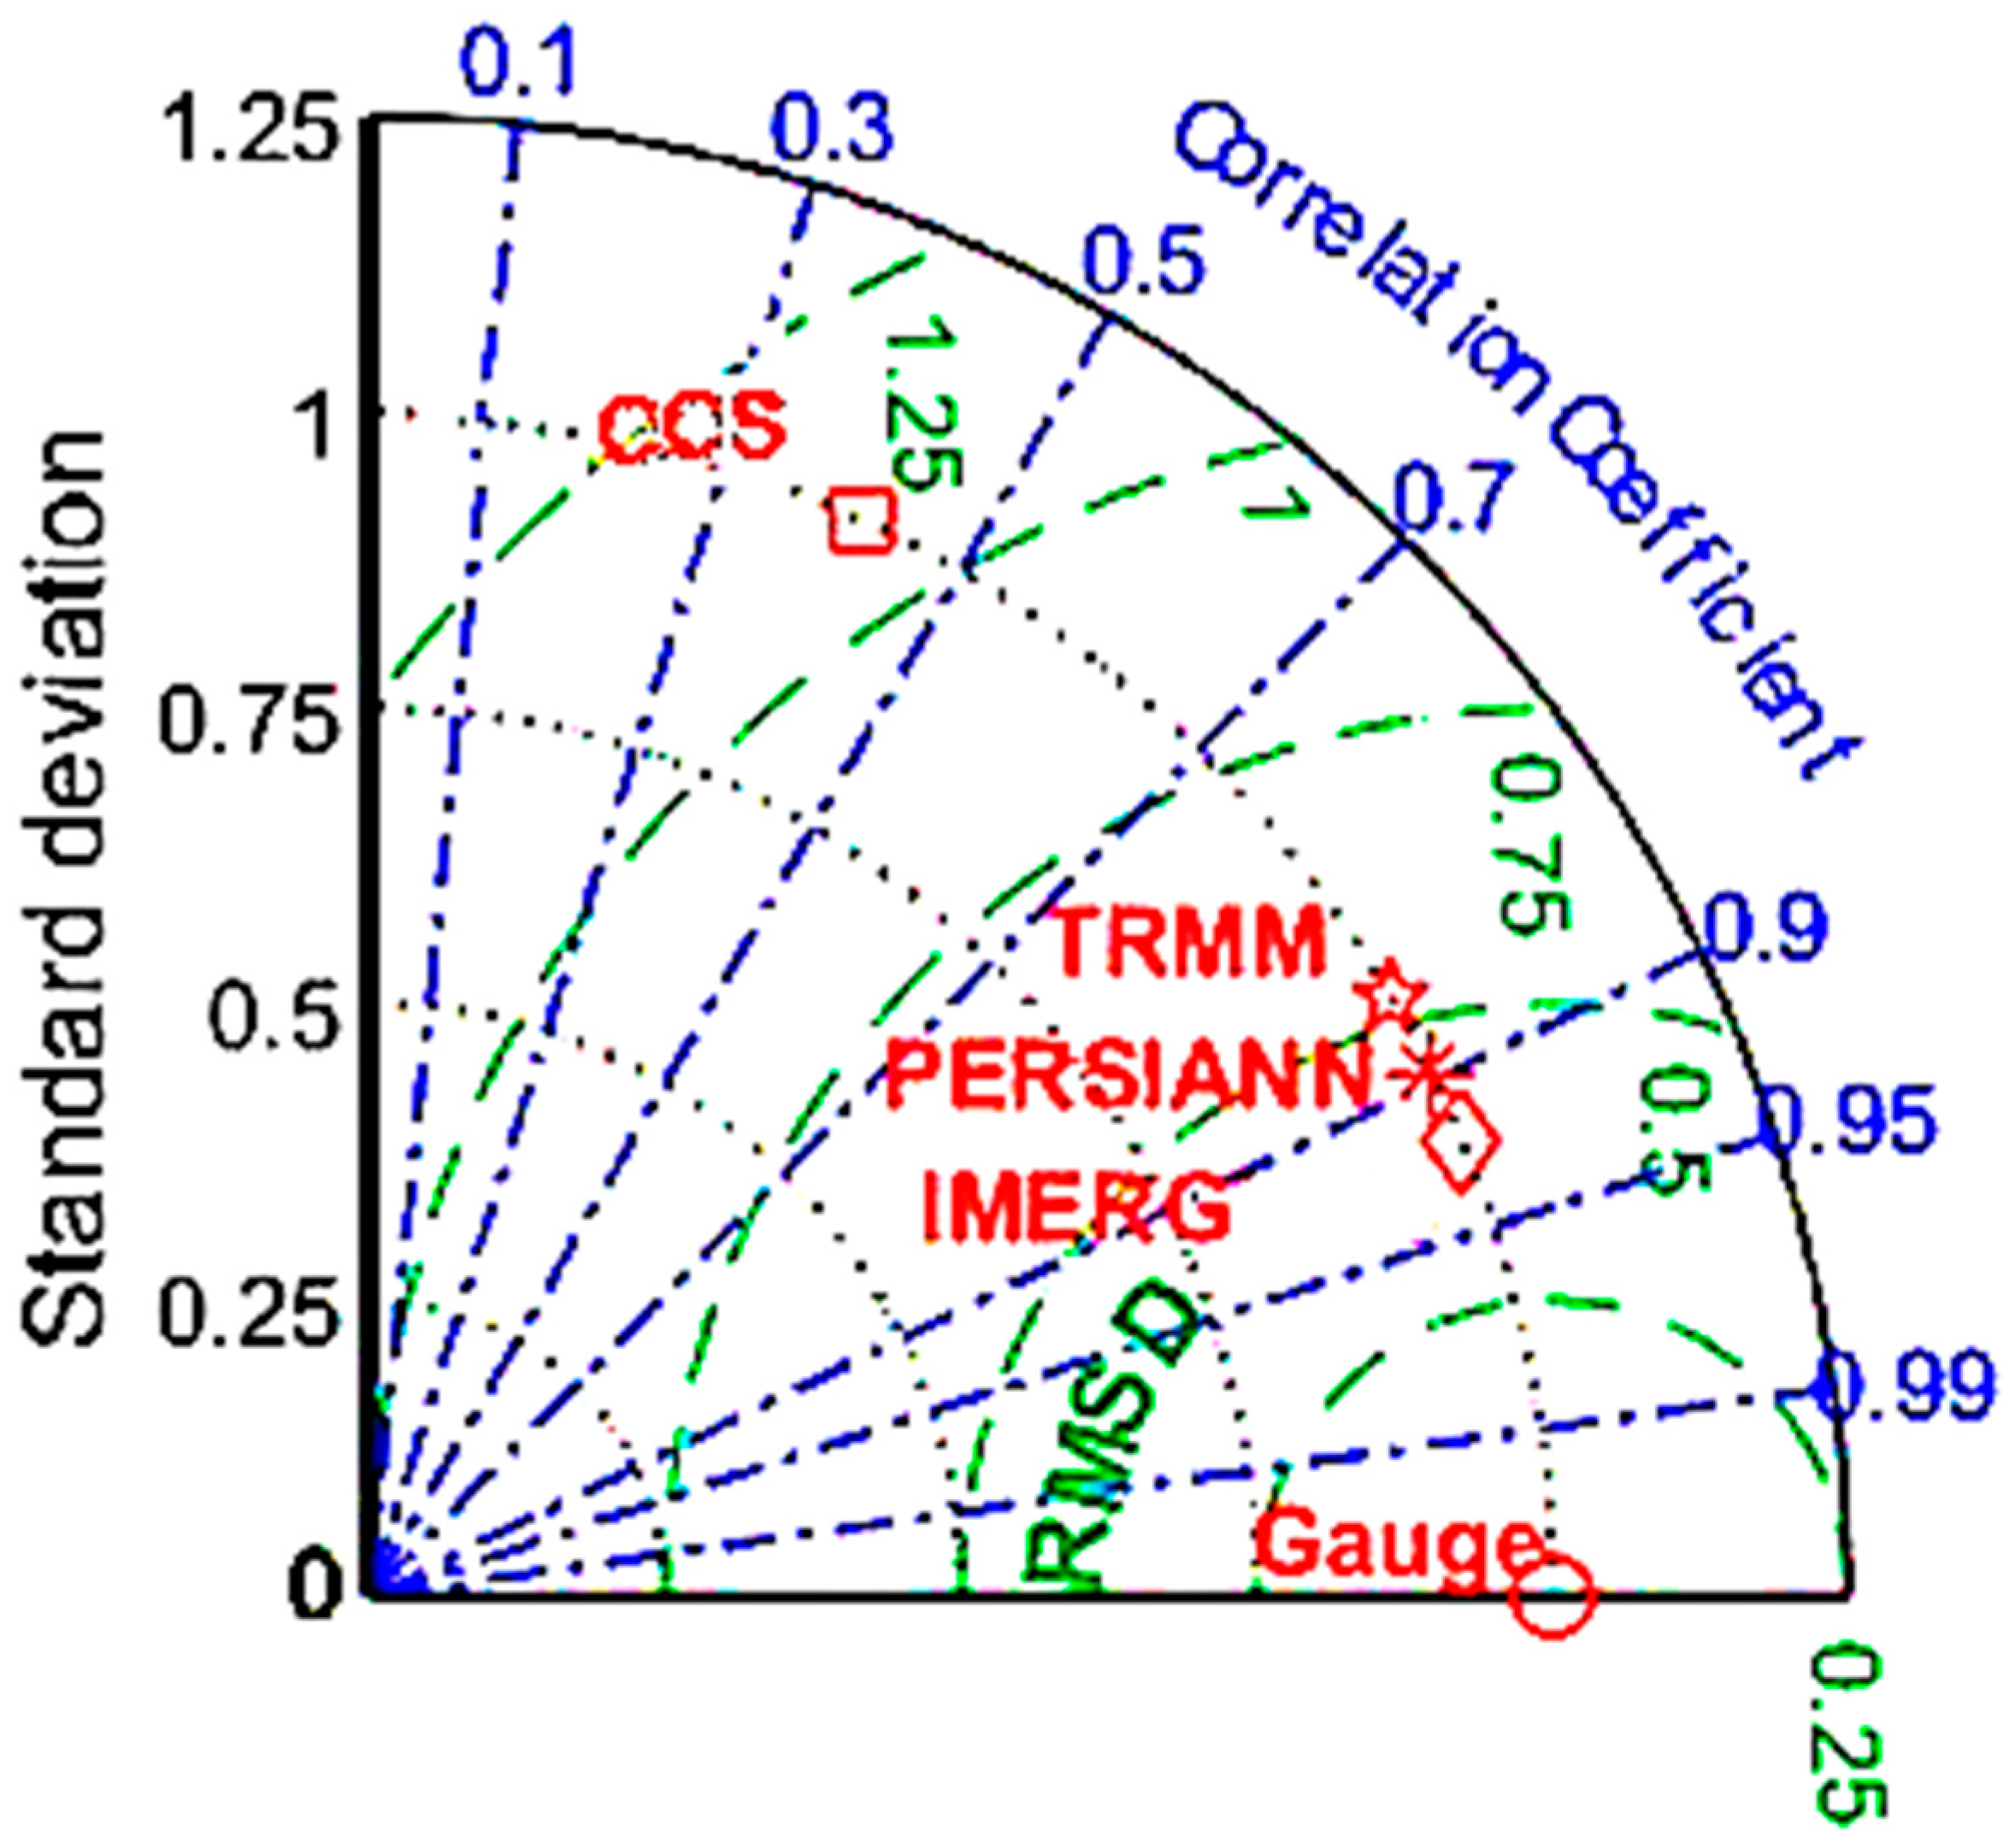
A comparison of the performance of all SBPD and in situ observations at a daily scale is illustrated in the Taylor diagram (Figure 11). For the generation of the Taylor diagram [32], all daily estimations of (gauge, TRMM, IMERG, PERSIANN-CDR, and CCS) were normalized. The blue lines showing the CC values of all datasets indicated a poor relationship between the gauge and SBPD estimations. The CC values for all SBPD (IMERG, TRMM, CDR, and CCS) are 0.61, 0.48, 0.37, and 0.29, respectively. Conversely, the error values are very high for PERSIANN’s datasets (shown by semicircular green lines) compared to IMERG and TRMM products. The standard deviation of all products is also comparable, as indicated by the black dotted line circles.
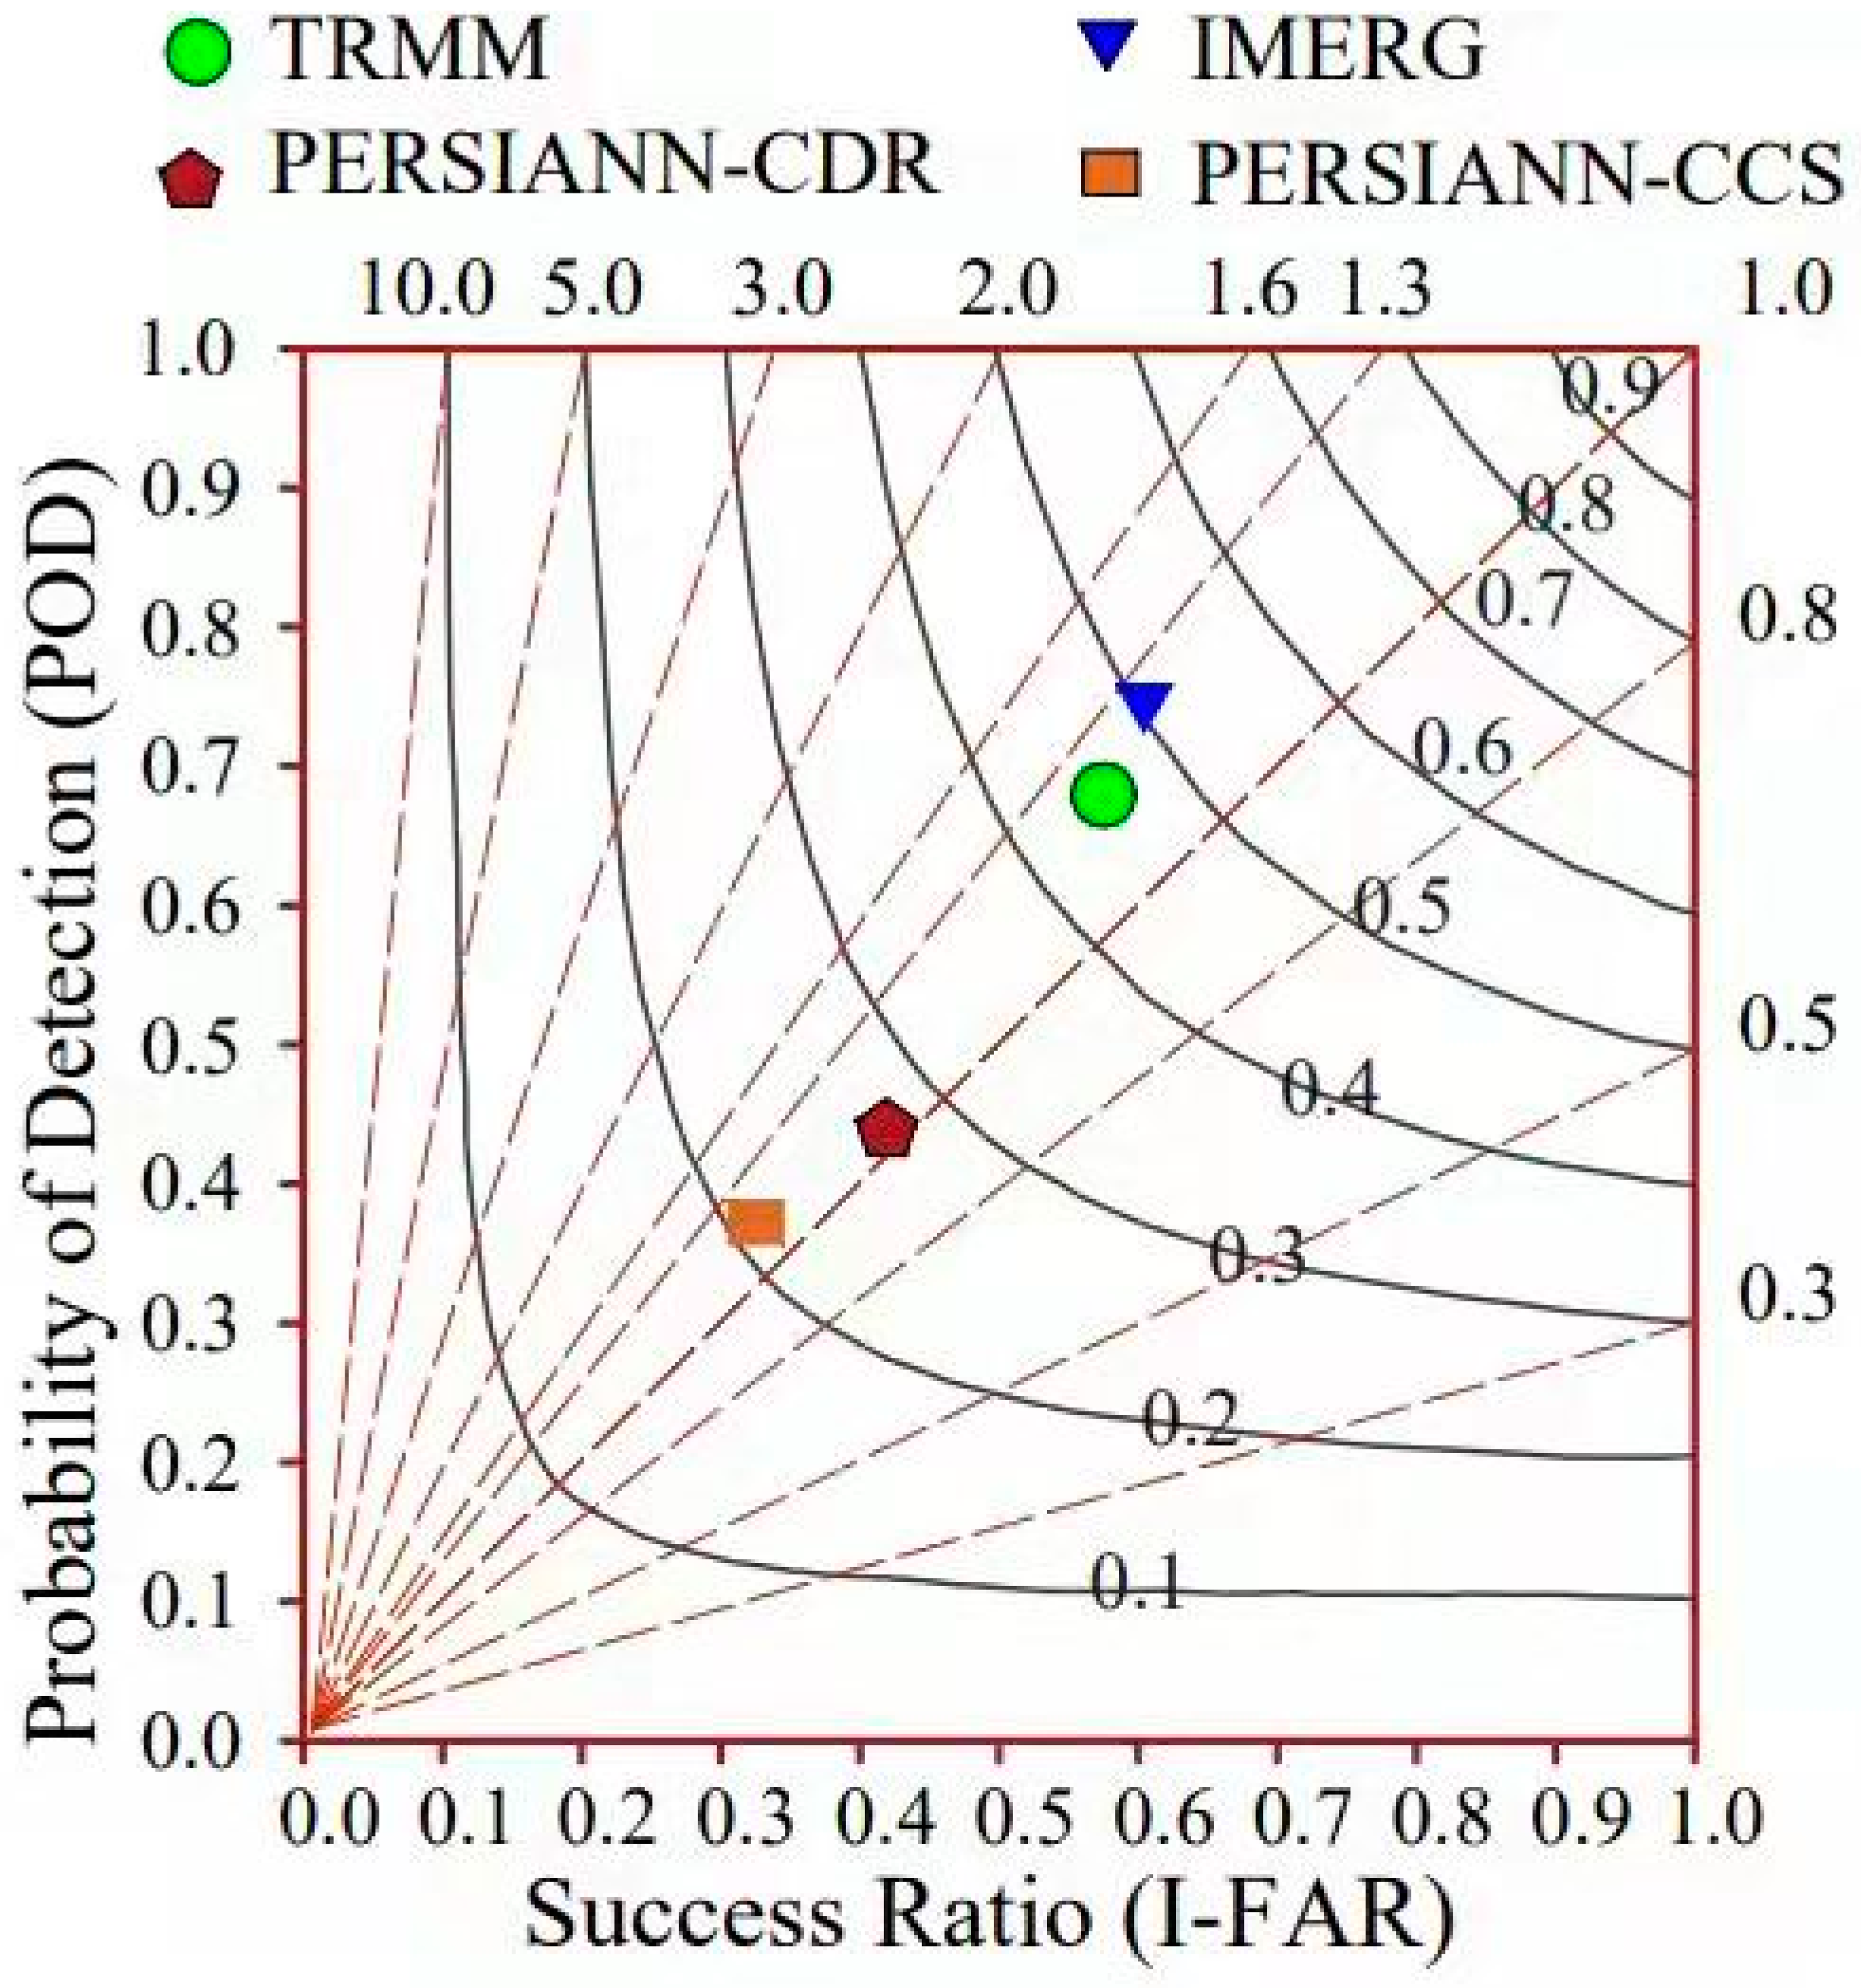
Figure 12 shows the performance diagram of all SBPD (TRMM, IMERG, PERSIANN-CDR, and CCS) in response to capturing the daily estimations of observed data. In terms of probability of detection (POD), the IMERG outperformed the remaining SBPD (TRMM, CCS, and CDR) with POD ranges for IMERG, TRMM, PERSIANN-CDR, and CCS of 0.59, 0.52, 0.31, and 0.24, respectively. The success ratio (SR) is also very poor for CCS and CDR. While the false alarm ratio (FAR) is at minimum for the IMERG product, which exposes the satisfactory performance of IMERG in response to tracking the probability of daily estimations.

3.3. Ability of SBPD on a Monthly Scale

Figure 13 illustrates the impact of precipitation intensity on the evaluation indices (CC, BIAS, rBIAS, and RMSE) for all selected SBPD (TRMM, IMERG, PERSIANN-CDR, and CCS). The results show that the CC values increase with an increase in precipitation intensity. Conversely, the error values are in inverse relation to the precipitation intensity. The CC’s values of CDR, CCS, and TRMM illustrated poor agreement against the gauge estimations. The IMERG showed better results even at lower precipitation intensities. The BIAS values show significant variation in response to precipitation intensity across all datasets. The TRMM also shows comparable variations in response to the intensity of precipitation; its error values are also in good contrast at maximum precipitation intensity.
The box schemes of all monthly evaluation indices are described in Figure 14. As indicated by the box plots, the CC values for all SBPD (IMERG, TRMM, CDR, and CCS) are 0.91, 0.8, 0.82, and 0.4, respectively. The values of CC reveal a good relation between SBPD and gauge estimations, but IMERG performance is more than satisfactory. While the performance of CCS is very poor, as described by the CC box plots. Moreover, the error values are also maximum for CCS followed by CDR and TRMM. The IMERG shows the least error values, as described in the box size of RMSE. As indicated by the box plots of rBIAS, a significant amount of over/underestimation is revealed by the CCS, which indicates the unsatisfactory performance of these products against the monthly gauge estimations.
A comparison of the performance of all SBPD and in situ observations on a monthly scale is illustrated in the Taylor diagram (Figure 15). For the generation of the Taylor diagram, all of the monthly estimations of (gauge, TRMM, IMERG, PERSIANN-CDR, and CCS) were normalized. The blue lines showing the CC values of all datasets indicate the excellent relationship between the gauge and SBPD estimations, except for PERSIANN-CCS. Similarly, the error values are very high for PERSIANN’s datasets (shown by semicircular green lines) as compared to IMERG and TRMM products. The standard deviation of all products is also comparable, as indicated by the black dotted lines circle.

3.4. Ability of SBPD on a Seasonal Scale

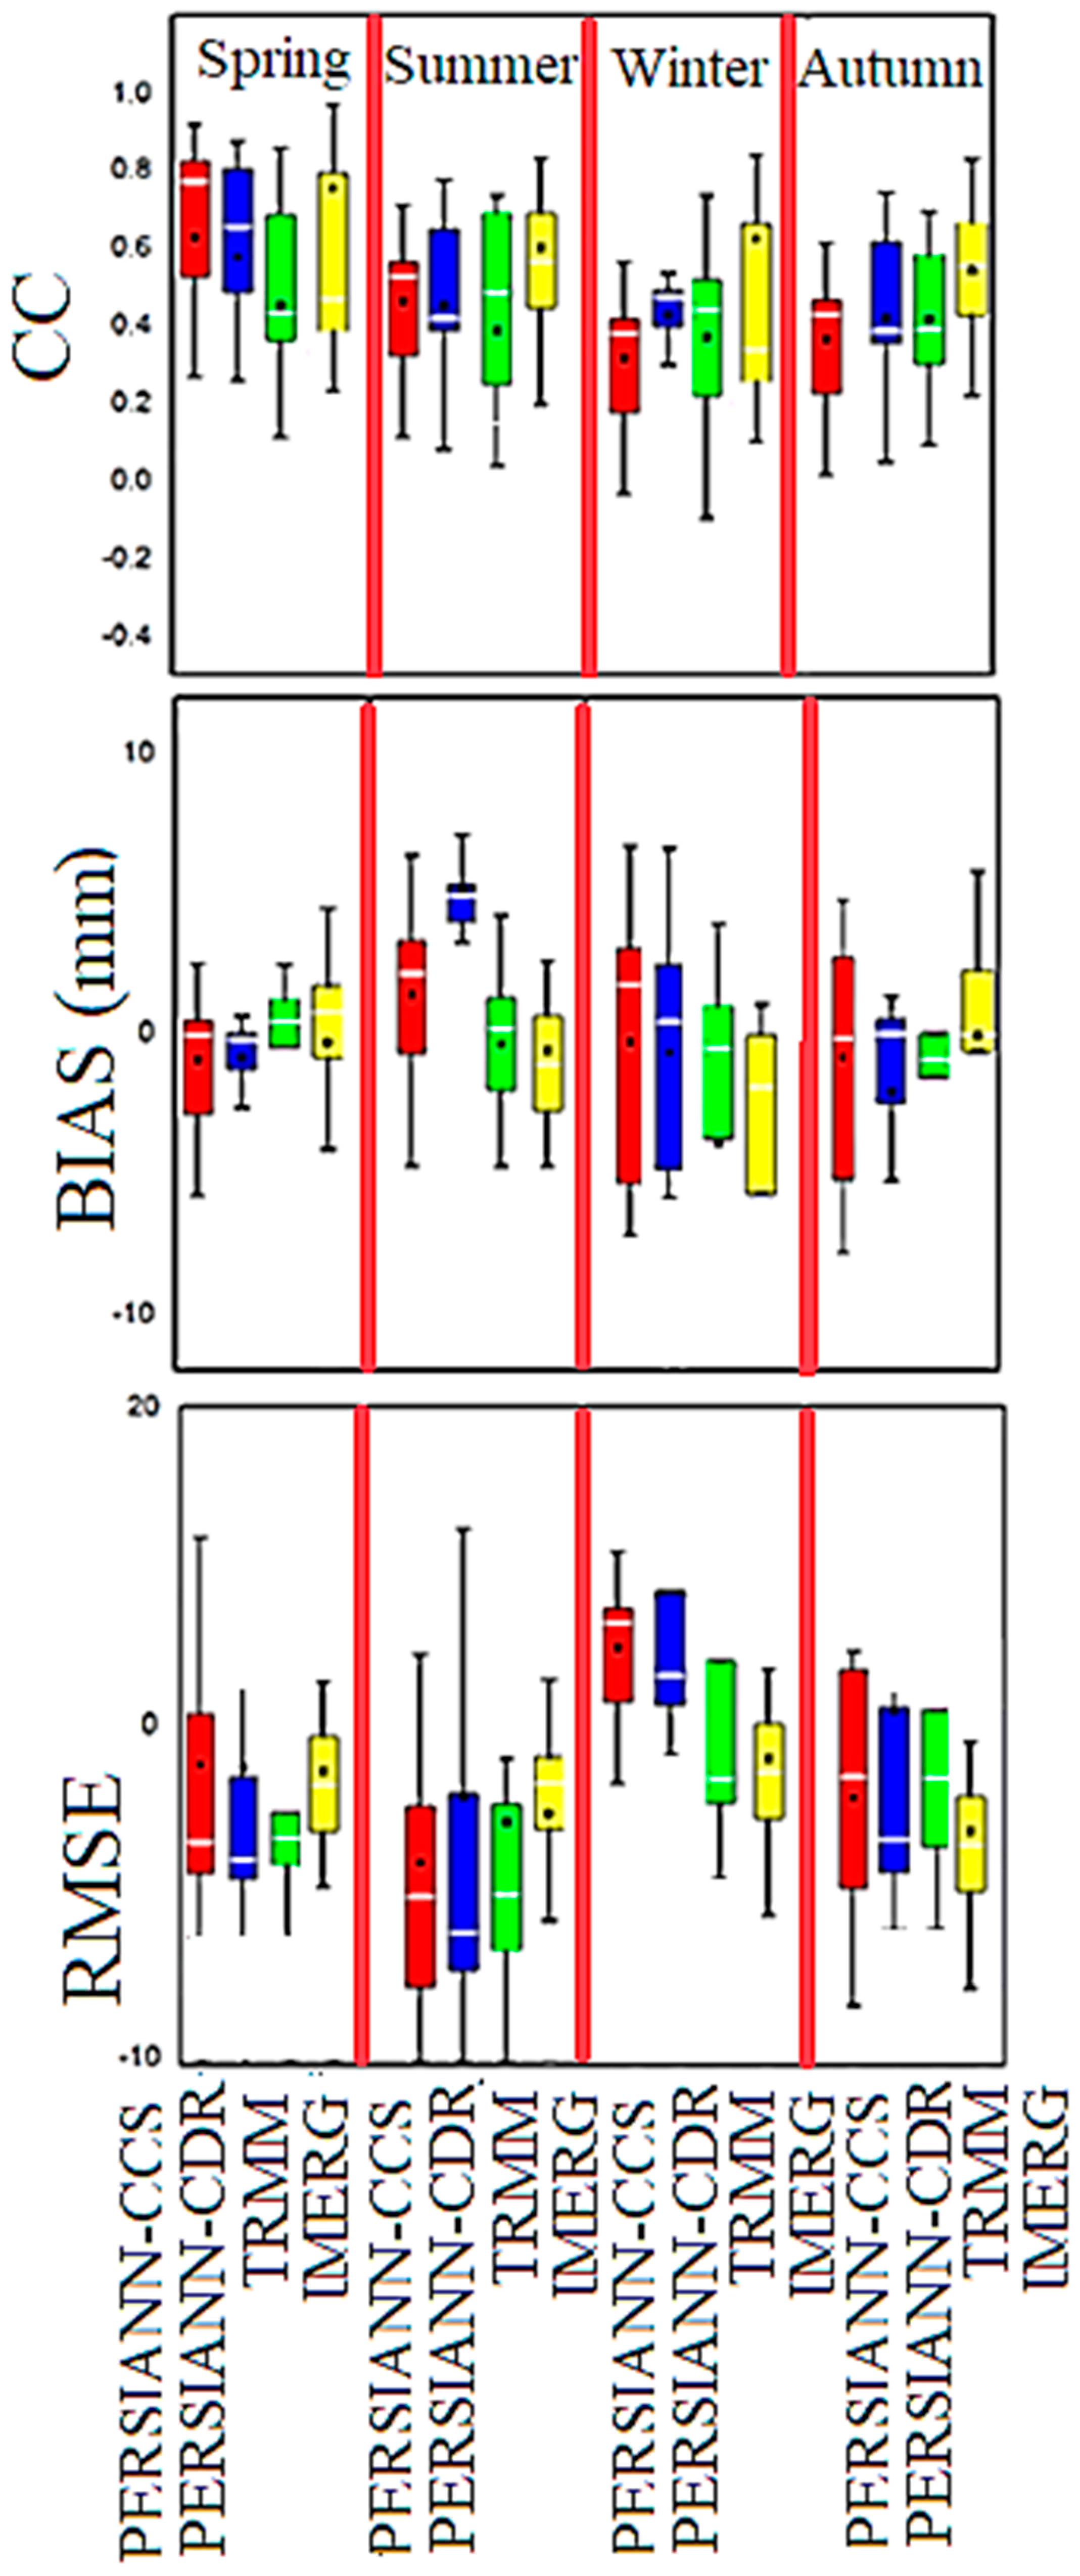
The box schemes of all the seasonal evaluation indices are described in Figure 16. As indicated by the box plots, the CC values for all SBPD (IMERG, TRMM, CDR, and CCS) are more satisfactory in the autumn season compared to other seasons (summer, winter, and spring). Throughout the spring season, only the IMERG performance is comparable, while other products show very unsatisfactory performance. The CCS is unable to track gauge observations in all seasons (as indicated by the box plots). In the winter season, all SBPD describe the maximum BIAS compared to other seasons. The box plots of RMSE for each SBPD (IMERG, TRMM, CDR, and CCS) revealed that the IMERG’s error value is less than 0.5, while other SBPD show significant amounts of error values. Other than the summer season, the TRMM shows reasonable performance.
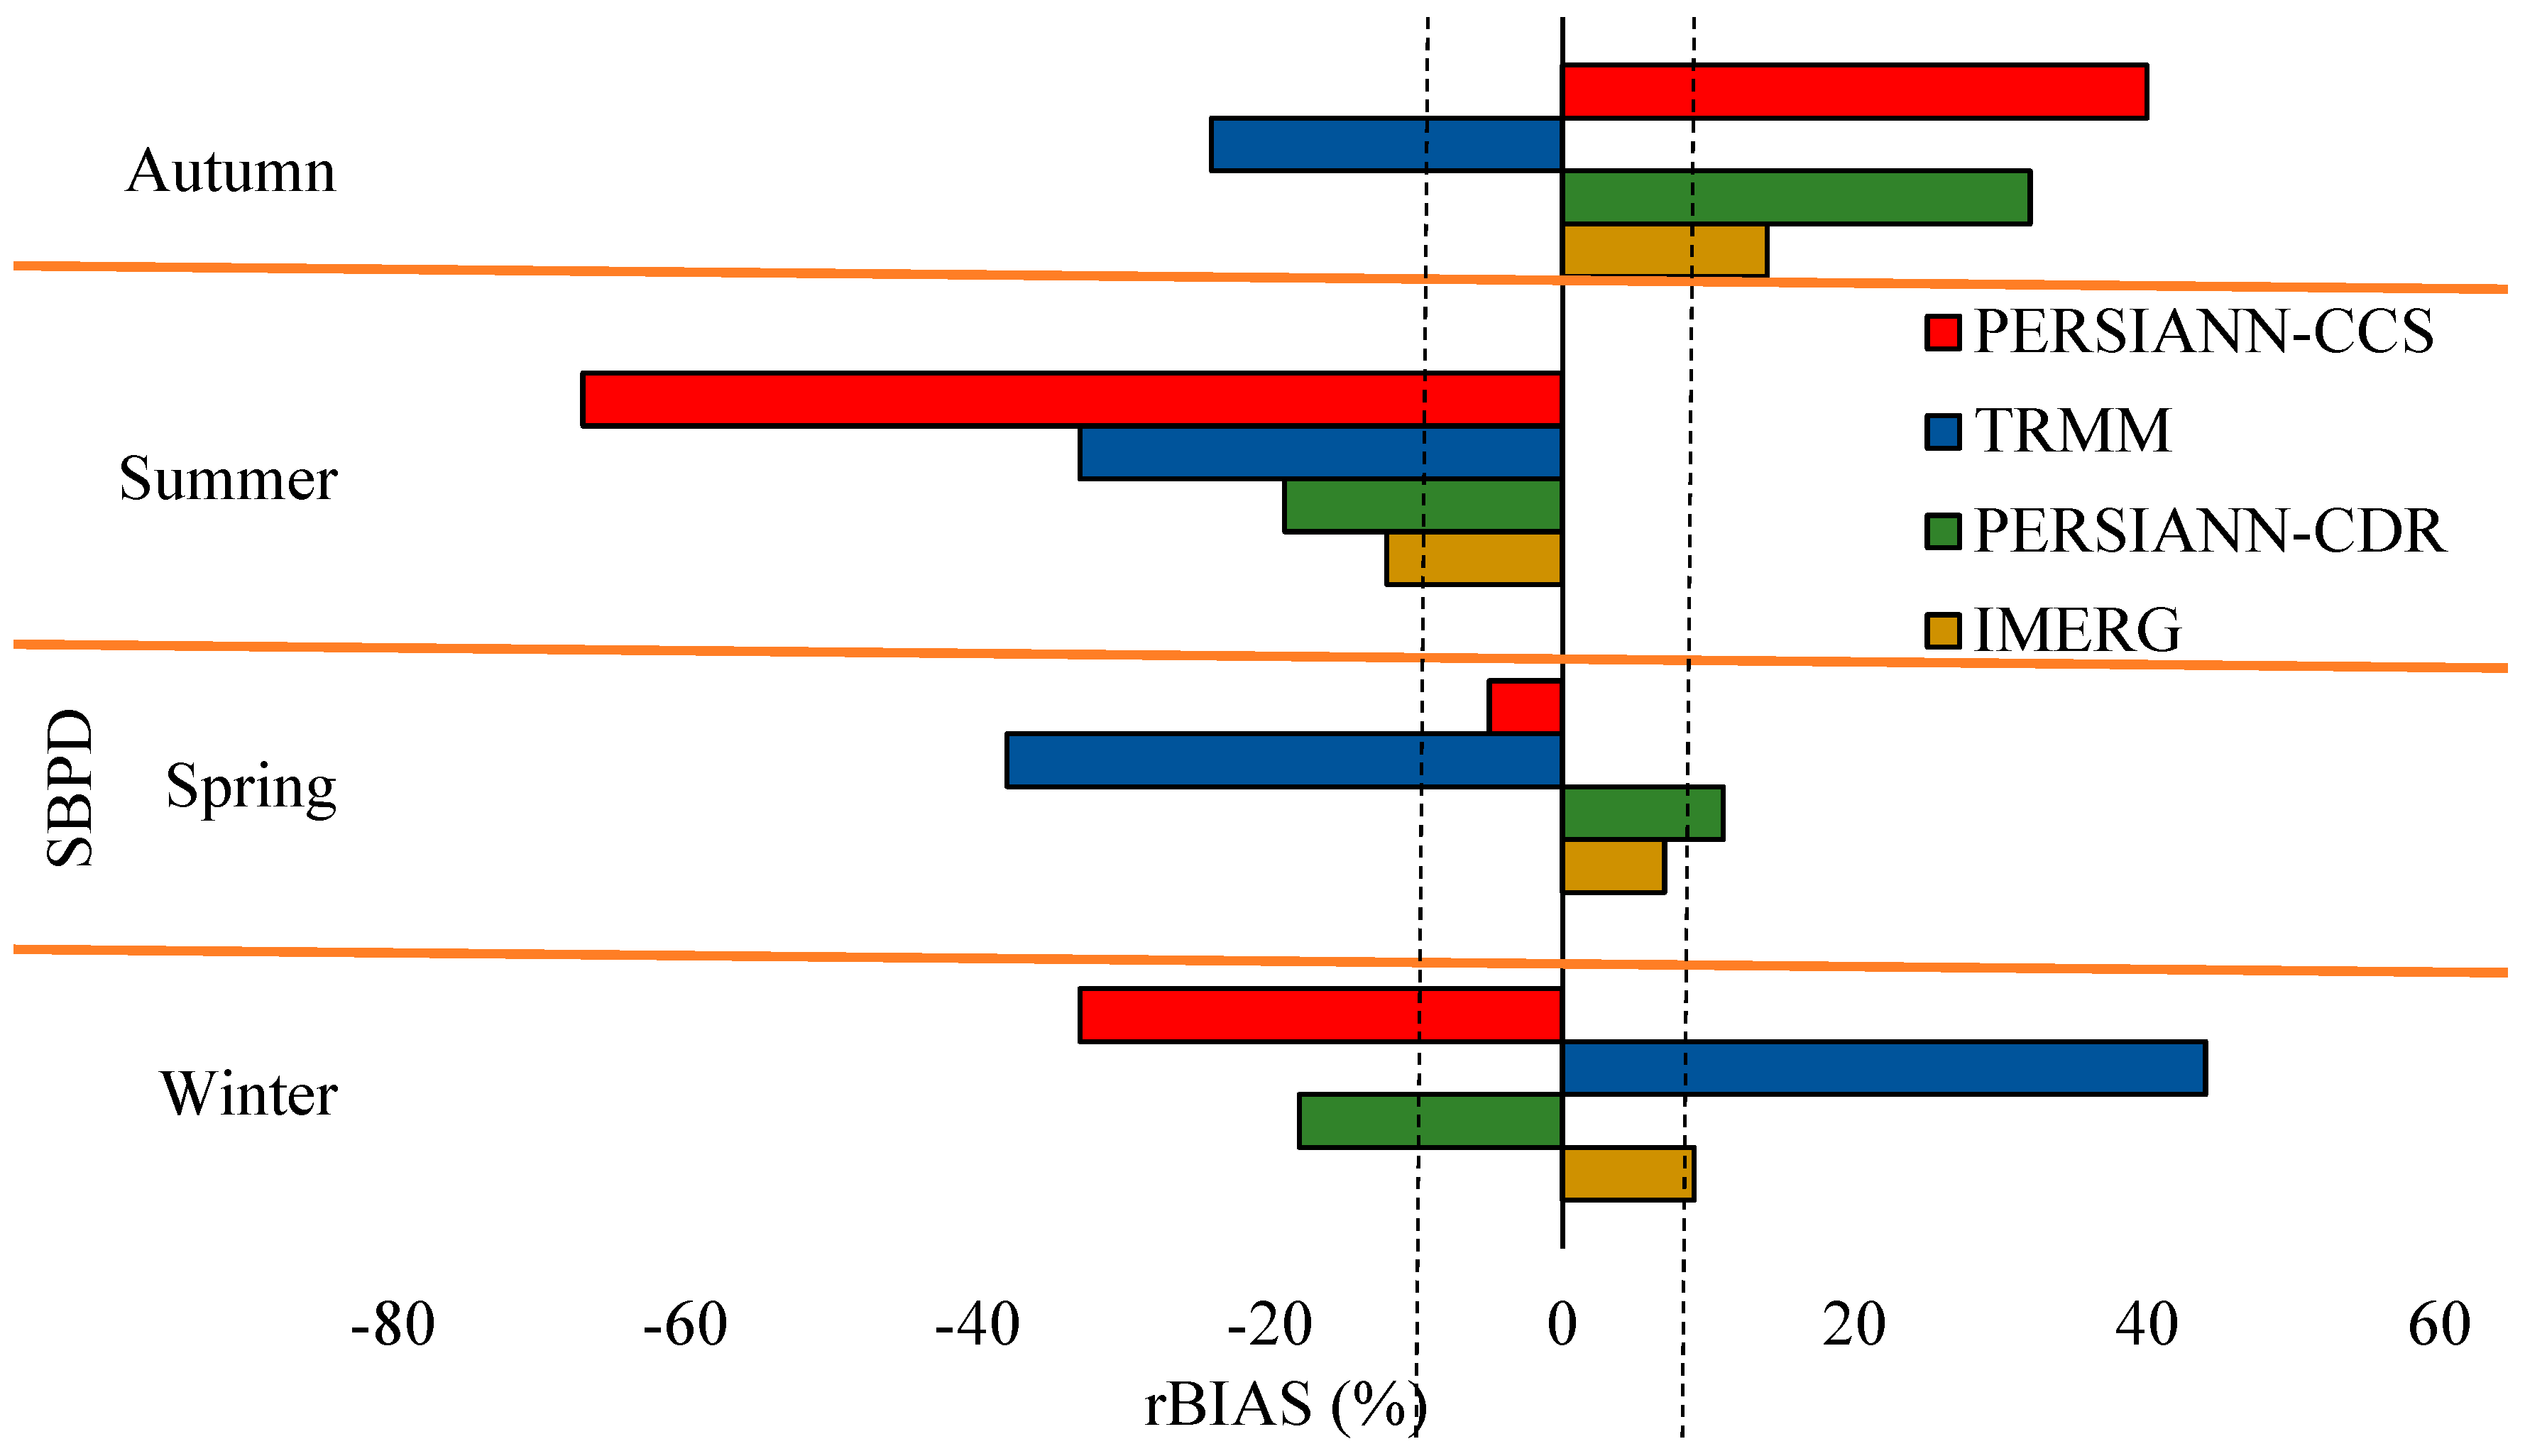
Figure 17 displays the seasonal rBIAS (%) of all SBPD (IMERG, TRMM, CDR, and CCS). In the summer season, a significant amount of overestimation is shown by PERSIANN CCS (40%), followed by CDR (35%) and IMERG (14%). While, on the other hand, TRMM underestimates the autumn season (−30%). All SBPD illustrate underestimation in the summer season, with the most significant underestimation displayed by CDR (−60%) in the summer. The TRMM product examined significant underestimation (−40%) in the spring season and significant overestimation in the winter season (43%), while the performance of CCS is only acceptable in the spring season. In the winter season, both CCS and CDR make underestimations, with ranges of (−38%) and (−19%), respectively. Overall, the performance of IMERG is better in all seasons compared to other SBPD (TRMM, CCS, and CDR).
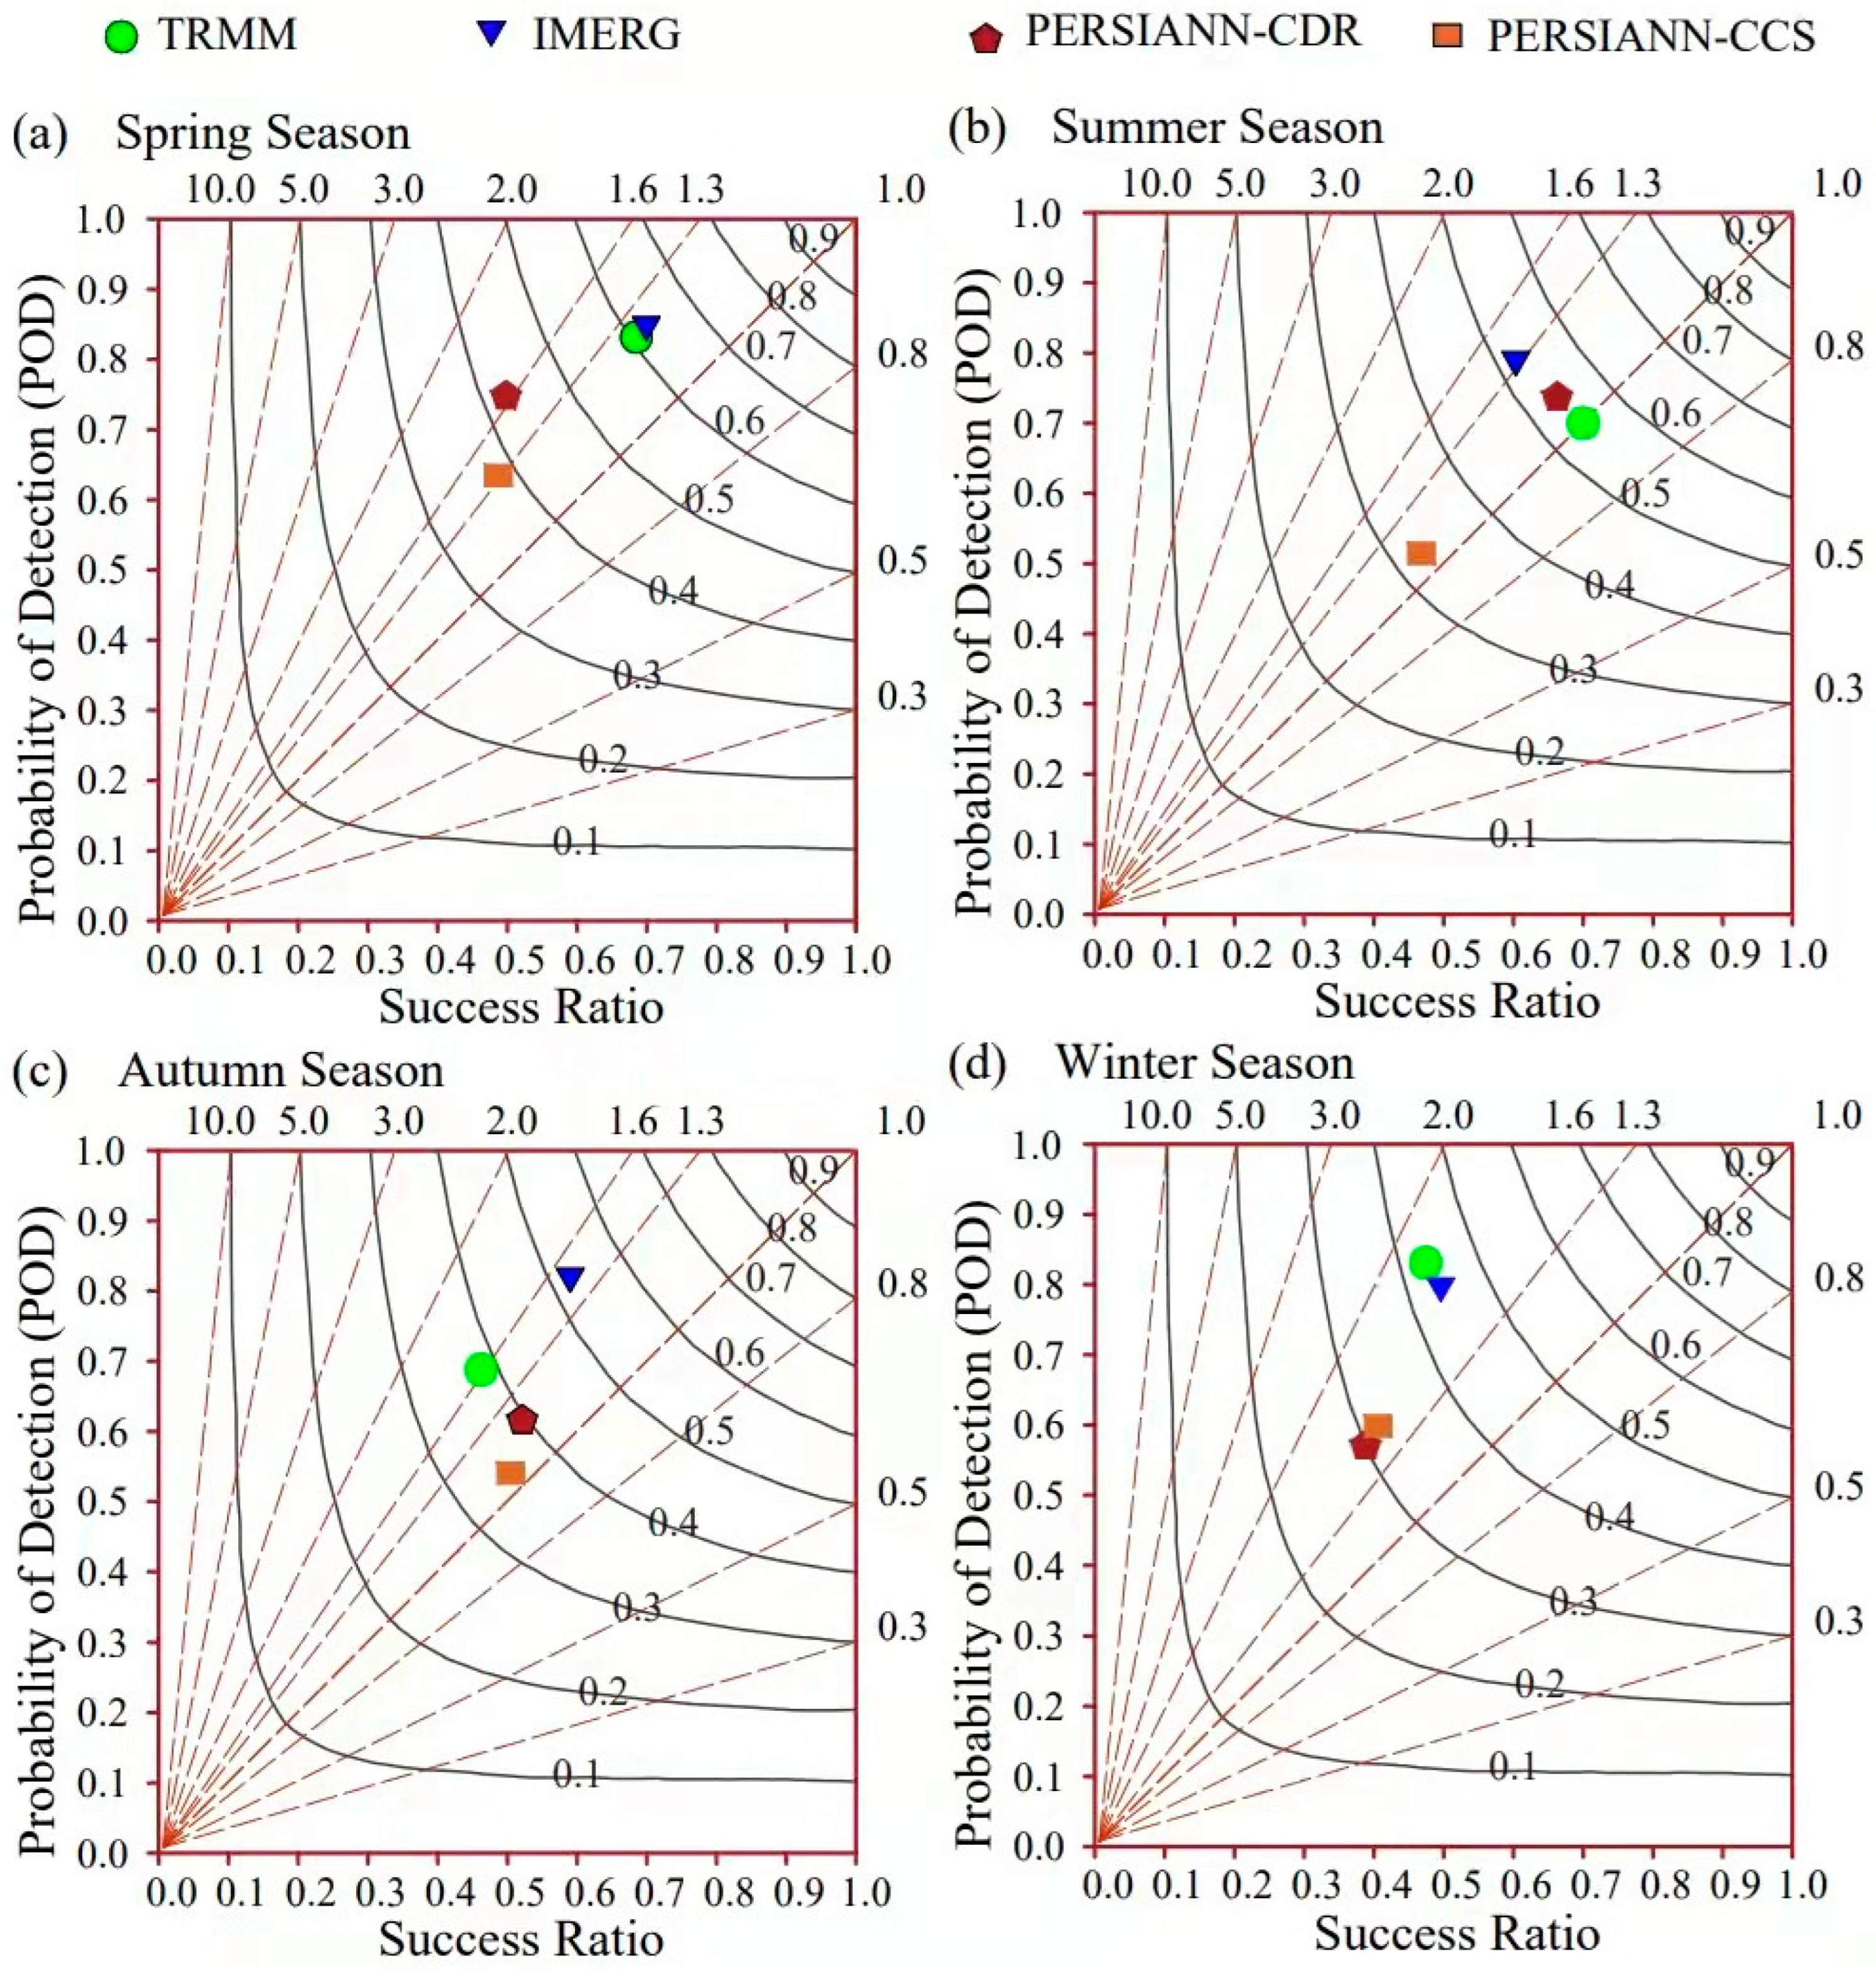
Figure 18 presents the performance diagram of all SBPD (TRMM, IMERG, PERSIANN-CDR, and CCS) in response to capturing the seasonal estimations of observed data. In terms of probability of detection (POD), the IMERG outperforms all other SBPD (TRMM, CCS, and CDR) in all seasons except in the winter season, with ranges (>0.71 in all seasons). For CCS and CDR, the success ratio (SR) is similarly alarmingly low. While the false alarm ratio (FAR) for the IMERG product is at a minimum, this demonstrates that IMERG satisfactorily performs when responding to the track probability of seasonal estimations. In all seasons, the CCS performance is weakest among other datasets.
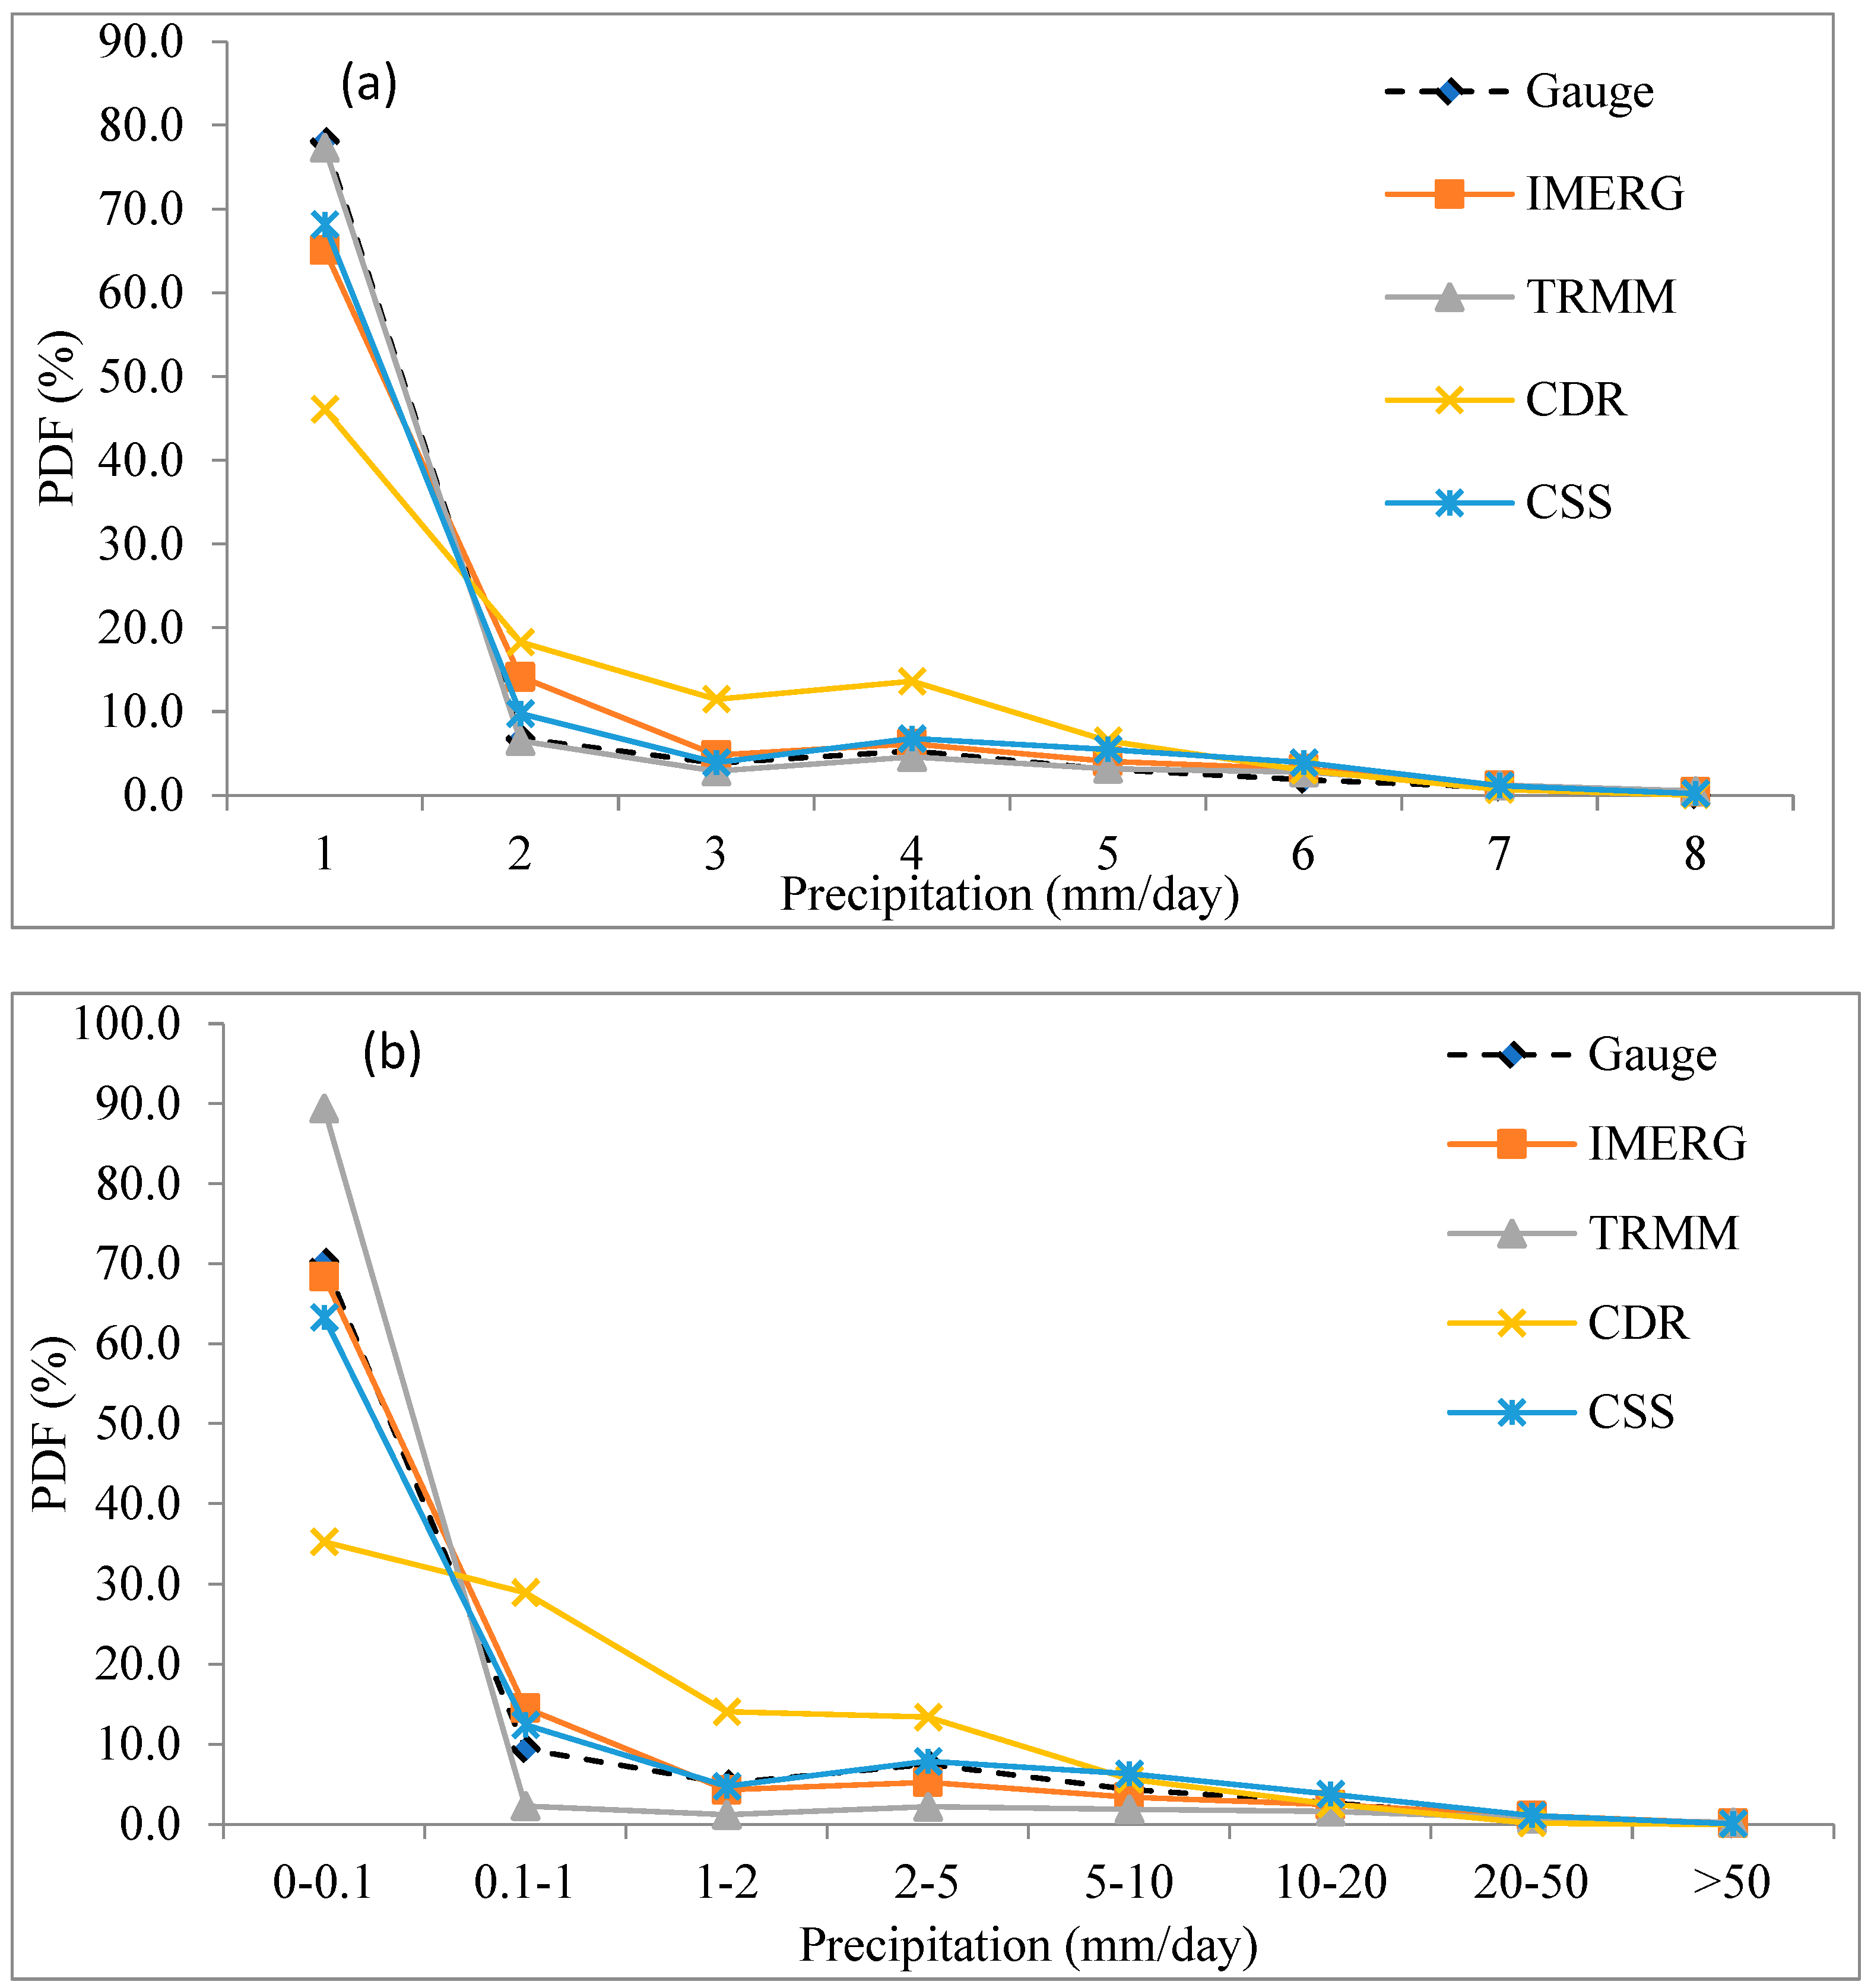
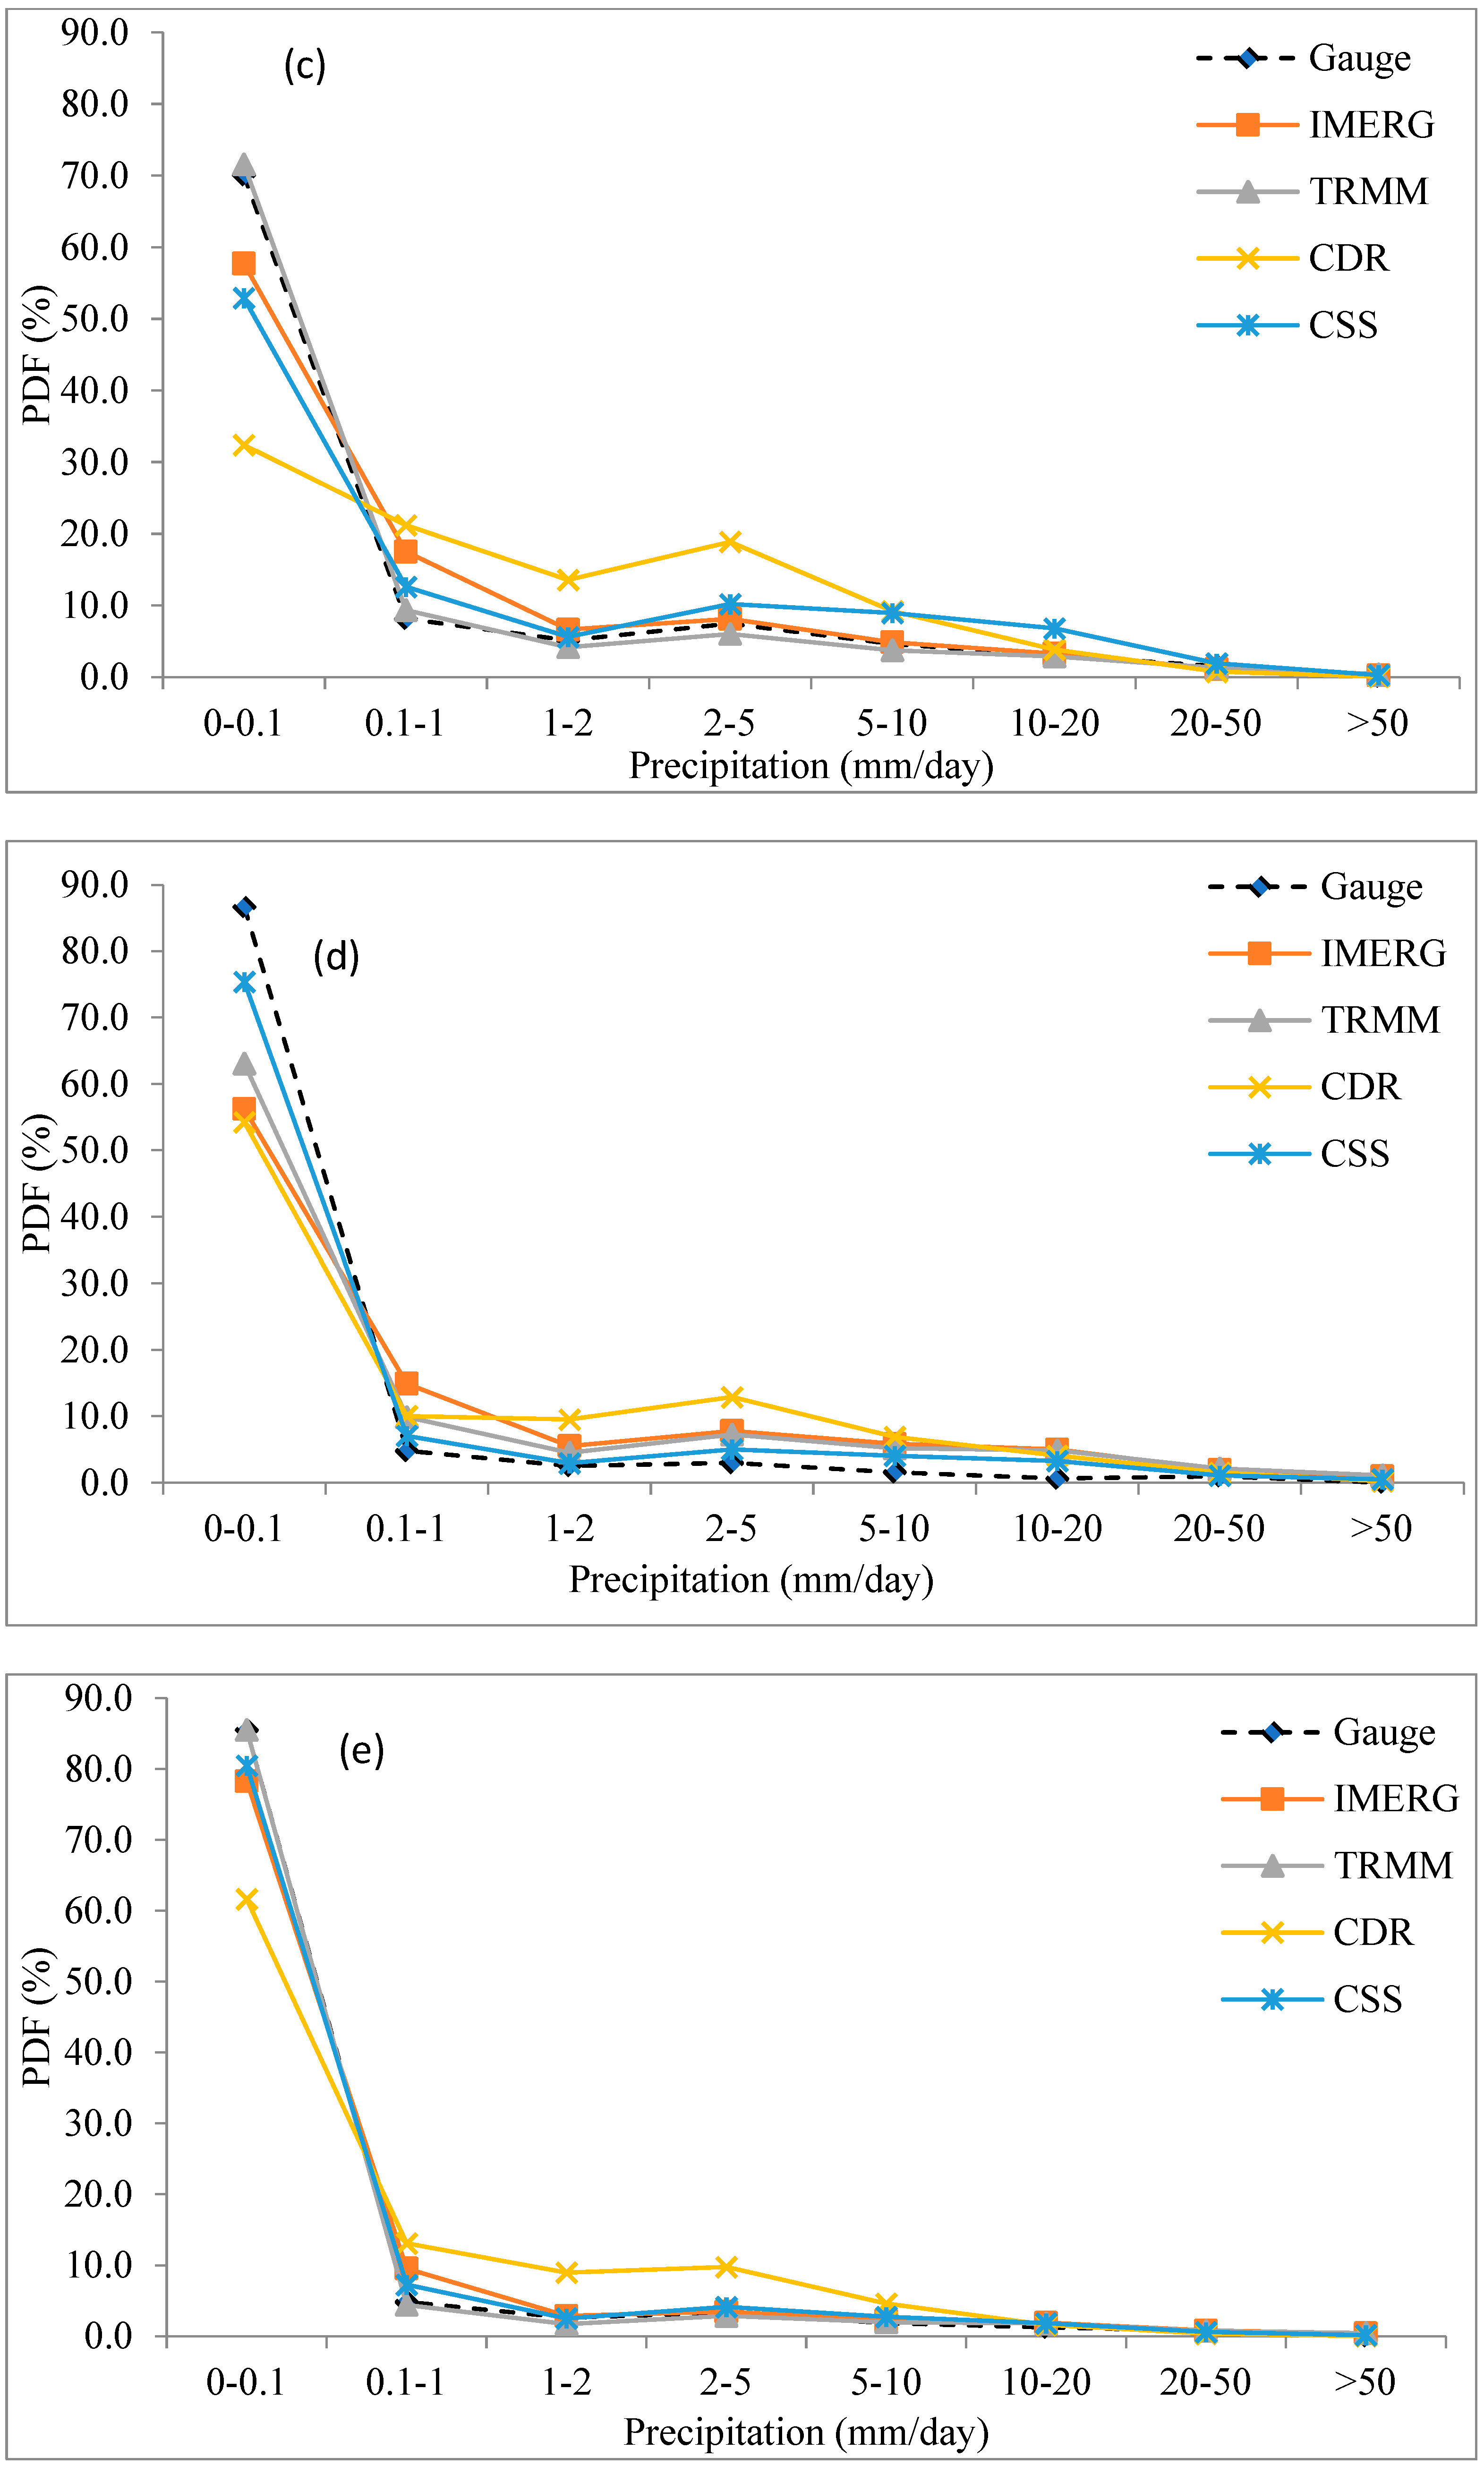
The probability function of all daily and seasonal SBPD (TRMM, IMERG, PERSIANN-CDR, and CCS) was analyzed (as described in Figure 19) against the daily and seasonal gauge estimations for the entire country. In the mountainous domain of central Asia, light precipitation events (<2 mm/day) are mostly revealed compared to medium (2–10 mm/day) and high (<10 mm/day) precipitations [31]. The TRMM displayed a significant amount of overestimation (80%) in response to tracking daily light precipitation events. The CDR presented significant underestimation (−52%), while the performance of IMERG was catchable by the in situ gauge observations in all seasons and on daily scales. The CDR showed underestimations in all seasons (summer, winter, autumn, and spring) with PDF ranges of (35%, 30%, 52%, and 61%), respectively. The TRMM showed underestimation in the autumn season, while over-underestimation in others. During the summer season, all SBPD displayed underestimation. Overall, the performance of IMERG was the most satisfactory in all seasons in tracking light and medium precipitation events. While in response to high precipitation events, the IMERG illustrated a slight overestimation.

4. Discussion

This study evaluated the assessment of four SBPDs (TRMM, IMERG, PERSIANN-CDR, and CCS) against local meteorological stations installed over the mountainous domain of Central Asia (Tajikistan). Widely used statistical analyses were considered for the performance analysis. Previously, many researchers have validated the ground evaluation of the latest SBPD, including (TRMM, IMERG, PERSIANN-CDR, and CCS) [13,17,32,33,34,35,36,37,38]. It is well recognized that local terrain and climatic variables have a substantial impact on SBPD effectiveness. For instance, Nadeem et al. [32] assessed the uncertainty of four PERSIANN family products over the Himalayan Mountains in South Asia, and they concluded that the accuracy of all SBPD mainly depends upon regional topographic conditions. Similarly, Hamza et al. [31] compared PERSIANN-CDR and IMERG, along with many other SBPD; his results also showed that evaluation indices (CC, BIAS, rBIAS, RMSE) were massively dependent on local elevation, precipitation intensity, and seasonality.
Fu et al. [39] also evaluated the accuracy of many satellites over the territory of China. His findings revealed that the performance of all satellite data completely depends on in situ topographical and climatic conditions. He found significant changes in the CC values as elevation changed. The results of our study also concluded that the performance assessment of all datasets showed significant spatial and temporal variation over the dense network of Tajikistan. Our findings indicate that the accuracy of SBPD (TRMM, IMERG, PERSIANN-CDR, and CCS) is better on the monthly scale compared to the daily scale. Similar findings have been outlined in many published studies [32,39,40]. Both products of the CHRS data portal (PERSIANN-CDR and PERSIANN-CCS) performance were very poor in response to capturing spatiotemporal variability compared to GPM products (TRMM and IMERG); a similar performance of the PERSIANN family of products was found in the results of Pellarin et al. [41]. In Figure 17, during the summer season, a significant amount of overestimation was shown by PERSIANN CCS (40%), followed by CDR (35%) and IMERG (14%), which was consistent with the findings of references [21,41]. Figure 13 concludes that the CC values increased with an increase in precipitation intensity. Conversely, the error values were in inverse relation to the precipitation intensity. The findings of many [23,42,43,44,45] studies are exactly parallel to the results of our performance analysis. Asif et al. [30] found that CC values decreased with an increase in elevation. Similarly, the error values were in direct relation to elevation, and our results were exactly in linear relation to this statement. The IMERG’s POD was maximum in all temporal scales (daily, monthly, and seasonal); similar definitions were found in [29,41]. The CCS performance in all seasons was very poor, which was comparable to the findings of [12,41]. In our opinion, light precipitation events (<2 mm/day), mostly revealed compared to medium (2–10 mm/day) and high (<10 mm/day) precipitations [12,28,37,38,46], were equally valid for this decision. Generally, the ground validation of SBPD was acceptable on a monthly scale. However, the daily estimations of all SBPDs were not satisfactory. Therefore, for more effective use of SBPD, modern methods, and algorithms [47,48] (data-driven approaches such as machine learning/deep learning, downscaling of precipitation products, and bias correction of SBPD) should be applied to minimize the error values of SBPD estimations.

5. Conclusions

In this evaluation, we analyzed the ground validation of four (TRMM, IMERG, PERSIANN-CDR, and CCS) satellite-based precipitation datasets. All SPBD estimations were assessed against the 18 ground weather stations installed over the mountainous area of Tajikistan. Performance was assessed at multiple temporal scales (daily, monthly, seasonal, and annual) and spatial scales (point pixel). The main conclusions of our performance analysis were:
  • On a monthly scale, the performance of all SBPD is more analogous to gauge estimations compared to on a daily scale.
  • The IMERG capability to track the spatiotemporal variability over the mountainous domain of Central Asia (Tajikistan) is unmatchable compared to other selected datasets (CDR, TRMM, and CCS).
  • In high-elevated areas, IMERG performance is more satisfactory compared to other datasets. While the performance of TRMM and PERSIANN-CDR is reasonable on flat sites, the performance of CCS is unacceptable.
  • In terms of probability of detection (POD), the IMERG outperforms all other SBPD (TRMM, CCS, and CDR) in all seasons, except in the winter season, with ranges (>0.71 in all seasons). While the false alarm ratio (FAR) is minimal for the IMERG product.
  • The TRMM displays a significant amount of overestimation (80%) in response to tracking daily light precipitation events. The CDR exhibits significant underestimation (−52%), while the performance of IMERG is catchable by the in situ gauge observations in all seasons and on daily scales. Moreover, all SBPDs show more variability in tracking light precipitation events compared to medium and high precipitation events.
  • The PERSIANN-CCS performance is only satisfactory in the spring season. The IMERG outperforms all other products in all seasons.
  • All SBPD illustrate underestimations during the summer season, with the most significant underestimation displayed by CDR (−60%) in summer. The TRMM product displays significant underestimation (−40%) in the spring season, and significant overestimation in the winter season (43%).
  • On annual estimations, the performance of IMERG is not satisfactory compared to other scales (daily, monthly, and seasonal). However, IMERG dominates all other SBPDs to track spatiotemporal variability over a limited gauge network of Tajikistan.
  • Generally, the CC values between SBPD and gauge estimations increase with the increase in precipitation intensity. Conversely, the relationship between the gauge and SBPD decreases at higher altitudes.
The results of our performance analysis highlight that the IMERG outperformed all other selected datasets (TRMM, PERSIANN-CDR, and PERSIANN-CCS) at multiple scales over the complete mountainous area of Tajikistan. IMERG’s spatial-temporal capabilities are more than satisfactory over the different topographical and climatic conditions of the study area. Moreover, its CC (>0.7) and r-BIAS (±10) are acceptable ranges. Furthermore, we offer the use of deep learning/machine learning approaches, as well as advanced models, to enhance algorithm retrievals of SBPD for more suitable applications. Therefore, we suggest that policymakers, hydrologists, meteorologists, and SBPD data users use estimations of IMERG for hydroclimatic applications over Tajikistan.

Author Contributions

All authors were involved in the intellectual elements of this paper. X.C., M.G. and T.L. designed the research. M.G. conducted the research and wrote the manuscript. M.U.N. and N.G. helped in the data arrangement and analysis. All authors have read and agreed to the published version of the manuscript.

Funding

This study was supported by the National Natural Science Foundation of China (Grant No. 42230708), the Research Fund for International Scientists of National Natural Science Foundation of China (Grant No. 42150410393), the Strategic Priority Research Program of the Chinese Academy of Sciences, Pan-Third Pole Environment Study for a Green Silk Road (Grant No. XDA20060303), the Xinjiang Scientific Expedition Program (Grant No. 2021XJKK1044), the K.C. Wong Education Foundation (Grant No. GJTD-2020-14), and the CAS Research Center for Ecology and Environment of Central Asia (Grant No. Y934031).

Data Availability Statement

Not applicable.

Acknowledgments

Manuchekhr Gulakhmadov would like to express his sincere gratitude to the Chinese Academy of Sciences (CAS) and the ANSO Scholarship for Young Talents (Master Program) for the financial support of this study. The authors are thankful to the Agency of Hydrometeorology of the Committee for Environmental Protection under the Government of the Republic of Tajikistan for providing the data for this research.

Conflicts of Interest

The authors declare no conflict of interest.

References

  1. Shukla, S.; Kansal, M.L.; Jain, S.K. Snow Cover Area Variability Assessment in the Upper Part of the Satluj River Basin in India. Geocarto Int. 2016, 32, 1285–1306. [Google Scholar] [CrossRef]
  2. Souza, J.; Gonçalves, W.A.; Souza, D.O. De Evaluation of Atmospheric Features in Natural Disasters Due Frontal Systems over Southern Brazil. Atmosphere 2022, 13, 1886. [Google Scholar]
  3. Nadeem, M.U.; Waheed, Z.; Ghaffar, A.M.; Javaid, M.M.; Hamza, A.; Ayub, Z.; Nawaz, M.A.; Waseem, W.; Hameed, M.F.; Zeeshan, A.; et al. Application of HEC-HMS for Flood Forecasting in Hazara Catchment Pakistan, South Asia. Int. J. Hydrol. 2022, 6, 7–12. [Google Scholar] [CrossRef]
  4. Roebber, P.J. Visualizing Multiple Measures of Forecast Quality. Weather. Forecast. 2009, 24, 601–608. [Google Scholar] [CrossRef] [Green Version]
  5. Cheema, M.J.M.; Bastiaanssen, W.G.M. Local calibration of remotely sensed rainfall from the TRMM satellite for different periods and spatial scales in the Indus Basin. Int. J. Remote Sens. 2011, 33, 2603–2627. [Google Scholar] [CrossRef]
  6. Anjum, M.N.; Ding, Y.; Shangguan, D.; Ijaz, M.W.; Zhang, S. Evaluation of High-Resolution Satellite-Based Real-Time and Post-Real-Time Precipitation Estimates during 2010 Extreme Flood Event in Swat River Basin, Hindukush Region. Adv. Meteorol. 2016, 2016, 2604980. [Google Scholar] [CrossRef] [Green Version]
  7. Yang, M.; Li, Z.; Anjum, M.N.; Gao, Y. Performance Evaluation of Version 5 (V05) of Integrated Multi-Satellite Retrievals for Global Precipitation Measurement (IMERG) over the Tianshan Mountains of China. Water 2019, 11, 1139. [Google Scholar] [CrossRef] [Green Version]
  8. Abebe, S.A.; Qin, T.; Yan, D.; Gelaw, E.B.; Workneh, H.T.; Kun, W.; Shanshan, L.; Biqiong, D. Spatial and Temporal Evaluation of the Latest High-Resolution Precipitation Products over the Upper Blue Nile River Basin, Ethiopia. Water 2020, 12, 3072. [Google Scholar] [CrossRef]
  9. Wild, A.; Chua, Z.W.; Kuleshov, Y. Evaluation of Satellite Precipitation Estimates over the South West Pacific Region. Remote Sens. 2021, 13, 3929. [Google Scholar] [CrossRef]
  10. Sharifi, E.; Eitzinger, J.; Dorigo, W. Performance of the State-of-the-Art Gridded Precipitation Products over Mountainous Terrain: A Regional Study over Austria. Remote Sens. 2019, 11, 2018. [Google Scholar] [CrossRef] [Green Version]
  11. Nadeem, M.U.; Anjum, M.N.; Asif, M.; Iqbal, T.; Hussain, S.; Sarwar, H.R.A.; Abbas, A. Spatio-Temporal Assessment of Satellite-Based Precipitation Products for Hydroclimatic Applications over over Potohar Region, Pakistan. Environ. Sci. Proc. 2022, 23, 18. [Google Scholar]
  12. Anjum, M.N.; Irfan, M.; Waseem, M.; Leta, M.K.; Niazi, U.M.; Rahman, S.; Ghanim, A.; Mukhtar, M.A.; Nadeem, M.U. Assessment of PERSIANN-CCS, PERSIANN-CDR, SM2RAIN-ASCAT, and CHIRPS-2.0 Rainfall Products over a Semi-Arid Subtropical Climatic Region. Water 2022, 14, 147. [Google Scholar] [CrossRef]
  13. Bhati, D.S.; Dubey, S.K.; Sharma, D. Application of Satellite-Based and Observed Precipitation Datasets for Hydrological Simulation in the Upper Mahi River Basin of Rajasthan, India. Sustainability 2021, 13, 7560. [Google Scholar] [CrossRef]
  14. Gulakhmadov, A.; Chen, X.; Gulakhmadov, M.; Kobuliev, Z.; Gulahmadov, N.; Peng, J.; Li, Z.; Liu, T. Correction: Gulakhmadov et al. Evaluation of the CRU TS3.1, APHRODITE_V1101, and CFSR Datasets in Assessing Water Balance Components in the Upper Vakhsh River Basin in Central Asia. Atmosphere 2021, 12, 1334, Erratum in Atmosphere 2021, 12, 1641. [Google Scholar] [CrossRef]
  15. Gulakhmadov, A.; Chen, X.; Gulahmadov, N.; Liu, T.; Anjum, M.N.; Rizwan, M. Simulation of the Potential Impacts of Projected Climate Change on Streamflow in the Vakhsh River Basin in Central Asia under CMIP5 RCP Scenarios. Water 2020, 12, 1426. [Google Scholar] [CrossRef]
  16. Huang, W.-R.; Liu, P.-Y.; Hsu, J. Multiple Timescale Assessment of Wet Season Precipitation Estimation over Taiwan Using the PERSIANN Family Products. Int. J. Appl. Earth Obs. Geoinf. 2021, 103, 102521. [Google Scholar] [CrossRef]
  17. Jiang, X.; Liu, Y.; Wu, Y.; Wang, G.; Zhang, X.; Meng, Q.; Gu, P.; Liu, T. Evaluation of the Performance of Multi-Source Precipitation Data in Southwest China. Water 2021, 13, 3200. [Google Scholar] [CrossRef]
  18. Beck, H.E.; Vergopolan, N.; Pan, M.; Levizzani, V.; van Dijk, A.I.J.M.; Weedon, G.P.; Brocca, L.; Pappenberger, F.; Huffman, G.J.; Wood, E.F. Global-Scale Evaluation of 22 Precipitation Datasets Using Gauge Observations and Hydrological Modeling. Hydrol. Earth Syst. Sci. 2017, 21, 6201–6217. [Google Scholar] [CrossRef] [Green Version]
  19. Berthier, E.; Arnaud, Y.; Kumar, R.; Ahmad, S.; Wagnon, P.; Chevallier, P. Remote Sensing Estimates of Glacier Mass Balances in the Himachal Pradesh (Western Himalaya, India). Remote Sens. Environ. 2007, 108, 327–338. [Google Scholar] [CrossRef] [Green Version]
  20. Salmani-Dehaghi, N.; Samani, N. Development of Bias-Correction PERSIANN-CDR Models for the Simulation and Completion of Precipitation Time Series. Atmos. Environ. 2020, 246, 117981. [Google Scholar] [CrossRef]
  21. Talchabhadel, R.; Aryal, A.; Kawaike, K.; Yamanoi, K.; Nakagawa, H.; Bhatta, B.; Karki, S.; Thapa, B.R. Evaluation of Precipitation Elasticity Using Precipitation Data from Ground and Satellite-Based Estimates and Watershed Modeling in Western Nepal. J. Hydrol. Reg. Stud. 2020, 33, 100768. [Google Scholar] [CrossRef]
  22. Sadeghi, M.; Nguyen, P.; Naeini, M.R.; Hsu, K.; Braithwaite, D.; Sorooshian, S. PERSIANN-CCS-CDR, a 3-Hourly 0.04° Global Precipitation Climate Data Record for Heavy Precipitation Studies. Sci. Data 2021, 8, 1–11. [Google Scholar] [CrossRef] [PubMed]
  23. Katiraie-Boroujerdy, P.-S.; Asanjan, A.A.; Hsu, K.-L.; Sorooshian, S. Intercomparison of PERSIANN-CDR and TRMM-3B42V7 precipitation estimates at monthly and daily time scales. Atmos. Res. 2017, 193, 36–49. [Google Scholar] [CrossRef] [Green Version]
  24. Dhanesh, Y.; Bindhu, V.M.; Senent-Aparicio, J.; Brighenti, T.M.; Ayana, E.; Smitha, P.S.; Fei, C.; Srinivasan, R. A Comparative Evaluation of the Performance of CHIRPS and CFSR Data for Different Climate Zones Using the SWAT Model. Remote Sens. 2020, 12, 3088. [Google Scholar] [CrossRef]
  25. Vu, T.T.; Li, L.; Jun, K.S. Evaluation of Multi-Satellite Precipitation Products for Streamflow Simulations: A Case Study for the Han River Basin in the Korean Peninsula, East Asia. Water 2018, 10, 642. [Google Scholar] [CrossRef] [Green Version]
  26. Anjum, M.N.; Ahmad, I.; Ding, Y.; Shangguan, D.; Zaman, M.; Ijaz, M.W.; Sarwar, K.; Han, H.; Yang, M. Assessment of IMERG-V06 Precipitation Product over Different Hydro-Climatic Regimes in the Tianshan Mountains, North-Western China. Remote Sens. 2019, 11, 2314. [Google Scholar] [CrossRef] [Green Version]
  27. Nguyen, P.; Shearer, E.J.; Tran, H.; Ombadi, M.; Hayatbini, N.; Palacios, T.; Huynh, P.; Braithwaite, D.; Updegraff, G.; Hsu, K.; et al. The CHRS Data Portal, an Easily Accessible Public Repository for PERSIANN Global Satellite Precipitation Data. Sci. Data 2019, 6, 180296. [Google Scholar] [CrossRef] [Green Version]
  28. Rahman, S.H.; Sengupta, D.; Ravichandran, M. Variability of Indian Summer Monsoon Rainfall in Daily Data from Gauge and Satellite. J. Geophys. Res. Atmos. 2009, 114. [Google Scholar] [CrossRef]
  29. Zhang, L.; Li, X.; Zheng, D.; Zhang, K.; Ma, Q.; Zhao, Y.; Ge, Y. Merging Multiple Satellite-Based Precipitation Products and Gauge Observations Using a Novel Double Machine Learning Approach. J. Hydrol. 2021, 594, 125969. [Google Scholar] [CrossRef]
  30. Asif, M.; Nadeem, M.U.; Anjum, M.N.; Ahmad, B.; Manuchekhr, G.; Umer, M.; Hamza, M.; Javaid, M.M. Evaluation of Soil Moisture-Based Satellite Precipitation Products over Semi-Arid Climatic Region. Atmosphere 2022, 14, 8. [Google Scholar] [CrossRef]
  31. Hamza, A.; Anjum, M.N.; Cheema, M.J.M.; Chen, X.; Afzal, A.; Azam, M.; Shafi, M.K.; Gulakhmadov, A. Assessment of IMERG-V06, TRMM-3B42V7, SM2RAIN-ASCAT, and PERSIANN-CDR Precipitation Products over the Hindu Kush Mountains of Pakistan, South Asia. Remote Sens. 2020, 12, 3871. [Google Scholar] [CrossRef]
  32. Nadeem, M.U.; Anjum, M.N.; Afzal, A.; Azam, M.; Hussain, F.; Usman, M.; Javaid, M.M.; Mukhtar, M.A.; Majeed, F. Assessment of Multi-Satellite Precipitation Products over the Himalayan Mountains of Pakistan, South Asia. Sustainability 2022, 14, 8490. [Google Scholar] [CrossRef]
  33. Ahmed, E.; Al Janabi, F.; Zhang, J.; Yang, W.; Saddique, N.; Krebs, P. Hydrologic Assessment of TRMM and GPM-Based Precipitation Products in Transboundary River Catchment (Chenab River, Pakistan). Water 2020, 12, 1902. [Google Scholar] [CrossRef]
  34. Anjum, M.N.; Ding, Y.; Shangguan, D.; Tahir, A.A.; Iqbal, M.; Adnan, M. Comparison of Two Successive Versions 6 and 7 of TMPA Satellite Precipitation Products with Rain Gauge Data over Swat Watershed, Hindukush Mountains, Pakistan. Atmos. Sci. Lett. 2016, 17, 270–279. [Google Scholar] [CrossRef] [Green Version]
  35. Lu, X.; Tang, G.; Liu, X.; Wang, X.; Liu, Y.; Wei, M. The Potential and Uncertainty of Triple Collocation in Assessing Satellite Precipitation Products in Central Asia. Atmos. Res. 2021, 252, 105452. [Google Scholar] [CrossRef]
  36. Gao, F.; Zhang, Y.; Chen, Q.; Wang, P.; Yang, H.; Yao, Y.; Cai, W. Comparison of Two Long-Term and High-Resolution Satellite Precipitation Datasets in Xinjiang, China. Atmos. Res. 2018, 212, 150–157. [Google Scholar] [CrossRef]
  37. Mosaffa, H.; Shirvani, A.; Khalili, D.; Nguyen, P.; Sorooshian, S. Post and near Real-Time Satellite Precipitation Products Skill over Karkheh River Basin in Iran. Int. J. Remote Sens. 2020, 41, 6484–6502. [Google Scholar] [CrossRef]
  38. Chen, C.; Chen, Q.; Duan, Z.; Zhang, J.; Mo, K.; Li, Z.; Tang, G. Multiscale Comparative Evaluation of the GPM IMERG v5 and TRMM 3B42 v7 Precipitation Products from 2015 to 2017 over a Climate Transition Area of China. Remote Sens. 2018, 10, 944. [Google Scholar] [CrossRef] [Green Version]
  39. Fu, Y.; Xia, J.; Yuan, W.; Xu, B.; Wu, X.; Chen, Y.; Zhang, H. Assessment of Multiple Precipitation Products over Major River Basins of China. Theor. Appl. Clim. 2014, 123, 11–22. [Google Scholar] [CrossRef]
  40. Bagtasa, G. Assessment of Tropical Cyclone Rainfall from GSMaP and GPM Products and Their Application to Analog Forecasting in the Philippines. Atmosphere 2022, 13, 1398. [Google Scholar] [CrossRef]
  41. Pellarin, T.; Román-Cascón, C.; Baron, C.; Bindlish, R.; Brocca, L.; Camberlin, P.; Fernández-Prieto, D.; Kerr, Y.H.; Massari, C.; Panthou, G.; et al. The Precipitation Inferred from Soil Moisture (PrISM) near Real-Time Rainfall Product: Evaluation and Comparison. Remote Sens. 2020, 12, 481. [Google Scholar] [CrossRef] [Green Version]
  42. Iqbal, M.F.; Athar, H. Validation of Satellite Based Precipitation over Diverse Topography of Pakistan. Atmos. Res. 2018, 201, 247–260. [Google Scholar] [CrossRef]
  43. Nadeem, M.U.; Ghanim, A.A.J.; Anjum, M.N.; Shangguan, D.; Rasool, G.; Irfan, M.; Niazi, U.M.; Hassan, S. Multiscale Ground Validation of Satellite and Reanalysis Precipitation Products over Diverse Climatic and Topographic Conditions. Remote Sens. 2022, 14, 4680. [Google Scholar] [CrossRef]
  44. Hussain, S.; Song, X.; Ren, G.; Hussain, I.; Han, D.; Zaman, M.H. Evaluation of Gridded Precipitation Data in the Hindu Kush–Karakoram–Himalaya Mountainous Area. Hydrol. Sci. J. 2017, 62, 2393–2405. [Google Scholar] [CrossRef]
  45. Peng, J.; Liu, T.; Huang, Y.; Ling, Y.; Li, Z.; Bao, A.; Chen, X.; Kurban, A.; De Maeyer, P. Satellite-Based Precipitation Datasets Evaluation Using Gauge Observation and Hydrological Modeling in a Typical Arid Land Watershed of Central Asia. Remote Sens. 2021, 13, 221. [Google Scholar] [CrossRef]
  46. Ali, S.; Chen, Y.; Azmat, M.; Kayumba, P.M.; Ahmed, Z.; Mind’je, R.; Ghaffar, A.; Qin, J.; Tariq, A. Long-Term Performance Evaluation of the Latest Multi-Source Weighted-Ensemble Precipitation (MSWEP) over the Highlands of Indo-Pak (1981–2009). Remote Sens. 2022, 14, 4773. [Google Scholar] [CrossRef]
  47. Habib, E.; Haile, A.T.; Sazib, N.; Zhang, Y.; Rientjes, T. Effect of Bias Correction of Satellite-Precipitation Estimates on Runoff Simulations at the Source of the Upper Blue Nile. Remote Sens. 2014, 6, 6688–6708. [Google Scholar] [CrossRef] [Green Version]
  48. Li, Z.; Wen, Y.; Schreier, M.; Behrangi, A.; Hong, Y.; Lambrigtsen, B. Advancing Satellite Precipitation Retrievals With Data Driven Approaches: Is Black Box Model Explainable? Earth Space Sci. 2021, 8, e2020EA001423. [Google Scholar] [CrossRef]
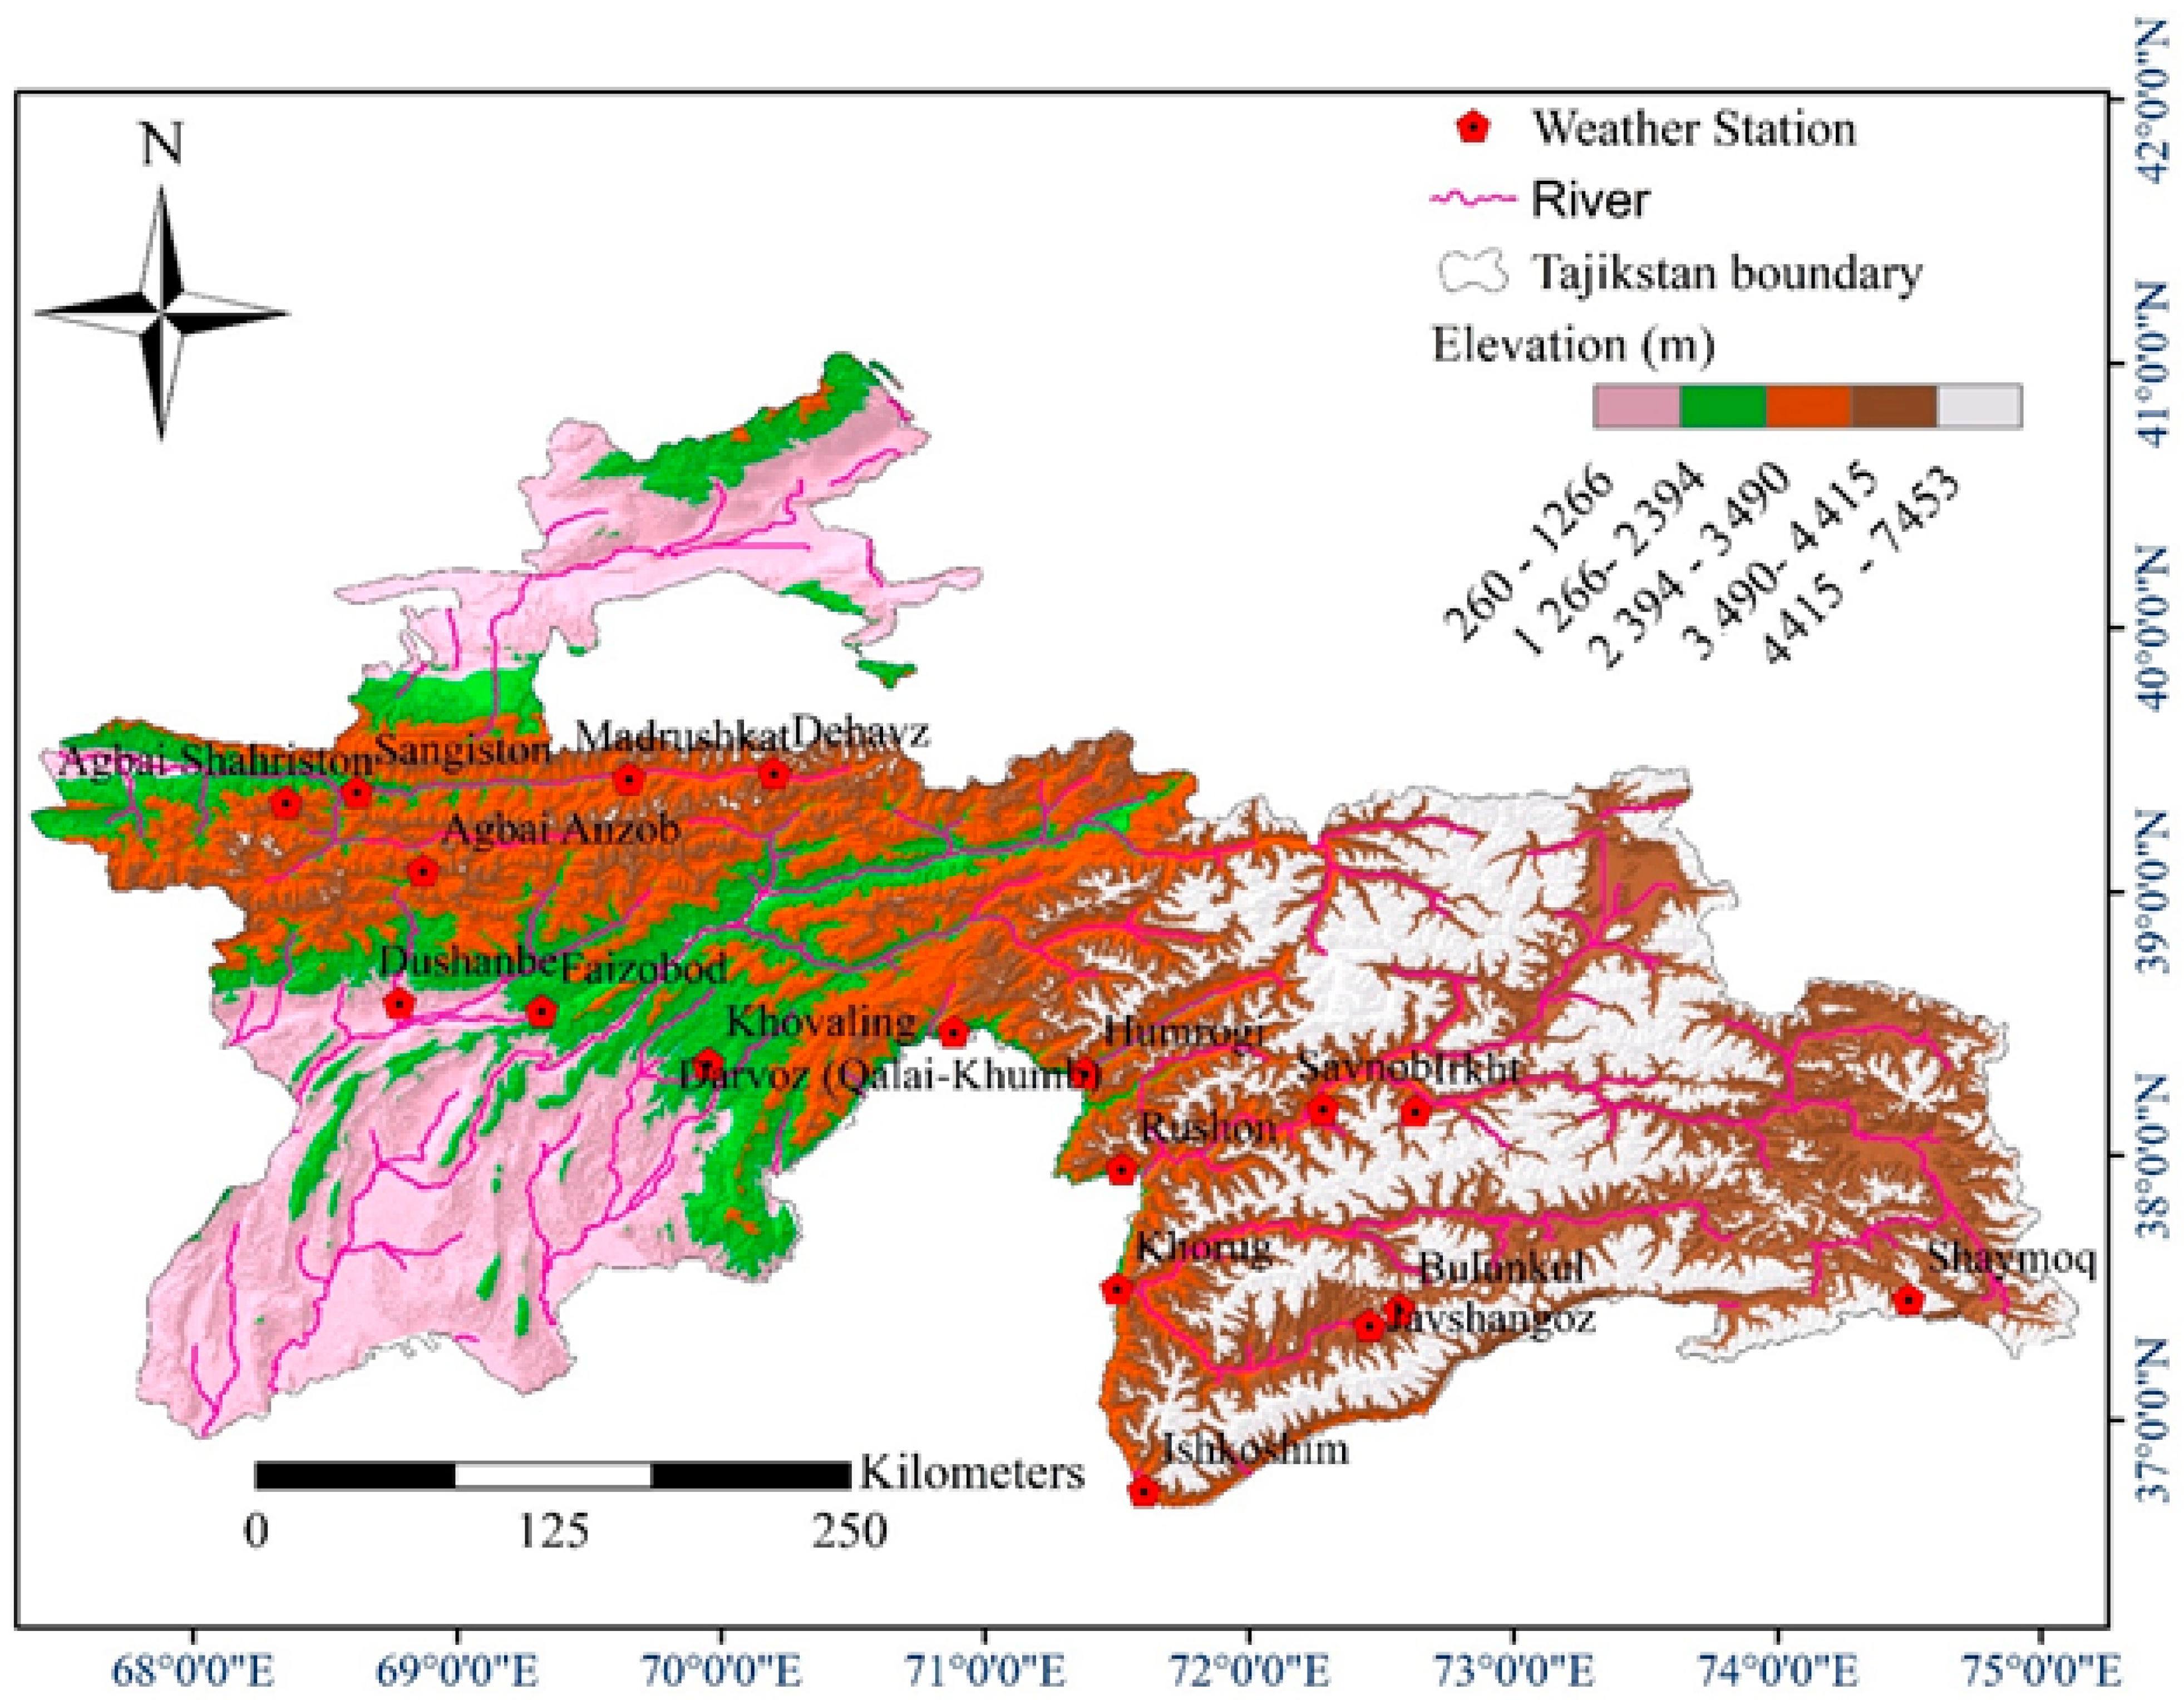
Figure 1. Topographic map and applied gauging stations of Tajikistan.
Remotesensing 15 01420 g001
Figure 2. The layout of the whole analysis to assess the performance of SBPD.
Remotesensing 15 01420 g002
Figure 3. Aerial precipitation calculation using the Thiessen polygon method.
Remotesensing 15 01420 g003
Figure 4. Distribution of annual precipitation datasets based on (a) IMERG, (b) TRMM, (c) PERSIANN-CDR, (d) PERSIANN-CSS, and (e) gauging stations using the Kriging method in the mountainous territories of Tajikistan in Central Asia.
Remotesensing 15 01420 g004
Figure 5. Temporal variability of all SBPD and gauge estimation.
Remotesensing 15 01420 g005
Figure 6. Comparison of moving averages of all SBPD and gauge estimations.
Remotesensing 15 01420 g006
Figure 7. Comparison of daily spatial variability of all SBPD and gauge estimations.
Remotesensing 15 01420 g007
Figure 8. Spatial distribution of evaluation indices’ (CC, BIAS, rBIAS, and RMSE) for all SBPD.
Remotesensing 15 01420 g008
Figure 9. Box schemes of all SBPD daily estimations.
Remotesensing 15 01420 g009
Figure 10. Impact of elevation on daily estimations of evaluation indices.
Remotesensing 15 01420 g010
Figure 11. Taylor diagram showing the performance of daily estimation of SBPD.
Remotesensing 15 01420 g011
Figure 12. SBPD’s performance on a daily scale.
Remotesensing 15 01420 g012
Figure 13. Impact of precipitation intensity on monthly estimations of evaluation indices.
Remotesensing 15 01420 g013
Figure 14. Box schemes of all SBPD monthly estimations.
Remotesensing 15 01420 g014
Figure 15. Taylor diagram showing the performance of monthly estimations of SBPD.
Remotesensing 15 01420 g015
Figure 16. Box schemes of all SBPD seasonal estimations.
Remotesensing 15 01420 g016
Figure 17. rBIAS (%) of all SBPD on seasonal scale.
Remotesensing 15 01420 g017
Figure 18. Seasonal performance of all SBPD.
Remotesensing 15 01420 g018
Figure 19. PDF (%) of all SBPD at (a) daily, (b) winter, (c) spring, (d) summer, (e) autumn scales over Tajikistan.
Remotesensing 15 01420 g019aRemotesensing 15 01420 g019b
Table 1. Weather stations used in performance analysis of SBPD.
Serial NumberWeather StationLatitude (°)Longitude (°)Elevation (m)
1Agbai Anzob39.0868.873373
2Agbai Shahriston39.3468.353143
3Bulunkul37.4272.573747
4Darvoz38.4770.881284
5Dehavz39.4570.22561
6Dushanbe38.5868.78790
7Faizobod38.5569.321215
8Humrogi38.3171.381736
9Irkht38.1772.633290
10Ishkoshim36.7371.62646
11Javshangoz37.3672.463576
12Khorug37.571.52075
13Khovaling38.3569.951468
14Madrushtak39.4369.652234
15Rushon37.4571.521966
16Sangiston39.3868.621502
17Savnob38.1872.282800
18Shaymoq37.4674.43835
Table 2. Salient features of SBPD.
Satellite DatasetsSpatial/Temporal ResolutionTime CoverageData Source (All the Data Assessed on 13 January 2019)
PERSIANN-CDR0.25° × 0.25°/1-dayJanuary 1983 to September 2023 www.ncdc.noaa.gov/cdr/operationalcdrs.html
PERSIANN-CCS0.04° × 0.04°/1-dayJanuary 2003 to January 2023 ftp://persiann.eng.uci.edu/CHRSdata/PERSIANN-CCS
IMERG0.1° × 0.1°/1-dayJanuary 1998 to December 2020http://pmm.nasa.gov/data-access/downloads/gms/
TRMM0.25° × 0.25°/1-dayJanuary 1998 to December 2020http://disc2.nascom.nasa.gov/tovas/
Table 3. The formulations of all evaluation and categorical indices used in performance evaluation.
Statistical AnalysisDetailsAcceptable Range
c c = i = 1 n ( G i G ) ( E i E ) I = 1 n G i - G 2 × I = 1 n E i - E 2 CC = Correlation Coefficient
Gi = In situ gauge data
G = average of in situ gauge data
Ei = SBPD of estimations
E = mean of SBPD estimations
n = total number of SBPD
1
B I A S = i = 1 n E i - G i n Ei = estimates of SBPD
Gi = In situ gauge data
n = total number of SBPD
0
r b i a s = i = 1 n E i - G i I = 1 n G i × 100 rbias = Bias, relative Bias
Ei = estimates of SBPD
Gi = In situ gauge data
n = total number of SBPD
±10
R M S E = 1 n I = 1 n E i - G i 2 RMSE = Root Mean Square Error
Ei = estimates of SBPD
Gi = In situ gauge data
n = total number of SBPD
0
P O D = A A + B POD = Probability of Detection
A = number of precipitation events that the SBPD actually tracked
B = number of precipitation events that the reference gauging stations observed but were not tracked by SPBD
1
F A R = C A + C FAR = False Alarm Ratio
C = number of precipitation events that the SBPD misrepresented
A = number of precipitation events that the SBPD actually tracked
0
C S I = A A + B + C CSI = Critical Success Index
A = Amount of precipitation events that were reported by SBPD
B = Amount of precipitation events missed by SBPD while being observed by reference gauging stations
C = Amount of precipitation events that were inaccurately tracked by SBPD
1
Disclaimer/Publisher’s Note: The statements, opinions and data contained in all publications are solely those of the individual author(s) and contributor(s) and not of MDPI and/or the editor(s). MDPI and/or the editor(s) disclaim responsibility for any injury to people or property resulting from any ideas, methods, instructions or products referred to in the content.