Abstract
The spatiotemporal distributions and physical–optical properties of aerosols are of great scientific significance for the study of climate change and atmospheric environment. What are the characteristics of aerosols in constant high humidity? Continuous wet weather (CWW) is a special weather phenomenon that occurs frequently during the late winter and early spring in South China. In this study, the CALIPSO satellite data and the ERA5 and MERRA-2 reanalysis data are used to analyze the aerosol optical properties of a total of 68 CWW processes from 2012 to 2021 in the Guangdong–Hong Kong–Macau Greater Bay Area (GBA). We attempt to explore the variations in meteorological conditions and physical–optical properties of aerosols during the before-stage, wet-stage, and after-stage under different humidity levels. The results show that the prevailing wind direction is northeasterly and that the temperature and humidity are lower under the influence of cold high pressure in the before-stage. Moreover, the high aerosol optical depth (AOD) mainly results from regional transport. During the wet-stage, clean ocean airflow causes AOD to remain at a low level, whereas temperature and humidity increase significantly. The wet-stage ends with coldness when it is controlled by cold high pressure again. The atmospheric circulation in the after-stage is similar to that in the before-stage. However, a remarkable feature is that there is a temperature and humidity inversion layer, which results in a significant increase in AOD. This study reveals the physical–optical properties of aerosols during the three stages and the influence mechanism of meteorological factors on aerosols, which can provide a scientific basis for the study of CWW in the future.
1. Introduction
The Guangdong–Hong Kong–Macau Greater Bay Area (GBA) is one of the key national economic development regions in China, which includes nine cities of Guangdong province (Guangzhou, Shenzhen, Zhuhai, Foshan, Huizhou, Dongguan, Zhongshan, Jiangmen and Zhaoqing), as well as two special administrative regions (Hong Kong and Macao). The GBA is often affected by continuous wet weather (CWW) in February and March each year. However, the majority of recent studies overlook the changes in aerosol loadings and properties while focusing solely on the meteorological elements and circulation patterns during CWW [,]. In fact, the GBA has experienced rapid environmental changes in the past two decades. Due to the expansion of human activities, urbanization, and rapidly developing industries, a large number of aerosols with different properties have been found in this region [,]. Thus, the spatiotemporal distributions and physical–optical properties of aerosols in this region have emerged as major environmental concerns.
Aerosols may affect the amount of solar radiation reaching the surface through scattering and absorption, which regulates the radiation budget of the Earth–atmosphere system [,,]. At the same time, aerosols can act as cloud condensation or ice nuclei, changing cloud micro-physical properties and precipitation characteristics; thus, the radiative balance is indirectly affected by aerosol–cloud–radiation interactions [,,,]. Affected by meteorological conditions, emission sources, and many other factors, aerosols vary greatly in composition, size, and spatial and temporal distribution, which leads to major uncertainties in assessing global and regional climate change []. Therefore, studies of aerosol properties and their spatial and temporal distributions are required to accurately assess the effect of aerosols on the climate [].
Aerosol optical depth (AOD) is the integration of atmospheric extinction coefficients in the vertical direction, which reflects the attenuation effect of aerosols on solar radiation [,]. It is an important index for characterizing aerosol concentration []. Many countries around the world already use AOD as a traditional ground-level air quality test and assessment of potential health risks [,]. Several studies have been conducted to obtain ground-level PM2.5 concentrations from columnar AOD measurements in different regions of the world. In Germany, surface PM2.5 concentrations were derived using daily observations of AOD from three satellite sensors and a semi-empirical linear regression method []. In Japan, AOD values have been used to understand the long-term trend in aerosol pollution in the Seto Inland Sea area over the past two decades []. In Iran, the development of a robust statistical model is under way to estimate ground-level PM2.5 concentrations using satellite-derived AOD data []. In terms of acquisition methods, AOD can be retrieved from ground-based sun photometer data and satellite data []. The Aerosol Robotic Network (AERONET) has been established by the National Aeronautics and Space Administration (NASA) to observe the optical properties of aerosols [,]. The accuracy and temporal resolution of ground-based measurements are usually high, but the spatial coverage is low []. Compared with ground-based observation, satellite observation has the advantage of global coverage, and numerous satellite aerosol products have been used to analyze the spatial and temporal characteristics of aerosols [,,]. Studies have shown that satellite products have good performance in detecting aerosol optical properties. Nevertheless, the presence of clouds renders it difficult for the Moderate Resolution Imaging Spectroradiometer (MODIS) to retrieve AOD []; fortunately, this shortcoming can be overcome with reanalysis datasets.
Generally, aerosol hygroscopic growth is also an important aspect affecting its optical properties. The properties and distribution of particles are not only influenced by emission sources but also closely related to meteorological factors such as temperature, wind, and humidity [,,,]. Xu et al. [] used vehicle-borne LiDAR observations to study the influence of meteorological elements on the three-dimensional distribution of particles in the GBA. They found that the horizontal distribution of particles within the boundary layer is closely related to wind speed and direction. Moreover, there are three types of vertical distribution driven mainly by wind field, and they are concentrated near the inversion temperature. Previous studies have classified atmospheric circulation patterns and analyzed the effects of different circulation patterns on local meteorological conditions and aerosol pollution in the Pearl River Delta (PRD) region []. Moreover, Yang et al. [] analyzed the process of a cold front in the GBA. The result showed that when cold air from the north and warm air from the south converge, the development of an inversion layer inhibits the upward diffusion of air pollutants. Meanwhile, weak surface wind speeds and strong downdrafts cause pollutants to stagnate near the surface, which promotes the production of secondary aerosols []. A previous study has found that the values and variance of the average aerosol growth factor gmean and the number fraction NFMH in the PRD region are greater during the pollution period than during the clean period []. In addition, Huang et al. [] quantified the contribution of different atmospheric processes to the formation and accumulation of secondary inorganic aerosols (SIA) and PM2.5 in the PRD region. SIA refers to inorganic particulate matter formed by chemical reactions between atmospheric oxides and acidic substances in the atmosphere. Huang et al. [] also found that emission, aerosol chemistry, and advection transport are important pathways to influence SIA.
Many foregoing studies have discussed the characteristics of aerosols under high relative humidity and different types of atmospheric circulation. However, the examination of the variations in meteorological elements, atmospheric circulation patterns, and aerosol properties during the entire humid period, as well as its precursor and follow-up periods is still lacking. Therefore, a new method of humidity classification and stage classification is used to focus on the variation in meteorological conditions and the spatial–temporal distribution of aerosols and optical characteristics during CWW from 2012 to 2021 in the GBA. The datasets we use are based on the Modern-Era Retrospective analysis for Research and Applications, version 2 (MERRA-2) reanalysis data; the European Center for Medium-Range Weather Forecasts (ERA5) reanalysis data; and Cloud–Aerosol Lidar and Infra-red Pathfinder Satellite Observation (CALIPSO) satellite data. The paper is organized as follows. Section 2 describes the study area, the data, and the method used in this study. Section 3 shows the results and discussion. The conclusions and summary are provided in Section 4.
2. Materials and Methods
2.1. Study Area and Methods
Surrounded by hilly terraces in the east, north, and west, the GBA is located in the south–central part of Guangdong Province, with a vast central plain and low terrain, which is shown in detail in Figure 1a,b. It covers an area of 56,000 square kilometers and has 70 million permanent residents []. The GBA plays a key role in boosting global trade along the land-based Silk Road Economic Belt and the 21st Century Maritime Silk Road.
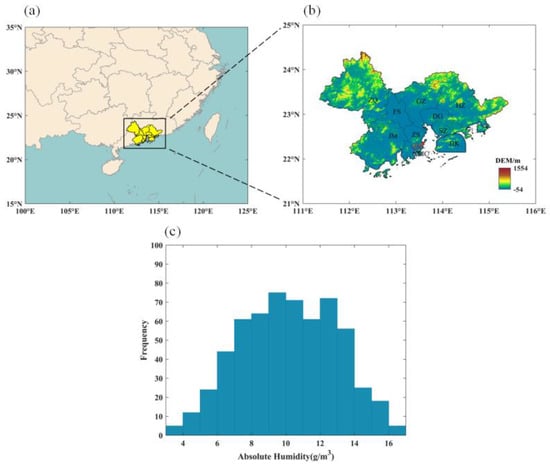
Figure 1.
(a,b) Map of the Guangdong–Hong Kong–Macau Greater Bay Area. (c) The frequency of daily mean absolute humidity values for all study periods.
The GBA nears the South China Sea (SCA) and has a subtropical monsoon climate. During the transition from winter to spring (February and March), the dry and cold air masses from the north gradually weaken, and the warm and humid air currents from the south frequently attack South China, resulting in CWW over the GBA.
In this study, we select 68 CWW processes in the GBA from 2012 to 2021 according to the daily average of absolute humidity. Absolute humidity indicates the mass of water vapor contained in a unit volume of air and not affected by temperature. CWW is characterized by excessive temperatures and humidity, so it is relatively more reasonable to use absolute humidity to distinguish ambient humidity levels []. We take the three days before the occurrence of each process as the before-stage and the three days after the end as the after-stage. All the times mentioned in this study are in Universal Time (UTC). According to the highest absolute humidity in the wet-stage, we divide all processes into three levels: slight, moderate, and heavy humidity. The division is based on the probability density function generated by sorting the daily average of absolute humidity in the study period, as shown in Figure 1c. The frequency of absolute humidity between 60% and 75% and a duration of 9 days is defined as slight humidity (11~12.4 g/m3), between 75% and 90% and a duration of 10 days is defined as moderate humidity (12.4~13.7 g/m3), and more than 90% and a duration of 13 days is defined as heavy humidity (13.7~16.9 g/m3). However, less than 10% and a duration of 4 days is defined as an excellent condition (3.5~6.5 g/m3). The number of samples for each humidity level is shown in Table 1. The calculation of absolute humidity is expressed by Equation (1):
where a is the absolute humidity (g/m3), e is the actual water vapor pressure, T is the temperature (K), and A is equal to 217 [].

Table 1.
The absolute humidity values, number of samples, and duration of CWW at different levels.
2.2. Reanalysis Data
MERRA-2 is a NASA atmospheric reanalysis dataset from 1980. MERRA-2 assimilates data from multiple sources, including observations from MODIS and an Advanced Very-High-Resolution Radiometer (AVHRR), Multi-angle Imaging Spectroradiometer (MISR), and the Aerosol Robotic Network []. MERRA-2 provides information including aerosol data, meteorological fields, ozone, and different types of aerosol properties []. It simulates the sources, sinks, transport and concentration of sulfate (SO4), organic carbon (OC), black carbon (BC), dust (DS), and sea salt (SS) aerosols from the meteorological fields provided by GEOS-5 and emission inventories of different air pollutants, respectively. The data have a good horizontal and vertical distribution [] with a model resolution of 0.5° × 0.625° and 72 layers from the surface to 0.01 hPa. The temporal resolution used is one hour (https://disc.gsfc.nasa.gov/datasets?page=1 (accessed on 20 March 2022)). Here, the AOD of different aerosol types, AE, and aerosol surface mass concentration in February and March from 2012 to 2021 are used. Aerosol surface mass concentration is composed of above five types of aerosols. Based on these, it is possible to estimate the total concentration of PM10 and PM2.5 via Equations (2) and (3) as follows:
ERA5 is the latest reanalysis data from the European Centre for Medium-Range Weather Forecasts (ECMWF) []. The ERA5 data are divided into pressure-level data and single-level data. The data cover the Earth on a 30 km grid and are derived from the atmosphere by using 137 levels from the surface up to a height of 80 km. ERA5 has a high spatial resolution and has also been enhanced in terms of data selection, quality control, bias correction, and performance monitoring techniques [,]. Daily averages of air temperature, wind field, and relative humidity at different vertical pressure levels and horizontal boundary layer height (BLH) data from the ERA5 reanalysis dataset are used to analyze the meteorological conditions and BLH variations (https://cds.climate.copernicus.eu/cdsapp#!/search?type=dataset (accessed on 1 March 2022)).
2.3. Satellite Data
CALIOP is a satellite-based dual-wavelength (532 and 1064 nm) lidar instrument, which can obtain information about the vertical distribution of aerosols and clouds and identify aerosol and cloud types. CALIOP Class 2 4.20 aerosol extinction coefficient profile and Vertical Feature Mask (VFM) products are adopted here: (https://eosweb.larc.nasa.gov/project/CALIPSO (accessed on 20 June 2022)). The horizontal resolution of the data is 5 km, and the vertical resolution is 30 m in the range of 0.5~8.2 km. Because the extinction coefficient and total backscatter coefficient (TBC) at 532 nm in the level 2 data products are obtained from the Level 1 inversion, there are various errors in the conversion process, which eventually lead to the inaccuracy of Level 2 data parameters [,]. Therefore, quality control is performed in this paper to improve the quality and reliability of the data. The following quality control steps were taken:
- (1)
- Extinction quality control (QC) is equal to 0 or 1.
- (2)
- −100 ≤ CAD score ≤ −50.
- (3)
- Extinction Coefficient Uncertainty ≤10.
- (4)
- Atmospheric Volume Description is equal to 3.
- (5)
- Extinction_Coefficient_532 is not equal to −9999.
CAD score is a confidence parameter to distinguish clouds and aerosols in the CALIPSO classification algorithm. CAD score <0 indicates that the information of aerosols is obtained, and the larger the absolute value, the higher the confidence. To avoid the low-confidence aerosol layer that may be caused by detection artifacts, only CAD scores in the interval of −100 to −50 are used in this paper. Extinction Coefficient Uncertainty ≤10 means that the uncertainty of the acquired data is small. Atmospheric Volume Description (AVD) is a 16-bit integer that reflects the category information of the characteristic layer (cloud, aerosol, and no signal) and the confidence level of the discriminative situation in the product data. The 1st–3rd bits of AVD are the feature type, and a value of 3 indicates the aerosol data. In VFM products, aerosols are divided into six subtypes: polluted dust (PD, dust mixed with anthropogenic aerosols), desert dust (DD), polluted continental/smoke (PC/SE), elevated smoke (SE), clean continental (CC, also referred to as clean background), dusty marine (DM, dust mixed with marine aerosol), and clean marine (CM).
3. Results
In this section, we discuss the statistical results of meteorological parameters and aerosols at three stages for different humidity levels in the GBA. The variations in meteorological parameters at different stages are presented in Section 3.1, including temperature, absolute humidity, wind speed, and wind direction. The spatial distribution of AOD and the variation in the extinction coefficient with altitude are given in Section 3.2. Furthermore, Section 3.3 presents the AOD of different aerosol components. Section 3.4 shows the characteristics of these parameters in a case and discusses the impacts of the meteorological conditions on aerosols. The overall framework is shown in Figure 2.
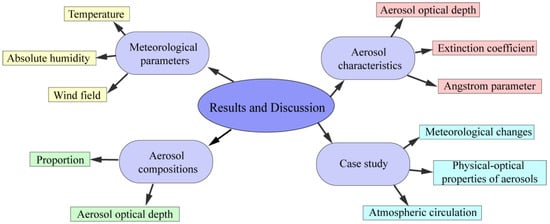
Figure 2.
The content framework of Section 3.
3.1. Changes in Meteorological Parameters
The GBA is located in the subtropical region and is influenced by the Asian monsoon climate. In late winter and early spring, the strength of cold air from the north gradually weakens, and the warm and humid ocean airflow begins to frequently attack South China [], causing the weather to be cloudy and humid. Meteorological conditions dominate the variations in aerosols during CWW. Therefore, investigating the changes in meteorological parameters at different stages is beneficial to the interpretation of the variation in aerosol optical properties.
Figure 3 shows the distribution of 2 m temperature, 10 m wind direction, 10 m wind speed, and 1000 hPa absolute humidity from 2012 to 2021. Here, the results of all meteorological parameters are the average of the samples at different stages. The first column is the before-stage (Figure 3b,e,h), the second column is the wet-stage (Figure 3a,d,g), and the third column is the after-stage (Figure 3c,f,i). Meanwhile, humidity levels are classified as slight humidity (top), moderate humidity (middle), and heavy humidity (bottom), respectively. The results show that the distribution of temperature in all stages is high in the south and low in the north because the central part of the GBA is flat and low-lying, while the east, west, and north are dominated by mountains and hills (Figure 1). The direction of the prevailing wind, which is accompanied by low temperatures, is northeasterly during the before-stage. As one of the main driving forces of aerosol pollution, the intensity and direction of the wind directly affect the speed and direction of pollutant dispersion. The wind speed in the plain and coastal areas of the GBA is relatively high at 3–4 m/s, while that in Huizhou and Zhaoqing is relatively weak because of the terrain barrier. The average value of wind speed in the before-stage is 2.8 m/s. During the wet-stage, under the influence of the warm and humid ocean air currents, the prevailing wind direction is southeast, and the temperature rises rapidly. The higher the humidity level is, the higher the temperature, and the average absolute humidity of heavy humidity can be as high as 16.2 g/m3. The wet-stage ends with the cold high pressure controlling the GBA again. Meanwhile, the wind direction turns northward, and the wind speed becomes larger than the before-stage. Table 2 shows the averaged value of meteorological parameters for all days at different stages.
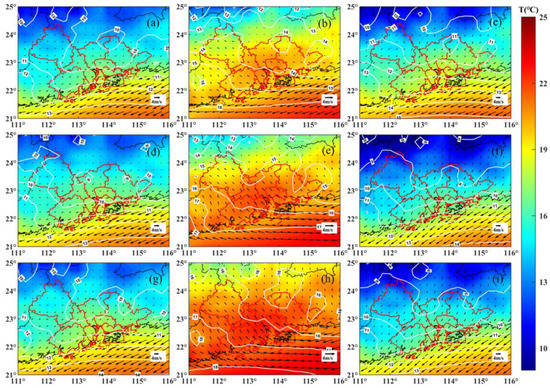
Figure 3.
Spatial distribution of meteorological elements under different stages and levels in February and March from 2012 to 2021. (a–c) Slight humidity, (d–f) moderate humidity, and (g–i) heavy humidity; (a,d,g) before-stage, (b,e,h) wet-stage, and (c,f,i) after-stage.

Table 2.
Variation in the daily average meteorological parameters in different stages and humidity levels.
The vertical variation in meteorological conditions in the three stages of CWW is also significant, as shown in Figure 4, which gives the vertical profiles of temperature, absolute humidity, wind speed, and wind direction for the three humidity levels. In Figure 4a–c, the temperature of the wet-stage within 3 km from the ground is significantly higher than that of the before-stage and after-stage, and this difference decreases with the increase in height. In the after-stage, there is a temperature inversion phenomenon at an altitude of about 1 km. The reason why the phenomenon is not obvious is that the value of each level is averaged by multiple samples. During the wet-stage, the wind direction gradually changes from southeasterly to southwesterly with the increase in height. In the after-stage, the northeasterly flow dominates near the surface, especially in heavy humidity; the sustained height reaches about 1 km; and the wind speed gradually increases from 3 m/s to 5 m/s. At this time, the warm and humid airflow in the wet-stage is lifted and concentrated at a height of about 1.2 km above the ground. Thus, in the after-stage, the absolute humidity gradually decreases from the ground up to 0.5 km, at which point, it inverts and starts to rise until it reaches a peak at approximately 1.2 km and then gradually decreases with the altitude increase.
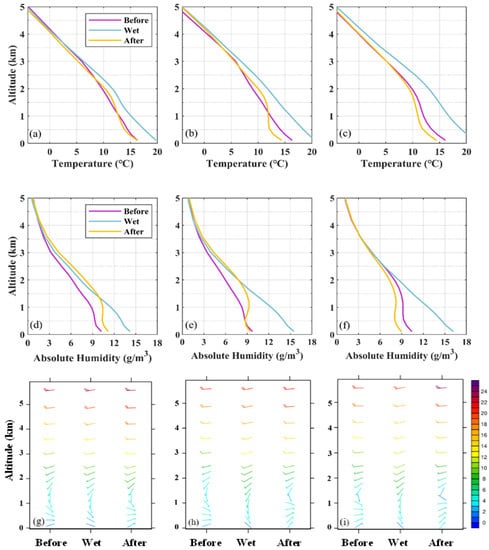
Figure 4.
The average profile of meteorological elements under different stages and levels in February and March from 2012 to 2021. (a,d,g) Slight humidity, (b,e,h) moderate humidity, and (c,f,i) heavy humidity. (a–c) Temperature (°C), (d–f) absolute humidity (g/m3), and (g–i) wind direction and wind speed (m/s).
3.2. Variation in Aerosol Optical Properties
Figure 5a,d,g show the spatial distribution of the mean values of AOD at different humidity levels in the before-stage of the GBA. From the overall view, the change in AOD at different levels is not consistent from the before-stage to the wet-stage. When the humidity is slight (Figure 5a), under the influence of northeasterly airflow, the AOD in the Guangxi area is high, but the effect of the GBA is relatively small, for which the AOD is 0.61. Under moderate humidity (Figure 5d), the value of AOD in the south of China is generally low. Because the northerly wind is weak and is sustained at low altitudes during slight and moderate levels, the low wind speed renders it difficult to drive aerosol particles downstream. However, the effect is more obvious at the heavy level (Figure 5g); the wind is dominated by the northeasterly wind from near the ground to a 540 m height; and the wind speed increases from 2.6 m/s to 4.3 m/s, which is favorable for the transport of northern aerosols. Thus, the AOD is significantly higher than that of the wet-stage over the whole considered surface, which is consistent with the previous study [].
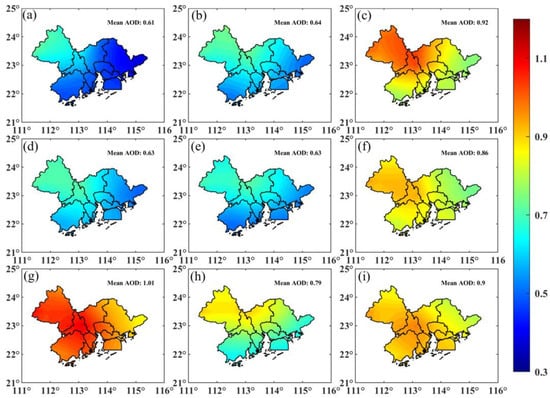
Figure 5.
Spatial distribution of AOD under different stages and levels in February and March from 2012 to 2021. (a–c) Slight humidity, (d–f) moderate humidity, and (g–i) heavy humidity; (a,d,g) before-stage, (b,e,h) wet-stage, and (c,f,i) after-stage.
The wet-stage (Figure 5b,e,h) is influenced by airflow from the ocean, as the prevailing wind direction turns southeast. High values of AOD are concentrated in cities near the middle reaches of the Yangtze River and gradually weaken outward. Aerosols are concentrated mainly in the north, and the ocean airflow is relatively clean, which can effectively clean the polluted air, so the AOD value decreases at this stage. The aerosol surface mass concentration is reduced by 14.9%, 10.9%, and 26.4% in light, moderate, and heavy humidity levels, respectively (Figure 6). In the wet-stage, the increased temperature heats the atmosphere, promoting the instability of the atmospheric layer and accelerating the diffusion of atmospheric pollutants. This helps the diffusion of aerosol particles.
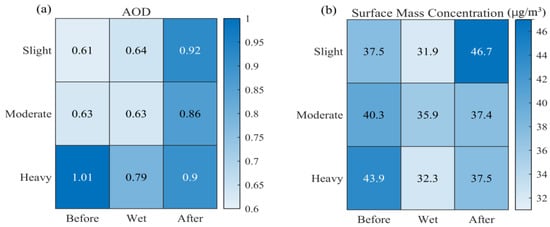
Figure 6.
Daily average of (a) AOD; (b) surface mass concentration under different stages and levels.
Compared with the wet-stage, the AOD in the after-stage increases at different degrees (Figure 5c,f,i), which indicates that a severe aerosol extinction event occurs in the after-stage. Under the influence of northerly airflow and increasing wind speed, aerosols are transported from Hunan and Jiangxi provinces to the west and north of the GBA, which results in the accumulation of aerosols in the downstream and the increase in AOD. The control of the northern cold high pressure replaces the southern warm and humid airflow, and the wet-stage ends with a layer of cooler air at the lower level and a layer of hotter air above the cooler layer. At the point where the two layers overlap, a strong inversion temperature is formed; it is very stable and acts as a cap on the boundary layer, trapping air pollutants within the boundary layer. In terms of distribution, high values of AOD in the before-stage and the after-stage are concentrated in the northwestern part of the GBA, around the Zhaoqing, Foshan, and Guangzhou area []. Overall, the high AOD in the before-stage and after-stage indicates that regional transport has a greater effect on the aerosol under the influence of northeasterly airflow.
The optical properties of aerosols are closely related to meteorological conditions. Meanwhile, BLH is positively correlated with the surface temperature, but negatively correlated with the relative humidity at the surface []. Table 2 shows that the maximum BLH during daytime increases by an average of 54 m from the wet-stage to the after-stage. The lower BLH compresses the aerosol particles into a shallower layer, preventing the vertical diffusion of aerosol particles and leading to an increase in surface aerosol concentration []. However, the aerosol surface mass concentration decreases significantly in the wet-stage. The average value of surface mass concentration is higher in the environment with lower humidity in the before-stage and after-stage, reaching 40.6 and 40.5, respectively (Figure 6b). At the same time, aerosols are prone to hygroscopic growth under a higher RH (Table 2), causing an increase in aerosol extinction [,], but in this study, the AOD value is decreased in the wet-stage. It turns out that the regional transport of aerosols and the negative effects of wind are the main reasons for the severe aerosol pollution in the GBA. Man and Shih [] found that aerosol sources in Hong Kong are mainly due to emissions from the Asian mainland and local sources; air flow from the Asian mainland generally brings higher aerosol concentrations than those from the ocean.
Figure 7 shows the vertical distribution of the aerosol extinction coefficient at different stages. This result is the average of the sample at different stages, for which the before-stage consists of 39 processes and 102 days of data, the wet-stage includes 36 processes and 151 days of data, and the after-stage includes 32 processes and 87 days of data. Because the other time data are not in the study area, the spatial distribution of AOD (Figure 5) and the vertical distribution of aerosols do not represent the same days. The extinction coefficient is an important parameter of aerosol extinction ability, which reflects the load of aerosols in the atmosphere. In the before-stage (Figure 7a,d,g), the surface extinction coefficient reaches a peak value of 0.34 ± 0.25 km−1 in slight humidity. Moreover, the extinction coefficient gradually decreases to the minimum at 1 km, then reaches the second peak value at about 2 km. Obviously, the extinction coefficients decrease significantly with heights below 0.3 km, at which point the maximum value reaches 1.1 km−1. The extinction profile in the wet-stage is similar to that in the before-stage. In the after-stage (Figure 7c,f,i), the high value range of the extinction coefficient occurs in two layers. It is concentrated mainly at 0.2–0.8 km and 2–2.8 km in slight and moderate humidity, while in heavy humidity, the high value is concentrated at 0.3–1.3 km, with the peak extinction coefficient reaching 0.63 km−1.
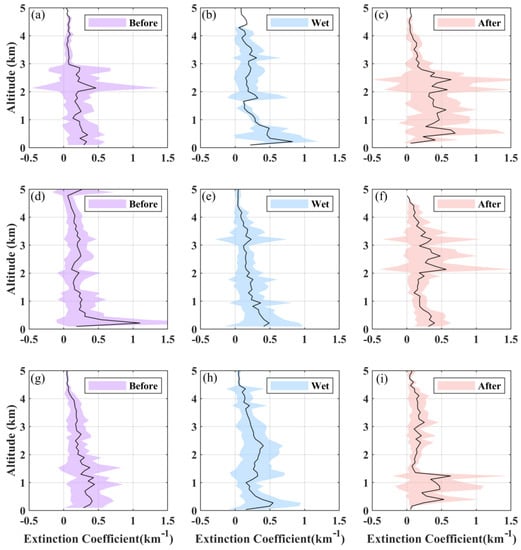
Figure 7.
Extinction coefficient of aerosols under different stages and levels in February and March from 2012 to 2021. (a–c) Slight humidity, (d–f) moderate humidity, and (g–i) heavy humidity; (a,d,g) before-stage, (b,e,h) wet-stage, and (c,f,i) after-stage.
3.3. Optical Thickness and Proportion of Different Aerosol Types
In order to have a deeper understanding of the variations in -AOD over the study region, it is critical to focus on the optical depth of various aerosol compositions and their contributions. In the MERRA-2 aerosol product, aerosol components are classified into five categories: sea salt, sulfate, black carbon, organic carbon, and dust. Here, black carbon and organic carbon are combined into one category of smoke. We calculate the average of each aerosol AOD for all processes at different stages, and then the ratio to the total AOD is the percentage share. Figure 8 shows that the percentage of dust and sea salt in all humidity levels is low at about 2–5%, and the changes are not significant. This trend occurs because there are few sources of dust and sea salt, and because dust and sea salt aerosols react with acidic gases in the atmosphere to produce the corresponding salts, further weakening their own contribution to aerosols. Obviously, sulfate and smoke play a controlling role in AOD, and both of them dominate the increase and decrease in total AOD. Studies have shown that secondary inorganic aerosol (SIA) is the main pollutant in the GBA, and sulfate occupies the main part of SIA []. The percentage of sulfate in the before-stage and after-stage is above 60%, whereas that in the wet-stage decreases. The trend in smoke is opposite to sulfate, especially in the heavy humidity (Figure 8h), as the proportion of sulfate decreases, and the proportion of smoke increases, leading to a 48% contribution of smoke.
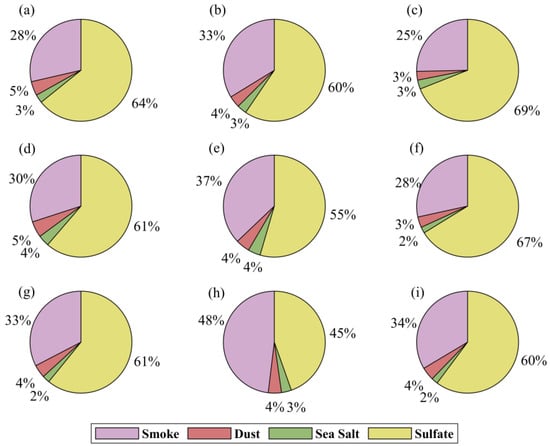
Figure 8.
The AOD proportion of sulfate (yellow), sea salt (green), smoke (purple), and dust (pink) under different stages and levels: (a–c) slight humidity, (d–f) moderate humidity, and (g–i) heavy humidity; (a,d,g) before-stage, (b,e,h) wet-stage, and (c,f,i) after-stage.
Figure 9 compares the AOD variation in four aerosol components. It is obvious that the AOD of sulfate is the highest, which is in line with the changes in total AOD. The average AOD of sulfate reaches 0.61 in the before-stage with heavy humidity (Figure 9d), decreases to 0.35 in the wet-stage, and increases to 0.54 in the after-stage. There are two reasons as follows about the high AOD of sulfate in the before-stage and after-stage, respectively. (1) Under the influence of northeasterly airflow (Figure 3), the regional transport increases the sulfate particles and their precursor concentrations, and the SO42− is generated mainly by the photochemical oxidation of its precursor gas. (2) The absolute humidity in the before-stage and after-stage is higher than the normal level (Table 2), which is beneficial for the aqueous phase oxidation of SO2 in promoting sulfate formation [,]. Smoke (Figure 9a), with the second largest contribution, changes similarly to sea salt. As an important part of smoke, the main sources of organic carbon are motor vehicle emissions, coal combustion emissions, and biomass combustion, etc., and the wind speed is negatively correlated with carbon concentration [,]. In addition, the high temperature and humidity conditions in the wet-stage are conducive to the formation of secondary organic aerosols []. Table 2 shows that the wind speed in the before-stage and the after-stage is higher than in the wet-stage. Thus, in the wet-stage, the AOD of smoke increases to 0.38 in the heavy humidity, while that in the before-stage and after-stage is 0.33 and 0.30. In contrast, the contribution of sea salt is the lowest (Figure 9c), and the AOD value increases during the wet-stage due to the influence of sea salt particles transported from the sea. The average value of sea salt AOD is 0.01–0.03.
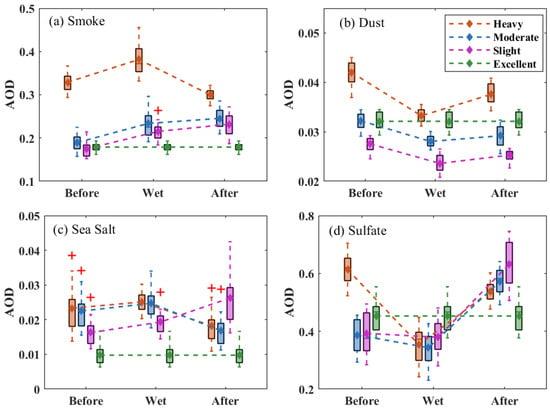
Figure 9.
The AOD of (a) smoke, (b) dust, (c) sea salt, and (d) sulfate under different stages and levels. The diamond represents the average values of AOD. The horizontal lines inside the boxes are the medians, and the bottom and top sides of the boxes represent the first and third quartiles. The whiskers are the minimum (maximum) values within 1.5 interquartile ranges of the lower (upper) quartile. The red plus symbol represents the aberrant points with high values.
3.4. Case Study
To have a comprehensive understanding of the relationship between meteorological factors, atmospheric circulation patterns, and AOD during continuous wet weather, we further discussed a complete development of a continuous 16-day process under a heavy humidity level. This process occurred in Zhuhai city from 8 to 23 March 2021, in which 8 to 10 March was the before-stage, 11 to 20 March was the wet-stage, and 21 to 23 March was the after-stage. We chose the Zhuhai area for two reasons. (1) There are corresponding solar photometer data in Zhuhai Campus of Sun Yat-sen University to verify the accuracy of the data used. (2) The Zhuhai region is characterized by typical urbanization and industrialization. This means that there are different sources and types of aerosols, allowing a better understanding of the influence of different weather conditions on aerosols. We further analyze the optical characteristics of aerosols at different stages in terms of weather conditions, horizontal and vertical wind fields, and vertical temperature fields.
The CWW is cloudy, and the sun photometer observations are missing when there are clouds, but the MERRA-2 data can compensate for this deficiency. To prove the authenticity and validity of MERRA-2 data, we use ground observations to validate MERRA-2 reanalysis products. Feng and Wang [] found that sun photometer observations usually have a high correlation with the AOD retrieved via MERRA-2. Figure 10a shows the correlation between AOD observed by the sun photometer and the MERRA-2 data during the study period. Obviously, the AOD retrieved via MERRA-2 is higher than the corresponding observation; this overestimation has been confirmed in a previous study []. The overestimation may arise because MERRA-2 treats all sulfate aerosols as having the same extinction coefficient and, thus, the same assumed size distribution. Smaller particles are optically more efficient at scattering light compared with larger particles. The correlation R is 0.81 and passes the significance test, so the results based on the MERRA-2 dataset are reliable. Figure 10b shows the daily variation in AOD and AE and the standard deviation for the whole process; it is obvious that the AOD of the before-stage is low, reaching the lowest at 0.52 on 10 March. What is more, the AOD first rises to a peak during the wet-stage, and then quickly drops to a lower level from 14 to 19 March. Meanwhile, the AE reached a maximum value until 20 March, indicating that this stage is dominated by fine particles []. The AOD rapidly increases into the after stage to the highest value of 1.52 on 21 March. In fact, both peaks and valleys of AOD are caused by the rapid increase and decrease in sulfate (Figure 11). In particular, the sulfate AOD reached 0.99 and 0.98 on 13 and 21 March, respectively, accounting for 81% and 64% of the total AOD. From 16 to 20 March, the sulfate AOD drops rapidly to a minimum under the influence of ocean currents, and at this time, smoke accounts for the majority of the total AOD. This further indicates that the trend in sulfate and total AOD is consistent throughout the process, which shows that sulfate plays a controlling role in the changes of AOD.
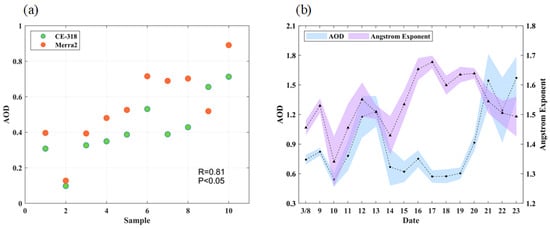
Figure 10.
(a) Scatter plot of AOD from MERRA-2 and sun photometer. (b) Daily variations of AOD and Angstrom Exponent from 8 to 23 March 2021.
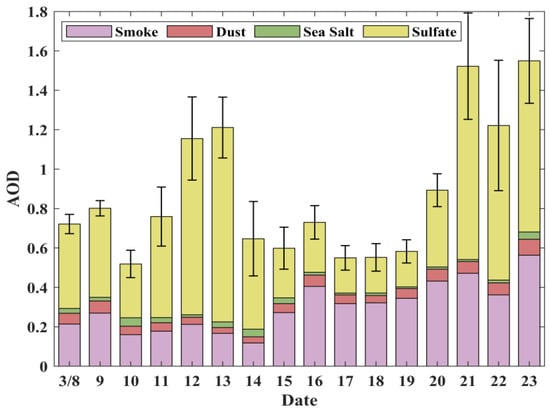
Figure 11.
Daily variations of AOD for smoke, dust, sea salt and sulfate aerosols from 8 to 23 March 2021.
Figure 12 shows the meteorological conditions in this case, including temperature, wind field, and absolute humidity below 500 hPa. It can be seen that the trends of temperature and absolute humidity are similar and decline with increasing height, with the before-stage slightly lower than the wet-stage at the same height (Figure 12a,c). In addition, the prevailing wind direction in the before-stage is an easterly wind below 900 hpa (about 987 m), which changes to northeasterly on 9 March. This is slightly different from the average results of the above statistics, because the average indicates the amount of central tendency in a set of data, and there may be smaller differences in the individual case study. This is because the GBA is influenced by the weak, cold, high-pressure edge on the west coast of Shandong on 8 and 10 March, coupled with the Qin Ling and Mount Wuyi barrier, and it is difficult for airflow to enter the GBA. On 9 March, the new high-pressure center moves down to Shanghai (Figure 13a), and its effect on the GBA is enhanced; thus, AOD is slightly increased. Combined with the backscatter trajectory (Figure 13d), it can be seen that the airflow comes mainly from the northeast coastal area of Zhuhai.
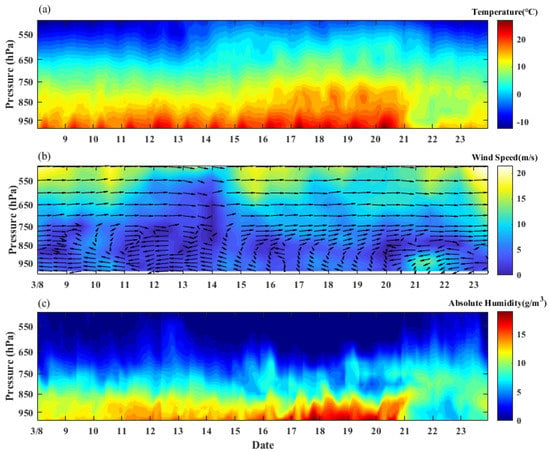
Figure 12.
Variations in meteorological elements at different pressure levels from 8 to 23 March 2021. (a) Temperature (°C), (b) wind direction and wind speed (m/s), and (c) absolute humidity (g/m3).
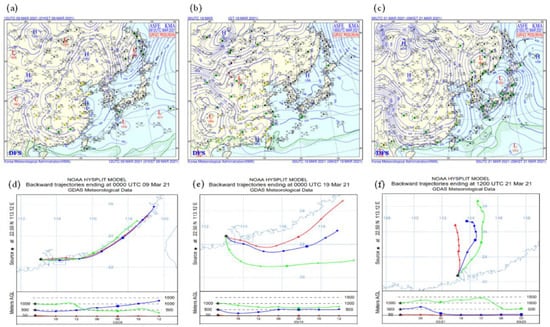
Figure 13.
(a–c) Surface weather maps, (d–f) HYSPLIT 36h backward trajectories on 9, 19, and 21 March 2021 and the pentagram represents Zhuhai region.
In the wet-stage, there is only a small increase in temperature and humidity, and the wind direction is mainly easterly from 11 to 13 March. Given that the wind direction is northeasterly around 12 March, and the wind speed is maintained at about 2.5 m/s below 900 hPa, aerosol diffusion is difficult. Generally, the photochemical reaction is enhanced under relatively high temperature and humidity conditions, which increases air pollution in Zhuhai. From 15 March to the end of the wet-stage, the prevailing wind direction is southeasterly, and the temperature and humidity increase significantly. By this time, the high pressure has moved eastward out to the sea from the eastern coast of China, and a warm low pressure has developed in the northwestern part of the GBA (Figure 13b). The backward trajectory (Figure 13e) suggests that the AOD decreases rapidly during this period due to the influence of clean airflow from the South China Sea.
21 to 23 March is the after-stage; the temperature and humidity drop rapidly during this period. In Figure 13c, we can see that the Huanghuai Region, the Yangtze River, and the South China region are all controlled by the cold high pressure. South China is cloudy and cold, covered by northeasterly winds below 980 m. However, there is a temperature inversion at 775 hPa (about 2.2 km) on 21 and 22 March, and the absolute humidity also becomes larger. This is because the dry and cold airflow in this after-stage lifts the warm and humid ocean airflow in the wet-stage, forming an inversion layer, together with a large regional transport of aerosols from the northern part of the GBA. In Figure 13f, the backward trajectories of the air masses at 500 m and 50 m were from near the ground; the lower air masses also carried particles from the upstream level of the region, which explains the rising AOD.
To further understand the vertical distribution of aerosols under different stages, 8 March (before-stage), 11 March (wet-stage), and 24 March (after-stage) are chosen for this study. The time range of this case is short, and CALIPSO does not have data in the GBA region for the after-stage; thus, 24 March is chosen as the after-stage. Figure 14 shows the aerosol subtype and vertical profiles of the total attenuated backscatter of CALIPSO L1 products at 532 nm, which can directly reflect the distribution of aerosols. There is a small amount of PD and SE at approximately 4 km on 8 March. The thick red line in Figure 14d–f is influenced by clouds. On 11 March, aerosols are distributed mainly at 3–4 km altitude, with backscattering coefficients ranging from 0.002 to 0.01 sr−1 km−1, which indicates heavy aerosol loading here. PD, SE, and PC/SE are the main aerosol subtypes on 24 March, and they concentrate near the 2–3 km altitude. Most of the aerosol subtypes cannot be detected below 2 km due to the influence of clouds, and Figure 14f shows that the aerosol concentrations below 1 km due to the influence of inversion temperature.
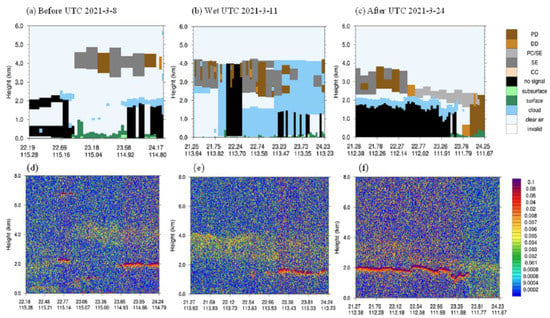
Figure 14.
(a–c) The aerosol subtype, (d–f) CALIPSO 532 nm total attenuated backscatter coefficient on 8, 11, and 24 March 2021.
4. Conclusions
We analyzed the physical–optical properties of aerosols, including the vertical and horizontal distribution characteristics of aerosols and the contributions of different aerosol components in the before-stage, wet-stage, and after-stage in the GBA from 2012 to 2021. The variation mechanism of meteorological and aerosol in the three stages of CWW is further visualized in Figure 15. The conclusions are as follows:
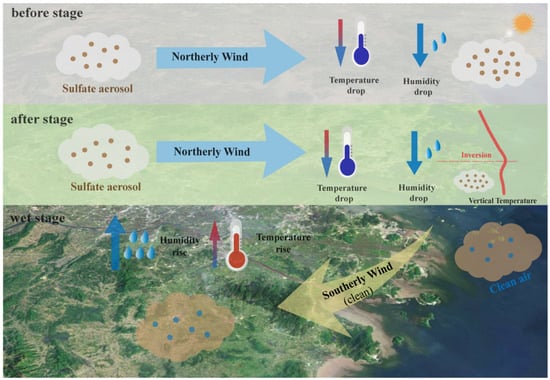
Figure 15.
Conceptual model of meteorological and aerosol changes in the before-stage, wet-stage, and after-stage.
In the before-stage, South China is controlled by cold high pressure from the north; the temperature and humidity are low; and the prevailing wind direction is northeasterly. The GBA is located on the edge of the high pressure. The isobars are relatively sparse, coupled with the barrier between the Qinling and Wuyi Mountains, and the wind speed is maintained at about 2.1–2.4 m/s. Under the influence of northeasterly airflow, the high AOD is related to regional transport and local production. The average value of AOD for the three humidity levels in the before-stage is 0.75, and sulfate occupies the main position with an average proportion of 62%.
With the development of warm low pressure in the northwest of the GBA, the cold high pressure in the north moves eastward out of the sea, and the GBA enters the wet-stage. During this stage, the temperature and humidity both increase significantly, whereas the pressure decreases, and the prevailing wind direction is southeasterly. The average value of AOD decreases to 0.68 under the influence of the oceanic clean airflow. Although the percentage of smoke increases to 39.6%, and the contribution of sulfate decreases in this stage, sulfate is still the main part of AOD.
In the after-stage, the cold high pressure from the north invaded Southern China again. Affected by the cold airflow, the original warm and humid airflow is forced to rise by about 1 km, forming a temperature inversion layer. Moreover, the humidity at high altitudes is higher than that near the ground. Warm and humid conditions are not conducive to aerosol diffusion; the average AOD value reaches 0.89, and the aerosol surface mass concentration is 40.5 μg/m3.
In this study, based on the stage classification and humidity classification we defined, we analyzed the variation in meteorological conditions and aerosols in the before-stage, wet-stage, and after-stage of CWW under different humidity levels. In addition, we discussed the proportion and variation in different aerosol components in different stages. This study could provide new methods for monitoring and predicting aerosol levels in the GBA, particularly during persistently humid weather conditions. In the future, we can perform cluster statistical analysis of the atmospheric circulation patterns at different stages.
Author Contributions
Conceptualization, Y.H.; data curation, J.D.; formal analysis, J.D.; software, Y.Z. (Yuefeng Zhao), Y.Z. (Yurong Zhang) and H.L.; visualization, J.D.; writing—original draft, J.D.; writing—review and editing, Y.H. and T.L. All authors have read and agreed to the published version of the manuscript.
Funding
This research has been supported by the National Natural Science Foundation of China (grant nos. 42027804, 41775026, 41075012, 40805006 and 42271093).
Data Availability Statement
The MERRA-2 reanalysis data are produced by National Aeronautics and Space Administration (NASA) Global Modeling and Assimilation Office (GMAO), from https://disc.gsfc.nasa.gov/datasets?page=1 (accessed on 20 March 2022). The ERA5 reanalysis data are available at https://cds.climate.copernicus.eu/cdsapp#!/dataset/reanalysis-era5-pressure-levels?tab=form (accessed on 1 March 2022). The CALIPSO data are obtained from NASA Langley Research Center Atmospheric Science Data Center through the websites https://eosweb.larc.nasa.gov/project/CALIPSO (accessed on 20 June 2022). The surface weather maps are collected from https://www.weather.go.kr/w/index.do (accessed on 10 September 2022). The sun photometer data are available from the corresponding author.
Acknowledgments
We would like to thank the anonymous reviewers for their useful comments and the editors who provided assistance during the revision. All of them are important in improving this manuscript.
Conflicts of Interest
The authors declare no conflict of interest.
References
- Chen, J.; Xin, J.; An, J.; Wang, Y.; Liu, Z.; Chao, N.; Meng, Z. Observation of aerosol optical properties and particulate pollution at background station in the Pearl River Delta region. Atmos. Res. 2014, 143, 216–227. [Google Scholar] [CrossRef]
- Zhang, H.Y.; Lu, K.D. Impact of Typical Meteorological Conditions on the O3 and PM10 Pollution Episodes in the Pearl River Delta in Autumn. Acta Sci. Nat. Univ. Pekin. 2014, 50, 565–576. [Google Scholar]
- Li, Z.; Xia, X.; Cribb, M.; Mi, W.; Holben, B.; Wang, P.; Chen, H.; Tsay, S.-C.; Eck, T.F.; Zhao, F.; et al. Aerosol optical properties and their radiative effects in northern China. J. Geophys. Res. Atmos. 2007, 112, D22S01. [Google Scholar] [CrossRef]
- Zhou, Y.; Shan, Y.; Liu, G.; Guan, D. Emissions and low-carbon development in Guangdong-Hong Kong-Macao Greater Bay Area cities and their surroundings. Appl. Energy 2018, 228, 1683–1692. [Google Scholar] [CrossRef]
- Charlson, R.J.; Schwartz, S.E.; Hales, J.M.; Cess, R.D.; Coakley, J.A., Jr.; Hansen, J.E.; Hofmann, D.J. Climate Forcing by Anthropogenic Aerosols. Science 1992, 255, 423–430. [Google Scholar] [CrossRef]
- Luo, H.; Han, Y.; Lu, C.; Yang, J.; Wu, Y. Characteristics of Surface Solar Radiation under Different Air Pollution Conditions over Nanjing, China: Observation and Simulation. Adv. Atmos. Sci. 2019, 36, 1047–1059. [Google Scholar] [CrossRef]
- Ningombam, S.S.; Bagare, S.P.; Khatri, P.; Sohn, B.J.; Song, H.J. Estimation of aerosol radiative forcing over an aged-background aerosol feature during advection and non-advection events using a ground-based data obtained from a Prede Skyradiometer observation. Atmos. Res. 2015, 164–165, 76–83. [Google Scholar] [CrossRef]
- Eck, T.F.; Holben, B.N.; Reid, J.S.; Giles, D.M.; Rivas, M.A.; Singh, R.P.; Tripathi, S.N.; Bruegge, C.J.; Platnick, S.; Arnold, G.T.; et al. Fog- and cloud-induced aerosol modification observed by the Aerosol Robotic Network (AERONET). J. Geophys. Res. Atmos. 2012, 117, D07206. [Google Scholar] [CrossRef]
- Li, Z.; Niu, F.; Fan, J.; Liu, Y.; Rosenfeld, D.; Ding, Y. Long-term impacts of aerosols on the vertical development of clouds and precipitation. Nat. Geosci. 2011, 4, 888–894. [Google Scholar] [CrossRef]
- Luo, H.; Han, Y. Impacts of the Saharan air layer on the physical properties of the Atlantic tropical cyclone cloud systems: 2003–2019. Atmos. Chem. Phys. 2021, 21, 15171–15184. [Google Scholar] [CrossRef]
- Twomey, S. The Influence of Pollution on the Shortwave Albedo of Clouds. J. Atmos. Sci. 1977, 34, 1149–1152. [Google Scholar] [CrossRef]
- Hansen, J.; Sato, M.; Ruedy, R.; Lacis, A.; Oinas, V. Global warming in the twenty-first century: An alternative scenario. Proc. Natl. Acad. Sci. USA 2000, 97, 9875–9880. [Google Scholar] [CrossRef]
- Luo, Y.; Zheng, X.; Zhao, T.; Chen, J. A climatology of aerosol optical depth over China from recent 10 years of MODIS remote sensing data. Int. J. Climatol. 2014, 34, 863–870. [Google Scholar] [CrossRef]
- Li, L.; Che, H.; Derimian, Y.; Dubovik, O.; Luan, Q.; Li, Q.; Huang, X.; Zhao, H.; Gui, K.; Zheng, Y.; et al. Climatology of Fine and Coarse Mode Aerosol Optical Thickness over East and South Asia Derived from POLDER/PARASOL Satellite. J. Geophys. Res. Atmos. 2020, 125, e2020JD032665. [Google Scholar] [CrossRef]
- Dasarathy, S.; Kar, J.; Tackett, J.; Rodier, S.D.; Lu, X.; Vaughan, M.; Toth, T.D.; Trepte, C.; Bowman, J.S. Multi-Year Seasonal Trends in Sea Ice, Chlorophyll Concentration, and Marine Aerosol Optical Depth in the Bellingshausen Sea. J. Geophys. Res. Atmos. 2021, 126, e2021JD034737. [Google Scholar] [CrossRef]
- He, J.; Zha, Y.; Zhang, J.; Gao, J. Aerosol Indices Derived from MODIS Data for Indicating Aerosol-Induced Air Pollution. Remote Sens. 2014, 6, 1587–1604. [Google Scholar] [CrossRef]
- Luna, M.A.G.; Luna, F.A.G.; Espinosa, J.F.M.; Belalcazar-Cer’on, L.C. Spatial and temporal assessment of particulate matter using AOD data from MODIS and surface measurements in the ambient air of Colombia. Asian J. Atmos. Environ. 2018, 12, 165–177. [Google Scholar] [CrossRef]
- Lin, C.; Labzovskii, L.D.; Mak, H.W.L.; Fung, J.C.H.; Lau, A.K.H.; Kenea, S.T.; Bilal, M.; Hey, J.D.V.; Lu, X.; Ma, J. Observation of PM2.5 Using a Combination of Satellite Remote Sensing and Low-Cost Sensor Network in Siberian Urban Areas with Limited Reference Monitoring. Atmos. Environ. 2020, 227, 117410. [Google Scholar] [CrossRef]
- Handschuh, J.; Erbertseder, T.; Schaap, M.; Baier, F. Estimating PM2.5 surface concentrations from AOD: A combination of SLSTR and MODIS. Remote Sens. Appl. Soc. Environ. 2022, 26, 100716. [Google Scholar] [CrossRef]
- Itahashi, S.; Sakurai, T.; Shimadera, H.; Araki, S.; Hayami, H. Long-term trends of satellite-based fine-mode aerosol optical depth over the Seto Inland Sea, Japan, over two decades (2001–2020). Environ. Res. Lett. 2021, 16, 064062. [Google Scholar] [CrossRef]
- Sotoudeheian, S.; Arhami, M. Estimating ground-level PM2.5 concentrations by developing and optimizing machine learning and statistical models using 3 km MODIS AODs: Case study of Tehran, Iran. J. Environ. Health Sci. Eng. 2021, 19, 1–21. [Google Scholar] [CrossRef]
- Li, L.; Che, H.; Zhang, X.; Chen, C.; Chen, X.; Gui, K.; Liang, Y.; Wang, F.; Derimian, Y.; Fuertes, D.; et al. A satellite-measured view of aerosol component content and optical property in a haze-polluted case over North China Plain. Atmos. Res. 2022, 266, 105958. [Google Scholar] [CrossRef]
- Che, H.; Xia, X.; Zhu, J.; Li, Z.; Dubovik, O.; Holben, B.; Goloub, P.; Chen, H.; Estelles, V.; Cuevas-Agulló, E.; et al. Column aerosol optical properties and aerosol radiative forcing during a serious haze-fog month over North China Plain in 2013 based on ground-based sunphotometer measurements. Atmos. Chem. Phys. 2014, 14, 2125–2138. [Google Scholar] [CrossRef]
- Holben, B.N.; Tanré, D.; Smirnov, A.; Eck, T.F.; Slutsker, I.; Abuhassan, N.; Newcomb, W.W.; Schafer, J.S.; Chatenet, B.; Lavenu, F.; et al. An emerging ground-based aerosol climatology: Aerosol optical depth from AERONET. J. Geophys. Res. Atmos. 2001, 106, 12067–12097. [Google Scholar] [CrossRef]
- Che, H.; Zhang, X.; Chen, H.; Damiri, B.; Goloub, P.; Li, Z.; Zhang, X.; Wei, Y.; Zhou, H.; Dong, F.; et al. Instrument calibration and aerosol optical depth validation of the China Aerosol Remote Sensing Network. J. Geophys. Res. Atmos. 2009, 114, D03206. [Google Scholar] [CrossRef]
- Ceamanos, X.; Six, B.; Riedi, J. Quasi-Global Maps of Daily Aerosol Optical Depth from a Ring of Five Geostationary Meteorological Satellites Using AERUS-GEO. J. Geophys. Res. Atmos. 2021, 126, e2021JD034906. [Google Scholar] [CrossRef]
- Li, X.; Zhang, C.; Li, W.; Anyah, R.O.; Tian, J. Exploring the trend, prediction and driving forces of aerosols using satellite and ground data, and implications for climate change mitigation. J. Clean. Prod. 2019, 223, 238–251. [Google Scholar] [CrossRef]
- Kaufman, Y.J.; Tanré, D.; Boucher, O. A satellite view of aerosols in the climate system. Nature 2002, 419, 215–223. [Google Scholar] [CrossRef]
- Huang, J.; Arnott, W.P.; Barnard, J.C.; Holmes, H.A. Theoretical Uncertainty Analysis of Satellite Retrieved Aerosol Optical Depth Associated with Surface Albedo and Aerosol Optical Properties. Remote Sens. 2021, 13, 344. [Google Scholar] [CrossRef]
- Chen, X.; Wang, N.; Wang, G.; Wang, Z.; Chen, H.; Cheng, C.; Li, M.; Zheng, L.; Wu, L.; Zhang, Q.; et al. The Influence of Synoptic Weather Patterns on Spatiotemporal Characteristics of Ozone Pollution across Pearl River Delta of Southern China. J. Geophys. Res. Atmos. 2022, 127, e2022JD037121. [Google Scholar] [CrossRef]
- Huige, D.; Siwen, L.; Yun, Y.; Dengxin, H.; Jianyu, W. Observational study of the vertical aerosol and meteorological factor distributions with respect to particulate pollution in Xi’an. Atmos. Environ. 2021, 247, 118215. [Google Scholar] [CrossRef]
- Hu, W.; Zhao, T.; Bai, Y.; Kong, S.; Shen, L.; Xiong, J.; Zhou, Y.; Gu, Y.; Shi, J.; Zheng, H.; et al. Regulation of Synoptic Circulation in Regional PM2.5 Transport for Heavy Air Pollution: Study of 5-Year Observation over Central China. J. Geophys. Res. Atmos. 2022, 127, e2021JD035937. [Google Scholar] [CrossRef]
- Yang, Y.; Yim, S.H.L.; Haywood, J.; Osborne, M.; Chan, J.C.S.; Zeng, Z.; Cheng, J.C.H. Characteristics of Heavy Particulate Matter Pollution Events Over Hong Kong and Their Relationships With Vertical Wind Profiles Using High-Time-Resolution Doppler Lidar Measurements. J. Geophys. Res. Atmos. 2019, 124, 9609–9623. [Google Scholar] [CrossRef]
- Xu, X.; Xie, J.; Li, Y.; Miao, S.; Fan, S. Measurement report: Vehicle-based multi-lidar observational study of the effect of meteorological elements on the three-dimensional distribution of particles in the western Guangdong–Hong Kong–Macao Greater Bay Area. Atmos. Chem. Phys. 2022, 22, 139–153. [Google Scholar] [CrossRef]
- Liu, Y.; He, J.; Lai, X.; Zhang, C.; Zhang, L.; Gong, S.; Che, H. Influence of Atmospheric Circulation on Aerosol and its Optical Characteristics in the Pearl River Delta Region. Atmosphere 2020, 11, 288. [Google Scholar] [CrossRef]
- Yang, X.; Wu, K.; Lu, Y.; Wang, S.; Qiao, Y.; Zhang, X.; Wang, Y.; Wang, H.; Liu, Z.; Liu, Y.; et al. Origin of regional springtime ozone episodes in the Sichuan Basin, China: Role of synoptic forcing and regional transport. Environ. Pollut. 2021, 278, 116845. [Google Scholar] [CrossRef]
- Zhang, D.; Wang, Y.; Feng, Y. Analysis and Forecasting of High-Humidity Weather in Guangdong in February and March. Meteorol. Sci. Technol. 2014, 42, 302–308. [Google Scholar] [CrossRef]
- Tan, H.; Yin, Y.; Gu, X.; Li, F.; Chan, P.W.; Xu, H.; Deng, X.; Wan, Q. An observational study of the hygroscopic properties of aerosols over the Pearl River Delta region. Atmos. Environ. 2013, 77, 817–826. [Google Scholar] [CrossRef]
- Huang, Z.; Ou, J.; Zheng, J.; Yuan, Z.; Yin, S.; Chen, D.; Tan, H. Process Contributions to Secondary Inorganic Aerosols during Typical Pollution Episodes over the Pearl River Delta Region, China. Aerosol Air Qual. Res. 2016, 16, 2129–2144. [Google Scholar] [CrossRef]
- Bi, M.L.; Xie, G.D.; Yao, C.Y. Regional Policies Targeting Residential Solid Fuel and Agricultural Emissions Can Improve Air Quality and Public Health in the Greater Bay Area and Across China. Ecol. Indic. 2020, 116, 106432. [Google Scholar] [CrossRef]
- Nguyen, J.L.; Schwartz, J.; Dockery, D.W. The relationship between indoor and outdoor temperature, apparent temperature, relative humidity, and absolute humidity. Indoor Air 2014, 24, 103–112. [Google Scholar] [CrossRef]
- Reber, E.E.; Swope, J.R. On the Correlation of the Total Precipitable Water in a Vertical Column and Absolute Humidity at the Surface. J. Appl. Meteorol. 1972, 11, 1322–1325. [Google Scholar] [CrossRef]
- Quan, J.; Tie, X.; Zhang, Q.; Liu, Q.; Li, X.; Gao, Y.; Zhao, D. Characteristics of heavy aerosol pollution during the 2012–2013 winter in Beijing, China. Atmos. Environ. 2014, 88, 83–89. [Google Scholar] [CrossRef]
- Gelaro, R.; McCarty, W.; Suarez, M.J.; Todling, R.; Molod, A.; Takacs, L.; Randles, C.; Darmenov, A.; Bosilovich, M.G.; Reichle, R.; et al. The Modern-Era Retrospective Analysis for Research and Applications, Version 2 (MERRA-2). J. Clim. 2017, 30, 5419–5454. [Google Scholar] [CrossRef]
- Randles, C.A.; Da Silva, A.M.; Buchard, V.; Colarco, P.R.; Darmenov, A.; Govindaraju, R.; Smirnov, A.; Holben, B.; Ferrare, R.; Hair, J.; et al. The MERRA-2 Aerosol Reanalysis, 1980—Onward, Part I: System Description and Data Assimilation Evaluation. J. Clim. 2017, 30, 6823–6850. [Google Scholar] [CrossRef]
- Hersbach, H.; Bell, B.; Berrisford, P.; Hirahara, S.; Horányi, A.; Muñoz-Sabater, J.; Nicolas, J.; Peubey, C.; Radu, R.; Schepers, D.; et al. The ERA5 global reanalysis. Q. J. R. Meteorol. Soc. 2020, 146, 1999–2049. [Google Scholar] [CrossRef]
- Albergel, C.; Dutra, E.; Munier, S.; Calvet, J.-C.; Munoz-Sabater, J.; de Rosnay, P.; Balsamo, G. ERA-5 and ERA-Interim driven ISBA land surface model simulations: Which one performs better? Hydrol. Earth Syst. Sci. 2018, 22, 3515–3532. [Google Scholar] [CrossRef]
- Gleixner, S.; Demissie, T.; Diro, G.T. Did ERA5 Improve Temperature and Precipitation Reanalysis over East Africa? Atmosphere 2020, 11, 996. [Google Scholar] [CrossRef]
- Winker, D.M.; Tackett, J.L.; Getzewich, B.J.; Liu, Z.; Vaughan, M.A.; Rogers, R.R. The global 3-D distribution of tropospheric aerosols as characterized by CALIOP. Atmos. Chem. Phys. 2013, 13, 3345–3361. [Google Scholar] [CrossRef]
- Zhang, Y.; Wei, F.; Luo, H.; Su, Y.; Feng, Y.; Huang, Y.; Yang, J.; Wu, Y.; Han, Y. Aerosol Physical-Optical Properties and PBLH Under Different Air Pollution Levels From Ground Lidar and Satellite Observations Over Shouxian Area, China. J. Geophys. Res. Atmos. 2021, 126, e2021JD035236. [Google Scholar] [CrossRef]
- Lu, X.; Chow, K.-C.; Yao, T.; Fung, J.C.H.; Lau, A.K.H. Seasonal variation of the land-sea breeze circulation in the Pearl River Delta region. J. Geophys. Res. Atmos. 2009, 114, D17112. [Google Scholar] [CrossRef]
- Mai, B.; Deng, X.; Xia, X.; Che, H.; Guo, J.; Liu, X.; Zhu, J.; Ling, C. Column-integrated aerosol optical properties of coarse- and fine-mode particles over the Pearl River Delta region in China. Sci. Total Environ. 2018, 622–623, 481–492. [Google Scholar] [CrossRef]
- Li, C.C.; Liu, Q.H.; Mao, J.T. An aerosol pollution episode in Hong Kong with remote sensing products of MODIS and LIDAR. J. Appl. Meteorol. Sci. 2004, 15, 641–650+781. [Google Scholar]
- Im, U.; Markakis, K.; Poupkou, A.; Melas, D.; Unal, A.; Gerasopoulos, E.; Daskalakis, N.; Kindap, T.; Kanakidou, M. The impact of temperature changes on summer time ozone and its precursors in the Eastern Mediterranean. Atmos. Chem. Phys. 2011, 11, 3847–3864. [Google Scholar] [CrossRef]
- Wang, X.; Zhang, R.; Yu, W. The Effects of PM2.5 Concentrations and Relative Humidity on Atmospheric Visibility in Beijing. J. Geophys. Res. Atmos. 2019, 124, 2235–2259. [Google Scholar] [CrossRef]
- Man, C.; Shih, M. Identification of sources of PM10 aerosols in Hong Kong by wind trajectory analysis. J. Aerosol Sci. 2001, 32, 1213–1223. [Google Scholar] [CrossRef]
- Wang, Y.; Wang, Q.; Ye, J.; Yan, M.; Qin, Q.; Prévôt, A.S.H.; Cao, J. A Review of Aerosol Chemical Composition and Sources in Representative Regions of China during Wintertime. Atmosphere 2019, 10, 277. [Google Scholar] [CrossRef]
- Wang, Y.C.; Huang, R.J.; Ni, H.Y.; Chen, Y.; Wang, Q.Y.; Li, G.H.; Tie, X.X.; Shen, Z.X.; Huang, Y.; Liu, S.X.; et al. Chemical composition, sources and secondary processes of aerosols in Baoji city of northwest China. Atmos. Environ. 2017, 158, 128–137. [Google Scholar] [CrossRef]
- Wang, Y.; Hu, M.; Hu, W.; Zheng, J.; Niu, H.; Fang, X.; Xu, N.; Wu, Z.; Guo, S.; Wu, Y.; et al. Secondary Formation of Aerosols Under Typical High-Humidity Conditions in Wintertime Sichuan Basin, China: A Contrast to the North China Plain. J. Geophys. Res. Atmos. 2021, 126, e2021JD034560. [Google Scholar] [CrossRef]
- Yu, H.; Yu, J. Size Distributions of Polycyclic Aromatic Hydrocarbons atTwo Receptor Sites in the Pearl River Delta Region, China: Implications of a Dominant Droplet Mode. Aerosol Sci. Technol. 2011, 45, 101–112. [Google Scholar] [CrossRef]
- Wang, X.; Sheng, G.; Fu, J.; Chan, C.; Lee, C.; Chan, L.; Wang, Z. Urban roadside aromatic hydrocarbons in three cities of the Pearl River Delta, People’s Republic of China. Atmos. Environ. 2002, 36, 5141–5148. [Google Scholar] [CrossRef]
- Chen, T.; Chu, B.; Ma, Q.; Zhang, P.; Liu, J.; He, H. Effect of relative humidity on SOA formation from aromatic hydrocarbons: Implications from the evolution of gas- and particle-phase species. Sci. Total Environ. 2021, 773, 145015. [Google Scholar] [CrossRef]
- Feng, F.; Wang, K. Does the modern-era retrospective analysis for research and applications-2 aerosol reanalysis introduce an improvement in the simulation of surface solar radiation over China? Int. J. Climatol. 2019, 39, 1305–1318. [Google Scholar] [CrossRef]
Disclaimer/Publisher’s Note: The statements, opinions and data contained in all publications are solely those of the individual author(s) and contributor(s) and not of MDPI and/or the editor(s). MDPI and/or the editor(s) disclaim responsibility for any injury to people or property resulting from any ideas, methods, instructions or products referred to in the content. |
© 2023 by the authors. Licensee MDPI, Basel, Switzerland. This article is an open access article distributed under the terms and conditions of the Creative Commons Attribution (CC BY) license (https://creativecommons.org/licenses/by/4.0/).