Abstract
An excellent quantitative evaluation method of SAR de-speckling filters needs to contain a comprehensive evaluation of both noise smoothing and edge preservation. However, most existing evaluation models only evaluate a single aspect, while a few comprehensive indicators lack robustness. For this reason, a novel integrated quantitative evaluation method of de-speckling filters is proposed. The proposed evaluation method is weighted by two sub-indicators: the coherent equivalent number of looks and edge preservation evaluation. The evaluation indicator of the coherent equivalent number of looks is built to evaluate the noise-smoothing ability of de-speckling filters, whereas the indicator of edge preservation evaluation is built to evaluate the edge-preserving performance of filtered image. Six filters with an excellent performance, five real synthetic aperture radar images with three bands, four polarization modes, four resolutions, and five common evaluation indexes were used in the experiment. The experimental results show that the evaluation results of the proposed evaluation method were consistent with the visual effect and other indicators, and its feasibility was verified.
1. Introduction
The synthetic aperture radar (SAR) has developed into an important aerospace, scientific, and technological means of supporting economic construction, environmental monitoring, disaster prevention and control, resource surveys, town planning, and other fields by virtue of its all-weather nature, high resolution, strong penetration, and other observation advantages [1,2,3,4,5,6]. A high-quality SAR image is the most basic and fundamental guarantee for the high-precision implementation of the Earth observation mission of the SAR system. Limited by the SAR imaging system, its image will be scattered with speckles [7,8,9,10]. Although speckles are not theoretical noise, their presence complicates image interpretation [11]. Therefore, de-speckling is a necessary pre-processing step for SAR applications. After nearly half a century of research, scientists have devised a series of filtering models. These filters can be roughly summarized as filtering models based on the spatial domain [12,13], transform domain [14,15], partial differential equations [8,11,16,17,18,19], non-local means [20,21,22,23], and depth learning [24,25].
The ideal filter should only remove noise, without damaging the edge information, which is useful for image interpretation [26]. At present, the speckle filter can not only filter the speckle but also lose the edge details to varying degrees. Therefore, an excellent filter should consider both edge keeping and speckle reduction. To better evaluate whether the filtering model can effectively accomplish the above tasks, objectively evaluating the filtering results is highly necessary. One of the most intuitive and effective strategies is visual evaluation, which makes subjective judgments by comparing the images before and after filtering. Although visual evaluation is efficient and direct, it has drawbacks; for example, it can only be qualitative, it cannot effectively distinguish small edge losses, and it is vulnerable to human subjectivity. Therefore, a quantitative evaluation index should also be introduced to better evaluate the filter.
Typically, quantitative evaluation is based on the noise filtering effect, the performance of edge preservation, and the complexity of the de-speckling method. Counting the duration of an algorithm’s operation is the most direct and effective method of determining its complexity. The commonly used index in the evaluation of noise suppression is the equivalent number of looks (ENL) [27]. ENL describes the noise-smoothing performance of a filter based on the ratio of the mean square to the variance of homogeneous regions. ENL has achieved outstanding noise-smoothing characterization effects; however, ENL also has some setbacks. The noise smoothing improves as the ENL value rises; in this case, the over-smoothing ENL value is higher. Therefore, to judge whether the filtering is too smooth still requires a visual confirmation. Additionally, the homogenous areas required by ENL are often selected manually, without full automation. The speckle suppression index (SSI) [28] is also used to describe noise removal. SSI achieves noise-smoothing evaluation based on the homogeneous region of the image before and after filtering. The core of SSI still uses the relationship between the mean and the variance of homogeneous regions. The adaptive selection of homogeneous regions requires further investigation. Speckle suppression and the mean preservation index (SMPI) [29], which is based on the mean and variance of images before and after filtering, was proposed as a solution to the unreliability of ENL.
In the evaluation of edge preservation, structural similarity (SSIM) [30] is the most commonly used indicator among the structural information to evaluate edge preservation effectively. The edge saving index (ESI) [31] uses the sum of squares of pixel differences in the image neighborhood before and after filtering to evaluate the edge-retaining capability. The detail preservation indices (DPIs) [32] assess the detail preservation based on the ratio image. The edge enhancing index (EEI) [28] uses the edge lines in noisy and filtered images to indicate the edge preservation capability. The feature preserving index (FPI) [28] uses the features of noisy and filtered images. The edge preservation index (EPI) [33] uses a high-pass filtered image to build an edge preservation model. The preceding series of edge preservation models reflects, to some extent, the edge preservation phenomenon of the image before and after filtering.
Of note, the above indicators (edge preservation and noise removal) evaluated the filters separately. As a filter’s performance evaluation focuses on either the noise smoothing effect or the edge preserving effect, while downplaying the effect of the other, it becomes challenging to accurately judge the quality of the filter. Consequently, a filter that comprehensively evaluates edge preservation and noise filtering is essential. Currently, evaluation models based on these two aspects are still lacking. The M-Index [34] is an evaluation index that considers both of the abovementioned aspects. It is evaluated within ratio images, which is the main difference from the standard metrics. However, when a model evaluates the same filtering model multiple times, the evaluation results are often inconsistent. Although this does not affect the relative relationship between the result and the multiple filtering models in a single evaluation, its robustness still needs to be enhanced. Based on this, a novel integrated quantitative evaluation method (IQEM) of a de-speckling filter is proposed here. The proposed IQEM consists of two sub-indicators: the coherent equivalent number of looks (CENL) and edge preservation evaluation (EPE), which effectively reflect the noise-smoothing and edge-preserving performance.
2. Materials and Methods
2.1. Common Evaluation Indexes of De-Speckling Filters
The most prevalent evaluation models of speckle suppression algorithms are currently the evaluation of the noise suppression effect, the evaluation of the performance of edge preservation, and the evaluation of the algorithm complexity. The evaluation index of the algorithm complexity is primarily based on the algorithm time consumption statistics, which will not be further discussed in this article.
ENL is the index for evaluating speckle reduction, and its model is as follows:
where and denote the mean and variance, respectively, and denotes a homogeneous region.
There are two points regarding the use of ENL: first, the homogeneous area, which has the same pixel information throughout the region, is generally set manually; second, there is no absolute ideal value of ENL. A higher ENL value means more noise reduction.
SSI is also an evaluation index that focuses on the effect of noise reduction, and its model is as follows:
where the definitions of and are the same as those in Equation (1), and and denote the noisy and filtered images, respectively. The SSI also acts on homogeneous areas, and its value is less than 1. A smaller SSI value means more noise reduction.
SSIM is a widely used index in the evaluation of edge preservation, and its model is as follows:
where the definitions of , , , and are the same as those in Equation (2), and and are constants. A larger SSIM value means a better edge-preservation effect.
ESI is also used to reflect the edge-keeping performance of the filter, and its model is as follows:
where and denote the real and filtered SAR images, respectively, denotes the image area used in the calculation, and denote the pixel position. A higher ESI value means a better edge-keeping effect.
The M-Index focuses on the evaluation of both speckle reduction and edge preservation, which can be modeled as follows:
where is modeled for reflecting the noise reduction, and is modeled for edge keeping. Their specific models are seen in [34]. The optimal M-Index is zero.
2.2. Proposed Integrated Quantitative Evaluation Method
2.2.1. Adaptive Selection of Homogeneous Regions
The standard method for evaluating speckle reduction is to evaluate the smoothness of homogeneous areas. In most cases, homogeneous regions are set manually, which partially reflects the adaptation of the evaluation algorithm. Therefore, a homogenous region-adaptive selection (HRAS) strategy was proposed for the evaluation of speckle removal.
Homogeneous regions are those where each pixel has the same value. Due to the inherent speckle, there is no absolute equivalence in the same area. Therefore, when determining homogeneous regions in SAR images, regions with the same attributes are theoretically classified as homogeneous regions. The pixel values may not be the same in this area, but there are no apparent differences. As shown in Figure 1a,c, it is considered a homogeneous and a heterogeneous region, respectively.
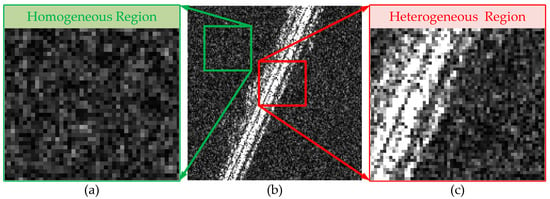
Figure 1.
Homogeneous and heterogeneous regions. (a,c) are the local enlarged images of (b) original SAR image.
Figure 1 shows that the pixel difference is still the main feature used to distinguish homogeneous regions from heterogeneous regions. Therefore, an adaptive selection of a homogeneous region is proposed by constructing a pixel difference characteristic function. The specific model is as follows:
where denotes the adaptive homogeneous region selection factor of the i-pixel rectangle, denotes the neighborhood pixel rectangle of the i-pixel rectangle, is a constant, , and and denote mean filtering and its mean value, respectively.
The value of the adaptive homogeneous region selection factor of each pixel can be obtained by Equation (6). The higher the factor , the higher the possibility of a homogeneous region. Moreover, only the appropriate threshold needs to be set to filter out homogeneous areas, as follows:
where denotes the i-th homogeneous region, and 1 and 0 denote homogeneous and heterogeneous regions, respectively.
Notably, the selection of this homogeneous region only serves the evaluation of noise removal; therefore, it is not necessary to obtain every homogeneous region. To ensure the homogeneity of the selected regions, it is recommended to set the threshold to a larger value (such as a value higher than 0.9) to ensure that more heterogeneous regions are screened out.
2.2.2. Coherent ENL
The ENL can reflect the speckle-smoothing effect in homogeneous areas. However, in practice, the adverse effects of over-smoothing cannot be fully reflected. This is because the ENL of the over-smoothed filtered image is often at a high value, which is considered a good noise-smoothing effect. However, over-smoothing is not a good filtering result. Therefore, it is necessary to further optimize the use of ENL.
Speckles, widely considered to be a type of multiplicative noise, can be modeled as follows:
where denotes a noisy image, denotes true images, and denotes speckles.
For a homogeneous region, we assume that all pixel values in homogeneous regions have the same fixed value. The noise model of the homogeneous region is thus updated as follows:
where denotes the homogeneous region of the noisy image, and and denote the same fixed value and speckle in a homogeneous region.
Simultaneously, we assume that the homogeneous region of the noisy image is perfectly filtered, forming the following filtered image:
where denotes the homogeneous region of the filtered image; the definition of can be seen in Equation (9).
Then, the ratio image can be obtained by:
where denotes the homogeneous region of the ratio image, and the definitions of other symbols can be found above.
Next, the ENL value of the homogeneous region is calculated as follows:
where the definitions of all symbols can be found above.
According to Equation (12), it can be found that the ENL values of the noisy image and ratio image are theoretically the same for homogeneous regions. Therefore, the difference in the ENL between noisy and ratio images can effectively reflect the filtering effect.
It is often accidental to only use one homogeneous region for obtaining the ENL difference between the noisy and ratio images and reflecting the filtering quality. Generally, many homogeneous regions are used for filtering quality evaluation, which bring more reasonable and reliable results. In this article, a series of homogeneous regions can be obtained adaptively by the proposed HRAS strategy. Based on the many extracted homogeneous regions, a coherent ENL method is proposed, which can be modeled as follows:
where denotes the number of homogeneous regions obtained by the proposed HRAS strategy, denotes the i-th homogeneous region, is the constant ensuring that the two parts of the CENL are on the same order of magnitude, and the definitions of other symbols can be found above.
Equation (13) is further explained here. In Equation (13), the proposed CENL is mainly composed of two parts in the form of addition, which is very different from the traditional ENL. In traditional ENL, the used homogenous regions mainly come from the filtered images. In the proposed CENL, the selected homogeneous regions are not only from filtered images but also from noisy and ratio images.
As mentioned earlier, the difference in the ENL values obtained from the homogeneous region of the noisy and ratio images can be used as a work to judge the quality of filtering. The difference measurement, in a sense, is also the similarity measurement. Coherence is an effective measurement tool for measuring the similarity between two regions. Therefore, the first part of CENL is mainly based on the coherence of the ENL obtained from multiple homogeneous regions of the noisy and ratio images. If the speckle is perfectly filtered, the ENL obtained from all homogeneous regions of the noisy and ratio images will be identical; thus, the obtained coherence is 1, and the first part of CENL is 0. Conversely, the more CENL deviates from 0, the worse the de-speckling effect.
The second part of CENL also includes the calculation of the ENL of the homogeneous regions of the filtered image. This is not completely consistent with the traditional ENL. The larger the traditional ENL is, the better the noise filtering effect is. In the second part of the proposed CENL, the result that tends to zero shows a better filtering effect, which can be consistent with the results of the first part of CENL. In addition, when there is an ideal value of 0, it can be easier to judge the degree of its tendency to 0, which better reflects the filtering performance than traditional ENL. Overall, the proposed CENL can effectively reflect the filtering performance, and its ideal value is 0.
2.2.3. Edge Preservation Evaluation by Multi-Information Fusion
Edge preservation is another important aspect of SAR filter evaluation. The edge information in SAR images is usually complex and commonly uses single-model indicators. A novel edge preservation evaluation (EPE) method using multi-information fusion is thus proposed.
The proposed EPE includes three aspects of subdivision evaluation, including radiation retention, structure retention, and edge point retention, and it can be modeled as follows:
where , , and denote the radiation retention, structure retention, and edge point retention, respectively.
In radiation retention, the main consideration is to maintain the consistency of the amplitude value or intensity value of the image before and after filtering. The consistency can also be called similarity. An effective similarity criterion is proposed in the PPB [21] filter, which is modeled as follows:
where and are two compared amplitude values.
Based on the above model, we can substitute the pixel values of the noisy and filtered images into Equation (15) to form a new effective radiation similarity measurement model. In order to better highlight the radiation similarity effect of local areas, the noisy and filtered images are first divided into n parts in newly forming the radiation similarity measurement model. Then, the radiation information of each regional block image was combined, forming the following model:
where denotes the number of divided regions and denotes the range of the i-th area participating in the radiation information calculation; the definitions of other symbols can be found above.
In structure retention, the similarity criterion (see Equation (15)) is also determined as the basic framework. The structure is defined as the difference between pixels and their neighboring pixels in this paper. Therefore, the difference maintenance between the pixels and the neighboring pixels is mainly used here to reflect the structure retention. Pixel region segmentation, such as radiation similarity, was also performed first. Then, the pixel difference between the regions is used to express the structural attributes of the region. The specific model is as follows:
where denotes the number of divided regions. In each divided region, 5 × 5 pixel windows are defined. and denote the pixel position in the 5 × 5-pixel windows. denotes the Gaussian distance weighted value, denotes the range of the h-th pixel window in each divided region, and the definitions of other symbols can be found above.
In edge point retention, the number of edge points before and after filtering is also expected. Canny detection [35] can accomplish this well. In addition, the similarity criterion (see Equation (15)) is still selected as the basic framework. Therefore, the edge point similarity is constructed based on the noisy and filtered images using Canny detection. The specific model is as follows:
where denotes the number of edges by the canny detection method [35], and the definitions of other symbols can be found above.
2.2.4. Proposed IQEM
The proposed IQEM results from the joint action of edge preservation and noise suppression. The specific model is as follows:
The specific steps are as follows (Algorithm 1):
| Algorithm 1 IQEM |
| Input: Noisy and filtered SAR images |
| Initialization: Set and Adaptively select homogeneous regions by Equations (6) and (7) |
| Calculate the CENL by Equation (13) |
| Calculate the EPE by Equations (14), (16)–(18) |
| Calculate the IQEM by Equation (19) |
| Output: The IQEM of the filtered SAR image |
2.3. Experimental Data
Five real SAR images were selected in the evaluation experiments, as shown in Figure 2. These SAR images include three bands, four polarization modes, and four resolutions, as listed in Table 1.

Figure 2.
(a) GF-3, (b) TerraSAR-X, (c) Sentinel-1, (d) RadarSAT-2, and (e) ALOS-2.

Table 1.
Parameters of selected real SAR images.
2.4. Experimental Filters and Evaluation Methods
There are many existing filters, and it is impossible to use all of them in this experiment. This is because the focus of this experiment was not on the filters but on the evaluation of the filter results. Therefore, this experiment focused on the various algorithms’ most common and classic filters. The SRAD [16], DPAD [17], EnLee [12], PPB [21], SAR-BM3-D [14], and FANS [15] filters were selected for this experiment. The parameters setting of each de-speckling filter is the same as that in the original literature.
The evaluation method selected in this experiment focused on noise removal and edge preservation. The time complexity was not considered in this experiment. Regarding noise removal, ENL and SSI indicators were selected, and ESI and SSIM indicators were selected for edge preservation. The M-Index has the above two performance aspects; thus, it was also selected. For specific models of the above five indicators, see Section 2.1.
3. Results
3.1. Experiment on the Adaptive Selection of Homogeneous Regions
An experiment on the adaptive selection of homogenous regions was first carried out. In the experiment, the proposed model (Equations (6) and (7)) was utilized to extract the homogeneous regions of SAR images, as shown in Figure 2. In this experiment, the threshold was set to 0.9. The experimental results are shown in Figure 3. The quantity and accuracy of the homogeneous regions selected are shown in Table 2.
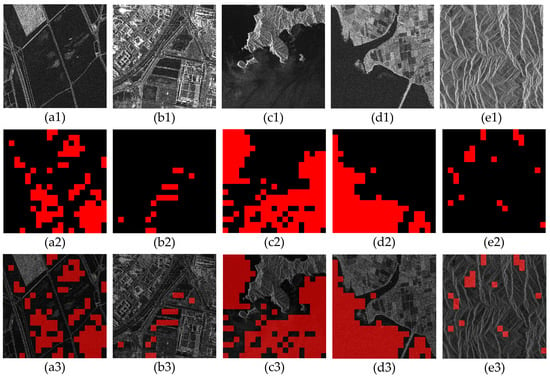
Figure 3.
(a1) GF-3, (b1) TerraSAR-X, (c1) Sentinel-1, (d1) RadarSAT-2, (e1) ALOS-2. (a2–e2) are the homogeneous region images automatically selected using (a1–e1). (a3–e3) are the composite images of the original images and the homogeneous region images.

Table 2.
Quantity and accuracy of selected homogeneous regions.
The adaptive extraction of homogeneous regions for five real SAR images achieved good results, as shown in Figure 3. The proposed strategy effectively extracted a certain number of homogenous regions and manually compared and checked these homogenous regions. The extracted homogenous regions were all actual homogenous regions without false detection, and the accuracy rate was 100%, as shown in Table 2. Notably, the missed detection rate was not examined in this study because homogeneous region detection only serves for algorithm evaluation, and it is not necessary to obtain all homogeneous regions.
3.2. Experiment on the Evaluation of the De-Speckling Filter
Next, the experiments on the evaluation of the filters were performed. First, the de-speckling operation was performed using the selected filters in Section 2.4, and then the filtered images were evaluated.
3.2.1. Evaluation Experiment of the GF-3 Filtered Image
The filtered GF-3 SAR images are shown in Figure 4. The ratio images are shown in Figure 5. The results of the index evaluation are seen in Table 3.
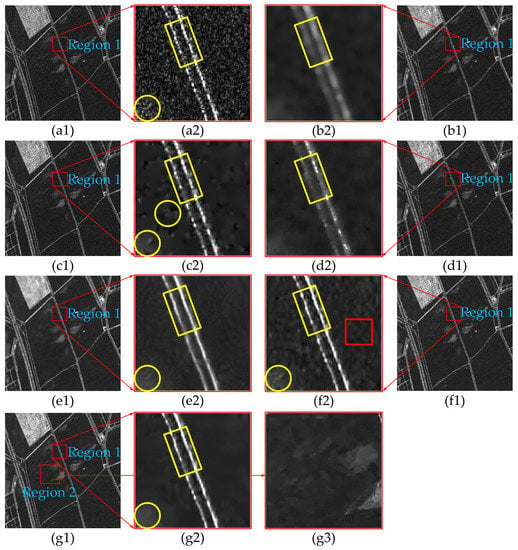
Figure 4.
(a1) Noisy GF-3 SAR image. Filtered images by (b1) SRAD filter, (c1) DPAD filter, (d1) EnLee filter, (e1) PPB filter, (f1) SAR-BM3-D filter, and (g1) FANS filter. (a2–g2) are the enlarged images of region 1 from (a1–g1). (g3) is the enlarged image of region 2 from (g1).
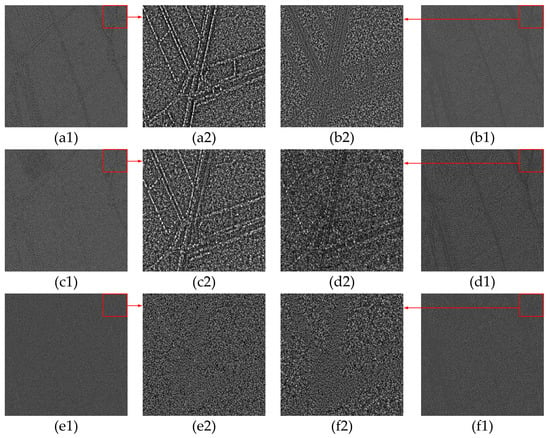
Figure 5.
Ratio images by noisy GF-3 SAR image and the (a1) SRAD, (b1) DPAD, (c1) EnLee, (d1) PPB, (e1) SAR-BM3-D, and (f1) FANS filtered images. (a2–f2) are the enlarged images of the red rectangle from (a1–f1).

Table 3.
Index evaluation of the GF-3 SAR image.
Considering noise removal, evidently, several filters have effectively smoothed the noise, among which SRAD exhibited over-smoothing [Figure 3(b2)], while the smoothing effects of DPAD and SAR-BM3-D were slightly poorer than those of the other filters. The DPAD-filtered image had a significant uneven phenomenon in local areas [Figure 3(c2)], whereas the SAR-BM3-D-filtered image lacked smoothness in local areas [Figure 3(f2)]. Better noise-reducing phenomena appeared in the FANS-, PPB-, and EnLee-filtered images, of which the FANS-filtered image was the best [Figure 3(g2)]. This was also demonstrated by the indicators. For ENL and SSI, the FANS filter had the best performance, while the DPAD and SAR-BM3-D filters had poor performance. In the proposed IQEM, its component CENL plays the role of evaluating noise smoothing. As can be seen from Table 3, the FANS filter performs the best in CENL, followed by the PPB, SRAD, EnLee, SAR-BM3-D, and DPAD filters. The above performance is similar to the ENL and SSI indicators, as well as the visual results, which verifies that the proposed IQEM has an effective ability to evaluate noise smoothing.
Regarding edge preservation, the yellow rectangles in Figure 4 indicate that the SRAD and EnLee filters performed poorly. In contrast, other filters perform significantly better than the SRAD and EnLee filters. As shown in Figure 4(g3), there were many false edges in the image after FANS filtering. In the ratio image shown in Figure 4, the residual edges of the SRAD and EnLee filters were the highest, and the residual edges of the SAR-BM3-D filter was almost invisible. For ESI and SSIM, the SAR-BM3-D filter performed the best, and the proposed EPE index was consistent with the two abovementioned indexes in terms of performance. In terms of the worst performance, the proposed EPE and SSIM indicators were consistent and showed that the SRAD filter performed the worst, which is due to the SRAD over-smoothing phenomenon that led to more edge loss. This is also consistent with the performance of the ratio image. The proposed EPE index demonstrates that the PPB filter’s edge retention impact is second only to that of the SAR-BM3-D filter, which is compatible with the ESI index. The EPE and SSIM indexes indicate that the FANS filter’s performance is inferior to that of the PPB and DPAD filters, which is consistent with the fact that FANS-filtered images process more erroneous edges. Overall, the suggested EPE indicators are congruent with the ESI and SSIM indicators, as well as the real state of affairs. Therefore, the above phenomenon verifies that the proposed IQEM has the effective ability to evaluate edge preservation.
The above analysis effectively verifies that the proposed IQEM has the abilities of edge preservation and noise suppression. However, better edge preservation and noise smoothing do not often occur with the same filter. A single evaluation index cannot accurately evaluate the filter. Therefore, it is necessary to consider both for an effective evaluation. In the proposed IQEM, the PPB, FANS, and SAR-BM3-D filters performed significantly better than the other filters, which can be verified by visual inspection. Among the PPB, FANS, and SAR-BM3-D filters, the PPB filter performed the best in the IQEM. This can also be visually verified. Compared with the PPB-filtered image, a local undersmoothing phenomenon (Figure 4(f2)) and local pseudo-textures (Figure 4(g3)) appeared in the SAR-BM3-D- and FANS-filtered images, respectively. In all of the selected filters, the SRAD filter performed the worst in the IQEM, which is consistent with the over-smoothing phenomenon (Figure 4(b2)) and the serious edge loss (Figure 5(a2)) in large areas. Figure 5(c2) shows that EnLee filter had the same serious edge loss as the SRAD filter, which is also reflected in the IQEM. In the IQEM, the EnLee filter was the second-worst performer. In the DPAD-filtered image, a significant uneven phenomenon (Figure 4(c2)) also made the DPAD filter perform poorly in the IQEM. In general, the proposed IQEM performance was consistent with the actual situation, and its effectiveness was verified in GF-3 SAR image experiments.
3.2.2. Evaluation Experiment of TerraSAR-X-Filtered Images
The filtered TerraSAR-X SAR images are shown in Figure 6. The ratio images are shown in Figure 7. The results of the index evaluation are shown in Table 4.
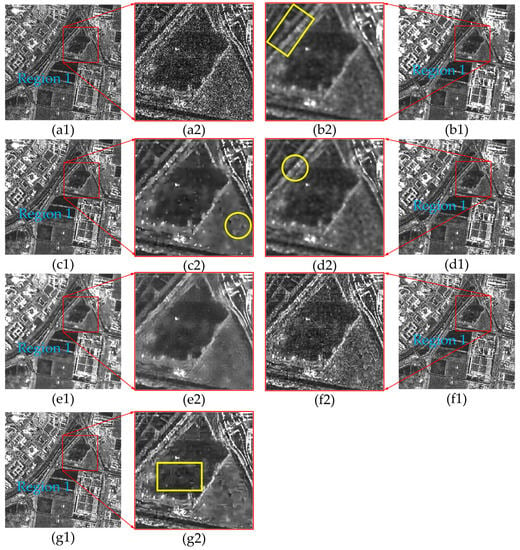
Figure 6.
(a1) Noisy TerraSAR-X SAR image. Filtered images by the (b1) SRAD filter, (c1) DPAD filter, (d1) EnLee filter, (e1) PPB filter, (f1) SAR-BM3-D filter, and (g1) FANS filter. (a2–g2) are the enlarged images of region 1 from (a1–g1).
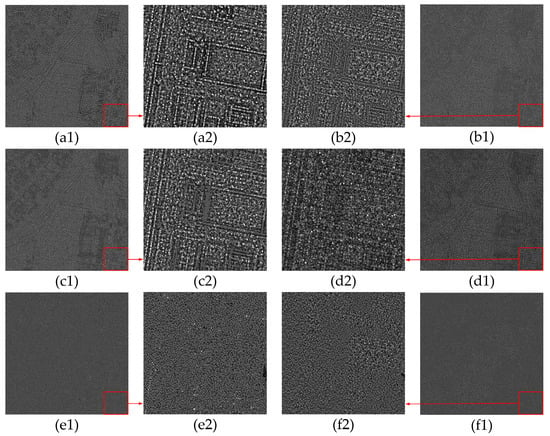
Figure 7.
Ratio images by noisy TerraSAR-X SAR image and the (a1) SRAD, (b1) DPAD, (c1) EnLee, (d1) PPB, (e1) SAR-BM3-D, and (f1) FANS filtered images. (a2–f2) are the enlarged images of the red rectangle from (a1–f1).

Table 4.
Index evaluation of the TerraSAR-X SAR image.
Visually, the PPB, EnLee, and SRAD filters exhibited better speckle smoothing than the other filters (Figure 6), among which the SRAD and EnLee filters performed poorly in terms of edge preservation (Figure 7(a2,c2)). The certain degree of edge loss was caused by over-smoothing. This can be verified by indicators. In ENL and SSI, the PPB, EnLee, and SRAD filters performed better than the other filters, and the EnLee and SRAD filters performed the worst in ESI and SSIM among the six selected filters. The same phenomenon appeared in the proposed CENL and EPE indexes. As can be seen in Table 4, PPB performed the best in CENL, and the SRAD and EnLee filters performed the worst in EPE. In EPE, the SAR-BM3D and FANS filters performed the best, which is consistent with the phenomenon of edge loss (Figure 7(e2,f2)). The above analysis effectively verifies that the proposed IQEM has the ability of edge preservation and noise suppression. Overall, the PPB filter performed the best, while the SRAD and DPAD filters performed the worst. In the proposed IQEM, the PPB filter performed the best, followed by the SAR-BM3-D and FANS filters, and the SRAD and DPAD filters performed the worst, which is consistent with the visual inspection. In general, the proposed IQEM performance was consistent with the actual situation, and its effectiveness was verified in the TerraSAR-X SAR image experiment.
3.2.3. Evaluation Experiment of the Sentinel-1-Filtered Image
The filtered Sentinel-1 SAR images are shown in Figure 8. The ratio images are shown in Figure 9. The results of the index evaluation are shown in Table 5.
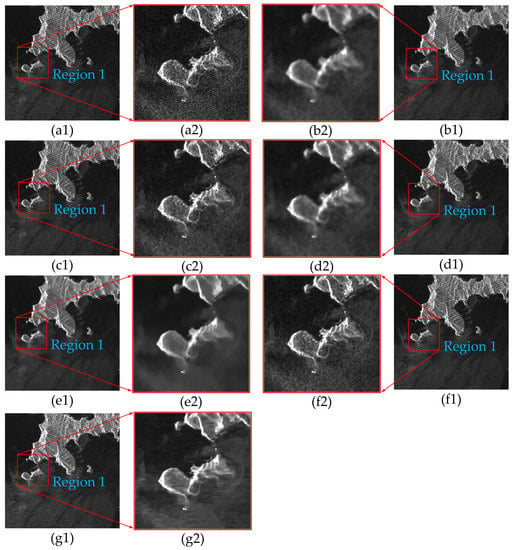
Figure 8.
(a1) Noisy Sentinel-1 SAR image. Filtered images by the (b1) SRAD filter, (c1) DPAD filter, (d1) EnLee filter, (e1) PPB filter, (f1) SAR-BM3-D filter, and (g1) FANS filter. (a2–g2) are the enlarged images of region 1 from (a1–g1).
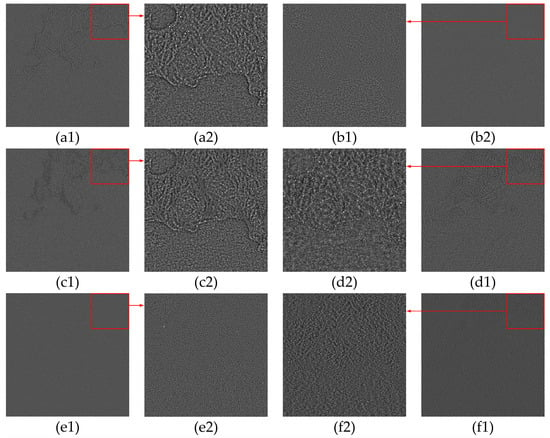
Figure 9.
Ratio images by noisy Sentinel-1 SAR image and the (a1) SRAD, (b1) DPAD, (c1) EnLee, (d1) PPB, (e1) SAR-BM3-D, and (f1) FANS filtered images. (a2–f2) are the enlarged images of the red rectangle from (a1–f1).

Table 5.
Index evaluation of the Sentinel-1 SAR image.
Visually, Figure 8 and Figure 9 indicate that, among the six filters, the PPB, SRAD, and EnLee filters had a better noise-smoothing effect; the SAR-BM3-D and DPAD filters had a better edge retention effect. This can be verified by the ENL, SSI, and SSIM indexes. In the proposed IQEM, the PPB and SAR-BM3-D filters performed the best in CENL and EPE, respectively. In the FANS-filtered image, some horizontal false textures can be clearly found in Figure 8(g2), which also leads to its poor performance in EPE. Regarding EPE, the SAR-BM3-D filter had the best performance, which is also consistent with the performance of the ESI and SSIM indicators. Concomitantly, the PPB, EnLee, SRAD, and FANS filters performed relatively poorly in the EPE results, which was consistent with the SSIM index. The above analysis effectively verifies that the proposed IQEM has the abilities of edge preservation and noise suppression. In the comprehensive indicators, the proposed IQEM showed that the PPB filters still maintained the best performance, which was more consistent with the actual phenomenon. In general, the proposed IQEM performance was consistent with the real situation, and its effectiveness was verified in the Sentinel-1 SAR image experiment.
3.2.4. Evaluation Experiment of the RadarSAT-2-Filtered Image
The filtered RadarSAT-2 SAR images are shown in Figure 10. The ratio images are shown in Figure 11. The results of the index evaluation are shown in Table 6.
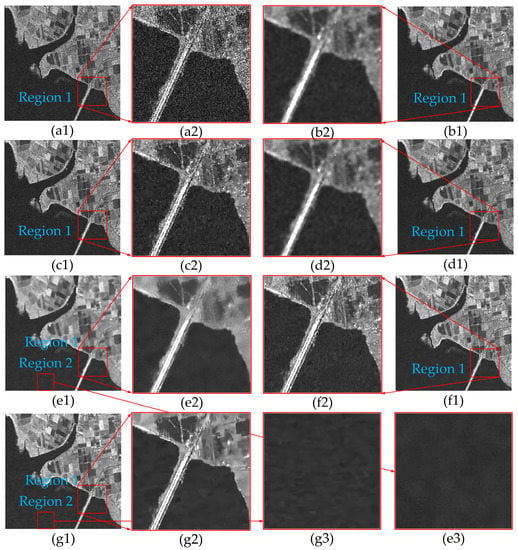
Figure 10.
(a1) Noisy RadarSAT-2 SAR image. Filtered images by the (b1) SRAD filter, (c1) DPAD filter, (d1) EnLee filter, (e1) PPB filter, (f1) SAR-BM3-D filter, and (g1) FANS filter. (a2–g2) are the enlarged images of region 1 from (a1–g1). (e3,g3) are the enlarged images of region 2 from (e1–g1).
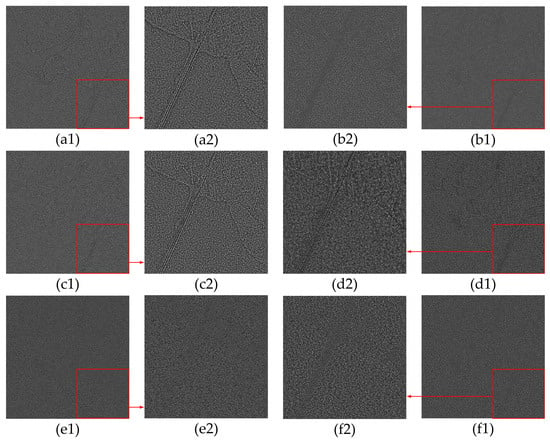
Figure 11.
Ratio images by noisy RadarSAT-2 SAR image and the (a1) SRAD, (b1) DPAD, (c1) EnLee, (d1) PPB, (e1) SAR-BM3-D, and (f1) FANS filtered images. (a2–f2) are the enlarged images of the red rectangle from (a1–f1).

Table 6.
Index evaluation of the RadarSAT-2 SAR image.
As shown in Figure 10, the SRAD filter still had over-smoothing, while the DPAD filter still had local non-smoothing. SAR-BM3-D was better than DPAD in terms of noise smoothing; however, there was still an insufficient smoothing effect. The FANS, PPB, and EnLee filters were relatively effective for noise smoothing. In terms of edge preservation, SRAD and EnLee performed relatively poorly, whereas SAR-BM3-D performed relatively well.
In terms of indicators, FANS performed the best in CENL, followed by the PPB, SRAD, EnLee, SAR-BM3-D, and DPAD filters, which is consistent with the ENL and SSI indicators. Regarding EPE, the SAR-BM3-D filter performed the best, while the EnLee and SRAD filters performed relatively poorly, which is consistent with the ESI and SSIM indicators. The above analysis effectively verifies that thr proposed IQEM has the ability of edge preservation and noise suppression. Visually, both PPB and FANS had good overall comprehensive de-speckling effects. Further observation shows that the FANS filter has a slight false texture (Figure 10(g3)) that the PPB filter does not have (Figure 10(e3)). For comprehensive indicators, the PPB and FANS filters had similar performances in IQEM, among which the PPB filter had slight advantages, while the SRAD filter had the worst result, which is consistent with the actual situation. In general, the proposed IQEM performance was consistent with the real situation, and its effectiveness was verified in RadarSAT-2 SAR image experiments.
3.2.5. Evaluation Experiment of the ALOS-2-Filtered Image
The filtered ALOS-2 SAR images are shown in Figure 12. The ratio images are shown in Figure 13. The results of the index evaluation are seen in Table 7.
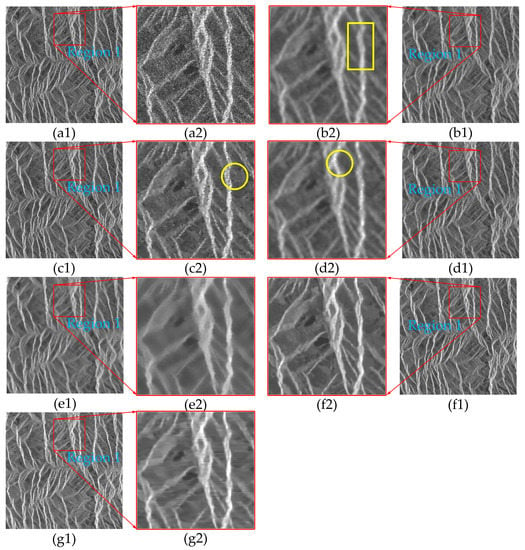
Figure 12.
(a1) Noisy ALOS-2 SAR image. Filtered images by the (b1) SRAD filter, (c1) DPAD filter, (d1) EnLee filter, (e1) PPB filter, (f1) SAR-BM3-D filter, and (g1) FANS filter. (a2–g2) are the enlarged images of region 1 from (a1–g1).
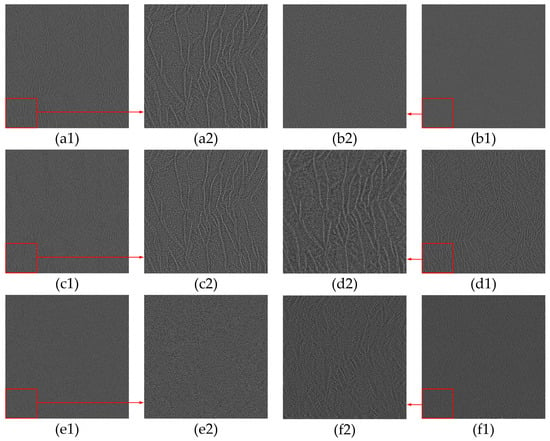
Figure 13.
Ratio images by noisy ALOS-2 SAR image and the (a1) SRAD, (b1) DPAD, (c1) EnLee, (d1) PPB, (e1) SAR-BM3-D, and (f1) FANS filtered images. (a2–f2) are the enlarged images of the red rectangle from (a1–f1).

Table 7.
Index evaluation of the ALOS-2 SAR image.
As can be seen from Figure 12, the DPAD filter performed poorly in terms of the smoothing effect, while the other selected filters had a relatively excellent smoothing effect. However, the SRAD-filtered image still had an over-smoothing phenomenon (Figure 12(b2)). Regarding edge preservation, the DPAD, SAR-BM3-D, and FANS filters had relatively good visual effects (Figure 13(b2,e2,f2)).
CENL was consistent with ENL and SSI in terms of indicators, indicating that the PPB filter had the best performance and the DPAD filter had the worst performance. Regarding EPE, the SAR-BM3-D and DPAD filters performed the best, which is consistent with the results of SSIM and ESI. The above analysis effectively verifies that the proposed IQEM has the abilities of edge preservation and noise suppression. Visually, the SAR-BM3D filter had a good overall comprehensive de-speckling effect. In the comprehensive evaluation, the SAR-BM3D filter performed the best in both the M-Index and the proposed IQEM, which is consistent with reality. In general, the proposed IQEM performance was consistent with the actual situation, and its effectiveness was verified using ALOS-2 SAR image experiments.
4. Discussion
In the experiments, the homogenous region adaptive selection and filter evaluation effectively verified the effectiveness of the proposed method. In the adaptive selection of the homogeneous regions experiment, the selected homogeneous regions were all real homogeneous regions because of how the weights were set. The smaller the weight, the more homogeneous the regions determined. This also increases the probability of heterogeneous regions. In the experiment, the weight value was set to 0.9 (more than 0.9 is recommended), which could broadly screen out heterogeneous regions. This also implies that the experiment cannot extract all the homogeneous regions. To extract all the homogeneous regions, a more reasonable weight value must be set. However, notably, because homogeneous regions only serve the proposed CENL index evaluation, the algorithm evaluation does not need to process all homogeneous regions. Therefore, the robust investigations carried out in this study can be used as a basis for further studies.
The algorithm evaluation’s experimental results validated the proposed method’s effectiveness. The results of the proposed CENL, ENL, and SSI indicators were virtually identical. This is also because the three indicators were all processed for the same homogeneous region, and their core parameters were related to ENL. Regarding edge evaluation, the proposed EPE index was consistent with the overall performance of ESI and SSIM. However, some evaluating algorithms’ differences were caused by the complexity of edges and the differences between various algorithms. In general, the EPE indicators proposed in this study were consistent with actual situations. In the comprehensive evaluation, the effectiveness of the proposed IQEM had also been well verified in experiments.
One limitation of our study is that the algorithm evaluation conducted here did not consider the algorithm’s complexity. Future studies should investigate the complexity of the algorithm to further improve the comprehensiveness of the evaluation algorithm.
5. Conclusions
Speckle suppression is the first task in SAR imaging applications. A good evaluation of speckle suppression will aid in the subsequent application of SAR image interpretation. Based on this, an integrated quantitative evaluation method (IQEM) of a de-speckling filter was proposed. The proposed IQEM is based on CENL and EPE, which better evaluates speckle smoothing and edge keeping. To validate the proposed algorithm effectively, six filtering results from five real SAR images were evaluated. The evaluation results effectively verify the feasibility of the IQEM. Additionally, in the process of CENL evaluation, a homogenous region-adaptive selection strategy was proposed, and its feasibility was also verified experimentally.
Author Contributions
Conceptualization, F.G.; methodology, F.G.; software, F.G.; validation, C.S. and N.S.; formal analysis, X.M.; investigation, C.S.; resources, W.L.; data curation, W.L.; writing—original draft preparation, F.G.; writing—review and editing, F.G.; visualization, F.G.; supervision, F.G.; project administration, F.G.; funding acquisition, F.G. and W.L. All authors have read and agreed to the published version of the manuscript.
Funding
This research was funded by the National Natural Science Foundation of China (grant numbers 62101219 and 62201232), the Natural Science Foundation of Jiangsu Province (grant numbers BK20210921 and BK20201026), and the Science Foundation of Jiangsu Normal University (grant number 20XSRS008).
Conflicts of Interest
The authors declare no conflict of interest.
References
- Guo, H.D.; Wu, W.J.; Zhang, K.; Li, X.W. New Generation SAR for Earth Environment Observation. Acta Geod. Et Cartogr. Sin. 2022, 51, 862–872. [Google Scholar]
- Jin, Y.Q. Microwave Remote Sensing and Its Development in China. J. Microw. 2020, 36, 1–6. [Google Scholar]
- Ding, C.B.; Qiu, X.L.; Wu, Y.R. Concept, System, and Method of Holographic Synthetic Aperture Radar. J. Radars 2020, 9, 399–408. [Google Scholar]
- Ma, X.S.; Wu, P.H. Polarimetric Radar Image Despeckling by Iteratively Refined Nonlocal Means. Acta Geod. Et Cartogr. Sin. 2019, 48, 1038–1045. [Google Scholar]
- Liu, S.Q.; Lei, Y.; Pang, J.; Zhao, S.H.; Su, Y.G.; Sun, C.Y. SAR Image Denoising on Generative Adversarial Networks. J. Hebei Univ. (Nat. Sci. Ed.) 2022, 42, 306–313. [Google Scholar]
- Yang, X.Z.; Ye, M.; Zhou, F.; Lang, W.H.; Zheng, X.; Li, G.Q. Speckle Reduction for PolSAR Images Using Hybird Features Similarity. Acta Electron. Sin. 2016, 44, 2583–2591. [Google Scholar]
- Zhang, C.; Zhang, Z.; Deng, Y.; Zhang, Y.; Chong, M.; Tan, Y.; Liu, P. Blind Super-Resolution for SAR Images with Speckle Noise Based on Deep Learning Probabilistic Degradation Model and SAR Priors. Remote Sens. 2023, 15, 330. [Google Scholar] [CrossRef]
- Guo, F.C.; Zhuo, C.C.; Liu, W.S.; Liu, Z.H. Pixel Difference Function and Local Entropy-Based Speckle Reducing Anisotropic Diffusion. IEEE Trans. Geosci. Remote Sens. 2022, 60, 5229516. [Google Scholar] [CrossRef]
- Ma, X.S.; Wu, P.H.; Shen, H.F. A Nonlinear Guided Filter for Polarimetric SAR Image Despeckling. IEEE Trans. Geosci. Remote Sens. 2019, 57, 1918–1927. [Google Scholar] [CrossRef]
- Liu, S.Q.; Gao, L.L.; Lei, Y.; Wang, M.H.; Hu, Q.; Ma, X.L.; Zhang, Y.D. SAR Speckle Removal Using Hybrid Frequency Modulations. IEEE Trans. Geosci. Remote Sens. 2021, 59, 3956–3966. [Google Scholar] [CrossRef]
- Zhang, G.; Guo, F.C.; Zhang, Q.J.; Xu, K.; Jia, P.; Hao, X.Y. Speckle Reduction by Directional Coherent Anisotropic Diffusion. Remote Sens. 2019, 11, 2768. [Google Scholar] [CrossRef]
- Lee, J.S.; Wen, J.H.; Ainsworth, T.L.; Chen, K.S.; Chen, A.J. Improved Sigma Filter for Speckle Filtering of SAR Imagery. IEEE Trans. Geosci. Remote Sens. 2009, 47, 202–213. [Google Scholar]
- Fatnassi, S.; Yahia, M.; Ali, T.; Mortula, M.M. SAR Speckle Filtering Using Hybrid NonLocal Sigma Filter. In Proceedings of the 2021 18th International Multi-Conference on Systems, Signals & Devices (SSD), Monastir, Tunisia, 22–25 March 2021. [Google Scholar]
- Parrilli, S.; Poderico, M.; Angelino, C.V.; Verdoliva, L. A Nonlocal SAR Image Denoising Algorithm Based on LLMMSE Wavelet Shrinkage. IEEE Trans. Geosci. Remote Sens. 2012, 50, 606–616. [Google Scholar] [CrossRef]
- Cozzolino, D.; Parrilli, S.; Scarpa, G.; Poggi, G.; Verdoliva, L. Fast Adaptive Nonlocal SAR Despeckling. IEEE Geosci. Remote Sens. Lett. 2014, 11, 524–528. [Google Scholar] [CrossRef]
- Yu, Y.; Acton, S.T. Speckle Reducing Anisotropic Diffusion. IEEE Trans. Image Process. 2002, 11, 1260–1270. [Google Scholar] [PubMed]
- Aja-Fernandez, S.; Alberola-Lopez, C. On the Estimation of the Coefficient of Variation for Anisotropic Diffusion Speckle Filtering. IEEE Trans. Image Process. 2006, 15, 2694–2701. [Google Scholar] [CrossRef]
- Guo, F.C.; Zhang, G.; Zhang, Q.J.; Zhao, R.S.; Deng, M.J.; Xu, K.; Jia, P.; Hao, X.Y. Fusion Despeckling based on Surface Variation Anisotropic Diffusion Filter and Ratio Image Filter. IEEE Trans. Geosci. Remote Sens. 2020, 58, 2398–2411. [Google Scholar] [CrossRef]
- Guo, F.C.; Zhang, G.; Zhang, Q.J.; Zhao, R.S.; Deng, M.J.; Xu, K. Speckle Suppression by Weighted Euclidean Distance Anisotropic Diffusion. Remote Sens. 2018, 10, 722. [Google Scholar] [CrossRef]
- Buades, A.; Coll, B.; Morel, J.-M. A Non-Local Algorithm for Image Denoising. In Proceedings of the 2005 IEEE Computer Society Conference on Computer Vision and Pattern Recognition (CVPR’05), San Diego, CA, USA, 20–25 June 2005; Volume 2, pp. 60–65. [Google Scholar]
- Deledalle, C.A.; Denis, L.; Tupin, F. Iterative Weighted Maximum Likelihood Denoising with Probabilistic Patch-Based Weights. IEEE Trans. Image Process. 2009, 18, 2661–2672. [Google Scholar] [CrossRef]
- Ma, X.S.; Wu, P.H.; Shen, H.F. Multifrequency Polarimetric SAR Image Despeckling by Iterative Nonlocal Means Based on a Space-Frequency Information Joint Covariance Matrix. IEEE J. Sel. Top. Appl. Earth Obs. Remote Sens. 2019, 12, 274–284. [Google Scholar] [CrossRef]
- Pepe, A. A 3D Space-Time Non-Local Mean Filter (NLMF) for Land Changes Retrieval with Synthetic Aperture Radar Images. Remote Sens. 2022, 14, 5933. [Google Scholar] [CrossRef]
- Ma, X.S.; Wang, C.; Yin, Z.X.; Wu, P.H. SAR Image Despeckling by Noisy Reference-based Deep Learning Method. IEEE Trans. Geosci. Remote Sens. 2020, 58, 8807–8818. [Google Scholar] [CrossRef]
- Liu, S.Q.; Lei, Y.; Zhang, L.Y.; Li, B.; Hu, W.M.; Zhang, Y.D. MRDDANet: A Multiscale Residual Dense Dual Attention Network for SAR Image Denoising. IEEE Trans. Geosci. Remote Sens. 2021, 60, 5214213. [Google Scholar] [CrossRef]
- Zhu, L.; Han, T.Q.; Shui, P.L.; Wei, J.H.; Gu, M.H. An Anisotropic Diffusion Filtering Method for Speckle Reduction of Synthetic Aperture Radar Images. Acta Phys. Sin. 2014, 63, 179502. [Google Scholar]
- Oliver, C.; Quegan, S. Understanding Synthetic Aperture Radar Images; Artech House: Boston, MA, USA, 1998. [Google Scholar]
- Sheng, Y.; Xia, Z. A comprehensive evaluation of filters for radar speckle suppression. In Proceedings of the Geoscience and Remote Sensing Symposium, 1996. IGARSS ‘96. ‘Remote Sensing for a Sustainable Future’, International, Lincoln, NE, USA, 31–31 May 1996. [Google Scholar]
- Shamsoddini, A.; Trinder, J.C. Image Texture Preservation in Speckle Noise Suppression. In Proceedings of the ISPRS Technical Commission VII Symposium—100 Years ISPRS, Vienna, Austria, 5–7 July 2010; Volume 2010, pp. 239–244. [Google Scholar]
- Wang, Z.; Bovik, A.C.; Sheikh, H.R.; Simoncelli, E.P. Image Quality Assessment: From Error Visibility to Structural Similarity. IEEE Trans. Image Process. 2004, 13, 600–612. [Google Scholar] [CrossRef] [PubMed]
- Zhang, W.G.; Liu, F.; Jiao, L.C. SAR Image Despeckling via Bilateral Filtering. Electron. Lett. 2009, 45, 781–783. [Google Scholar] [CrossRef]
- Li, G.T.; Wang, C.L.; Huang, P.P.; Yu, W.D. SAR Image Despeckling Using a Space-Domain Filter with Alterable Window. IEEE Geosci. Remote Sens. Lett. 2013, 10, 263–267. [Google Scholar]
- Sattar, F.; Floreby, L.; Salomonsson, G.; Lovstrom, B. Image Enhancement Based on A Nonlinear Multiscale Method. IEEE Trans. Image Process. 1997, 6, 888–895. [Google Scholar] [CrossRef]
- Gomez, L.; Ospina, R.; Frery, A. Unassisted Quantitative Evaluation of Despeckling Filters. Remote Sens. 2017, 9, 389. [Google Scholar] [CrossRef]
- Canny, J. A Computational Approach to Edge Detection. IEEE Tarans. Pattern Anal. Mach. Intell. 1986, 8, 679–698. [Google Scholar] [CrossRef]
Disclaimer/Publisher’s Note: The statements, opinions and data contained in all publications are solely those of the individual author(s) and contributor(s) and not of MDPI and/or the editor(s). MDPI and/or the editor(s) disclaim responsibility for any injury to people or property resulting from any ideas, methods, instructions or products referred to in the content. |
© 2023 by the authors. Licensee MDPI, Basel, Switzerland. This article is an open access article distributed under the terms and conditions of the Creative Commons Attribution (CC BY) license (https://creativecommons.org/licenses/by/4.0/).