Abstract
The coastal domain of central western Sicily is characterized by the presence of rocky coasts, which mainly consist of pocket beaches situated between bedrock headlands that constitute ecological niches of great touristic and economic value. In this peculiar morphodynamic system, the sedimentary contributions are mainly derived from the rockfall that affects the back of nearby cliffs or the sediment supply of small streams that flow into it. In this study, we investigated the geomorphological processes and related landforms that contribute to the evolution of a pocket beach area located in a coastal sector of NW Sicily Island. The cliffs in this are affected by several rockfalls, and deposits from these rockfalls also add to the rate of sedimentary contribution. The analysis was conducted through the application of traditional approaches and contemporary methods that have previously been used to forecast the collection of input data in the field, often under difficult conditions due to the accessibility of the sites, and which have been supported by UAV surveys. Through the analysis of the digital models of terrain and orthophotos, geometrical and multitemporal analyses of landforms were carried out. A dedicated software was utilized for the detection of rockfall runout zones and block trajectories and for defining the automatic extraction of rock mass discontinuities. The data were compared with those derived from traditional geomechanical surveys. The availability of the existing and acquired remote sensing data proved essential for this study for both defining the reference geological model and for performing the site-specific analysis of rockfall.
1. Introduction
The northwestern coastal sector of Sicily is distinguished by its high environmental, economic, historical, and cultural value, as well as its subsequent elevated urbanization and population density.
From a geological point of view, this area is a piece of the complex mosaic of the central Mediterranean zone. It results from the northward advance of the African plate toward Europe, which coincides with a sector of the Sicilian–Maghrebian chain that is linked to the Tyrrhenian extensional area by means of the northern Sicily continental margin [1]. The resulting geological and structural settings of both the terrestrial and submarine areas have determined the present morphology of the coastal zone, which is constantly evolving depending on climatic and sea-level changes along the Mediterranean coasts [2,3], seismic activity, and anthropic pressure. It is also affected by several geological hazards such as coastal erosion [4,5], terrestrial and submarine landslides [6,7,8,9], and tsunamis [10]. Within this coastal domain, there are various beach types. Each beach type is characterized by different dynamics and morphosedimentary features, and there is a prevailing presence of rocky coasts. This grouping mainly consists of steep coastal watersheds and pocket beaches situated between bedrock headlands. Geological hazards along rocky coasts are linked to processes (produced by meteorological, oceanographic, and geological forces) of rapid sediment transfer directly from the slopes to the sea at intermittent time intervals. Landslide activity plays a predominant role in terms of sediment contribution and its impact on communities, both settled and seasonal [11]. In particular, the “pocket-shaped” beaches are limited by natural headlands with steep rocky sides where the sedimentary contributions are generally derived from the weathering and rockfall that affect the backs of nearby cliffs or the sediment supply of small streams that flow into it (autochthonous genesis). In some cases, the sediments in these coastal landforms are derived from exceptional storms or tsunamis that bring sediments into the bay which cannot be removed by ordinary wave action, or from sediments produced by the overflooding of a nearby river, changing the original shape of the bay and favoring its “invasion” by external sediments, as described by the BESS project (Pocket Beach Management and Remote Surveillance System) [12]. BESS is a project that provides a specific tool for the management of pocket beaches, including our study area. Pocket beaches can be composed of a mix of sediments, such as boulders, pebbles, sand, and mud, and their evolution depends on wave forcing and morphological characteristics [13]. Due to their morphology, these beaches are protected from wave attacks. For this reason, they are often used as harbors and for recreation. Thus, the stability of these beaches is also important for the safe development of local economies [14]. The rocky coasts, therefore, stand out due to their complex geomorphological process interactions. The understanding of the mechanisms that shape these dynamic landscapes and the mapping of the geohazards in these areas are often difficult to define due to the complex interactions between geomorphological processes and because of the conditions of accessibility to the sites. In this regard, with respect to landslide mapping and monitoring and geomorphological investigations, remote surveying methodologies are growing in practice for both the possibility of surveying wide areas in a short time and to overcome problems regarding accessibility [15]. Among these techniques, unmanned aerial vehicles (UAVs) are widely used to collect data on landslide conditions and activity at different scales relating to different typologies of phenomena as they can capture thermal, hyperspectral, and light detection and ranging (LiDAR) imagery [16,17,18,19,20]. Their typical outputs are high-resolution imagery digital elevation models (DEMs) and photogrammetric models that use structure from motion (SfM) techniques to reconstruct 3D structures from 2D images, permitting the evaluation of geometric features, areal extent, failure surfaces, kinematics, and surface morphology. In the context of applications in rockfall stability studies, the availability of a well-georeferenced, 3D rock mass model has made it possible to extract the direction of exposed planes, which is useful for remote structural surveys and even for block kinematic analyses [21,22]. Through these techniques, the geostructural characteristics of the rock mass can be extracted from a generated 3D point cloud and an orthomosaic used to derive the discontinuity set, spacings, and rock block volumes, facilitating the monitoring and managing of geological problems in inaccessible areas [23,24,25]. Moreover, by using the high-resolution 3D models, it is possible to derive the parameters involved in rockfall dynamics such as boulder geometry, slope topography, outcrop terrains, and vegetation [26] for evaluating the trajectories of blocks and propagation areas; these are indispensable elements for the appraisal of associated geological hazards and risks and/or for the design of defense works. This paper aims to assess the geological factors that directly influence the evolution and the geological hazards of a “pocket-shaped” beach located in the NW coastal sector of Sicily Island. Here, the nearby cliffs are affected by several rockfalls, the deposits from which add to the rate of sedimentary contributions for these coastal landforms and therefore play an important role in the environment of the analyzed coastline as there are numerous similar landforms in the study area.
The study was carried out within the broad framework of the SUFRA (SUscetibilità da FRAna) project [27], which helped to develop a multiscale methodology for the assessment and management of landslide susceptibility [28,29] for the whole of Sicily Island by applying statistical, GIS-based approaches and obtaining prediction images of the mapped areas to determine the probability of a landslide [30]. Given the susceptibility maps, rocky mass hazard assessments were carried out at the slope scale in the study area, including a rockfall homogeneous source area prediction and propagation/arrest track delimitation.
An initial phase was conducted using traditional approaches that have previously been utilized in geological, geomorphological, and geomechanical field investigations. This phase was supported by the use of available light detection and ranging (LIDAR) images which helped to define the reference geological model. Moreover, during the surveys, an ad hoc unmanned aerial vehicle (UAV) flight was carried out that allowed for data acquisition for a subsequent analysis.
The high-accuracy, 3D, point-cloud data derived from the UAV were used to remotely define the rock slope features and for the semiautomatic identification of discontinuity sets, which is useful for the characterization of rock masses. These data were compared with the data that were classically obtained from the field surveys using the geological compass.
Subsequently, in order to define the runout zones and the trajectories of rockfall at the beach, the acquired data were processed by means of two runout prediction methods: the “reach angle” empirical model [31,32] and the “lumped mass” analytical model [33].
The use of remotely sensed datasets, such as orthophotos and DEMs, which are available from institutions or geobrowsers, or those that are derived from surveys using a UAV, was essential for all stages, even for the analysis of the inaccessible areas. These data were used for the mapping of processes and landforms, including defining the size and geometry of the boulders, as well as to obtain the topographic elements useful for integrating the methods of the models into GIS modules or software.
2. Materials and Methods
The analysis preparation for the application of the methods, which aimed at defining the general and detailed setting of the area, traditionally and semiautomatically identifying discontinuities and characterizing rock masses, and applying empirical and numerical models, was performed thanks to the use of various high-quality digital topographic data. High-resolution (0.25 m) light detection and ranging (LIDAR) images taken in 2012 were used, as was a digital terrain model (DTM) with a ground resolution of 2 m and an altimetric accuracy of ±15 cm from Assessorato Regionale al Territorio e all’Ambiente [34]. Additionally, orthomosaic images, 3D point clouds, and related DTMs (cell size: 6157 cm) delivered from a UAV DJI Mavic 2 PRO were used. The processing of the UAV data, aimed at the reconstruction of the photogrammetric model, was performed using the 3DF Zephyr software [35]. Open-source geographic information system software (Quantum GIS [36] and SAGA GIS [37]) were used for processing the thematic spatial data and digital terrain models. They were also used to integrate the empirical methods. IS GeoMassi-IS GM software [38] was used for the application of the analytical model with the aim of defining block trajectories, and DSE (Discontinuity Set Extractor) software (developed by [25]) was utilized for the discontinuity set extraction.
2.1. General and Detailed Setting of the Study Area
The study area, named Tonnarella dell’Uzzo, is located near the village of San Vito Lo Capo along the northwestern coastline of Sicily Island (Southern Italy). It is home to the “Lo Zingaro Nature Reserve”, which stretches along the coast for 7 km in one of the most beautiful parts of Sicily (Figure 1). This coastal sector is characterized by the final stretch of a large, deep-seated gravitational slope deformation (DsGSD) [6] and by a series of “pocket-shaped” beaches that are limited by natural headlands with steep rocky sides and separated by deep valleys. Generally, the sedimentary contributions of these beaches are derived from the small streams that flow into them, but they also consist of deposits from several rockfall phenomena with source areas in the backs of nearby cliffs.
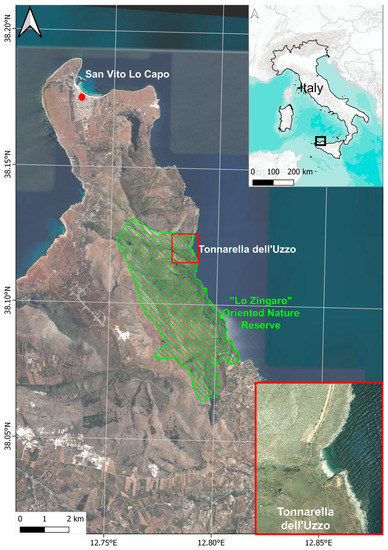
Figure 1.
Location map of the study area.
The geological setting is the result of the evolution of the northwestern Sicily continental margin, which derives from the Africa–Europe convergence and the subsequent continental collision that has occurred since the Middle Miocene [39]. The main structural elements are the overthrust of Meso-Cenozoic carbonate rocks over tertiary siliciclastic deposits and the extensional and transtensional faults, which displace and dissect the shortened and thickened continental crust of the orogenic belt [40], the latter being related to the opening of the Tyrrhenian Sea during the Plio-Quaternary [41]. This setting of the study area scale is represented in Figure 2, in which the main tectonic elements and lithological features are indicated. This sector consists of rocks belonging to the structural stratigraphic units, which are derived from the deformation of the Panormide domain [39] and characterized by homogeneous lithologies (mainly limestones, dolomites, and calcarenites) that are intensely fractured and karstified. In some areas, there are outcrops of quaternary deposits made up of conglomerates, arenites, stratified and cemented detritus, marine deposits, colluvial terrains, scree and talus slopes, and landslide debris (Figure 3).
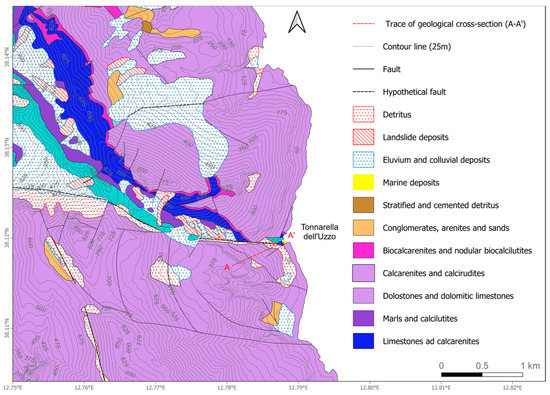
Figure 2.
Geological map of the study area.
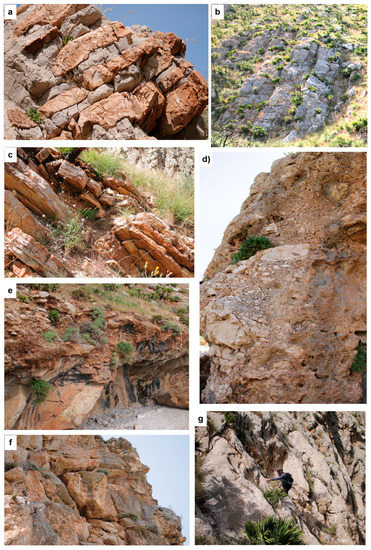
Figure 3.
(a) Limestones and calcarenites; (b) dolomitic limestones; (c) marls and calcilutites; (d) conglomerates and bioclastic limestones; (e) poorly cemented detritus and reddish marls; (f) reddish limestones; and (g) dolomitic limestones.
The inverse high angle faults and subsequent Pleistocenic NW–SE/NE–SW normal faults segment the whole coastal area, giving rise to a series of landforms and structures such as ramp anticlines, “V”-shaped valleys, and talus slopes on the foot of densely fractured rock masses that are affected by rockfall. These landforms can be characterized by parallel drainage that is controlled by the structure, displaying regularly spaced main streams that are often filled by detritus. At sea level, the valleys border the high cliffs, which represent the lateral limits of some “pocket-shaped” beaches.
The scarps that surround the pocket beaches of the Tonnarella dell’Uzzo area are abandoned coastal cliffs consisting of Mesozoic carbonate rocks (mainly dolostones and dolomitized limestones in massive beds that are intensely fractured and karstified) deposited in a carbonate platform environment and derived from original fault scarps. At the foot of the cliffs, large talus slopes formed by coarse grains and blocks of a carbonate nature with various degrees of sediment compaction delimitate the scarps at their base, forming slopes with an incline of approximately up to 30° (Figure 4).
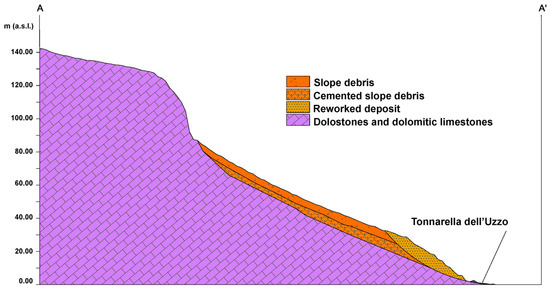
Figure 4.
Schematic of geological cross-section (see trace A-A’ in Figure 2).
Several discontinuities with an unfavorable kinematic orientation affect the rock masses by isolating unstable blocks, giving rise to landslide phenomena such as rockfalls, block slides, and toppling.
The heaps of crumbled material and fallen blocks constitute the main source of the sedimentary contribution to the pocket beach, both directly and through the filling of the channel that borders the left sector of the analyzed slope unit (Figure 5).
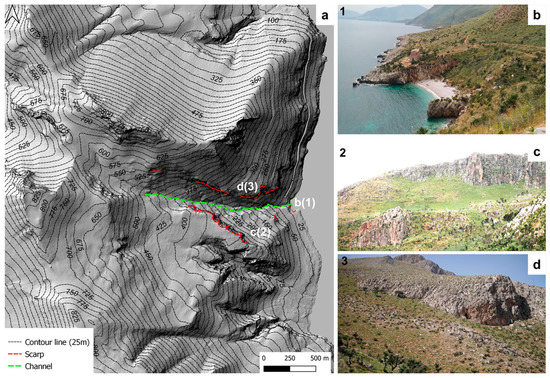
Figure 5.
(a) Main sources of the sedimentary contribution (scarps and channel) to the pocket beach and some explanatory pictures related to the scarps as source areas of the rockfall; (b) headlands bounding the pocket beach that prevent/limit long-shore sediment transport and, at the same time, contribute to the evolution with materials derived from rockfall; (c) scarp as sedimentary contribution area on the right side of the slope unit; and (d) scarps as sedimentary contribution areas on the left side of the slope unit.
The availability of digital images from Google Earth, orthophotos provided by institutions, and UAV-derived orthomosaic images allowed us to describe the temporal evolution of the channel fillings. Figure 6 shows the channel and the progressive increase in detritus after the 2011 and 2012 fires and after the rainy winter events of 2020.
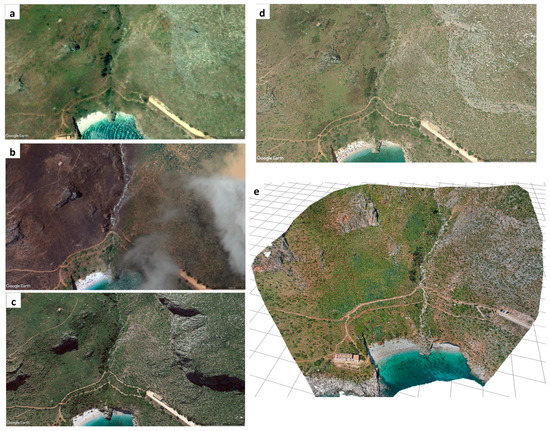
Figure 6.
Temporal evolution of the filling of the channel and the progressive increase (from 2003 to 2021) in detritus after fires (b) and rainy winter events in 2020 (e). Images from Google Earth: (a) 2003; (b) 2012; (c) 2015; and (d) 2019. (e) Orthomosaic derived from UAV surveys (2021).
When they do not directly reach the canal or the beach, the collapsed blocks remain resting on the cover (Figure 7a), constituting a hazard because their movement on the slope could continue as a result of the erosion at their base by means of runoff water, the action of gravity, and possible seismic actions. Some of these were detected in the field and measured during surveys; for others, the UAV images were fundamental in defining the shape of the boulders, especially for those placed in hard-to-reach sectors.
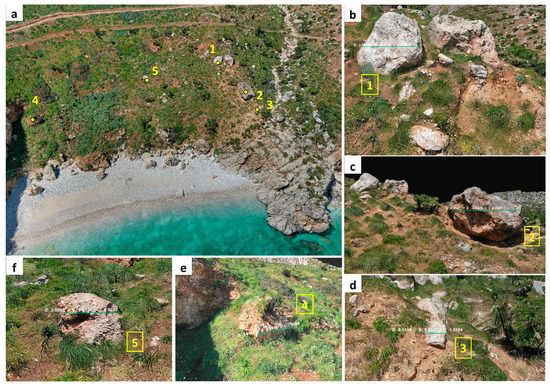
Figure 7.
(a) The collapsed blocks resting on the cover. (b–f) Some examples of surveyed and measured boulders, as described in the text.
The sizes of the collapsed boulders identified as unstable were obtained through the field and through UAV surveys by analyzing high-quality georeferenced orthophotos. The volumes ranged from a few cubic meters to 30 cubic meters. Some examples are shown in Figure 7: the measured volume for the boulder in Figure 7b is equal to approximately 5.5 m3, whereas smaller sizes were measured for the boulders in Figure 7d,e which were equal to approximately 3 m3 and 4 m3, respectively. Boulders of a considerable size were found, as shown in Figure 7c and in Figure 7f, to be equal to approximately 25 m3 and 12 m3, respectively. These unstable blocks are characterized by the presence of morphological evidence due to the erosion at their bases which, under certain conditions, could trigger sliding failure mechanisms.
The main rockfall sources from which these residual boulders derive are located at the back of the beach on a nearby isolated, rocky slope (Figure 8) that extends horizontally and vertically for about 57 m and 43 m, respectively, as observed in the field and through the analysis of the orthophotos derived from UAV surveys (Figure 8b). The average distance of the collapsed boulders from the source area is approximately 120 m.
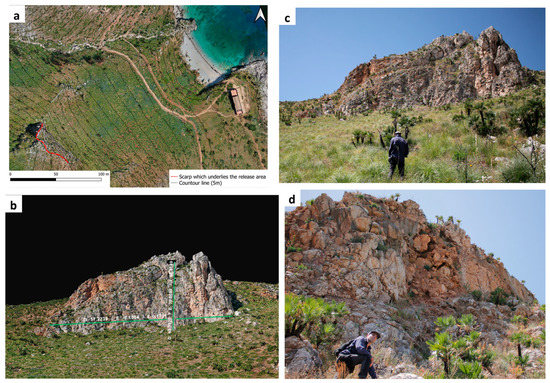
Figure 8.
The isolated rocky slope identified as the main source of the rockfall affecting the beach. (a) Scarp which underlies the source area. (b) Detail of the orthomosaic derived from UAV surveys. (c) Overview of the rocky face and (d) a sector of the rocky slope characterized by multifaceted angular blocks formed by discontinuity sets.
In correspondence with these rocky slopes, geomechanical analyses using data derived from both traditional and remote sensing sources were performed to classify the main rockfall kinematics; the “reach angle” empirical model and the “lumped mass” analytical model were also applied to define rockfall runout areas and the trajectories.
2.2. Slope Analysis
This subsection describes the traditional and semiautomatic approaches used to characterize the rock slope from the geostructural point of view, as well as the application of empirical and numerical models utilized to define the runout zones and to track the rockfall trajectories of potential rockfalls, respectively.
On the isolated rocky slope identified as the main source of the rockfall affecting the beach (Figure 8), a quantitative description of discontinuities was carried out by using the traditional methods proposed by the International Society for Rock Mechanics [42].
In these sectors, we surveyed the discontinuity sets and their geometric characteristics, such as spacing and persistence, that are useful for defining the models of failures and the volume of potential rock blocks (Figure 7). The angular relationships between the surveyed discontinuities and the slope face were represented with a stereographic projection to carry out the recognition of the main sets using Dips software to analyze the orientation-based geological data (Rocscience) [43].
With the aim of characterizing the geostructural discontinuities of the rock mass by using a remote-sensing-based approach, the orthorectified images derived from the UAV surveys were merged into a single orthomosaic, which was used to accurately measure the distances, the features of the slope, and the volumes of the blocks (Figure 7 and Figure 8) and to investigate fracture patterns. In correspondence with the sector in which the traditional geomechanical survey was carried out, a bounding box (Figure 9a,b) was defined in order to remotely obtain the semiautomatic identification of discontinuity sets by using Discontinuity Set Extractor (DSE) [25]. DSE is an open-source software programmed in MATLAB that aims to extract discontinuity sets from a rock mass by means of a methodology that semiautomatically identifies the point members of a 3D point cloud (input data) which can be arranged by an algorithm according to plans in the space [44]. For a rock slope characterized by the presence of discontinuity plans, the points can be arranged into sets in line with the predominant orientations (discontinuity systems) via cluster analysis, allowing for the identification of points close enough that they can be assigned to a single surface in accordance with the geometric conditions of belonging to a set of points in a plan. The input data were obtained from the 3D point cloud that was acquired by UAV surveys in correspondence with the bounding box along the scan line (Figure 9a,b). The identified discontinuity sets were subsequently used to define the kinematic analysis and define the main mode of failures.
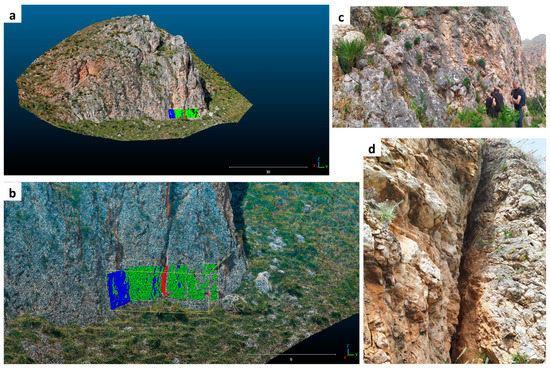
Figure 9.
(a) The rock scarp and (b) details of the analyzed bounding box with discontinuity planes within each source sector colored according to each individuated discontinuity set. Green, blue, and red indicate (c) details of the scanline where the blue and green sets are mainly found and (d) details of the red set.
After analyzing the rocky mass identified as the major contributing area of sediment and, at the same time, as a potential rockfall hazard area, the runout distance and rockfall dynamic were determined for the underside of the slope.
The field surveys and orthophoto analysis showed that the rock mass is characterized by the presence of several unstable elements at different altitudes; for this reason, in order to define the runout areas and the potential block trajectories through a precautionary approach, the highest scarp of the analyzed rock mass was considered the source area (Figure 8) for the application of the “reach angle” empirical model [31,32] and the “lumped mass” analytical model [33]. The quality of the results of the rockfall runout simulations depends on the input parameters, such as the geometry of the slope, the volume of the unstable blocks, and the restitution and friction coefficients.
The geometric features of the slope were derived from field observations and the high-quality digital terrain model (DTM) obtained from the UAV surveys; the geological, geomorphological, and geomechanical surveys allowed us to define the volume of unstable blocks and those arising from past failures. The coefficients (Table 1) for the rockfall trajectory simulations were chosen in accordance with the detailed guidelines provided from institutions [45] and based on similar lithotypes in the Sicilian territory; these values were derived from on-site tests and references in the literature [33,46]. In order to calculate the trajectories of the boulders, the “Lumped Mass” analytical method was applied to the highest scarp of the analyzed rock mass. Rockfall motions depend on several factors (e.g., rockfall source areas, morphology, and the mechanical properties of both blocks and slopes) which cannot always be calculated. It is not always easy and/or possible to define these parameters. However, it is possible to explicitly model the energy loss at each impact point [47] by means of the energy restitution values and the friction coefficients. The analytical method was integrated using [38].

Table 1.
Input parameters to define the rockfall trajectories: Kn.—coefficient of restitution of normal energy; Kt.—coefficient of restitution of tangential energy; Cr.—friction coefficient of the rolling boulders.
The “reach angle” (α) method allows for the definition of areas that might be reached by rockfall, where α is defined as the angle between the horizontal line and the line joining the top of the slope and the farthest fallen block [32]; its value depends on the rockfall source altitude and slope morphology. This study used an α value of 32° that was calculated by considering the geometric characteristics of the slope and the average distance of collapsed boulders from the source area. The analysis was integrated into an open-source GIS module (Gravitational Process Path Model (GPP), SAGA GIS) [48] which allowed us to obtain the runout area relating to the scarp that underlies the potential sources of rockfall. The GPP model made it possible to simulate the process path and runout area of gravitational processes based on the DTM by combining several components (process path, runout length, sink filling, and material deposition) to simulate the movement of a mass point from the source site to the deposition area.
3. Results and Discussion
Beginning with the geological and geomorphological field surveys and using LIDAR images, the reference geological model was defined. During the surveys, an ad hoc unmanned aerial vehicle (UAV) flight was carried out to apply the empirical and analytical methods and to remotely obtain the semiautomatic identification of discontinuity sets. The morphological unit of the study area mainly consisted of limestones, dolomites, and calcarenites (Figure 2 and Figure 3) which were densely fractured and karstified and affected by several landslide phenomena such as rockfalls, block slides, and toppling. In this way, it was possible to identify the input (deposition) and output (mobilization) elements that contribute to the development of the beach. The assessment of the reference geological model for the analyzed morphological unit allowed for the identification of the main landforms and processes which contributed to the evolution of the coastal sector and that determine the hazard conditions.
The landslide results (rock or debris) constitute the main source of the sedimentary contributions of the pocket beach, both directly and through the filling of a channel that borders the left sector of the analyzed slope unit (Figure 5). The multitemporal analysis of the channel, using Google Earth, orthophotos provided by institutions, and UAV-derived orthomosaic images, showed a particularly progressive increase in filling that followed the precipitation during the 2020–2021 winter (Figure 6).
The hazard conditions are primarily related to the rockfall phenomena, which affect an isolated, rocky slope located at the back of the beach (Figure 8). During the field surveys, blocks were found both on the beach and on the side immediately upstream of these. The volumes of the collapsed blocks ranged from a few cubic meters to 30 cubic meters (Figure 7); in the most inaccessible areas, the volume calculations were carried out through the 3D analysis of the UAV images.
3.1. Traditional and Remote-Sensing-Based Approaches for Geostructural Characterization
The traditional scanline surveys (TUS; Tonnarella dell’Uzzo Scanline) allowed for the identification of three main sets of discontinuities and their characteristics, such as spacing and persistence. Due to intense alterations, the rocky face has a very irregular shape. It is characterized by a high fracture density that forms numerous unstable rock blocks, which may be involved in the three prevailing models of slope failures, including toppling [46,49], wedge sliding [48,50], and planar sliding [46,49,51] failures. The resulting modal plane orientation of each discontinuity set (F) relating to the slope face (S) is reported in Figure 10. The angular relationships between the joints F1, F2, and F3 and the slope face were represented by a stereographic projection for the recognition of the main sets; for the stereographic configuration of surveys, we considered the average slope of the slope face to be representative.
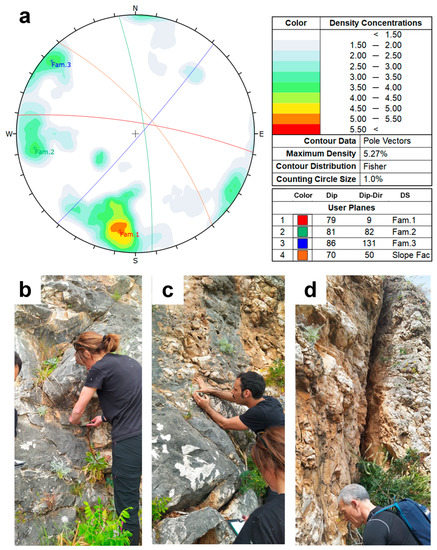
Figure 10.
(a) Contour diagram of the detected discontinuities in the representative sector (TUS) providing values of dip and dip-direction for the discontinuity sets (F1–F3), which relate to the average values of dip and dip-direction of the slope face (S). (b–d) Sections of the scanline where F1, F2, and F3 sets are mainly found, respectively.
Small (F1 and F2) and medium (F3) spacings of the discontinuities caused the rock to be broken into smaller and medium-sized blocks, which was in accordance with the definition of volumes found through the field analysis (Figure 3, Figure 7 and Figure 8).
Block toppling represents one of the identified types of instability in the study area and occurs on the slope along the F2 discontinuity set, striking subparallel to the slope face. Additionally, the blocks are laterally bordered by the F3 discontinuity set. The wedge and planar sliding failures occur in correspondence to the tetrahedral elements formed by the intersection between the F1 and F2 sets.
Corresponding with the sector in which the traditional geomechanical survey was carried out, a bounding box (Figure 9a,b) was defined in order to remotely obtain the semiautomatic identification of discontinuity sets when using the Discontinuity Set Extractor (DSE) [25]. Three prevailing discontinuity systems were isolated; the resulting modal plane orientations of each discontinuity set (J) relating to the slope face (S) are reported in Figure 11.
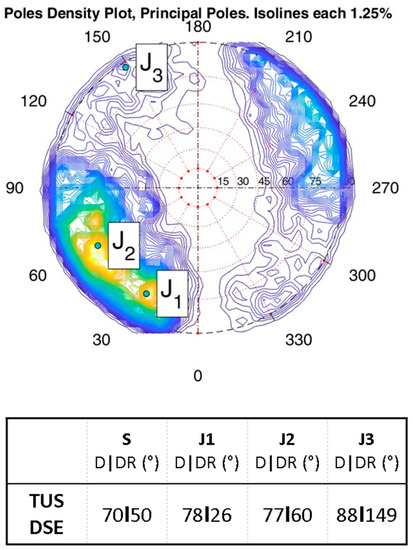
Figure 11.
Stereonet of discontinuity planes extracted via DSE software.
The kinematic analysis applied to the DSE data allowed us to define the main mode of failure. This analysis refers to the traits in which the front is subvertical with greater values of inclination. Three prevailing models of slope failures have been identified: planar sliding, wedge sliding, and toppling (Figure 12). Kinematic analysis showed that direct toppling is made possible by the presence of the J2 set, as shown in Figure 12a. Planar sliding is made possible by the slip along fractures pertaining primarily to the J2 set (Figure 12b), whereas wedge failure is kinematically possible along the joint intersections of J1 and J2, J1 and J3, and J2 and J3 (Figure 12c).
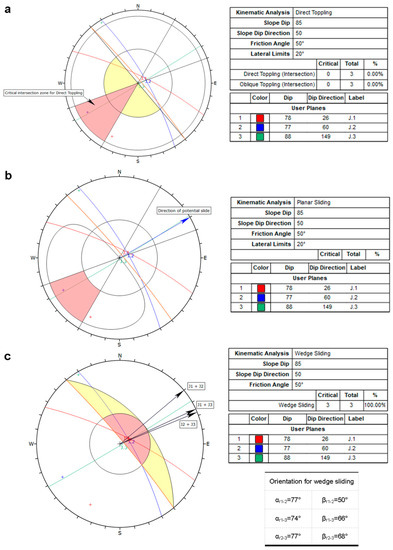
Figure 12.
Kinematic analysis for different failure criteria: (a) direct toppling; (b) planar sliding; (c) wedge sliding.
The three different discontinuity sets, which were derived using 3D geostructural analysis (Figure 11), are very similar to those obtained by traditional methods (Figure 10). The differences relate to azimuth values and range from a minimum of 17° (F1vsJ1 set) to a maximum of 22° (F2VsJ2 set); these are slight differences that are caused by the probabilistic approach for determining the average values of orientation representative of the rock mass. In either case, geometric relationships between identified joint sets and the slope face can determine the three main models of failure: toppling, planar sliding, and wedge sliding.
3.2. Empirical and Analytical Models
The application of the “reach angle” empirical model and the “lumped mass” analytical model in correspondence with the highest scarp of the analyzed rock mass allowed us to define the dynamic and propagation areas of the potential rockfall. The resulting trajectories that define the potential propagation area are shown in Figure 13, whereas the output of the “reach angle” (α) method is a propagation zone (Figure 14) in the shape of a delineated process area for which the encoded transition frequencies are represented by means of the different coloring of cell counts; the frequency increases from blue to red.
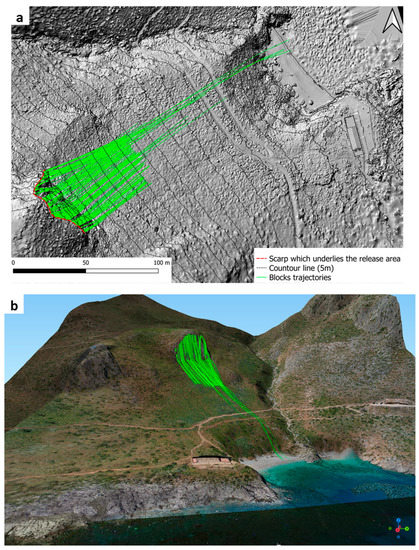
Figure 13.
Block trajectories defined by IS GeoMassi: (a) in plan and (b) in 3D version.
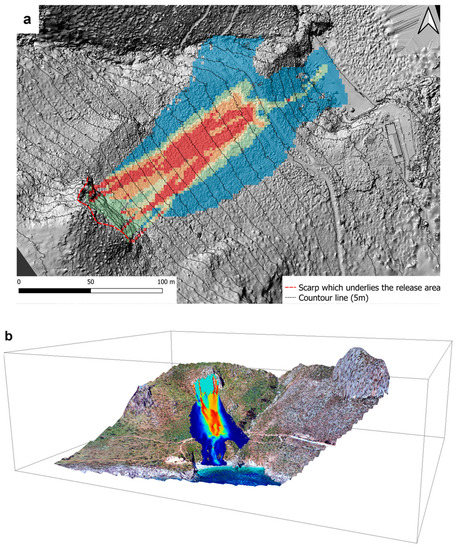
Figure 14.
Runout area obtained by applying the empirical method using GPP in SAGA GIS: (a) in plan and (b) in 3D version.
The potentially affected areas spread up to the beach for both methods, particularly in the left portion of the analyzed morphological unit. This trend was further noted during the geomorphological and geostructural surveys; most of the simulated blocks stop at the middle of the slope (Figure 13) and on the propagation zone representation (Figure 14). The red frequency has greater representation in this sector. Among the features that affect rockfall energy and the trajectory of the rockfall (slope angle, rock type, slope height, topography, soil cover, and vegetation), the factor that seems to have a greater influence is the inclination of the release area. This is more inclined in the left side of the rocky mass, favoring the free fall of the blocks which have a higher energy in terms of propagation distance. On the right-hand side of the beach, the sedimentary contributions are generally derived from rockfall, which affects the steep rocky side (Figure 5a,b); on the left, the morphological conditions of the slopes seem favorable for the propagation of collapsed boulders from the isolated rocky slope at the back of the beach.
4. Conclusions
The coastline evolution in the Tonnarella dell’Uzzo area is strongly connected to the presence of the rockfall phenomena as the prevailing source of sediment contribution for the pocket beaches that characterize this stretch of coast. However, rockfalls also represent a source of hazard and risk, especially for these areas of high environmental and touristic value that support the local economy. The study of these landslide phenomena in the study sector and the definition of the propagation areas, therefore, becomes a fundamental tool in terms of land management and the assessment of the morphodynamic evolution of the coastline. This study was conducted through the application of studies and models that enabled the collection of input data from the field, which often occurred under difficult conditions due to the accessibility of the sites and the time spent on the surveys. The availability of digital images from Google Earth, DTMs, orthophotos provided by institutions and UAVs proved essential for the study of this rocky coast. We first defined the reference geological model and carried out the identification and mapping of the main geomorphological processes and relating landforms that contribute to the coast sector evolution in time and space. The remotely sensed images were instrumental in the application of various GIS software programs and the associated tools used to determine the slope geometrical features and the runout areas, as well as for the use of the software utilized to detect the block trajectories. No significant discrepancies were encountered between the data derived in the field using a geological compass and the data obtained from the semiautomated discontinuity mapping using the derived 3D point cloud. The kinematic analysis of potential rock slope failure mechanisms showed similar results for both data sets. By beginning with the traditional field surveys (which remain essential) and extending to the integration of remote sensing data, it was possible to analyze the coastal sector at the slope scale in terms of geomorphological evolution and hazard elements in a faster and more complete way within a complex geomorphological context.
Author Contributions
Conceptualization, C.C., C.M. and E.R.; methodology, C.C., F.C. and R.F.; software C.C., C.M. and R.F.; formal analysis, C.C., F.C., C.M. and R.F.; investigation, C.C., F.C., C.M. and R.F.; data curation, C.C., F.C. and R.F.; writing—original draft preparation, C.C. and R.F.; writing—review and editing, C.C., C.M. and E.R.; visualization, C.C. and F.C.; supervision, C.C. and E.R.; project administration, E.R. All authors have read and agreed to the published version of the manuscript.
Funding
This research received no external funding.
Data Availability Statement
Not applicable.
Conflicts of Interest
The authors declare no conflict of interest.
References
- Caracausi, A.; Sulli, A. Outgassing of Mantle Volatiles in Compressional Tectonic Regime Away From Volcanism: The Role of Continental Delamination. Geochem. Geophys. Geosyst. 2019, 20, 2007–2020. [Google Scholar] [CrossRef]
- Vandelli, V.; Sarkar, N.; Micallef, A.S.; Soldati, M.; Rizzo, A. Coastal Inundation Scenarios in the North-Eastern Sector of the Island of Gozo (Malta, Mediterranean Sea) as a Response to Sea Level Rise. J. Maps 2022, 1–10. [Google Scholar] [CrossRef]
- Sarkar, N.; Rizzo, A.; Vandelli, V.; Soldati, M. A Literature Review of Climate-Related Coastal Risks in the Mediterranean, a Climate Change Hotspot. Sustainability 2022, 14, 15994. [Google Scholar] [CrossRef]
- Randazzo, G.; Barreca, G.; Cascio, M.; Crupi, A.; Fontana, M.; Gregorio, F.; Lanza, S.; Muzirafuti, A. Analysis of Very High Spatial Resolution Images for Automatic Shoreline Extraction and Satellite-Derived Bathymetry Mapping. Geosciences 2020, 10, 172. [Google Scholar] [CrossRef]
- Randazzo, G.; Lanza, S. Regional Plan against Coastal Erosion: A Conceptual Model for Sicily. Land 2020, 9, 307. [Google Scholar] [CrossRef]
- Pappalardo, G.; Mineo, S.; Cappadonia, C.; Martire, D.D.; Calcaterra, D.; Tammaro, U.; Rotigliano, E.; Agnesi, V. A combined GNSS-DINSAR-IRT study for the characterization of a deep-seated gravitational slope deformation. Ital. J. Eng. Geol. Environ. 2021, 1, 151–162. [Google Scholar] [CrossRef]
- Cafiso, F.; Cappadonia, C. Landslide Inventory and Rockfall Risk Assessment of a Strategic Urban Area (Palermo, Sicily). Rend. Online Soc. Geol. Ital. 2019, 48, 96–105. [Google Scholar] [CrossRef]
- Cappadonia, C.; Cafiso, F.; Ferraro, R.; Martinello, C.; Rotigliano, E. Rockfall Hazards of Mount Pellegrino Area (Sicily, Southern Italy). J. Maps 2021, 17, 29–39. [Google Scholar] [CrossRef]
- Cafiso, F.; Cappadonia, C.; Ferraro, R.; Martinello, C. Rockfall Hazard Assessment of the Monte Gallo Oriented Nature Reserve Area (Southern Italy). In Proceedings of the IOP Conference Series: Earth and Environmental Science, Turin, Italy, 20–25 September 2021; Volume 833. [Google Scholar]
- Dignan, J.; Micallef, A.; Mueller, C.; Sulli, A.; Zizzo, E.; Spatola, D. A Scenario-Based Assessment of the Tsunami Hazard in Palermo, Northern Sicily, and the Southern Tyrrhenian Sea. Geol. Soc. Lond. Spec. Publ. 2020, 500, 63–80. [Google Scholar] [CrossRef]
- Violante, C. Rocky Coast: Geological Constraints for Hazard Assessment. Geol. Soc. Lond. Spec. Publ. 2009, 322, 1–31. [Google Scholar] [CrossRef]
- Randazzo, G.; Italiano, F.; Micallef, A.; Tomasello, A.; Cassetti, F.P.; Zammit, A.; D’Amico, S.; Saliba, O.; Cascio, M.; Cavallaro, F.; et al. WebGIS Implementation for Dynamic Mapping and Visualization of Coastal Geospatial Data: A Case Study of BESS Project. Appl. Sci. 2021, 11, 8233. [Google Scholar] [CrossRef]
- Yann, B.; Rémi, B.; Merour, A.; Riotte, C. Evolution of Corsican Pocket Beaches. J. Coast. Res. 2014, 70, 96–101. [Google Scholar] [CrossRef]
- Dai, Z.-J.; Liu, J.T.; Lei, Y.-P.; Zhang, X.-L. Patterns of Sediment Transport Pathways on a Headland Bay Beach—Nanwan Beach, South China: A Case Study. J. Coast. Res. 2010, 26, 1096–1103. [Google Scholar] [CrossRef]
- Auflič, M.J.; Herrera, G.; Mateos, R.M.; Poyiadji, E.; Quental, L.; Severine, B.; Peternel, T.; Podolszki, L.; Calcaterra, S.; Kociu, A.; et al. Landslide Monitoring Techniques in the Geological Surveys of Europe. Landslides 2023, 1–15. [Google Scholar] [CrossRef]
- Pappalardo, G.; Mineo, S.; Imposa, S.; Grassi, S.; Leotta, A.; La Rosa, F.; Salerno, D. A Quick Combined Approach for the Characterization of a Cliff during a Post-Rockfall Emergency. Landslides 2020, 17, 1063–1081. [Google Scholar] [CrossRef]
- Devoto, S.; Macovaz, V.; Mantovani, M.; Soldati, M.; Furlani, S. Advantages of Using UAV Digital Photogrammetry in the Study of Slow-Moving Coastal Landslides. Remote Sens. 2020, 12, 3566. [Google Scholar] [CrossRef]
- Mateos, R.M.; Ezquerro, P.; Azañón, J.M.; Gelabert, B.; Herrera, G.; Fernández-Merodo, J.A.; Spizzichino, D.; Sarro, R.; García-Moreno, I.; Béjar-Pizarro, M. Coastal Lateral Spreading in the World Heritage Site of the Tramuntana Range (Majorca, Spain). The Use of PSInSAR Monitoring to Identify Vulnerability. Landslides 2018, 15, 797–809. [Google Scholar] [CrossRef]
- Demurtas, V.; Orrù, P.E.; Deiana, G. Evolution of Deep-Seated Gravitational Slope Deformations in Relation with Uplift and Fluvial Capture Processes in Central Eastern Sardinia (Italy). Land 2021, 10, 1193. [Google Scholar] [CrossRef]
- Mateos, R.M.; Azañón, J.M.; Roldán, F.J.; Notti, D.; Pérez-Peña, V.; Galve, J.P.; Pérez-García, J.L.; Colomo, C.M.; Gómez-López, J.M.; Montserrat, O.; et al. The Combined Use of PSInSAR and UAV Photogrammetry Techniques for the Analysis of the Kinematics of a Coastal Landslide Affecting an Urban Area (SE Spain). Landslides 2017, 14, 743–754. [Google Scholar] [CrossRef]
- Mineo, S.; Caliò, D.; Pappalardo, G. UAV-Based Photogrammetry and Infrared Thermography Applied to Rock Mass Survey for Geomechanical Purposes. Remote Sens. 2022, 14, 473. [Google Scholar] [CrossRef]
- Francioni, M.; Salvini, R.; Stead, D.; Coggan, J. Improvements in the Integration of Remote Sensing and Rock Slope Modelling. Nat. Hazards 2018, 90, 975–1004. [Google Scholar] [CrossRef]
- Riquelme, A.; Cano, M.; Tomás, R.; Abellán, A. Identification of Rock Slope Discontinuity Sets from Laser Scanner and Photogrammetric Point Clouds: A Comparative Analysis. Procedia Eng. 2017, 191, 838–845. [Google Scholar] [CrossRef]
- Riquelme, A.J.; Abellán, A.; Tomás, R.; Jaboyedoff, M. A New Approach for Semi-Automatic Rock Mass Joints Recognition from 3D Point Clouds. Comput. Geosci. 2014, 68, 38–52. [Google Scholar] [CrossRef]
- Riquelme, A.J.; Abellán, A.; Tomás, R. Discontinuity Spacing Analysis in Rock Masses Using 3D Point Clouds. Eng. Geol. 2015, 195, 185–195. [Google Scholar] [CrossRef]
- Crosta, G.B.; Agliardi, F.; Frattini, P.; Lari, S. Key Issues in Rock Fall Modeling, Hazard and Risk Assessment for Rockfall Protection. In Engineering Geology for Society and Territory—Volume 2; Lollino, G., Giordan, D., Crosta, G.B., Corominas, J., Azzam, R., Wasowski, J., Eds.; Springer International Publishing: Cham, Switzerland, 2015; pp. 43–58. ISBN 978-3-319-09056-6. [Google Scholar]
- Martinello, C.; Cappadonia, C.; Conoscenti, C.; Rotigliano, E. Landform Classification: A High-Performing Mapping Unit Partitioning Tool for Landslide Susceptibility Assessment—A Test in the Imera River Basin (Northern Sicily, Italy). Landslides 2022, 19, 539–553. [Google Scholar] [CrossRef]
- Guzzetti, F.; Reichenbach, P.; Ardizzone, F.; Cardinali, M.; Galli, M. Estimating the Quality of Landslide Susceptibility Models. Geomorphology 2006, 81, 166–184. [Google Scholar] [CrossRef]
- Rotigliano, E.; Agnesi, V.; Cappadonia, C.; Conoscenti, C. The Role of the Diagnostic Areas in the Assessment of Landslide Susceptibility Models: A Test in the Sicilian Chain. Nat. Hazards 2011, 58, 981–999. [Google Scholar] [CrossRef]
- Martinello, C.; Cappadonia, C.; Conoscenti, C.; Agnesi, V.; Rotigliano, E. Optimal Slope Units Partitioning in Landslide Susceptibility Mapping. J. Maps 2021, 17, 152–162. [Google Scholar] [CrossRef]
- Evans, S.G.; Hungr, O. The Assessment of Rockfall Hazard at the Base of Talus Slopes. Can. Geotech. J. 1993, 30, 620–636. [Google Scholar] [CrossRef]
- Corominas, J. The Angle of Reach as a Mobility Index for Small and Large Landslides. Can. Geotech. J. 1996, 33, 260–271. [Google Scholar] [CrossRef]
- Piteau, D.R.; Clayton, R. Computer Rockfall Model. In Proceedings of the Meeting on Rockfall Dynamics and Protective Works Effectiveness, Bergamo, Italy, 20–21 May 1976; ISMES Publication: Bergamo, Italy, 1976; pp. 123–125. [Google Scholar]
- Regione Siciliana—Assessorato del Territorio e dell’Ambiente—Area 2 Interdipartimentale—Nodo Regionale S.I.T.R Modello Digitale del Terreno (MDT) 2 m Volo ATA 2012. 2013. Available online: https://www.sitr.regione.sicilia.it/geoportale/it/metadata/details/947 (accessed on 15 December 2022).
- 3dFlow—3DF Zephyr. User Manual. 2013. Available online: http://3dflow.net/zephyr-doc/3DF%20Zephyr%20Manual%204.300%20English.pdf (accessed on 15 December 2022).
- QGIS.Org, %Y. QGIS Geographic Information System. QGIS Association. Available online: http://www.Qgis.Org (accessed on 15 December 2022).
- Conrad, O.; Bechtel, B.; Bock, M.; Dietrich, H.; Fischer, E.; Gerlitz, L.; Wehberg, J.; Wichmann, V.; Böhner, J. System for Automated Geoscientific Analyses (SAGA) v. 2.1.4. Geosci. Model Dev. 2015, 8, 1991–2007. [Google Scholar] [CrossRef]
- IS GeoMassi—IS GM Software. Available online: https://www.Cdmdolmen.It/Prodotti/Isgm.Htm (accessed on 15 December 2022).
- Catalano, R.; Valenti, V.; Albanese, C.; Accaino, F.; Sulli, A.; Tinivella, U.; Gasparo Morticelli, M.; Zanolla, C.; Giustiniani, M. Sicily’s Fold–Thrust Belt and Slab Roll-Back: The SI.RI.PRO. Seismic Crustal Transect. J. Geol. Soc. 2013, 170, 451–464. [Google Scholar] [CrossRef]
- Sulli, A.; Agate, M.; Zizzo, E.; Gasparo Morticelli, M.; Lo Iacono, C. Geo-Hazards of the San Vito Peninsula Offshore (Southwestern Tyrrhenian Sea). J. Maps 2021, 17, 185–196. [Google Scholar] [CrossRef]
- Agate, M.; Basilone, L.; Di Maggio, C.; Contino, A.; Pierini, S.; Catalano, R. Quaternary Marine and Continental Unconformity-Bounded Stratigraphic Units of the NW Sicily Coastal Belt. J. Maps 2017, 13, 425–437. [Google Scholar] [CrossRef]
- ISRM Suggested Methods for the Quantitative Description of Discontinuities in Rock Masses. Int. J. Rock Mech. Min. Sci. Geomech. 1978, 15, 319–368.
- Dips v.8.021 Graphical and Statistical Analysis of Orientation Data. Available online: https://www.rocscience.com/support/dips/release-notes (accessed on 15 December 2022).
- Robiati, C.; Mastrantoni, G.; Francioni, M.; Eyre, M.; Coggan, J.; Mazzanti, P. Contribution of High-Resolution Virtual Outcrop Models for the Definition of Rockfall Activity and Associated Hazard Modelling. Land 2023, 12, 191. [Google Scholar] [CrossRef]
- Regione Siciliana. Assessorato Territorio e Ambiente. ARTA “Direttive per la Redazione degli Studi di Valutazione della Pericolosità Derivante da Fenomeni di Crollo”; Regione Siciliana. Assessorato Territorio e Ambiente, ARTA: Palermo, Italy, 2013. [Google Scholar]
- Hoek, E.; Bray, J.W. Rock Slope Engineering, 3rd ed.; The Institution of Mining and Metallurgy: London, UK, 1981. [Google Scholar]
- Crosta, G.B.; Agliardi, F. A Methodology for Physically Based Rockfall Hazard Assessment. Nat. Hazards Earth Syst. Sci. 2003, 3, 407–422. [Google Scholar] [CrossRef]
- Wichmann, V. The Gravitational Process Path (GPP) Model (v1.0)—A GIS-Based Simulation Framework for Gravitational Processes. Geosci. Model Dev. 2017, 10, 3309–3327. [Google Scholar] [CrossRef]
- Hudson, J.A.; Harrison, J.P. Engineering Rock Mechanics: An Introduction to the Principles; Repr.; Pergamon: Oxford, UK, 2007; ISBN 978-0-08-043864-1. [Google Scholar]
- Markland, J.T. A Useful Technique for Estimating the Stability of Rock Slopes When the Rigid Wedge Slide Type of Failure Is Expected; Imperial College of Science and Technology: London, UK, 1972. [Google Scholar]
- Goodman, R.E. Methods of Geological Engineering in Discontinuous Rocks; West Publishing, Co.: St. Paul, MN, USA, 1976; ISBN 978-0-8299-0066-8. [Google Scholar]
Disclaimer/Publisher’s Note: The statements, opinions and data contained in all publications are solely those of the individual author(s) and contributor(s) and not of MDPI and/or the editor(s). MDPI and/or the editor(s) disclaim responsibility for any injury to people or property resulting from any ideas, methods, instructions or products referred to in the content. |
© 2023 by the authors. Licensee MDPI, Basel, Switzerland. This article is an open access article distributed under the terms and conditions of the Creative Commons Attribution (CC BY) license (https://creativecommons.org/licenses/by/4.0/).