
Ionospheric Changes over the Western Pacific Ocean near and after the End of Annular Solar Eclipse on 21 June 2020

Abstract
1. Introduction
2. Data
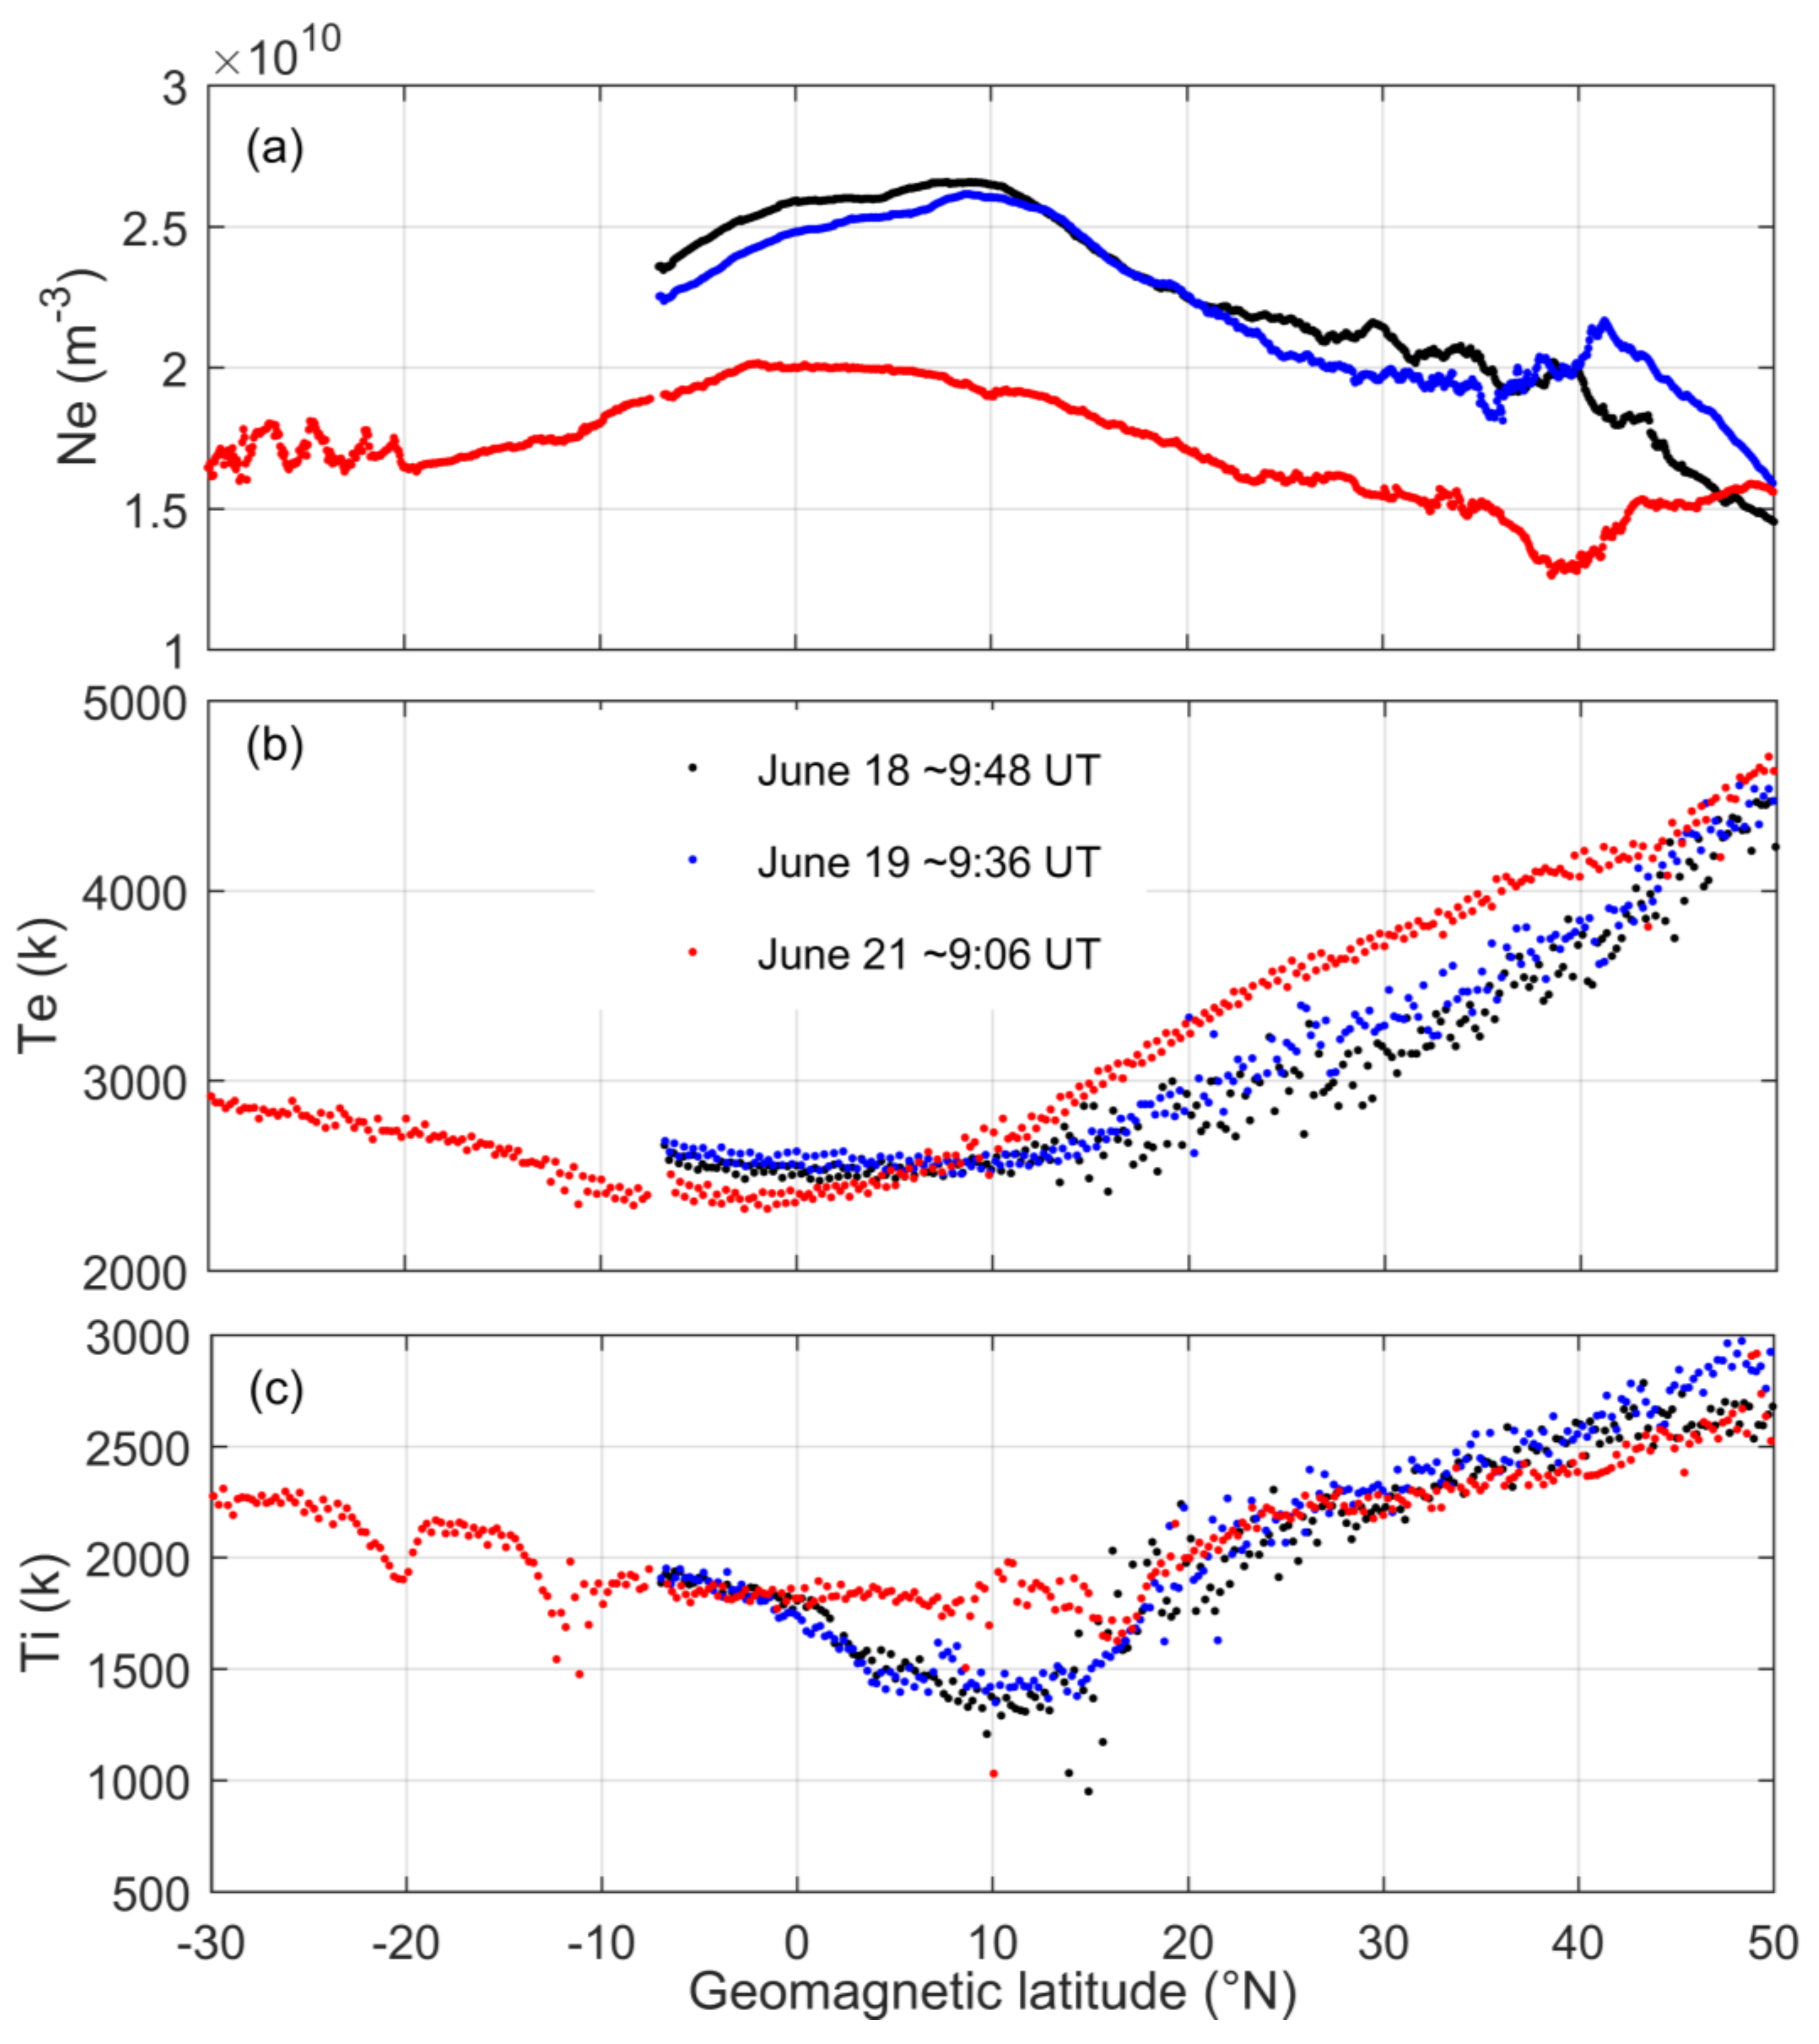
3. Results
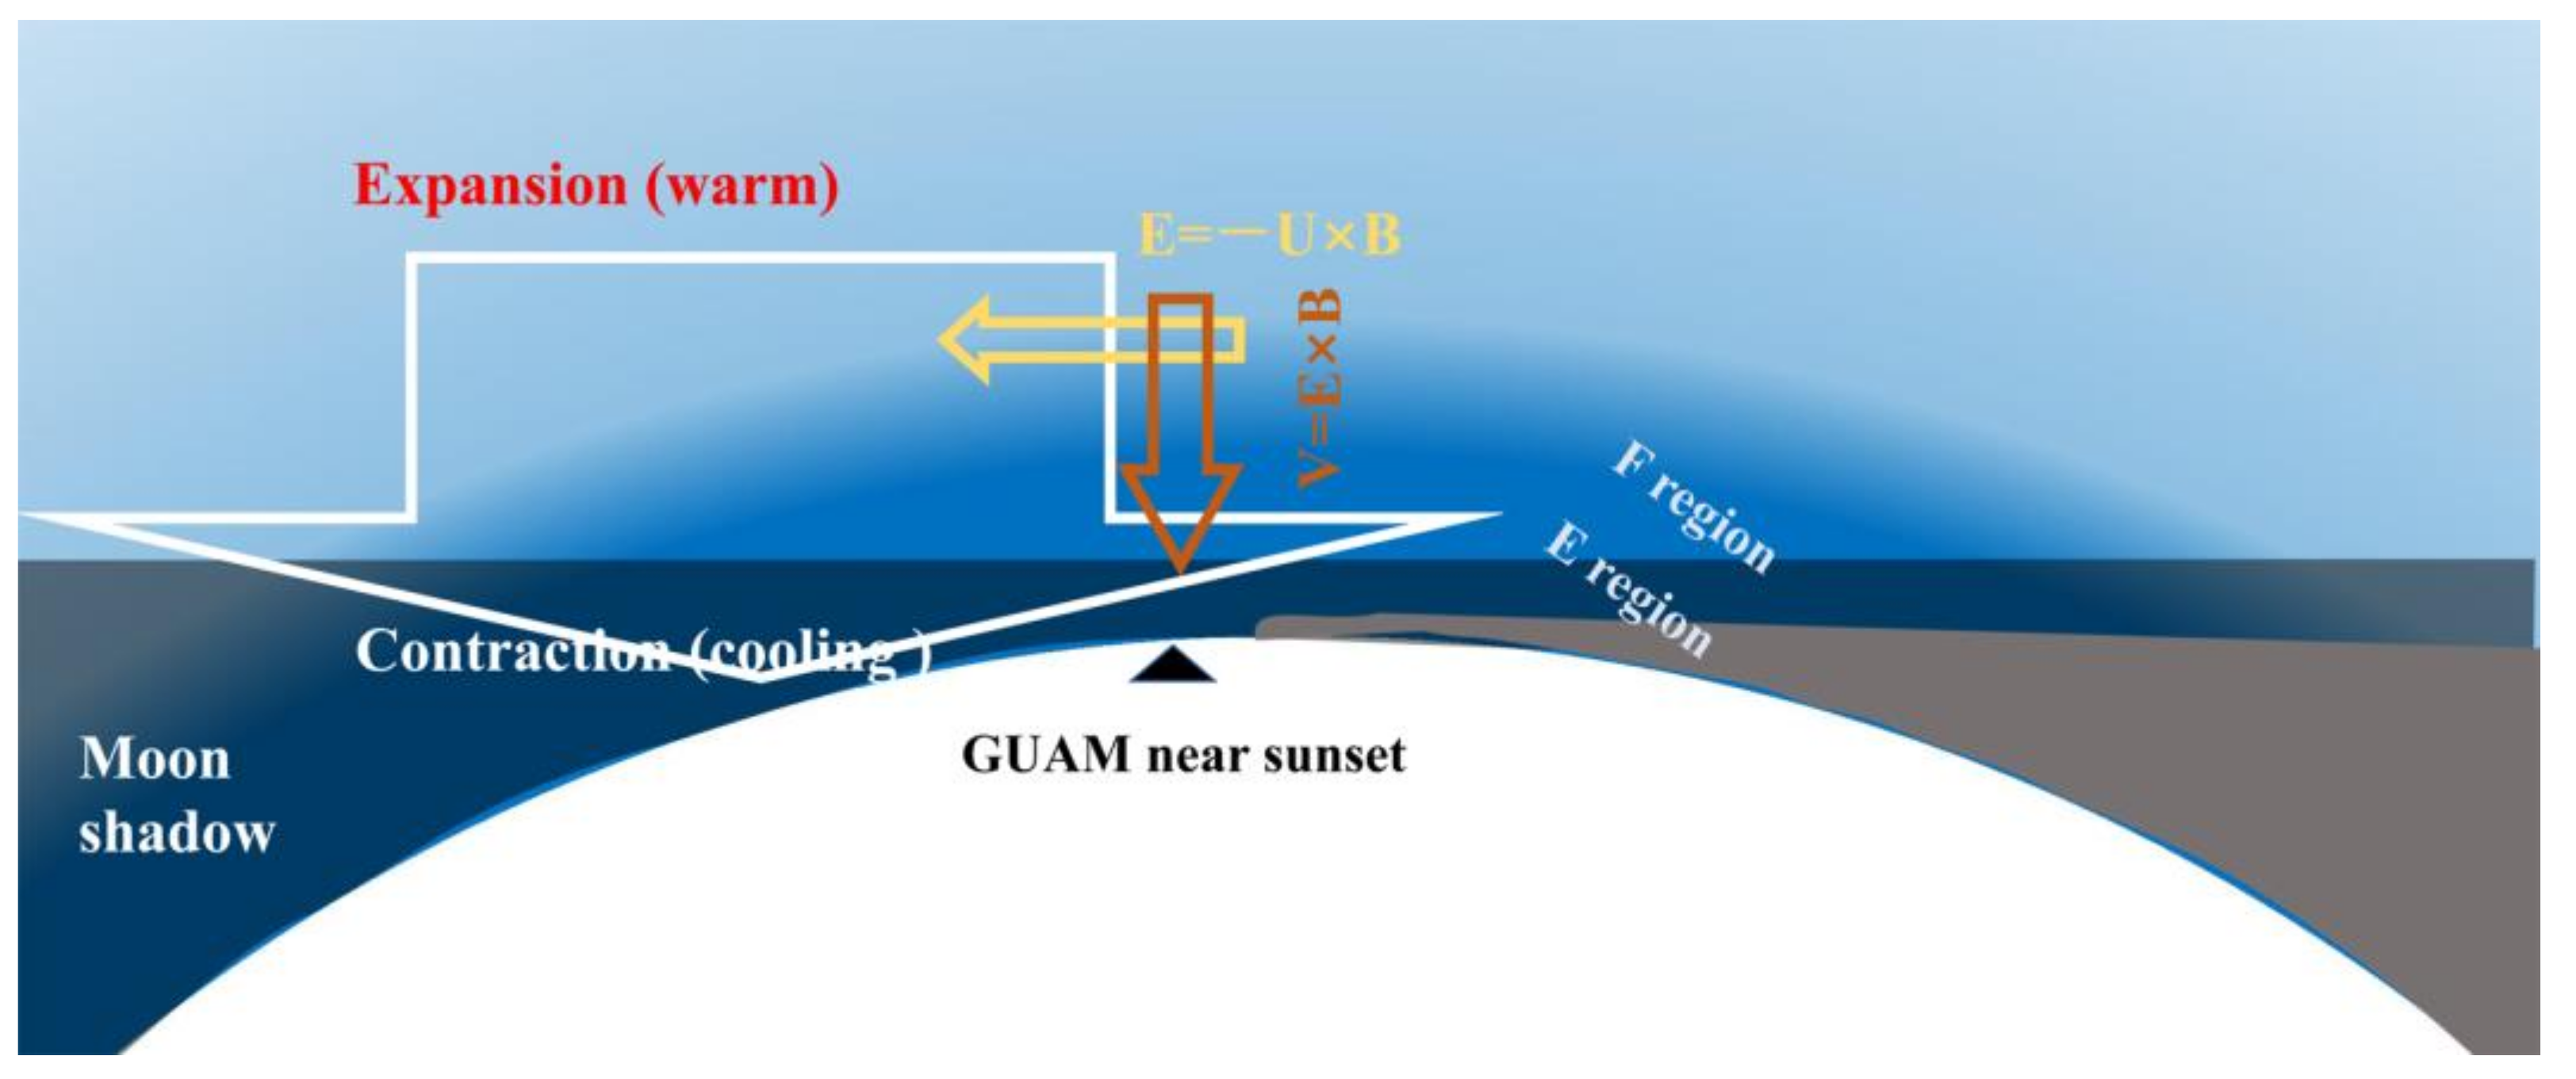
4. Discussion
5. Conclusions
Author Contributions
Funding
Data Availability Statement
Acknowledgments
Conflicts of Interest
References
- Rishbeth, H. Eclipse effects in the ionosphere. Nature 1970, 226, 1099–1100. [Google Scholar] [CrossRef] [PubMed]
- Liu, J.Y.; Sun, Y.Y.; Kakinami, Y.; Chen, C.H.; Lin, C.H.; Tsai, H.F. Bow and stern waves triggered by the Moon’s shadow boat. Geophys. Res. Lett. 2011, 38, L17109. [Google Scholar] [CrossRef]
- Dang, T.; Lei, J.H.; Wang, W.B.; Yan, M.D.; Ren, D.X.; Huang, F.Q. Prediction of the thermospheric and ionospheric responses to the 21 June 2020 annular solar eclipse. Earth Planet. Phys. 2020, 4, 231–237. [Google Scholar] [CrossRef]
- Zhang, R.; Le, H.; Li, W.; Ma, H.; Yang, Y.; Huang, H.; Li, Q.; Zhao, X.; Xie, H.; Sun, W.; et al. Multiple technique observations of the ionospheric responses to the 21 June 2020 solar eclipse. J. Geophys. Res. Space Phys. 2020, 125, e2020JA028450. [Google Scholar] [CrossRef]
- Aryal, S.; Evans, J.S.; Correira, J.; Burns, A.G.; Wang, W.; Solomon, S.C.; Laskar, F.I.; McClintock, W.E.; Eastes, R.W.; Dang, T.; et al. First global-scale synoptic imaging of solar eclipse effects in the thermosphere. J. Geophys. Res. Space Phys. 2020, 125, e2020JA027789. [Google Scholar] [CrossRef] [PubMed]
- Chen, G.; Wu, C.; Huang, X.; Zhao, Z.; Zhong, D.; Qi, H.; Huang, L.; Qiao, L.; Wang, J. Plasma flux and gravity waves in the midlatitude ionosphere during the solar eclipse of 20 May 2012. J. Geophys. Res. Space Phys. 2015, 120, 3009–3020. [Google Scholar] [CrossRef]
- Yeh, K.C.; Yu, D.C.; Lin, K.H.; Huang, C.R.; Tsai, W.H.; Liu, J.Y.; Xu, J.S.; Igarashi, K.; Xu, C.; Nam, V.H. Ionospheric response to a solar eclipse in the equatorial anomaly region. Terr. Atmos. Ocean. Sci. 1997, 8, 165–178. [Google Scholar] [CrossRef]
- Tsai, H.F.; Liu, J.Y. Ionospheric total electron content response to solar eclipses. J. Geophys. Res. 1999, 104, 12657–12668. [Google Scholar] [CrossRef]
- Liu, J.Y.; Wu, T.-Y.; Sun, Y.-Y.; Pedatella, N.M.; Lin, C.-Y.; Chang, L.C.; Chiu, Y.C.; Lin, C.H.; Chen, C.H.; Chang, F.Y.; et al. Lunar tide effects on ionospheric solar eclipse signatures: The August 21, 2017 event as an example. J. Geophys. Res. Space Phys. 2020, 125, e2020JA028472. [Google Scholar] [CrossRef]
- Sun, Y.-Y.; Chen, C.-H.; Qing, H.; Xu, R.; Su, X.; Jiang, C.; Yu, T.; Wang, J.; Hairu, X.; Lin, K. Nighttime ionosphere perturbed by the annular solar eclipse on June 21, 2020. J. Geophys. Res. Space Phys. 2021, 126, e2021JA029419. [Google Scholar] [CrossRef]
- Wang, J.; Sun, Y.-Y.; Yu, T.; Wang, Y.; Mao, T.; Yang, H.; Xia, C.; Yan, X.; Yang, N.; Huang, G.; et al. Convergence effects on the ionosphere during and after the annular solar eclipse on 21 June 2020. J. Geophys. Res. Space Phys. 2022, 127, e2022JA030471. [Google Scholar] [CrossRef]
- Harding, B.J.; Drob, D.P.; Buriti, R.A.; Makela, J.J. Nightside detection of a large-scale thermospheric wave generated by a solar eclipse. Geophys. Res. Lett. 2018, 45, 3366–3373. [Google Scholar] [CrossRef]
- Wang, J.; Zuo, X.; Sun, Y.-Y.; Yu, T.; Wang, Y.; Qiu, L.; Mao, T.; Yan, X.; Yang, N.; Qi, Y.; et al. Multilayered sporadic-E response to the annular solar eclipse on June 21, 2020. Space Weather 2021, 19, e2020SW002643. [Google Scholar] [CrossRef]
- Sridharan, R.; Devasia, C.V.; Jyoti, N.; Tiwari, D.; Viswanathan, K.S.; Subbarao, K.S.V. Effects of solar eclipse on the electrodynamical processes of the equatorial ionosphere: A case study during 11 August 1999 dusk time total solar eclipse over India. Ann. Geophys. 2002, 20, 1977–1985. [Google Scholar] [CrossRef]
- Chen, G.; Zhao, Z.; Ning, B.; Deng, Z.; Yang, G.; Zhou, C.; Yao, M.; Li, S.; Li, N. Latitudinal dependence of the ionospheric response to solar eclipse of 15 January 2010. J. Geophys. Res. 2011, 116, A06301. [Google Scholar] [CrossRef]
- Immel, T.J.; England, S.L.; Mende, S.B.; Heelis, R.A.; Englert, C.R.; Edelstein, J.; Frey, H.U.; Korpela, E.J.; Taylor, E.R.; Craig, W.W. The ionospheric connection explorer mission: Mission goals and design. Space Sci. Rev. 2018, 214, 13. [Google Scholar] [CrossRef]
- Huang, X.; Reinisch, B.W. Vertical electron profiles from the digisonde network. Adv. Space Res. 1996, 18, 121–129. [Google Scholar] [CrossRef]
- Senturk, E.; Adil, M.A.; Saqib, M. Ionospheric total electron content response to annular solar eclipse on June 21, 2020. Adv. Space Res. 2020, 67, 1937–1947. [Google Scholar] [CrossRef]
- Sun, Y.Y.; Chen, C.H.; Su, X.; Wang, J.; Yu, T.; Xu, H.R.; Liu, J.Y. Occurrence of nighttime irregularities and their scale evolution in the ionosphere due to the solar eclipse over East Asia on 21 June 2020. J. Geophys. Res. Space Phys. 2023, 128, e2022JA030936. [Google Scholar] [CrossRef]
- Richmond, A.D.; Fang, T.-W.; Maute, A. Electrodynamics of the equatorial evening ionosphere: 1. Importance of winds in different regions. J. Geophys. Res. Space Phys. 2015, 120, 2118–2132. [Google Scholar] [CrossRef]
- Richmond, A.D.; Fang, T.W. Electrodynamics of the equatorial evening ionosphere: 2. Conductivity influences on convection, current, and electrodynamic energy flow. J. Geophys. Res. Space Phys. 2015, 120, 2133–2147. [Google Scholar] [CrossRef]
- Fesen, C.G.; Crowley, G.; Roble, R.G.; Richmond, A.D.; Fejer, B.G. Simulation of the pre-reversal enhancement in the low latitude vertical ion drifts. Geophys. Res. Lett. 2000, 27, 1851–1854. [Google Scholar] [CrossRef]
- Stoneback, R.A.; Heelis, R.A.; Burrell, A.G.; Coley, W.R.; Fejer, B.G.; Pacheco, E. Observations of quiet time vertical ion drift in the equatorial ionosphere during the solar minimum period of 2009. J. Geophys. Res. Space Phys. 2011, 116, A12327. [Google Scholar] [CrossRef]
- Nanan, B.; Chen, C.Y.; Rajesh, P.K.; Liu, J.Y.; Bailey, G.J. Modeling and observations of the low latitude ionosphere-plasmasphere system at long deep solar minimum. J. Geophys. Res. 2012, 117, A08316. [Google Scholar] [CrossRef]
- Tian, Z.; Sui, Y.; Zhu, S.; Sun, Y.-Y. Enhancement of electron density in the ionospheric F2 layer near the first contact of the total solar eclipse on 21 August 2017. Earth Space Sci. 2022, 9, e2021EA002016. [Google Scholar] [CrossRef]
- Rishbeth, H. The F-layer dynamo, Planet. Space Sci. 1971, 19, 263–267. [Google Scholar] [CrossRef]
- Farley, D.T.; Bonelli, E.; Fejer, B.G.; Larsen, M.F. The prereversal enhancement of the zonal electric field in the equatorial ionosphere. J. Geophys. Res. Atmos. 1986, 91, 13723–13728. [Google Scholar] [CrossRef]
- Verhulst, T.G.W.; Stankov, S.M. Height dependency of solar eclipse effects: The ionospheric perspective. J. Geophys. Res. Space Phys. 2020, 125, e2020JA028088. [Google Scholar] [CrossRef]
- Liu, L.; Chen, Y.; Le, H.; Ning, B.; Wan, W.; Liu, J.; Hu, L. A case study of postmidnight enhancement in F-layer electron density over Sanya of China. J. Geophys. Res. Space Phys. 2013, 118, 4640–4648. [Google Scholar] [CrossRef]
- Liu, L.; Ding, Z.; Le, H.; Chen, Y.; Zhang, H.; Wu, J.; Li, G.; Wan, W. New features of the enhancements in electron density at low latitudes. J. Geophys. Res. Space Phys. 2020, 125, e2019JA027539. [Google Scholar] [CrossRef]
- Brace, L.H.; Theis, R.F. An empirical model of the interrelationship of electron temperature and density in the daytime thermosphere at solar minimum. Geophys. Res. Lett. 1978, 5, 275–278. [Google Scholar] [CrossRef]
- Oyama, K.I.; Watanabe, S.; Su, Y.; Takahashi, T.; Hirao, K. Season, local time, and longitude variations of electron temperature at the height of 600 km in the low latitude region. Adv. Space Res. 1996, 18, 269–278. [Google Scholar] [CrossRef]
- Balan, N.; Oyama, K.I.; Bailey, G.J.; Fukao, S.; Watanabe, S.; Abdu, M.A. Electron temperatures in the F region of the ionosphere: Theory and observation. Rev. Geophys. 1978, 16, 355–399. [Google Scholar] [CrossRef]
- Bilitza, D. Models for the relationship between electron density and temperature in the upper ionosphere. J. Atmos. Terr. Phys. 1975, 37, 1219–1222. [Google Scholar] [CrossRef]
- Balan, N.; Oyama, K.I.; Bailey, G.J.; Fukao, S.; Watanabe, S.; Abdu, M.A. A plasma temperature anomaly in the equatorial topside ionosphere. J. Geophys. Res. Space Phys. 1997, 102, 7485–7492. [Google Scholar] [CrossRef]
- Oyama, K.I.; Abdu, M.A.; Balan, N.; Bailey, G.J.; Watanabe, S.; Takahashi, T.; Paula, E.R.; Batista, I.S.; Isoda, F.; Oya, H. High electron temperature associated with the prereversal enhancement in the equatorial ionosphere. J. Geophys. Res. Space Phys. 1997, 102, 417–424. [Google Scholar] [CrossRef]


Disclaimer/Publisher’s Note: The statements, opinions and data contained in all publications are solely those of the individual author(s) and contributor(s) and not of MDPI and/or the editor(s). MDPI and/or the editor(s) disclaim responsibility for any injury to people or property resulting from any ideas, methods, instructions or products referred to in the content. |
© 2023 by the authors. Licensee MDPI, Basel, Switzerland. This article is an open access article distributed under the terms and conditions of the Creative Commons Attribution (CC BY) license (https://creativecommons.org/licenses/by/4.0/).
Share and Cite
Wang, J.; Yu, T.; Liang, Y.; Yan, X.; Xia, C.; Qi, Y. Ionospheric Changes over the Western Pacific Ocean near and after the End of Annular Solar Eclipse on 21 June 2020. Remote Sens. 2023, 15, 1389. https://doi.org/10.3390/rs15051389
Wang J, Yu T, Liang Y, Yan X, Xia C, Qi Y. Ionospheric Changes over the Western Pacific Ocean near and after the End of Annular Solar Eclipse on 21 June 2020. Remote Sensing. 2023; 15(5):1389. https://doi.org/10.3390/rs15051389
Chicago/Turabian StyleWang, Jin, Tao Yu, Yu Liang, Xiangxiang Yan, Chunliang Xia, and Yifan Qi. 2023. "Ionospheric Changes over the Western Pacific Ocean near and after the End of Annular Solar Eclipse on 21 June 2020" Remote Sensing 15, no. 5: 1389. https://doi.org/10.3390/rs15051389
APA StyleWang, J., Yu, T., Liang, Y., Yan, X., Xia, C., & Qi, Y. (2023). Ionospheric Changes over the Western Pacific Ocean near and after the End of Annular Solar Eclipse on 21 June 2020. Remote Sensing, 15(5), 1389. https://doi.org/10.3390/rs15051389