Technical Note

Radiometric Re-Compensation of Sentinel-1 SAR Data Products for Artificial Biases due to Antenna Pattern Changes

1
Microwaves and Radar Institute, German Aerospace Center (DLR), 82234 Oberpfaffenhofen, Germany
2
Collecte Localisation Satellites (CLS) Brest, 29280 Plouzané, France
3
ARESYS, Via Flumendosa 16, 20132 Milano, Italy
4
ESA-ESRIN, Via Galileo Galilei, 00044 Frascati, Italy
*
Author to whom correspondence should be addressed.
Remote Sens. 2023, 15(5), 1377; https://doi.org/10.3390/rs15051377
Submission received: 30 January 2023 / Revised: 24 February 2023 / Accepted: 27 February 2023 / Published: 28 February 2023

Abstract

:
SAR data products for Sentinel-1 have been freely available and delivered operationally on behalf of the European Space Agency since the routine operation of Sentinel-1A in 2014. These products were delivered using the best knowledge at their processing time, in particular with respect to the radiometric calibration. As reprocessing of SAR data products is not foreseen in the nominal processing chain of Sentinel-1, changes of applied processing parameters impact the SAR data quality and can be a disturbing factor for long-term monitoring of radiometric features. In particular, antenna pattern updates produce artificial radiometric steps which are visible in radar backscatter time series, especially in case of monitoring radiometric stable reference targets. This paper introduces a method for correcting changes due to such updates without the need of reprocessing SAR data products. The method was applied to long-lasting time series of data acquisitions which are used to monitor the radiometric performance with reference targets at the DLR calibration site. It has been shown that artificial steps due to antenna pattern updates disappear in backscatter timelines after correct application. Furthermore, the derived absolute radiometric accuracy was improved for the joint observation period of S1A and S1B for almost five years until December 2021.

1. Introduction

1.1. Sentinel-1 History

The Copernicus Sentinel-1 mission was designed to work in a pre-programmed, conflict-free operation mode, imaging all global landmasses, coastal zones, and shipping routes at high resolution and covering the global ocean with imagettes [1]. As Sentinel-1 is based on ESA’s heritage and experience with the ERS 1, ERS 2, and ENVISAT ASAR, the operation of the Sentinel-1 mission continues the availability of consistent long-term data archives of space-borne products acquired with C-band SAR data instruments. However, compared to predecessor missions (ERS-1/2 SAR and ENVISAT ASAR) Sentinel-1’s performance parameters, such as revisit time and coverage, are dramatically improved [2]. Furthermore, Sentinel-1 is designed as an operational mission which is driven by predefined requirements for the mission, including the data product quality and the product delivery in a reliable fashion [3].
Originally, the Copernicus Sentinel-1 mission was designed as a two-satellite constellation. Each Sentinel-1 satellite carries an advanced radar instrument to map Earth’s surface features independent from sun illumination (day and night) and cloud coverage. In the frame of the Copernicus program, the European Space Agency (ESA) planned and realized a fleet of Sentinel-1 satellites. The first one, Sentinel-1A (S1A) was launched in April 2014, followed by Sentinel-1B (S1B) two years later, in 2016. Each Sentinel-1 satellite has a repeat cycle of 12 days. As a constellation of two satellites, S1A and S1B have been orbiting 180° apart which results in a constellation repeat cycle of six days [1]. Unfortunately, the operation of S1B finished in December 2021 due to an unexpected anomaly related to the instrument electronics power supply leaving it unable to further deliver radar data [4].
Major events of the Sentinel-1 mission, including launch dates, commissioning phase periods, etc. are summarized in Table 1. The official status reports of the Sentinel-1 mission referred to in the table can be found at the Sentinel website hosted by ESA https://sentinel.esa.int/web/sentinel/missions/sentinel-1/mission-status (accessed on 27 January 2023).

1.2. Sentinel-1 Operation Modes

The Sentinel-1 C-band SAR instruments support operation in single polarization (HH or VV) and dual polarization (HH + HV or VV + VH), implemented through one transmit chain (switchable to H or V) and two parallel receive chains for H and V polarization. They can be operated with four exclusive acquisition modes:
  • Interferometric Wide Swath mode (IW) operated in single or dual polarization configuration (HH + HV or VV + VH). This acquisition mode is composed of joint acquisition on three beams, allowing a range swath of 250 km.
  • Wave mode (WV) operated either in single polarization VV (nominally) or HH. This acquisition mode is nominally activated over open ocean with a swath of 20 km.
  • Strip Map Mode (SM) operated in single or dual polarization configuration (HH + HV or VV + VH). In this mode, six exclusive beams can be selected for a swath of 80 km each.
  • Extra Wide Swath mode (EW) operated in single or dual polarization configuration (HH + HV or VV + VH). This acquisition mode is composed of joint acquisition over five beams, allowing a range swath of 410 km.
In its main operational IW mode, Sentinel-1 can provide the complete global coverage of all relevant land surfaces, sea ice, coastal zones and North Atlantic shipping routes once per 12 days for each of the two satellites [17].

1.3. SAR Data Applications Based on Backscatter

Radar backscatter is an import parameter for several SAR data applications. The backscatter is typically used as radar brightness β or converted to sigma naught or gamma naught values. Many applications make use of large time series, typically lasting several months, multiple seasons or even (several) years in order to analyze, e.g., the changes of certain geophysical parameters. Based on freely available Sentinel-1 data, a huge number of publications exists covering a broad field of monitoring applications, including agriculture, forest and cryosphere monitoring, among others. Recent examples include:
  • Ice monitoring, e.g., from the Baltic sea [18],
  • Snow melt monitoring, e.g., [19],
  • Crop monitoring, e.g., [20],
  • Monitoring of soil moisture, e.g., for irrigation [21],
  • Monitoring of the Rainforest, e.g., [22],
  • Wind measurement over oceans and in extreme conditions, e.g., [23].
To fully profit from the available Sentinel-1 data, it is crucial that the quality of the radiometry of the data is ensured as described in the following sections.

1.4. Radiometric Calibration of Sentinel-1

The radiometric calibration of S1A and S1B was initially performed during their commissioning phases in 2014 and 2016, respectively (see Table 1). In parallel to ESA’s commissioning phases, independent system calibration campaigns were also performed by the German Aerospace Center (DLR) on behalf of ESA for both SAR systems: S1A [24] and S1B [25]. Due to the detected radiometric and polarimetric channel imbalances found during the commissioning phase of S1A, a radiometric refinement campaign was performed by ESA to solve these issues [8]. The related auxiliary files were updated and finally activated in the official SAR processing chain in November 2015.
Long-term monitoring of the radiometric performance was conducted by DLR on behalf of the SAR Mission Performance Cluster (SAR-MPC) over several periods, using the DLR calibration site, e.g., for S1A [26] and Sentinel-1 constellation including S1A and S1B [27]. The different activities and results achieved have also been published regularly in reports by the SAR-MPC; a list of annual reports can be found in the reference section [28,29,30,31,32,33].

1.5. DLR’s SAR System Calibration Center

The calibration site as part of the DLR’s SAR system calibration center consists of six automatically operated reference targets: three trihedral corner reflectors and three C-band transponders. These targets are remotely controlled and permanently monitored for their health status. Each target is aligned by schedule in the expected line-of-sight direction for an upcoming satellite overpass for both ascending and descending orbits.
The corner reflectors have a leg length of 2.8 m which corresponds in C-band to an RCS of 49.2 dB m2. The high mechanical form tolerance of 1 mm ensures an absolute radiometric accuracy for these targets of 0.2 dB (1 σ ). The C-band transponders were designed for Sentinel-1 using a center frequency of 5.405 GHz and a bandwidth of 100 MHz. The transponders are temperature-controlled and automatically adjusted by their own internal calibration facility before each overpass to ensure a radiometric stability below 0.1 dB (1 σ ). An absolute radiometric accuracy of 0.2 dB (1 σ ) was achieved by executing and analyzing different calibration methods [34].
With trihedral corner reflectors, the evaluation of target impulse responses is typically conducted for co-polarized SAR images only (HH, VV) as the incidence wave is reflected in the same polarization. In contrast, the design of DLR transponders enables the re-transmission of both polarizations (H and V) simultaneously. This allows radiometric evaluations of all polarization channels including co-polarized SAR data products (HH and VV) and cross-polarized products (HV and VH).

1.6. ESA’s Processing Chain Approach for Sentinel-1

Although the pre-launch development of the Sentinel-1 SAR processor and the investigations carried out during the commissioning phase already allowed for the generation of high-quality SAR data, not all issues were already visible or fully understood at this time. Hence, the large-scale routine monitoring performed during operations, as well as the continuous evolution of the SAR processor, have been crucial for the maintenance and improvement of the overall Sentinel-1 data quality. Since only known issues can be considered at processing time, older (historical) SAR data products do not contain corrections which were introduced after their processing time.
One possible solution to overcome this problem would be to reprocess SAR data products on request with a selected optimized configuration and updated processor version. However, within the nominal ESA processing chain, reprocessing tasks are not foreseen for Sentinel-1. The advantage of this approach is that only a limited number of SAR data products for a given acquisition exists—usually one for each product type (e.g., L1-SLC or L1-GRD). The downside is that recent parameter changes and algorithmic updates which reflect the improved knowledge are not part of the historical data.
In particular, the change of the processing baseline within the mission archive leads to artificial biases in the backscatter characteristics of SAR data products processed with different radiometric configurations (e.g., antenna patterns). Although the overall target radiometric performance for the Sentinel-1 constellation is achieved over its lifetime (see annual performance reports for 2016 [28], 2017 [29], 2018 [30], 2019 [31], 2020 [32] and 2021 [33]), those steps are visible in backscatter time series focusing on the same area of interest. Such offsets can eventually lead to issues for applications which are extremely sensitive to radiometric changes.
The purpose of this study is to propose a method to re-compensate for artificial radiometric biases which are introduced by changes in the processing baseline (e.g., updates of antenna pattern or processing gains) without a full SAR data re-processing task. The following section describes the method and necessary data which have to be used for correcting for artificial radiometric biases due to updated processing parameters.

2. Method

2.1. Sentinel-1 SAR Data Processing Chain with Auxiliary Data

The SAR data processing of Sentinel-1 products is carried out within the Instrument Processing Facility (IPF). The level 1 (L1) processing algorithms and equations are implemented in the Sentinel-1 IPF software which includes, e.g., pre-processing, SLC processing, L1 post-processing and supporting algorithms [35]. In particular for IW and EW modes, specific processing concepts and algorithms are also included.
The additional needed input data to perform L1 (and L2) processing within the Sentinel-1 IPF are provided within specific auxiliary data files. In particular, for L1 SAR data products, the following auxiliary data files are used:
  • L1 Processor parameters auxiliary data (AUX_PP1),
  • Calibration auxiliary data (AUX_CAL),
  • Instrument auxiliary data (AUX_INS).
These data files contain information about the SAR instrument (AUX_INS), parameters and options for configuring the L1 processing (AUX_PP1) and for correcting and calibrating the SAR imagery (AUX_CAL). The content and format of the auxiliary data files are defined in specific xml-SAFE files [36]. The current and past used auxiliary data files related to all acquired Sentinel-1 SAR data products can be found at the SAR-MPC website (https://sar-mpc.eu/) (accessed on 27 January 2023).

2.2. History of Relevant Antenna Pattern Updates

High-level descriptions of the evolution of the Sentinel-1 products with respect to successive versions of the Sentinel-1 IPF can be found in a specific technical note [37] as well as within official annual performance reports provided by MPC [28,29,30,31,32,33]. The annual performance reports include related updates with regard to auxiliary data files, documented for each reported period. Table 2 summarizes antenna pattern updates for the two TOPS modes (IW and EW) applied in the operational processing chain related to changes in the IPF or auxiliary files. For these specific updates, artificial jumps in the radiometric performance due to antenna pattern updates are expected. The reasons for antenna pattern updates are due to instrument specific degradation (as the antenna failure of S1A in 2016) or improvements after specific calibration campaigns [38]. The main degradation of S1A is related to an antenna failure which occurred on 16 June 2016. Since then, a reduced power on tile 11 has been observed for rows 1 to 10 in the transmit path for both polarisation channels H and V [12,28].

2.3. Relevant Processing Information Needed for a Re-Compensation Procedure

IPF auxiliary data files (AUX_PP1, AUX_CAL, AUX_INS) are used as input during SAR data processing and contain information of applied processing parameters including the applied radiometric corrections. The unique file names of used auxiliary files are annotated within the manifest SAFE file of the related SAR data product. Furthermore, relevant information is also saved within the annotation files of SAR data products (e.g., L1 annotation). These data are compiled during the SAR data processing and provide additional information. The relevant processing information needed for re-compensation of the antenna pattern updates are summarized in Table 3.
The complex two-way elevation antenna pattern ( g E A P ) is annotated in the AUX_CAL file as well as in the related L1 annotation file. Within the AUX_CAL file, this antenna pattern is part of the “elevationAntennaPattern” section together with the related elevation antenna angle (see Figure 1). Note that the complex numbers (values in “elevationAntennaPatternType”) are annotated in an unusual way: although the numbers are listed sequentially as real and imaging part (I, Q, I, Q, …), the absolute value of each complex number (I, Q) does not have the meaning of amplitude but power gain (=amplitude2). This leads to the unusual correction of complex image data (see Equation (1) which is documented in [36]).
C o m p l e x D a t a C o r r e c t e d ( x , y ) = C o m p l e x D a t a ( x , y ) a b s ( C o m p l e x E A P ( x , y ) ) · p h a s e ( C o m p l e x E A P ( x , y ) )
Within the L1 annotation, the complex elevation antenna pattern is part of the “antennaPattern” section [39]. In addition to the antenna elevation angle, the related roll angle is also annotated so that the antenna pattern is available as a function of look angle (=antenna elevation angle + roll angle). In contrast to the auxiliary file, the complex numbers in the antenna pattern section of the L1 annotation have the usual meaning so that amplitudes and phases of the complex numbers can be directly converted from annotated real and imaginary sequences (I, Q, I, Q, …).
In addition to the elevation-angle-dependent antenna pattern, a specific processing gain ( g p r o c ) is applied during SAR data processing. This value is annotated within the AUX_PP1 file in the “slcSwathParams” section (see Figure 2). In contrast to the description in the specification document [36], currently the values within the xml files are annotated as amplitude values, not power gain values, which requires an additional square operation.
In order to allow the readers a double-check, an example of correct extracted gain values ( g p r o c ) for a specific AUX_PP1 product are computed and converted into dB in Table 4. Unfortunately, these specific processing gain values are not explicitly saved within the L1 annotation. As a consequence, an update of these gain values is not tracked by the L1 annotation. As these processing gains have been regularly updated in the past, it is necessary to use the complete history of auxiliary files (AUX_PP1) provided on the website https://sar-mpc.eu/ (accessed on 27 January 2023) for applying the proposed re-compensation procedure.
The absolute calibration constant g a b s C a l is annotated in both AUX_CAL and L1 annotation files. Currently, the same values are annotated for IW and EW modes which is 1 (0 dB) for S1A and 1.393 (1.4395 dB) for S1B. As these numbers are not changed during the relevant observation period, this parameter is not essentially necessary for the re-compensation procedure but mentioned for completeness in case of future updates.

2.4. Re-Compensation Procedure for Correcting Radiometric Biases due to Antenna Pattern Updates

The radar brightness β can be composed from Sentinel-1 SAR data products by applying the following formula:
β = D N i 2 A d n 2 · g a b s C a l
where D N i is the digital number of the complex image pixel at location i, A d n is the annotated pixel scaling for radar brightness and g a b s C a l the annotated absolute calibration constant [39]. The complex digital numbers are the result of various operations during SAR data processing, including the application of the elevation antenna gain g E A P and applied processing gain g p r o c (see Table 3). For the re-compensation procedure, the effect of these (original) applied gain corrections have to be reverted, and the updated (new) gain values have to be re-applied. This can be conducted using the following processing steps:
  • Extract the radar brightness β o r i g i n a l from SAR data products according to Equation (2).
  • Extract original (old) applied gain g E A P o r i g i n a l and current (new) gain g E A P n e w related to the elevation antenna pattern for a given range position. While the original gain can be extracted from an L1 annotation file, the current (new) gain has to be extracted from AUX_CAL files.
  • Extract original (old) applied processing gain g p r o c o r i g i n a l and current (new) processing gain to be applied g p r o c n e w , both as a function of mode and polarization from corresponding AUX_PP1 files.
  • Extract original applied absolute calibration constant g a b s C a l o r i g i n a l from an L1 annotation file and current (new) calibration constant g a b s C a l n e w to be applied from an AUX_CAL file.
  • Calculate corrected backscatter β n e w according to Equation (3) with all input gain values in dB.
β n e w [ d B ] = β o r i g i n a l + g E A P o r i g i n a l g E A P n e w g p r o c o r i g i n a l + g p r o c n e w g a b s C a l o r i g i n a l + g a b s C a l n e w
By applying the re-compensation procedure according to Equation (3), artificial jumps in the radiometric backscatter timeline due to antenna pattern updates will be removed. Note that the re-compensation of the absolute calibration constant (Step 4) was not necessary for the analyzed observation period, but it is mentioned here for completeness as it could be necessary for future SAR data products.

3. Results

3.1. Evaluating Test Cases

For test purposes, a limited number of SAR data products containing point targets responses from the DLR calibration site have been processed with different configurations (elevation antenna pattern and corresponding auxiliary products). That means that in addition to the original L1 SAR data product, which was created by the nominal processing chain, an additional re-processing was performed using the same SAR data acquisition L0 product but with different auxiliary data and a given IPF version. The input parameters (auxiliary files and IPF version) used for the SAR data processing of both original and reprocessed data are summarized in Table 5.
The radar cross section of each reference target response was evaluated and the difference between results derived from original and reprocessed SAR data products was calculated for the two test cases acquired on 3 August 2019 and 11 July 2017. This derived backscatter difference is finally compared with the predicted offsets between used configurations according to Equation (3). The data-take corresponding to the 3 August 2019 test case was acquired in a descending orbit direction. In this SAR data product, four reference targets could be evaluated. For the 11 July 2017 test case, acquired in an ascending direction, six reference targets were available. Note that while the used trihedral corner reflectors produce responses for co-polarization channels, the used transponders were operated for co- and cross-polarized channels.
The evaluated results for the 3 August 2019 and 11 July 2017 test cases are listed in detail for each available reference target and polarization channel in Table 6 and Table 7, respectively. Although the backscatter difference reaches up to 0.4 dB between evaluated SAR data product versions, this offset is sufficiently predicted by Equation (3). The remaining deviation between the derived RCS difference (between original and reprocessed SAR data products) and the predicted backscatter offset is below 0.04 dB. This low remaining difference is thought to be due to numerical errors from SAR data processing and point target evaluation.

3.2. Long-Term Monitoring Results

Sentinel-1 acquisitions (S1A and S1B) over the DLR calibration site were used for long-term monitoring of the radiometric performance. As these targets have been operated since the commissioning phases of S1A and S1B, adequate data acquisitions are available which cover an observation period lasting several years. From the corresponding SLC L1 SAR data products, the target impulse responses are evaluated for S1A and S1B. Then, the RCS is derived from each impulse response and compared with the nominal reference value of the corresponding target. In terms of radiometric calibration, it is the deviation from the absolute calibration factor which is also annotated in the SAR data products valid for all modes and all polarizations of the SAR system. The deviation of the absolute calibration factor can be used as an indicator of the radiometric performance of the SAR system; it is a measure for the radiometric stability and radiometric accuracy of the SAR system.
The deviation of the absolute calibration factor derived from measurements over the DLR calibration site is depicted in Figure 3. While the top subplot shows results from S1A acquisitions, the bottom subplot contains S1B results. Each single point represents the deviation of the calibration factor derived from the impulse response function of a certain target for a certain acquisition. The results from the VV polarization channel are marked in red; the results from the VH polarization channel are marked in blue.
Figure 3 is based on original SAR data (L1 SLC products available, e.g., at S1 datahub) which were created by the operational processing chain with processing parameters valid and used at processing time. The vertical lines mark the dates when updates of the antenna pattern were applied in the nominal processing chain (see Table 2). These updates produce artificial steps (offsets) in the radiometric performance which are clearly visible.
The effect of the applied re-compensation according to Equation (3) is depicted in Figure 4. Based on the same SAR data products (L1 SLC products), the described correction procedure was applied without further reprocessing of the SAR data products. As a consequence of the successful application of the proposed method, the artificial steps in the radiometric performance due to antenna pattern updates are vanished and are finally no longer visible in the timeline within Figure 4. The remaining outliers are thought to be mostly due to unstable weather conditions, e.g., strong rain or snow.
Using the proposed correction method, the acquisitions over the DLR calibration site and over a period of 57 months (from April 2017–December 2021) can be used to derive the radiometric accuracy for both Sentinel-1 SAR systems. The mean values and standard deviations for the derived absolute calibration factor without and with the proposed compensation are summarized in Table 8 for S1A and S1B. By applying the re-compensation, the overall standard deviation is reduced for S1A from 0.22 dB to 0.20 dB, while the overall mean value moves by about 0.2 dB from −0.10 dB to +0.09 dB (see Table 8). For S1B, the standard deviation remains constant at 0.21 dB with a mean value difference of 0.14 dB considering results without and with compensation; this indicates less strong antenna pattern updates for this unit in the past.
For interpreting the results in Table 8, it should be mentioned that the balancing of the antenna pattern and updating the elevation antenna pattern (see Table 2) was exclusively conducted by using rainforest acquisitions in the past. Considering this fact, the current study can be seen as an independent verification measurement. For future antenna pattern updates of Sentinel-1, it is strongly recommended to consider accurate reference targets also for radiometric balancing over the antenna elevation angle range.
Furthermore, the calibration factor dependency from the antenna elevation angle is investigated for the point target time series. For this purpose, the derived calibration factors are grouped by acquisition geometry. As the targets are usually observed with different acquisition conditions (different sub-swathes, ascending or descending orbit, different relative orbit numbers), the look angles of the targets differ between acquisitions. As the Sentinel-1 spacecraft is operated with a repeat cycle of 12 days, the same geometric conditions are repeated, and the targets are observed by the SAR instrument with recurrent and (nearly) constant antenna elevation angles. For the long-term monitoring period, the 6 reference targets are visible under 17 different antenna elevation angles, each of this configuration represented by a sufficient number of measurements (between 100 and 150).
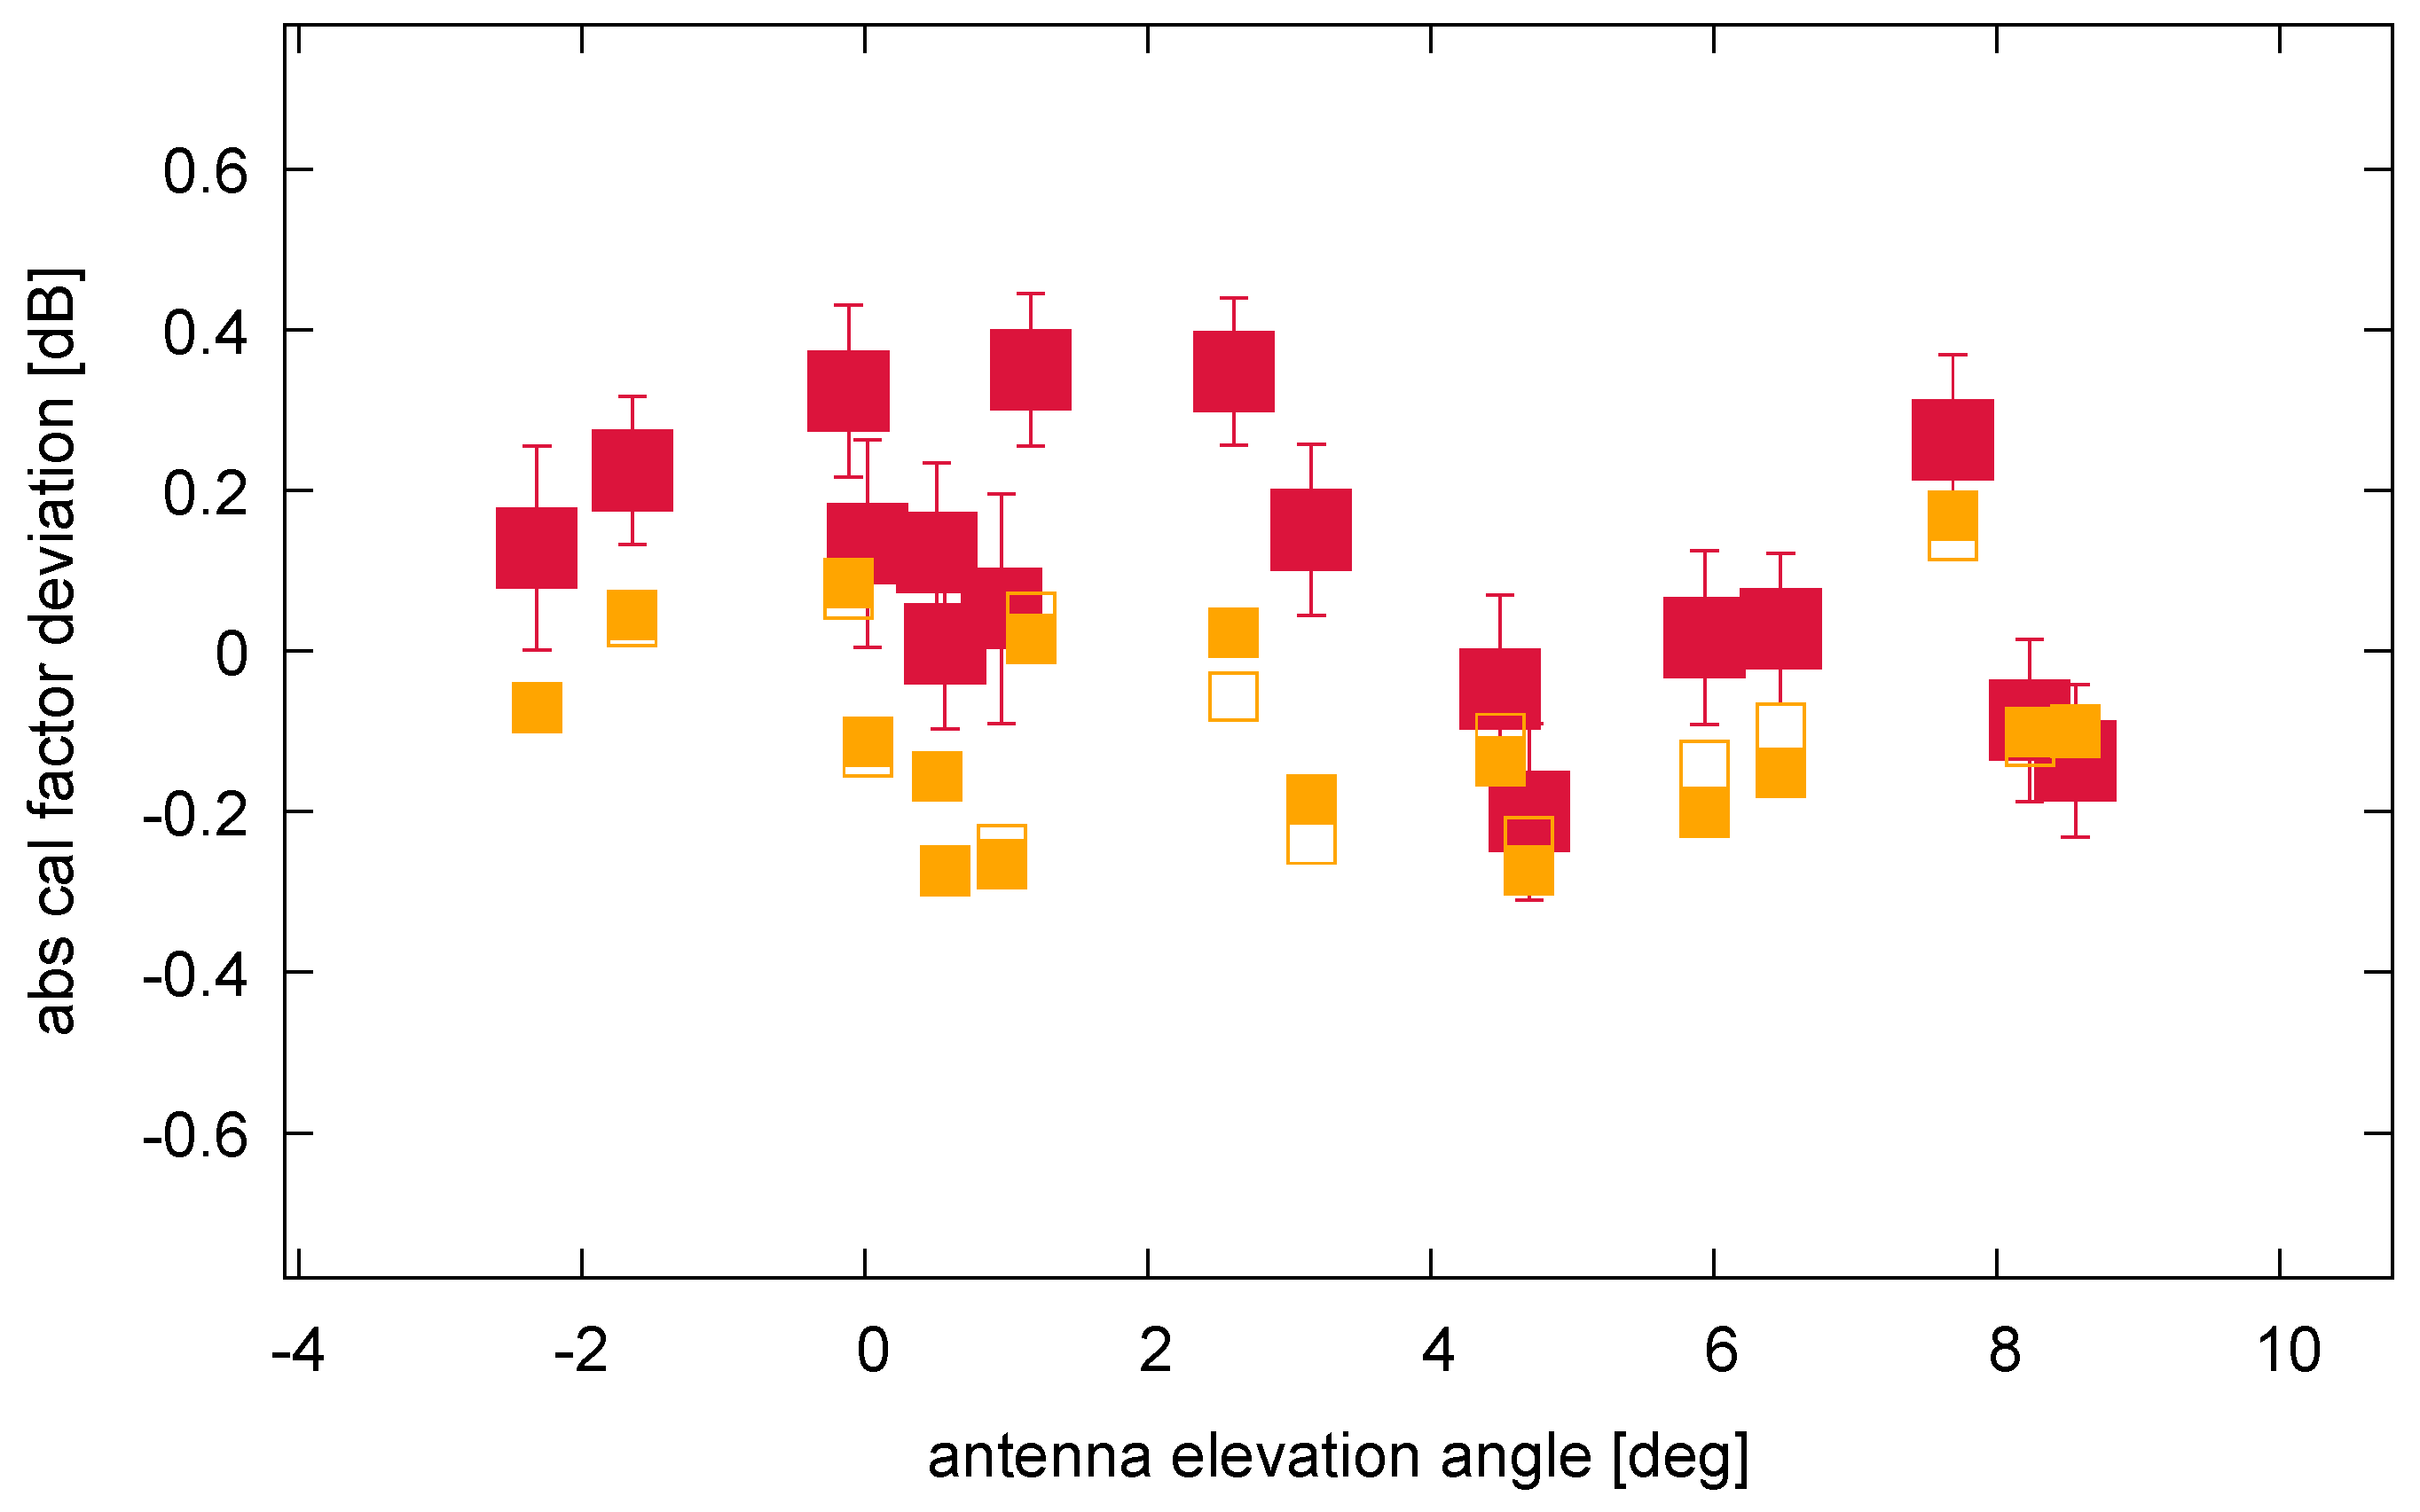
The dependency of the calibration factor as a function of antenna elevation angle is depicted in Figure 5 and Figure 6 for S1A and S1B, respectively. Each symbol represents the reference target measurement with a specific geometric condition (and antenna elevation angle) which is repeated. The red solid squares and red error bars depict the mean values and standard deviations derived from the time series considering the proposed antenna pattern compensation for the current configuration.
The orange solid and open squares within Figure 5 and Figure 6 represent mean values if antenna patterns from previous antenna pattern configurations are used for re-compensation. The radiometric differences between the symbols at the same antenna elevation angle indicate the changed pattern compensation between the used configurations which reach up to 0.5 dB. If the SAR data are not corrected for the related antenna pattern and processing gain configurations, these systematic errors remain and are present, e.g., as jumps in the backscatter timeline for observed targets at this elevation angle at the date of update activation (see Table 2).
Furthermore, the small error bars in Figure 5 and Figure 6 indicate that the gain deviation for a certain target configuration with a certain antenna elevation angle is low, in the order of 0.1 dB. In fact, the variation is slightly lower for S1B compared to S1A, indicating a lower instrument variation of S1B compared to S1A. In contrast to this, the variation of the mean values over the elevation angle is higher in the order of ±0.2 dB for S1A and about ±0.3 dB for S1B. That means that the radiometric accuracy could be slightly improved in the future with an updated antenna pattern.

4. Conclusions

This paper introduces a method for correcting artificial radiometric biases within Sentinel-1 SAR data products which are due to specific antenna elevation patterns and processing gains applied at the time of their processing. The re-compensation proceeds by reverting the used antenna elevation pattern, the specific processing gains, and the absolute calibration constant and then re-applying it with updated values. The advantage of the proposed solution is that a full reprocessing of SAR data products is not necessary. The updated values can be taken from auxiliary files which are officially provided on the MPC website. By applying the proposed re-compensation method for long time series, it can be ensured that the same parameters are used for all evaluated SAR data products. In this case, historical updates of the antenna patterns and processing gains no longer produce radiometric biases.
The proposed method was applied to almost a five-year observation period of acquisitions from S1A and S1B over the DLR calibration site. By evaluating the target responses for the respective look angles, artificial steps due to antenna pattern updates are clearly visible using the original created SAR data products available on official websites (e.g., copernicus scihub). After applying the proposed re-compensation method, these biases disappear. By comparing the proposed method with exemplary data reprocessed with updated processing parameters, the remaining radiometric error was estimated to be below 0.04 dB which indicates the numerical error from SAR data processing and target evaluation. By applying the re-compensation method on the full observation period, the standard deviation for the derived absolute calibration factor was reduced for S1A from 0.22 dB to 0.20 dB (both 1 σ ). For S1B this overall standard deviation remains at 0.21 dB, indicating less strong antenna pattern updates for this unit in the past.

Author Contributions

Conceptualization and analysis, K.S.; supervision, M.S.; writing—original draft preparation, K.S.; writing—review and editing, M.S., G.H., P.V., A.R. and M.P. All authors have read and agreed to the published version of the manuscript.

Funding

The results presented here are outcome of the ESA contract Sentinel-1/SAR Mission Performance Cluster Service 4000135998/21/I BG. Copernicus Sentinel-1 mission is funded by the EU and ESA. The views expressed herein can in no way be taken to reflect the official opinion of the European Space Agency or the European Union.Remotesensing 15 01377 i001

Data Availability Statement

The data presented in this study are available on request from the corresponding author.

Acknowledgments

The authors acknowledge the DLR calibration team for their support related to the point target operation and maintenance (transponders and corner reflectors), namely Sebastian Raab, Klaus Weidenhaupt, Jens Reimann, Anna Maria Büchner, Jakob Giez, and Matthias Jirousek.

Conflicts of Interest

The authors declare no conflict of interest.

References

  1. Torres, R.; Snoeij, P.; Geudtner, D.; Bibby, D.; Davidson, M.; Attema, E.; Potin, P.; Rommen, B.; Floury, N.; Brown, M.; et al. GMES Sentinel-1 mission. Remote. Sens. Environ. 2012, 120, 9–24. [Google Scholar] [CrossRef]
  2. Attema, E.; Snoeij, P.; Davidson, M.; Floury, N.; Levrini, G.; Rommen, B.; Rosich, B. The European GMES Sentinel-1 Radar Mission. In Proceedings of the IGARSS 2008, IEEE International Geoscience and Remote Sensing Symposium, Boston, MA, USA, 6–11 July 2008; IEEE: Piscataway, NJ, USA, 2008; Volume 1, pp. 1–94. [Google Scholar]
  3. European Space Agency. Sentinel-1 Mission Requirements Document; Number ES-RS-ESA-SY-0007, issue: 1.4; European Space Agency: Paris, France, 11 July 2005. [Google Scholar]
  4. The European Space Agency. Ride into Orbit Secured for Sentinel-1B. Available online: https://www.esa.int/Applications/Observing_the_Earth/Copernicus/Sentinel-1/Mission_ends_for_Copernicus_Sentinel-1B_satellite (accessed on 27 January 2023).
  5. ESA Sentinel-1 Team. Mission Status Report #1. 2014. Available online: https://sentinel.esa.int/documents/247904/1484135/Sentinel-1-Mission-Status-Report-1-Period-3-7-April-2014.pdf (accessed on 27 January 2023).
  6. ESA Sentinel-1 Team. Mission Status Report #25. 2014. Available online: https://sentinel.esa.int/documents/247904/1484135/Sentinel-1-Mission_Status_Report_25-Period_19-25_September_2014 (accessed on 27 January 2023).
  7. ESA Sentinel-1 Team. Mission Status Report #26. 2014. Available online: https://sentinel.esa.int/documents/247904/1484135/Sentinel-1-Mission_Status_Report_26-Period_26_September-6_October_2014 (accessed on 27 January 2023).
  8. Miranda, N. Sentinel-1A TOPS Radiometric Calibration Refinement. Technical Report, European Space Agency. 2015. Available online: https://sentinel.esa.int/documents/247904/2142675/Sentinel-1A_TOPS_Radiometric_Calibration_Refinement (accessed on 27 January 2023).
  9. ESA Sentinel-1 Team. Mission Status Report #103. 2016. Available online: https://sentinel.esa.int/documents/247904/2214416/Sentinel-1-Mission_Status_Report_103-Period_19-25_April_2016 (accessed on 27 January 2023).
  10. ESA Sentinel-1 Team. Mission Status Report #105. 2016. Available online: https://sentinel.esa.int/documents/247904/2214416/Sentinel-1-Mission_Status_Report_105-Period_3-9_May_2016 (accessed on 27 January 2023).
  11. ESA Sentinel-1 Team. Mission Status Report #124. 2016. Available online: https://sentinel.esa.int/documents/247904/2214416/Sentinel-1-Mission_Status_Report_124-Period_13-19_Sep_2016.pdf (accessed on 27 January 2023).
  12. MPC-S1. Sentinel-1A Tile #11 Failure. Technical Report OI-MPC-ACR MPC-0324, Issue: 1.2, CLS Brest, 13-10-2016. Available online: https://sentinels.copernicus.eu/documents/247904/685163/Sentinel-1A_Antenna_Failures_Impact.pdf (accessed on 27 January 2023).
  13. ESA Sentinel-1 Team. Mission Status Report #126. 2016. Available online: https://sentinel.esa.int/documents/247904/2214416/Sentinel-1-Mission_Status_Report_126-Period_27_Sep-3_Oct_2016.pdf (accessed on 27 January 2023).
  14. ESA Sentinel-1 Team. Mission Status Report #387. 2016. Available online: https://sentinel.esa.int/documents/247904/4742744/Sentinel-1+Mission+Status+Report+387+-+Period+21+Dec+2021+-+3+Jan+2022.pdf/985d5c66-73d3-4a63-fbf8-ace4d36c820b?t=1641296519563 (accessed on 27 January 2023).
  15. ESA Sentinel-1 Team. Mission Status Report #126. 2022. Available online: https://sentinel.esa.int/documents/247904/4742744/Sentinel-1-Mission_Status_Report_410-Period-12_Jul-4_Aug_2022.pdf (accessed on 27 January 2023).
  16. The European Space Agency. Ride into Orbit Secured for Sentinel-1C. Available online: https://www.esa.int/Applications/Observing_the_Earth/Copernicus/Sentinel-1/Ride_into_orbit_secured_for_Sentinel-1C (accessed on 27 January 2023).
  17. European Space Agency. Sentinel-1: ESA’s Radar Observatory Mission for GMES Operational Services; Number ESA SP-1322, 03/2012. Available online: https://sentinel.esa.int/documents/247904/349449/s1_sp-1322_1.pdf (accessed on 27 January 2023).
  18. Karvonen, J. Baltic Sea Ice Concentration Estimation From C-Band Dual-Polarized SAR Imagery by Image Segmentation and Convolutional Neural Networks. IEEE Trans. Geosci. Remote. Sens. 2022, 60, 2871–2883. [Google Scholar] [CrossRef]
  19. Liang, D.; Guo, H.; Zhang, L.; Cheng, Y.; Zhu, Q.; Liu, X. Time-series snowmelt detection over the Antarctic using Sentinel-1 SAR images on Google Earth Engine. Remote. Sens. Environ. 2021, 256, 112318. [Google Scholar] [CrossRef]
  20. Kaplan, G.; Fine, L.; Lukyanov, V.; Manivasagam, V.S.; Tanny, J.; Rozenstein, O. Normalizing the Local Incidence Angle in Sentinel-1 Imagery to Improve Leaf Area Index, Vegetation Height, and Crop Coefficient Estimations. Land 2021, 10, 680. [Google Scholar] [CrossRef]
  21. Modanesi, S.; Massari, C.; Gruber, A.; Lievens, H.; Tarpanelli, A.; Morbidelli, R.; De Lannoy, G.J.M. Optimizing a backscatter forward operator using Sentinel-1 data over irrigated land. Hydrol. Earth Syst. Sci. 2021, 25, 6283–6307. [Google Scholar] [CrossRef]
  22. Pulella, A.; Aragão Santos, R.; Sica, F.; Posovszky, P.; Rizzoli, P. Multi-Temporal Sentinel-1 Backscatter and Coherence for Rainforest Mapping. Remote. Sens. 2020, 12, 847. [Google Scholar] [CrossRef] [Green Version]
  23. Mouche, A.A.; Chapron, B.; Zhang, B.; Husson, R. Combined Co- and Cross-Polarized SAR Measurements Under Extreme Wind Conditions. IEEE Trans. Geosci. Remote. Sens. 2017, 55, 6746–6755. [Google Scholar] [CrossRef]
  24. Schwerdt, M.; Schmidt, K.; Tous Ramon, N.; Castellanos Alfonzo, G.; Döring, B.; Zink, M.; Prats, P. Independent Verification of the Sentinel-1A System Calibration. IEEE J. Sel. Top. Appl. Earth Obs. Remote. Sens. 2016, 9, 994–1007. [Google Scholar] [CrossRef]
  25. Schwerdt, M.; Schmidt, K.; Ramon, N.T.; Klenk, P.; Yague-Martinez, N.; Prats-Iraola, P.; Zink, M.; Geudtner, D. Independent System Calibration of Sentinel-1B. Remote Sens. 2017, 9, 511. [Google Scholar] [CrossRef] [Green Version]
  26. Schmidt, K.; Tous Ramon, N.; Schwerdt, M. Radiometric Accuracy and Stability of Sentinel-1A Determined using Point Targets. Int. J. Microw. Wirel. Technol. 2018, 10, 538–546. [Google Scholar] [CrossRef] [Green Version]
  27. Schmidt, K.; Schwerdt, M.; Miranda, N.; Reimann, J. Radiometric Comparison within the Sentinel-1 SAR Constellation over a Wide Backscatter Range. Remote. Sens. 2020, 12, 854. [Google Scholar] [CrossRef] [Green Version]
  28. MPC-S1. S-1A & S-1B Annual Performance Report for 2016, Number DI-MPC-APR MPC-0366, Issue: 1.1, 04/04/2017. Available online: https://sentinels.copernicus.eu/documents/247904/2370914/Sentinel-1-Annual-Performance-Report-2016.pdf/10a0b8b1-eb92-4dca-a94d-abe683dab301?t=1495614896000 (accessed on 27 January 2023).
  29. MPC-S1. S-1A & S-1B Annual Performance Report for 2017, Number DI-MPC-APR MPC-0410, Issue: 1.1, 19/10/2018. Available online: https://sentinel.esa.int/documents/247904/2833011/Sentinel-1-Annual-Performance-Report-2017.pdf/af15447c-2c77-4675-8aa8-224efde9d6a3?t=1539970490000 (accessed on 27 January 2023).
  30. MPC-S1. S-1A & S-1B Annual Performance Report for 2018, Number DI-MPC-APR MPC-0436, Issue: 1.1, 17/05/2019. Available online: https://sentinel.esa.int/documents/247904/3406423/Sentinel-1-Annual-Performance-Report-2018.pdf/c2be7ba1-2174-4463-b63d-817d3667c582?t=1558108544000 (accessed on 27 January 2023).
  31. S-1A & S-1B Annual Performance Report for 2019, Number DI-MPC-APR MPC-0460, Issue: 1.1, 30/04/2020. Available online: https://sentinel.esa.int/documents/247904/3779678/Sentinel-1-Annual-Performance-Report-2019.pdf/e4cb96e5-7384-4a52-ba32-464b8766e83a?t=1591975310000 (accessed on 27 January 2023).
  32. MPC-S1. S-1A & S-1B Annual Performance Report for 2020, Number DI-MPC-APR MPC-0504, Issue: 1.1, 16/03/2021. Available online: https://sentinel.esa.int/documents/247904/4074738/Sentinel-1-Annual-Performance-Report-2020.pdf/1eac12a7-26ca-002c-b3ff-78f6a1d77653 (accessed on 27 January 2023).
  33. MPC-S1. S-1A & S-1B Annual Performance Report for 2021, Number DI-MPC-APR MPC-0523, Issue: 1.1, 04/03/2022. Available online: https://sentinel.esa.int/documents/247904/4776203/DI-MPC-APR-523-1-1-Annual+Performance+Report+2021.pdf/9a5bf9a7-b8b7-4b6b-e3c0-ce23bdb565b8?t=1646808727067 (accessed on 27 January 2023).
  34. Rudolf, D.; Raab, S.; Döring, B.J.; Jirousek, M.; Reimann, J.; Schwerdt, M. Absolute radiometric calibration of the novel DLR “Kalibri” transponder. In Proceedings of the 2015 German Microwave Conference, Nürnberg, Germany, 16–18 March 2015; IEEE: Piscataway, NJ, USA, 2015; pp. 323–326. [Google Scholar]
  35. MPC-S1. Sentinel-1 Level 1 Detailed Algorithm Definition. Technical Report SEN-TN-52-7445 DI-MPC-IPFDPM MPC-0307, Rev: 2.4, European Space Agency, 07/01/2022. Available online: https://sentinels.copernicus.eu/documents/247904/1877131/S1-TN-MDA-52-7445_Sentinel-1+Level+1+Detailed+Algorithm+Definition_v2-4.pdf/83624863-6429-cfb8-2371-5c5ca82907b8?t=1644837167582 (accessed on 27 January 2023).
  36. SAR-MPC. Sentinel-1 IPF Auxiliary Product Specification. Technical Report S1-RS-MDA-52-7443 MPC-0241, Rev: 3.10, CLS Brest, 17/11/2022. Available online: https://sentinel.esa.int/documents/247904/1877131/DI-MPC-PB-0241-3-10_Sentinel-1IPFAuxiliaryProductSpecification.pdf/ae025687-c3e3-6ab0-de8d-d9cf58657431?t=1669115416469 (accessed on 27 January 2023).
  37. SAR-MPC. Release Note of S-1 IPF for End Users of Sentinel-1 Products. Technical Report DI-MPC-IPFRN MPC-0389, Issue: 1.0, CLS Brest, 16/01/2018. Available online: https://sentinel.esa.int/documents/247904/2142675/S-1-IPF-Sentinel-1-products-Release-Note.pdf (accessed on 27 January 2023).
  38. Schmidt, K.; Schwerdt, M.; Hajduch, G.; Vincent, P.; Recchia, A.; Miranda, N. Towards an improved Radiometric Accuracy for Sentinel-1 with optimized Elevation Antenna Patterns. In Proceedings of the EUSAR 2022; 14th European Conference on Synthetic Aperture Radar, Proceedings of VDE, Leipzig, Germany, 25–27 July 2022. [Google Scholar]
  39. MPC S1. Sentinel-1 Product Specification. Technical Report S1-RS-MDA-52-7441, DI-MPC-PB MPC-0240, Issue: 3.12, European Space Agency, 19/09/2022. Available online: https://sentinel.esa.int/documents/247904/4846490/S1-RS-MDA-52-7441_3_12_Sentinel-1ProductSpecification.pdf/e4cd7bbd-5e86-41f7-4823-d13c545853b0 (accessed on 27 January 2023).
Figure 1. Graphical view of the calibration auxiliary data (AUX_CAL) which contains mode and polarization dependent elevation antenna pattern applied during SAR data processing (from [36]).
Remotesensing 15 01377 g001
Figure 2. Graphical view of SLC processing parameter section within the AUX_PP1 file which contains the mode and polarization dependent gain applied during SAR data processing (from [36]).
Remotesensing 15 01377 g002
Figure 3. Deviation of the absolute calibration factor derived from measurements over the DLR calibration site covering almost five years observation time for S1A (top) and S1B (bottom) using IW mode acquisitions with VV polarization (red) and VH polarization (blue).
Remotesensing 15 01377 g003
Figure 4. Deviation of the absolute calibration factor as shown in Figure 2 but with applied corrections according to Equation (3).
Remotesensing 15 01377 g004
Figure 5. S1A deviation of the absolute calibration factor as a function of antenna elevation angle for the VV-polarization channel derived from reference point targets. Red solid squares and red error bars depict the re-compensated mean values and standard deviation for the calibration factor deviation measured for targets under a certain (constant) antenna elevation angle. Orange solid squares and orange open squares depict re-compensated mean values if previous antenna pattern configurations would be used.
Remotesensing 15 01377 g005
Figure 6. Deviation of the absolute calibration factor as a function of antenna elevation angle as shown in Figure 5 but for S1B.
Remotesensing 15 01377 g006
Table 1. Major events of the Sentinel-1 mission.
DateEventReference
3 Apr 2014S1A launch[5]
23 Sept 2014S1A commissioning phase completed with successful In-Orbit Commissioning Phase Review (IOCR)[6]
3 Oct 2014Opening of the Sentinel-1 data flow to all users[7]
25 Nov 2015Activating of radiometric refinement for S1A[8]
25 Apr 2016S1B launch[9]
29 Apr 2016S1B commissioning phase started[10]
14 Sept 2016S1B commissioning phase completed with successful In-Orbit Commissioning Phase Review (IOCR)[11]
16 June 2016S1A major antenna failure occurred[12]
26 Sept 2016Routine operation for S1B started[13]
23 Dec 2021S1B last nominal operation[14]
3 Aug 2022S1B end of mission announcement[15]
First half of 2023Planned launch of S1C[16]
Table 2. Antenna pattern updates for TOPS modes (IW and EW mode) applied for the operational processing chain.
Update ActivatedS1AS1B
28 Mar 2017Initial version of SAR data processor which allows traceability in case of pattern changing (IPF 2.82)
22 May 2017Recalibration due to tile #11 failure: IW, EW (both: DV + DH)
13 Mar 2018 IW, EW (both: DV + DH)
21 Feb 2019IW-DV
31 July 2019EW-DV
12 May 2020 IW-DV
15 Dec 2020EW-DHEW (DV + DH)
4 Jan 2021IW-DHIW-DH
Table 3. Relevant processing information (gain) needed for re-compensation of elevation antenna pattern updates.
ParameterDesciptionSource
g E A P Gain from complex elevation antenna pattern as a function of elevation angle applied during SAR data processingAUX_CAL L1 annotation
g p r o c Specific processing gain applied during SAR data processingAUX_PP1
g a b s C a l Absolute calibration factorAUX_CAL L1 annotation
Table 4. Processing gain g p r o c in dB for SLC L1 products with IW mode extracted from the L1 processor parameter file S1B_AUX_PP1_V20160422T000000_G20210104T140029.SAFE.
Sub-SwathHHHVVVVH
IW1120.409702120.309702120.679702120.949702
IW2119.933753119.755340120.036628120.389618
IW3120.528769120.043750120.282247120.701613
Table 5. Input parameters used for test case evaluations.
Test CaseProduct Information
3 Aug 2019 original productS1B_IW_SLC__1SDV_20190803T053358_20190803T053426_017417_020C1C_8FAD
  • S1B_AUX_PP1_V20160422T000000_G20190626T095204
  • S1B_AUX_CAL_V20160422T000000_G20190626T094625
  • S1B_AUX_INS_V20160422T000000_G20190130T102942
  • Sentinel-1 IPF version: 3.10
3 Aug 2019 reprocessed productS1B_IW_SLC__1SDV_20190803T053358_20190803T053426_017417_020C1C_4B88
  • S1B_AUX_PP1_V20160422T000000_G20210104T140029
  • S1B_AUX_CAL_V20160422T000000_G20210104T140113
  • S1B_AUX_INS_V20160422T000000_G20190130T102942
  • Sentinel-1 IPF version: 3.31
11 July 2017 original productS1B_IW_SLC__1SDV_20170711T170627_20170711T170654_006443_00B539_59BA
  • S1B_AUX_PP1_V20160422T000000_G20170328T093014
  • S1B_AUX_CAL_V20160422T000000_G20170328T092822
  • S1B_AUX_INS_V20160422T000000_G20160922T094114
  • Sentinel-1 IPF version: 2.82
11 July 2017 reprocessed productS1B_IW_SLC__1SDV_20170711T170626_20170711T170653_006443_00B539_169F
  • S1B_AUX_PP1_V20160422T000000_G20210104T140029
  • S1B_AUX_CAL_V20160422T000000_G20210104T140113
  • S1B_AUX_INS_V20160422T000000_G20190130T102942
  • Sentinel-1 IPF version: 3.31
Table 6. RCS differences due to different used product versions derived from SAR data acquisition of 3 August 2019.
Target-IDPolarizationDerived RCS Difference [dB] from SAR ImagesPredicted Backscatter Difference [dB] According to Equation (3)Remaining Difference [dB]
D38VV0.3450.3250.020
D40VV0.1980.234−0.036
D40VH0.2610.294−0.033
D41VV0.1980.1760.022
D41VH0.3010.2780.022
D42VV0.2100.1990.010
Table 7. RCS differences due to different used product versions derived from SAR data acquisition of 11 July 2017.
Target-IDPolarizationDerived RCS Difference [dB] from SAR ImagesPredicted Backscatter Difference [dB] According to Equation (3)Remaining Difference [dB]
D38VV0.2610.2600.001
D39VV0.2830.2790.004
D39VH0.1930.1830.010
D40VV0.3200.3070.013
D40VH0.1500.1340.016
D41VV0.3680.406−0.037
D41VH0.2360.276−0.040
D42VV0.3920.3850.006
D43VV0.0830.0620.021
Table 8. Mean values and standard deviations for the derived absolute calibration factor without and with proposed compensation.
SAR SystemWithout CompensationWith Compensation
μ  ±  σ μ  ±  σ
S1A−0.10 dB ± 0.22 dB0.09 dB ± 0.20 dB
S1B−0.10 dB ± 0.21 dB0.04 dB ± 0.21 dB
Disclaimer/Publisher’s Note: The statements, opinions and data contained in all publications are solely those of the individual author(s) and contributor(s) and not of MDPI and/or the editor(s). MDPI and/or the editor(s) disclaim responsibility for any injury to people or property resulting from any ideas, methods, instructions or products referred to in the content.

