Abstract
Spatial land surface heterogeneities are widespread at various scales and represent a great challenge to leaf area index (LAI) retrievals and product validations. In this paper, considering the mixed water and vegetation pixels prevalent at moderate and low resolutions, we propose a methodological framework for conducting global comparisons of heterogeneous land surfaces based on criterion setting and a global search of high-resolution data. We construct a global network, Heterogeneous Surface Network aiming Water and Vegetation Mixture (HESNet-WV), comprised of three vegetation types: grassland, evergreen broadleaf forests (EBFs), and evergreen needle forests (ENFs). Validation is performed using the MCD15A3H Global 500-m/4-day and GLASS 500-m/8-day LAI products. As the water area fraction (WAF), LAI values and LAI inversion errors increase in the MODIS and GLASS products, the GLASS product errors (relative LAI error (RELAI): 94.43%, bias: 0.858) are lower than the MODIS product errors (RELAI: 124.05%, bias: 1.209). The result indicates that the proposed framework can be applied to evaluate the accuracy of LAI values in mixed water-vegetation pixels in different global LAI products.
1. Introduction
Leaf Area Index (LAI), which is defined as the ratio of the total plant leaf area to land area [1], has been listed as an essential climate variable (ECV) by the Global Climate Observation System [2]. Over the last decade, many global LAI products have become available [3,4,5,6]. To better utilize these existing LAI products, it is imperative to evaluate their accuracy and quantify the strengths and weaknesses of different products [7,8].
According to the definition of product validation output by the Land Products Validation Working Group under the Committee on Earth Observation Satellite, LAI product validation methods are mainly divided into direct and indirect validation types [9]. Both approaches are primarily conducted on pure pixels representing different vegetation types on homogeneous land surfaces [9,10,11,12]. For example, the BELMANIP network, used for intercomparison of biophysical products over specific homogeneous land surface types, frequently appears in LAI product validation [9,11,12,13]. However, most LAI products are generated from remotely sensed images with medium and low spatial resolutions [14,15], such as 500 m, 1 km, and even coarser resolutions. An analysis of global land surface heterogeneous characteristics at a 1-km resolution based on a 30-m landcover classification map indicated that the proportion of pure pixels was only 35%. In comparison, the heterogeneous pixels reached 65% globally [16]. Therefore, conducting accuracy evaluations over only homogeneous surfaces cannot represent the overall quality of LAI products. Widely heterogeneous pixel scenes in moderate- and low-resolution pixel grids cannot be neglected in global LAI product validations.
As the scope and scale of the relevant research have deepened, a validation framework that is specific to heterogeneous land surfaces has gradually been developed. The Validation of Land European Remote Sensing Instruments (VALERI) project proposed a “bottom-up” validation approach, based on a two-stage sampling strategy to reconcile the scale of LAI ground measurements with that of the product pixels using high-resolution images [17]. Xu et al. [18] proposed a method for evaluating the spatial representativeness of station-derived LAI observations by dividing the station observations into five representativeness levels, based on three indicators. The spatial representativeness of the Chinese Ecosystem Research Network (CERN) LAI observations was evaluated by applying this method to a 1 km pixel grid for the validation of 1 km resolution products. Additionally, Xu et al. [19] further proposed the grading and upscaling of ground measurements (GUGM) approach by integrating spatial representativeness grading and a spatial upscaling strategy to resolve the scale mismatch issue. The validation methods developed for heterogeneous surfaces have gradually improved. However, the existing ground measurements obtained over heterogeneous surfaces are inadequate to assess the inversion accuracies of global LAI products with heterogeneous pixels [20].
Among all kinds of mixed pixels, the mixture of water and vegetation land surfaces is the most common mixing pattern found at the pixel scale [21]. To date, several studies have shown that the presence of water-mixed heterogeneity has a significant impact on LAI inversion [22,23,24]. Xu et al. [21] found that the LAI retrieval error is proportional to the water area fraction (WAF) in pixels and that the average LAI calculated for all land surfaces in Canada is 13% less than the correct LAI value obtained when the impact of open water is not considered. The reflectance of mixed water-vegetation pixels is significantly lower than that of vegetation alone, due to the strong absorption characteristics of water bodies in the red and near-infrared bands, introducing errors of over 70% to LAI inversion results [25]. Based on the results obtained at the 500-m pixel scale with a 30-m land cover classification map, mixed water-vegetation pixels are distributed across the main global continents, and mixed pixels that contain water cover 13.9% of the global vegetation surface [19,26]. Therefore, it is necessary to consider the effects of water mixing during LAI inversions and validations.
The study’s objective is to establish a validation framework over heterogeneous land surfaces over mixed water-vegetation pixels, and evaluate the performance of global land-based LAI products. In this study, the following tasks are undertaken: (i) a global heterogeneous surface network aiming for water and vegetation mixture (HESNet-WV) is constructed based on high-resolution datasets; (ii) a method based on a linear mixture model is proposed for calculating the reference LAI values of the mixed scenes with the goal of LAI product cross-validation; and (iii) the framework is applied to an intercomparison of two global LAI products, to evaluate the products’ level of accuracy over mixed water-vegetation scenes.
2. Datasets
2.1. Land Cover Maps
The Finer Resolution Observation and Monitoring of Global Land Cover (FROM-GLC30) land cover map [27,28,29] analyzes heterogeneities within 500-m pixels and further selects global EVUs. The 2015 FROM-GLC30 product (available online at http://www.geodata.cn/, accessed on 1 September 2021) is available at a 30-m resolution and includes 10 categories, namely, croplands, forests, grasslands, shrublands, wetlands, water bodies, tundra, impervious surfaces, bare ground, ice, and snow. This product has an overall accuracy of 70.2%. The Moderate Resolution Imaging Spectroradiometer (MODIS) land cover product (MCD12Q1) (available online at https://e4ftl01.cr.usgs.gov/, accessed on 1 September 2021) is used to determine the dominant vegetation type at the 500-m pixel scale. MCD12Q1 is derived based on a supervised decision tree classification method from MODIS observations spanning a whole year [30]. The overall accuracy of the product is 75%. The LAI/FPAR classification scheme, including eight land cover types (grasses/cereal crops, shrubs, broadleaf crops, savannas, evergreen broadleaf forests, deciduous broadleaf forests, evergreen needleleaf forests, and deciduous needleleaf forests), is adopted in this paper. All land cover data utilized in this work are preprocessed and undergo projection conversions to ensure that their characteristics match during the analyses.
2.2. Joint Research Centre (JRC) Water Classification Dataset
The JRC provides monthly and yearly water classification datasets based on Landsat 5, 7, and 8 from 1984–2019 at 30-m spatial resolution (available at https://earthengine.google.com, accessed on 1 September 2021). Each pixel in the monthly dataset is individually classified into three categories (water, no water, or no data) using an expert system, visual analytics, and evidential reasoning. The utilized classifier produces false water detections at a rate below 1% and misses fewer than 5% of water surfaces [31]. The yearly dataset contains four bands, among which band 0 refers to ‘no data’, band 1 corresponds with ‘no water’, band 2 indicates ‘seasonal water’, and band 3 denotes ‘permanent water’. The datasets constructed for 2015 are used in this article.
2.3. Global LAI Products
The MODIS C6 LAI product (MCD15A3H, available at https://earthdata.nasa.gov/, accessed on 1 September 2021) has a temporal resolution of four days and a spatial resolution of 500-m. In the product, the daily red and near-infrared surface reflectance (MOD09GA/MYD09GA, 500 m) and the annual land cover product (MCD12Q1, 500 m) are used to retrieve LAI data based on a look-up table [32] derived from the three-dimensional radiative transfer model (3D-RT) [33,34]. When the main algorithm fails, a backup algorithm based on the biome-specific empirical relationship between the LAI and the normalized difference vegetation index (NDVI) is used [35].
Global Land Surface Satellite (GLASS) LAI products (available online at http://glass.umd.edu/, accessed on 1 September 2021) are provided by the Global Change Processing and Analysis Center of Beijing Normal University. The temporal resolution of the GLASS LAI product data recorded from 2000 to 2018 is eight days, with a 500 m spatial resolution. The LAI inversion algorithm uses general regression neural networks (GRNNs) to produce global long-term LAI products from the time series data observed by the MODIS surface reflectance data [5].
In this article, we use the global LAI products for 2015. These products are temporally aggregated over eight days to reduce the influence of temporal mismatches. The MODIS products used in this article provide quality control documentation. Consistent with other studies, according to these quality control files, the pixels marked as ‘no cloud’, ‘no snow’, ‘no cirrus’, etc., as retrieved by the main algorithm and classified according to MODIS land cover products and corresponding to vegetation land cover types, are regarded as effective pixels. Because the LAI values retrieved by the MODIS backup algorithm are often affected by clouds, only the LAI values retrieved by the main algorithm are considered in this study.
2.4. Landsat 8 Surface Reflectance
The Landsat-8 Collection-2, Level-2 surface reflectance products are provided by the Google Earth Engine (GEE), and are corrected for atmospheric effects (atmospheric absorption and scattering) and geometric deviations. The dataset is used to calculate the NDVI time series with GEE’s simple synthesis algorithm by conducting pixel-by-pixel analysis, generated using only cloud-free images collected in 2015 at a monthly temporal frequency.
3. Methodology
To verify the accuracy of the utilized LAI products over mixed water-vegetation scenes, in our methodology (Figure 1), we built a framework that included a network of EVUs with globally distributed specific mixed scenes and corresponding LAI reference values to allow the intercomparison of LAI products over mixed water-vegetation scenes. Certain criteria were set to screen out global EVUs with different WAFs. The mixed scenes were checked pixel-by-pixel globally, and the network of screened-out EVUs that met the criteria, called HESNet-WV, was constructed. The LAI reference values corresponding to each EVU were calculated and treated as the true mixed-pixel values for the LAI product comparisons. The HESNet-WV network consists of globally distributed validation sites with variable mixed water-vegetation scenes and is applied herein to examine the performance of the LAI products over mixed water-vegetation scenes.
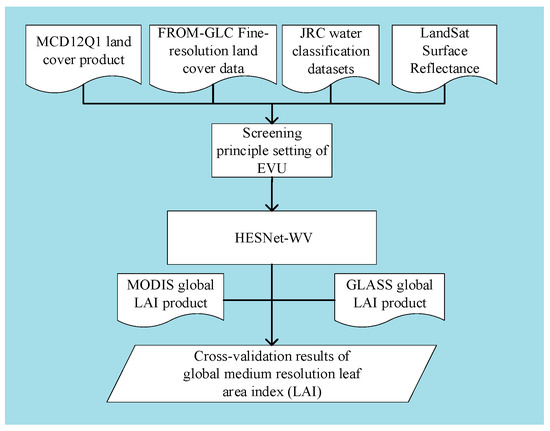
Figure 1.
Study flow chart.
3.1. Building a Network of Sites for Intercomparing LAI Products: HESNet-WV
An EVU, containing a water-vegetation scene (S1) and an adjacent homogeneous vegetation scene (S2), was the elementary unit of the HESNet-WV network. The schematic diagram for an EVU is shown in Figure 2. The calculation of the LAI reference values was based on the assumption that the adjacent homogeneous vegetation was highly similar to the vegetation within a mixed scene. The reference LAI value of the mixed pixel was calculated based on a linear mixture model constructed using the LAI of the adjacent pure vegetation pixel and the water area fraction provided by the global water classification dataset. In this paper, to verify the medium- and low-resolution LAI products, each EVU was constructed with 3 × 3 500-m pixels.
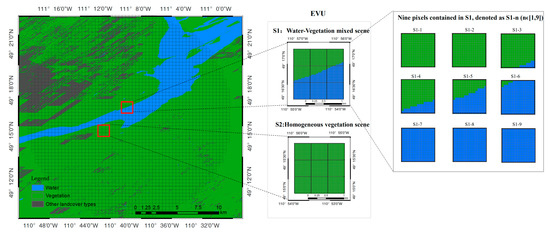
Figure 2.
Schematic diagram of an EVU.
3.1.1. Criteria for Network Building
To ensure the architectural stability of the mixed scenes in the EVUs and the accuracy of the reference LAI values, we established criteria to screen out the EVUs using the following three principles. Firstly, the homogeneous vegetation scene (S2) comprised the same vegetation type as the vegetation component in the mixed scene (S1) and was generally selected from the nearest-neighbor pixels. Secondly, the homogeneous vegetation scene (S2) had highly similar spectral characteristics to the vegetation component in S1. Thirdly, the water body inside S1 had a fixed boundary and steady conditions over the year. A series of criteria serving these three principles were applied in the construction of the network. The vegetation types in the S1 and S2 pixels were extracted from the 30-m FROM-GLC-2015 and 500-m MCD12Q1. The water bodies were extracted from the JRC water classification dataset.
Principle 1: Two criteria were set up.
- Criterion 1: S1 contained a water body and a single vegetation type. The vegetation types in S1 and S2 should be the same. The vegetation type in S2 derived from the 500-m MCD12Q1 product should be the same as in S1. All vegetation endmember types in S1 and S2 derived from FROM-GLC-2015 must be the same.
- Criterion 2: The distance between S1 and S2 should be close to ensure the best possible vegetation representation effect. Generally, S1 was screened first, and then S2 was found within a 15-km diameter circle centered on S1 (Figure 2).
Principle 2: The vegetation growth in S2 needed to be similar to that in S1. The spectra of endmembers in S2 were required to be highly similar and have few differences from the spectra of the vegetation endmembers in S1. Then, the LAI of S2 could be used to calculate the reference LAI of S1 after criterion 1 was established.
- Criterion 3: The Landsat 8 monthly average NDVI values of the S2 endmembers were compared with those of the vegetation endmembers in S1 throughout the growing season (longer than seven months). The average and maximal differences between the NDVIs of the vegetation endmembers in S1 and S2 were set as the thresholds. In this paper, the (1) and (2) thresholds were set to 0.08 and 0.1, respectively:
Principle 3: The water body in S1 was required to have fixed boundaries. Variation in the water coverage extensively changes the vegetation growth situation, making it difficult to guarantee the representativeness of S1 concerning the vegetation component in S2. Therefore, the water area was required to change little with seasonal precipitation under natural conditions. The mixed water-vegetation scenes with unchanged water areas were given the highest priority during the S1 selection process after the first two principles were established.
- i.
- Criterion 4: The water bodies in S1 were required to be spatially stable.
- First, the monthly WAFs in S1 calculated using the JRC monthly water classification history dataset must have had a few variances in 2015. The standard deviation of the valid monthly WAFs in 2015 in S1 needed to have been less than 0.01, or the water area range over the year must have been less than two standard deviations.
- Second, permanent water bodies were given priority to avoid the possibility that the water area remained unchanged while its position changed. The areas of permanent and seasonal water bodies throughout the year were obtained from the JRC yearly water classification history dataset. The proportion of seasonal water in S1 was set to be less than 10%.
- ii.
- Criterion 5: The NDVI of the water body needed to remain fixed in the year of study to avoid the influence of water body eutrophication on the LAI inversion results. In this paper, the NDVI threshold of the water endmember in S1, , was set to be lower than 0.3.
3.1.2. Network of Sites
Altogether, 934 EVUs were screened out after applying the above five criteria and conducting a global search using Google Earth Engine and a local search to construct the HESNet-WV network. Three vegetation types (grass, evergreen needleleaf forests (ENFs), and evergreen broadleaf forests (EBFs)) were included, corresponding to 414, 115, and 405 EVUs, respectively. The spatial distribution of all EVUs is shown in Figure 3. The EBF and ENF sites exhibited obvious regional characteristics. The EBF sites were distributed between N 20° and S 20°, while the ENF sites were mainly concentrated in the high-latitude regions of the Northern Hemisphere. Almost 90% of the grassland sites were located in the Northern Hemisphere. Table 1 shows the WAFs of all HESNet-WV EVUs; these values were calculated based on the JRC dataset. Few sites with large WAFs were screened out (112 sites with WAF values larger than 50%), as the water areas in the S1 regions tended to vary monthly.
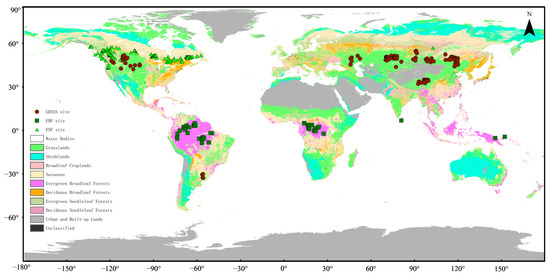
Figure 3.
Global distribution of the HESNet-WV network.

Table 1.
Information on the validation sites in the HESNet-WV Network.
According to the land product validation (LPV) specification requirements [35], providing the accuracy or precision of the reference data is recommended to calculate the uncertainty of verification. This network provided two indices for each EVU to describe the stability of the vegetation and water. One was the annual average difference between the vegetation NDVI of S1 and S2, and the other was the annual standard deviation of the proportion of the S1 water area.
3.2. Calculation of Reference LAI Values for the S1 and Product Intercomparison
The reference LAI value of each S1 site was considered to be the true value representing the mixed pixel when the influence of the water body was removed. This value was calculated based on the linear mixture model described by Equation (3), as water bodies have zero leaf area coverage:
where is the reference LAI corresponding to S1, is the water areal fraction in S1 calculated by the JRC monthly water classification dataset, and is the mean LAI value of the vegetation endmember in S2.
Since the S2 site in each EVU was specifically screened to comprise the same vegetation type and have highly similar spectra to the vegetation in S1, the LAI value of S2 was treated as the LAI value of the vegetation endmember in S1. Then, for each LAI product, the reference LAI value of S1 was calculated using the S2 LAI derived from this product and the WAF value provided by the EVU.
The reference LAI of S1 was calculated using the LAI of the homogeneous vegetation pixels (S2) extracted from the LAI product. It was then compared with the LAI value obtained through a direct inversion with the byproduct algorithm over the mixed pixel (S1). This process can remove the accuracy differences among product algorithms.
To quantitatively describe the difference between the inversed LAI by the product algorithm and the reference LAI over S2, bias and relative error (RELAI) were calculated using Equations (4) and (5), respectively. RMSE and R2 were also used to determine the quantitative inversion accuracy.
where is the LAI value of S1 extracted from the LAI product inverted by the specific LAI algorithm and is the reference LAI value of S1 calculated from Equation (3).
4. Results and Discussion
4.1. Evaluation of EVUs
4.1.1. Representative Evaluation of S2 Sites
The consistency between the vegetation spectra at S1 and S2 of the EVUs is the basis of the intercomparison process based on the HESNet-WV network. Figure 4a–c shows the NDVI values of the vegetation in the S1 and S2 of all the EVUs representing the three considered vegetation types. The monthly NDVI values of the S2 sites are strongly linearly correlated with those of the S1 sites (with R2 values ranging from 0.951 to 0.965). The S1-S2 vegetation consistency of the EVUs with ENF vegetation is the lowest among the three land cover types (RMSE = 0.042), and the grass EVUs have the best consistency (RMSE = 0.028). This high consistency indicates that the vegetation growth statuses obtained for S1 and S2 from the HESNet-WV network are highly similar among different phases.
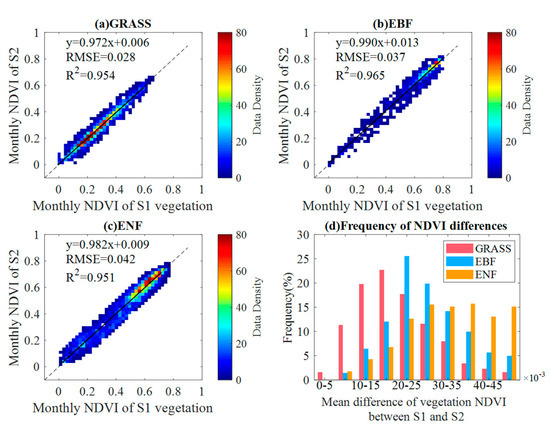
Figure 4.
Spectral consistency analyses of S1 and S2 with different underlying vegetation types (a–c). The frequency of the annual average difference between the S1 vegetation NDVI and S2 vegetation NDVI (d).
The consistency of the S1-S2 vegetation was further assessed by comparing the average LAI of S2 with the average LAI of the pure vegetation pixels (e.g., Figure 2, S1-1 and S1-2) in S1 from the MODIS and GLASS LAI products. A frequency distribution diagram of the LAI relative differences is shown in Figure 5. The relative difference in the average LAI of all vegetation types is 6.52%; the grasslands have the highest consistency, and the ENF pixels are less consistent than the other vegetation types (relative difference ranked by GLASS: EBF (2.81%) < grass (6.06%) < ENF (10.71%)). Regardless of the vegetation type, the greater the difference is, the less frequent the occurrence is. The results indicate that the S2 LAI values are consistent with the pure vegetation pixels in S1 and can be used to calculate the reference LAI values.
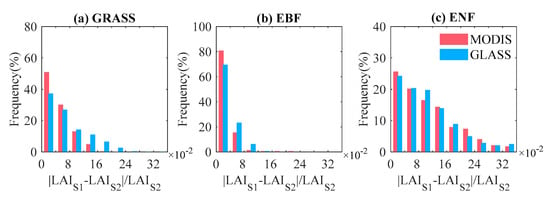
Figure 5.
Frequencies of the relative difference values of LAI obtained from the S1 and S2.
4.1.2. Stability of the WAF Values in the S1 Pixels
The annual standard deviations and maximum monthly WAF differences in S1 are used to assess the stability of the water areas inside the S1 pixels on the monthly scale (Figure 6). The results show that the standard deviations of all three vegetation types are less than 0.01. For the grassland and ENF pixels, the standard deviations with the highest frequency (16.6% and 21.4%, respectively) range from 0.001 to ~0.002 (Figure 6a), and more than 60% of the annual standard deviations are lower than 0.005. The maximum differences with the highest frequencies range from 0 to 0.005 for grasslands and from 0.005 to 0.01 for ENFs. The S1 pixels of EVUs in EBF regions have relatively high standard deviations and maximum monthly WAF differences. The highest frequency ranges obtained for the standard deviation and maximum difference are 0.006–0.007 and 0.01–0.015, respectively. Figure 6b shows the maximum monthly WAF difference inside the S1 and the monthly variations in the water areas inside the EBF S1 pixels tend to be more intense than those of the water areas grassland and ENF pixels because EBF EVUs are spread over the equatorial zone, where nearly the highest rainfall amounts on Earth occur.
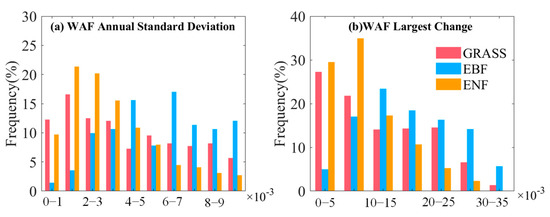
Figure 6.
Frequency histograms of the annual standard deviation and maximum monthly WAF difference inside the S1 pixels in the HESNet-WV network EVUs.
4.2. Intercomparison of Global LAI Products under the HESNet-WV Framework
4.2.1. Intercomparison with Increasing WAFs
In this work, the intercomparison results are quantitatively analyzed using the bias and RELAI values derived from all the 500-m water-vegetation mixed EVUs. The results indicate the accuracy variations that occur under different mixed water-vegetation scenes comprising different vegetation types (Figure 7). The bias values exhibit slow and steady increases with increasing WAFs for three vegetation types for the MODIS and GLASS LAI products. The average MODIS bias values increase from −0.02 to 0.40 for GRASS (Figure 7a), from −0.31 to 4.25 for EBF (Figure 7b), and from −0.21 to 0.93 for ENF (Figure 7c). The GLASS bias values increase from −0.05 to 0.37 for GRASS, from −0.29 to 2.34 for EBF, and from −0.28 to 0.84 for ENF. Both LAI products show initial underestimation and then overestimation with increasing WAF. The presence of water in the mixed water-vegetation pixels affects the mixed-pixel reflectance. The presence of pure water bodies increases the amount of solar radiation absorbed, which leads to a decrease in the reflectance of red and NIR wavelengths in mixed pixels. The product algorithm treats the reflectance of pixels contaminated by water bodies the same as the pure vegetation reflectance for that specific type of vegetation. The underestimation or overestimation of the LAI products partly depends on the balance between the influence of water reflectance on the red and near-infrared (NIR) bands. A more significant decrease in the NIR band than in the red band will present a weak NIR scattering effect of vegetation spectra and cause the LAI underestimate [23]. In contrast, a more significant decrease in the red band than in the NIR band will reinforce chlorophyll absorption and make the LAI overestimate. In addition, the LAI is also affected by the reflectance of different water bodies in nature, which will be discussed later.
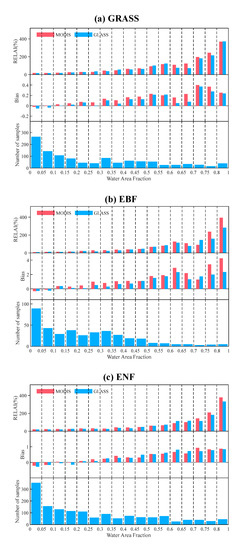
Figure 7.
RELAI and bias values derived between the product algorithm-inverted LAI values and the reference LAI values established for the S2 pixels of grasslands (a), EBFs (b), and ENFs (c).
RELAI values increase with increasing WAFs. This conclusion is consistent with previous research by Xu et al. [23], who evaluated the performance of MODIS LAI using the aggregated Landsat ETM+ reflectance of water pixels over different regions and the aggregated 30-m LAI reference maps. In this study, the RELAI values demonstrate that the error approaches the reference LAI when the WAF is approximately 0.6 (RELAIgrass_modis = 109.66%, RELAIgrass_glass = 76.50%, RELAIEBF_modis = 126.38%, RELAIEBF_glass = 114.96%, RELAIENF_modis = 89.49%, RELAIENF_glass = 113.52%) and exceeds the reference LAI almost twofold when the WAF reaches approximately 0.75 (RELAIgrass_modis = 245.46%, RELAIgrass_glass = 214.98%, RELAIEBF_modis = 238.78%, RELAIEBF_glass = 159.13%, RELAIENF_modis = 209.38%, RELAIENF_glass = 183.11%) for all three vegetation types. In Xu’s study [23], MODIS RELAI reaches about 85% when the WAF approaches 0.5. It is consistent with the results of this study. In our study, the RELAI value rapidly increases when the WAF is more significant than 0.75 because the reference LAI calculated based on the linear mixed model decreases for mixed pixels containing large water bodies.
Figure 8 shows the LAI bias inverted with simulated bidirectional reflectance factors (BRFs) at the red and NIR bands of a mixed grass-water pixel, which can be utilized to explain the water effects in the LAI retrieval. With the increase in the ΔBRFred and decrease in the ΔBRFnir of the pixels, the bias changes from overestimating to underestimating. The specific effect of water on the LAI of mixed pixels depends on the reflectance of water, and the different reflectance values of the water have different effects on the mixed pixels. When the reflectance of the red band of water is greater than that of the NIR band, the LAI of the mixed pixels is generally underestimated (Figure 9). At the same time, Xu et al.’s research also showed that under fixed water reflectance, the change direction of the vegetation-water mixed pixel LAI depends on the balance of red and NIR bands changes [23].
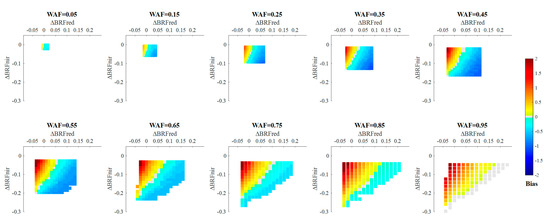
Figure 8.
The bias change in the inverted LAI with the change in BRFs at the red and NIR bands of the mixed pixel from the MODIS main LAI retrieval algorithm. This case was simulated for grasslands, with BRFred_vegetation = 0.06, BRFnir_vegetation = 0.35, solar zenith angle = 35°, solar azimuth angle = 150°, view zenith angle = 25°, and view azimuth angle = 100°. BRFred_water and BRFnir_water both have a range of [0, 0.3]. The change between the mixed vegetation-water pixel (BRFred = BRFred_vegetation × (1 − WAF) + BRFred_water × WAF; BRFnir = BRFnir_vegetation × (1 − WAF) + BRFnir_water × WAF) and the change in the reflectance of the vegetation pixel caused by the addition of water is described by ΔBRFred (ΔBRFred = (BRFred_water − BRFred_vegetation) × WAF) and ΔBRFnir (ΔBRFnir = (BRFnir_water − BRFnir_vegetation) × WAF).
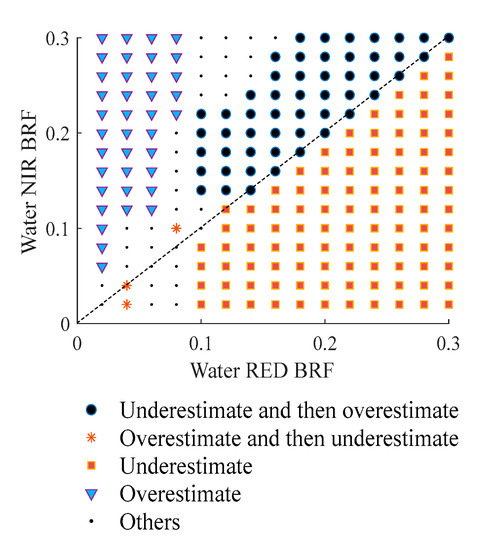
Figure 9.
The bias changes induced by different water reflectance combinations to the LAI inversion of mixed pixels with a WAF range from 0 to 1 (for example, ‘underestimate and then overestimate’ indicates that when the WAF changes from 0 to 1, the LAI of the mixed pixels is first underestimated and then overestimated).
However, when the reflectance of the red band of water is less than that of the NIR band, one part of the mixed-pixel LAI is consistently overestimated, and the other part is first underestimated and then overestimated. Meanwhile, with the increase in WAF, the LAI tends to be overestimated (Figure 10). Therefore, the proportion of underestimation in the validation results (Figure 7) depends on the characteristics of the water reflectance at the validation sites. However, the underestimation and then overestimation trend does not change with validation sites.
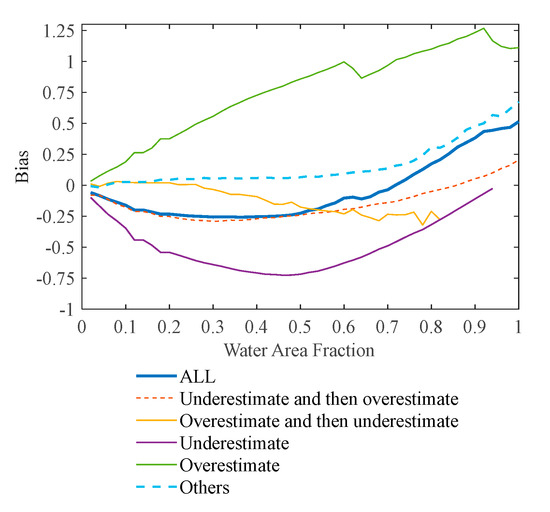
Figure 10.
The mean bias with different WAFs in the simulated experiments includes the mean bias caused by all water bodies and the mean bias caused by five different water bodies, as shown in Figure 9.
4.2.2. Intercomparison of MODIS and GLASS Products
The average biases of the MODIS and GLASS products are 0.15 and 0.11 for grasslands, 1.39 and 0.96 for EBFs, and 0.36 and 0.34 for ENFs, respectively. For grasslands, the MODIS LAI error is slightly smaller than that of GLASS when the WAF < 0.1 (Figure 7a). For the EBFs, the GLASS LAI performs better than the MODIS LAI except when abnormalities arise when the WAF ranges from 0.7–0.75 (Figure 7b). This indicates that the accuracy of the GLASS LAI product for EBFs in equatorial zones tends to be steadier than that of the MODIS product due to the reprocessing step that removes residual atmospheric contamination from the reflectance information in the GLASS LAI algorithm. For ENFs, the GLASS LAI values have a higher bias than the MODIS LAI values when WAF > 0.45 (Figure 7c). The biases of the ENF and EBF pixels are usually higher than those of the grassland pixels due to the large LAI values of forests.
The number of validation units with WAFs lower than 0.5 (926 for grasslands, 358 for EBFs, and 1202 for ENFs) is significantly greater than the number with WAFs larger than 0.5 (221 for grasslands, 37 for EBFs, and 313 for ENFs); specifically, when the WAF is larger than 0.8, pixels containing large water bodies can be identified as water body types instead of vegetation cover and are thus not processed in the LAI product inversion. Therefore, the bias and RELAI values do not continuously increase when the WAF ranges from 0.6 to 0.7, due to the uncertainties arising from a few samples.
Figure 11 provides scatter plots of the product-derived and reference LAI values in the S1 pixels for all heterogeneous pixels. The large LAI value of forests leads to a larger bias than for grasslands. The RMSE of GLASS (0.210) is higher than MODIS (0.185) for grasslands, but GLASS shows more advantages for forests. The inversion LAI value for the three vegetation types appears to be underestimated when the WAF is small, especially in WAF < 0.1 (MODIS: BiasEBF = −0.21, BiasENF = −0.19; GLASS: BiasEBF = −0.27, BiasENF = −0.22). When the WAF increases, most of the product-derived LAI values (the green and yellow points in Figure 11) tend to be overestimated, and this overestimation becomes severe when the WAF exceeds 0.5 (MODIS: Biasgrass = 0.26, BiasEBF = 2.54, BiasENF = 0.71; GLASS: Biasgrass = 0.21, BiasEBF = 1.85, BiasENF = 0.71). This is consistent with the results in Figure 7.
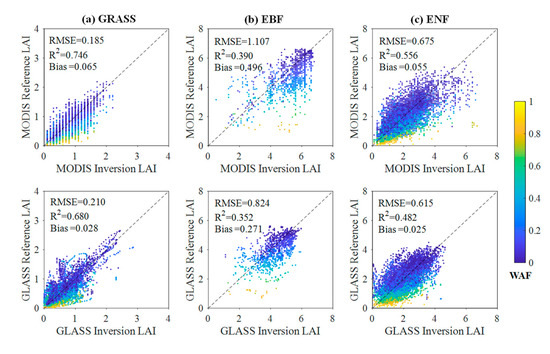
Figure 11.
Scatter distributions of the inverted and reference LAI values obtained from the two analyzed products after excluding invalid pixels from the LAI retrievals.
The MODIS LAI overestimations derived for the EBF pixels tend to be more significant than for GLASS LAI product when WAF > 0.8 (Figure 11b and Figure 7b); this finding can be partly attributed to the relatively high MODIS LAI values obtained for the EBF EVUs compared to the GLASS LAI values, regardless of whether homogeneous pixels (Figure 12d) or mixed water-vegetation pixels are considered (Figure 12c). An example EVU of an EBF on Julian day 201 is shown in Figure 13. The average MODIS LAI value of 6.28 in S2 is higher than the average GLASS LAI of 5.38; this difference is consistent with the frequency distribution in which the MODIS inversion value is higher than the GLASS inversion value, as shown in Figure 12d. The bias values of MODIS are higher than those of GLASS. In contrast, the RELAI values are similar, indicating that algorithm errors remain in the bias calculation. The RELAI value better describes the influence of the mixed water cover on the inversion results and can remove the algorithm error.
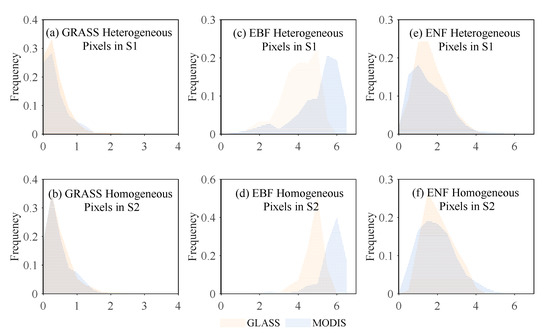
Figure 12.
Frequency distribution diagrams of the LAI values obtained for the S2 homogeneous pixels and S1 heterogeneous pixels from two LAI products covering three vegetation types. The horizontal axis represents the LAI value.
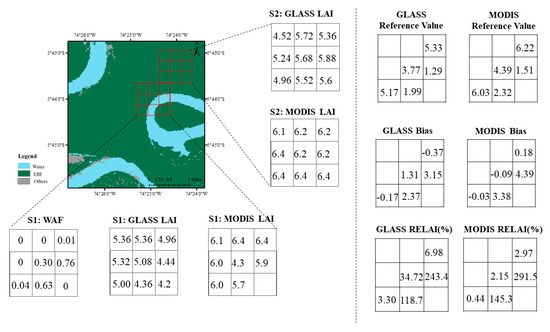
Figure 13.
Example of an EBF EVU on Julian day 201.
4.2.3. Intercomparison under Growing-Season Conditions
To evaluate the influence of mixed vegetation-water pixels on the LAI inversion results throughout the growing season, we calculated the time series of the bias and RELAI values obtained for the EVUs containing the three analyzed vegetation types, as shown in Figure 14 and Figure 15.
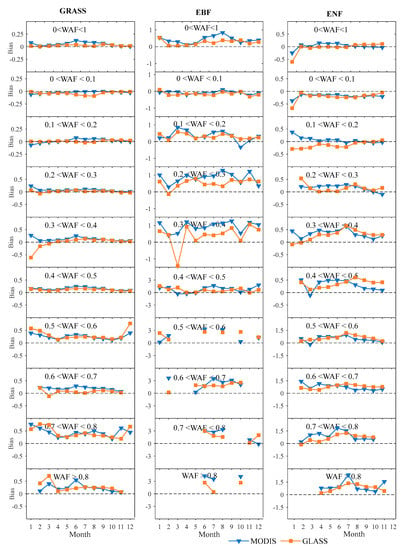
Figure 14.
Temporal profiles of the bias values obtained for the GLASS and MODIS LAI products among different WAFs and biome types.
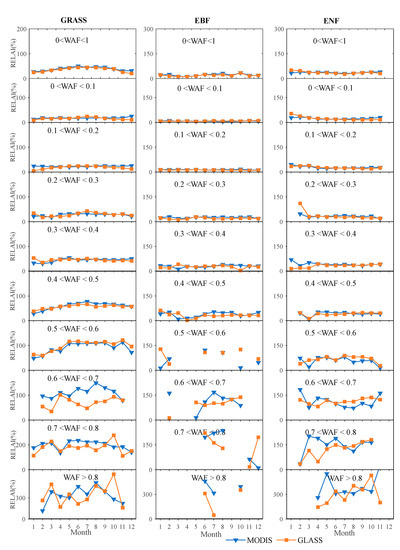
Figure 15.
Temporal profiles of the RELAI values obtained for the GLASS and MODIS LAI products among different WAFs and biome types.
The bias values of the two products generally increase in January, reach maximum values in July, and then decrease. This trend reflects the seasonal variations observed under all WAFs for the grassland and ENF EVUs due to the intense correlation between the bias and LAI values, meaning that the product-derived LAIs have relatively high inversion errors resulting from mixed vegetation-water bodies during the vigorous growing period, regardless of the spatial extent of the water body in the pixel. The bias values of the EBF pixels show no seasonal variations; this could partly be explained by the fact that the EBF EVUs are generally located in equatorial climate zones that lack distinct seasonal variations. However, the EBFs exhibit more severe fluctuations throughout the growing season than the grasslands and ENFs, likely due to cloud contamination, considering the high precipitation rates observed in the equatorial regions where the EBF EVUs are distributed. The MODIS bias values obtained for most of the EBF EVUs are higher than those of the GLASS product. This finding implies that the reflectance reprocessing step in the GLASS algorithm is useful in relieving the effect of the reflectance anomalies caused by cloud contamination.
The RELAI series is relatively flat, exhibiting slight seasonal variation throughout the growing season (Figure 15), especially for the EBF pixels when the WAF is below 0.4. The RELAI in the products resulting from the mixed vegetation-water pixels does not vary throughout the growing season. However, these errors change significantly with the WAF, especially when the WAF exceeds 0.5. The RELAIs of the two LAI products are similar when the WAF is lower than 0.6, but the RELAI difference between these two products increases when the WAF exceeds 0.6. The MODIS LAI product contains larger relative errors than the GLASS LAI product.
To further evaluate the influence of mixed water-vegetation pixels on LAI retrieval results during the growing season, the bias and RELAI values derived under different LAI conditions and WAFs are illustrated in Figure 16. The bias values are underestimated when the WAF is low, and overestimated during vigorous growing season under high WAF pixel conditions. As the WAF and LAI values increase, the error in the MODIS LAI values increases. The algorithm used to construct the MODIS LAI product tends to produce larger inversion errors than the GLASS LAI algorithm in the flourishing period under large WAF conditions. Additionally, due to the GLASS product’s smoothing algorithm, the LAI’s high value is close to 7 and not inverted.
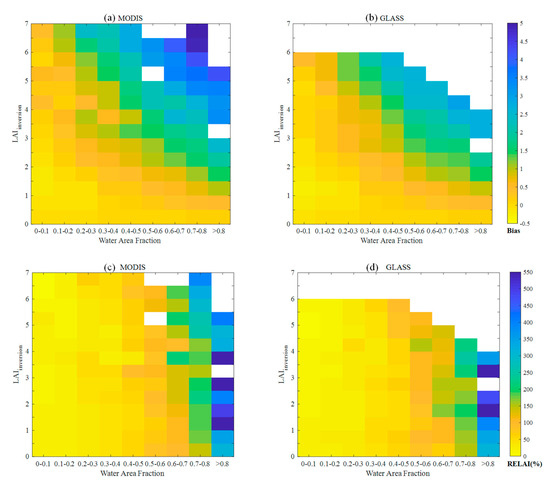
Figure 16.
Bias ((a) MODIS LAI product, (b) GLASS LAI product) and RELAI ((c) MODIS LAI product, (d) GLASS LAI product) values obtained in a comparative analysis of the LAI values retrieved from the two analyzed products under different WAF and inverted LAI conditions.
The RELAI (Figure 16c,d) is related only to the WAF. The average inversion error is similar to the LAI reference value (the RELAI value is approximately 100%) for both the MODIS and GLASS LAI products when the WAF is approximately 0.5. When the WAF is larger than 0.7, the inversion error can reach four times the reference LAI value (the RELAI is approximately 400%). The low reference LAI values derived under large WAFs account partly for the high RELAI values that are subsequently obtained. This finding also implies that the decreased effect of water bodies on the LAI is more intense than the effect of water bodies on the vegetation reflectance, resulting in the LAIs that are inverted from the mixed reflectance values being larger than the mixed-pixel LAIs.
The GLASS product errors (relative LAI error (RELAI): 94.43%, bias: 0.858) are lower than the MODIS product errors (RELAI: 124.05%, bias: 1.209), which means that GLASS has less uncertainty. This is consistent with the previous research of Zeng et al. [36], who compared GLASS, MODIS and GEOV2 products under the heterogeneous surface. The results showed that the uncertainty of GLASS products was the smallest, followed by GEOV2 and MODIS.
4.3. Limitations and Prospects
4.3.1. The Unbalanced Spatial Distribution of the Network
The HESNet-WV network includes three main vegetation types, and EVUs for different types have a global distribution. The uneven distribution of global inland surface water resources will cause the same type of EVU to gather regionally around stable water bodies (rivers, lakes, inland seas, etc.). In addition, the regional climate and ecosystem characteristics also indirectly determine the spatial distribution of the sample points. For example, there are few stable water bodies in the arid zone of Australia and less water and vegetation in northern Africa, so high-quality EVUs cannot be retrieved in similar places. The unbalanced spatial distribution of EVUs will not affect the quality of the network or the accuracy of product validation because its distribution is consistent with the spatial characteristics of stable water and vegetation in nature.
4.3.2. Uncertainty Assessment
The uncertainty of the validation results is closely related to the stability of the network. According to the two parameters of vegetation representativeness and water stability provided in the attachment, it can be seen that the vegetation representativeness of EVUs of grassland is stronger and the proportion of water area more stable. The water body of EBF fluctuates wildly and the vegetation representation of ENF is relatively poor. Therefore, the uncertainty of verification results of grassland is smaller than for EBF and ENF. The uncertainty assessment of validation results will be further improved and refined in future work.
4.3.3. Prospects of Future Work
The results demonstrate the ability of the HESNet-WV Network to perform global LAI assessments in a variety of mixed water body and vegetation scenarios. Moreover, these results are a reference for algorithm refinement and further validation work. At a medium spatial resolution, the heterogeneity of pixels is a crucial problem affecting the accuracy of radiative transfer process simulations and the accurate inversion of surface parameters. Constructing an LAI inversion algorithm system that considers land surface heterogeneity is important. A simple linear mixed model could be used for correction when the pixel heterogeneity is low, and cross-radiation could be regarded as improving the inversion accuracy of the LAI when the heterogeneity is high, which requires further research. In addition, high-resolution and high-precision land classification needs to be considered and developed.
Theoretically, the best validation and application year of HESNet-WV Network is 2015, because it is more accurate to perform evaluations closer to the base year. When the network is applied for other years, it is necessary to consider whether the vegetation type and water area conditions characterizing the study site have changed. At the same time, the only current validation object is the water-vegetation mixed heterogeneous surface, and the heterogeneous characteristics of the surface are not uniformly distributed. Therefore, to conduct a comprehensive quality validation on the heterogeneous surface for global LAI products, it is necessary to increase the number of verifiable objects of the site network.
In future work, more objects will be validated under the validation framework. The network establishment method under the validation framework is also applicable to different vegetation-vegetation mixtures or vegetation-urban land mixtures. Moreover, the available time scale of the network will be extended. The developed network will implement higher-resolution surface classification data by introducing more refined surface classification data.
5. Conclusions
This study proposed a validation framework to facilitate intercomparisons of global LAI products over mixed water-vegetation pixels by deriving global EVUs with reference values obtained by considering the different LAI inversion algorithms in the available LAI products. The method framework included a globally distributed HESNet-WV network and an error assessment method based on a linear mixing model.
The performance of the MODIS and GLASS LAI products was evaluated using the HESNet-WV network through visualization and quantitative evaluation steps, and the following conclusions were obtained:
(1) More WAFs in the mixed pixels resulted in larger errors during LAI inversion. The error was close to the reference LAI value when the WAF was approximately 0.6 and almost two times that when the WAF reached about 0.75.
(2) GLASS and MODIS LAI products showed growing errors alongside increased WAF. The bias and relative error of the GLASS (Biasglass = 0.858, RELAIglass = 94.43%) were lower than for MODIS (Biasmodis = 1.209, RELAImodis = 124.05%).
(3) The mixture of water bodies and vegetation influenced the three vegetation types differently. EBFs (Biasmodis = 1.39, Biasglass = 0.96) were the most affected, followed by ENFs (Biasmodis = 0.36, Biasglass = 0.34) and GRASS (Biasmodis = 0.15, Biasglass = 0.11).
This framework provides a scheme to evaluate the performance of LAI products in mixed-pixel regions, and it is possible to realize the accuracy assessment of LAI in heterogeneous-pixel regions. The validation objects of heterogeneous land surfaces need to be further increased, and the influence of heterogeneous land surfaces on LAI product inversion warrants further exploration.
Author Contributions
Conceptualization, C.L., J.L. and Q.L.; methodology, C.L.; validation, C.L.; analysis, Y.D., B.X. and F.M.; data curation, C.L., B.X., F.M. and J.Z.; writing—original draft preparation, C.L.; writing—review and editing, C.L., J.Z., Y.D., H.Z., C.G. and J.L.; project administration, Q.L. All authors have read and agreed to the published version of the manuscript.
Funding
This work was supported by the National Key Research and Development Program (2019YFE0126700), National Natural Science Foundation of China (NO.41871265).
Data Availability Statement
The datasets used and/or analyzed during the current study are available from the corresponding author on request.
Acknowledgments
We thank researcher Hongliang Fang of the Institute of Geography and Natural Resources Research, Chinese Academy of Sciences, for his advice on this study.
Conflicts of Interest
The authors declare no conflict of interest.
References
- Chen, J.M.; Black, T.A. Defining leaf area index for non-flat leaves. Agric. For. Meteorol 1992, 15, 421–429. [Google Scholar] [CrossRef]
- GCOS. The Global Observing System for Climate: Implementation Needs; WMO: Geneva, Switzerland, 2016. [Google Scholar]
- Huang, D.; Knyazikhin, Y.; Wang, W.; Deering, D.W.; Stenberg, P.; Shabanov, N.; Tan, B.; Myneni, R.B. Stochastic transport theory for investigating the three-dimensional canopy structure from space measurements. Remote Sens. Environ. 2008, 112, 35–50. [Google Scholar] [CrossRef]
- Myneni, R.; Knyazikhin, Y.; Park, T. MCD15A2H MODIS/Terra+ Aqua Leaf Area Index/FPAR 8-day L4 Global 500m SIN Grid V006. NASA EOSDIS Land Processess DAAC. 2015. Available online: https://ladsweb.modaps.eosdis.nasa.gov/missions-and-measurements/products/MCD15A2H (accessed on 1 September 2021).
- Xiao, Z.; Liang, S.; Wang, J.; Chen, P.; Yin, X.; Zhang, L.; Song, J. Use of General Regression Neural Networks for Generating the GLASS Leaf Area Index Product from Time-Series MODIS Surface Reflectance. IEEE Trans. Geosci. Remote Sens. 2013, 52, 209–223. [Google Scholar] [CrossRef]
- Baret, F.; Weiss, M.; Verger, A.; Smets, B. Atbd for lai, fapar and fcover from proba-V products at 300 mresolution (Geov3). Imagines_rp2. 1_atbd-lai. Available online: https://land.copernicus.eu/global/sites/cgls.vito.be/files/products/ImagineS_RP2.1_ATBD-FAPAR300m_I1.73.pdf (accessed on 1 September 2021).
- Lafont, S.; Zhao, Y.; Calvet, J.-C.; Peylin, P.; Ciais, P.; Maignan, F.; Weiss, M. Modelling LAI, surface water and carbon fluxes at high-resolution over France: Comparison of ISBA-A-gs and ORCHIDEE. Biogeosciences 2012, 9, 439–456. [Google Scholar] [CrossRef]
- Morisette, J.T.; Baret, F.; Privette, J.L.; Myneni, R.B.; Nickeson, J.E.; Garrigues, S.; Shabanov, N.V.; Weiss, M.; Fernandes, R.A.; Leblanc, S.G.; et al. Validation of global moderate-resolution LAI products: A framework proposed within the CEOS land product validation subgroup. IEEE Trans. Geosci. Remote Sens. 2006, 44, 1804–1817. [Google Scholar] [CrossRef]
- Garrigues, S.; Lacaze, R.; Baret, F.; Morisette, J.T.; Weiss, M.; Nickeson, J.E.; Fernandes, R.; Plummer, S.; Shabanov, N.V.; Myneni, R.B.; et al. Validation and intercomparison of global Leaf Area Index products derived from remote sensing data. J. Geophys. Res. Biogeosci. 2015, 113, G02028. [Google Scholar] [CrossRef]
- Fang, H.; Wei, S.; Liang, S. Validation of MODIS and CYCLOPES LAI products using global field measurement data. Remote Sens. Environ. 2012, 119, 43–54. [Google Scholar] [CrossRef]
- Mougin, E.; Diawara, M.O.; Soumaguel, N.; Maïga, A.A.; Demarez, V.; Hiernaux, P.; Grippa, M.; Chaffard, V.; Ba, A. A leaf area index data set acquired in Sahelian rangelands of Gourma in Mali over the 2005–2017 period. Earth Syst. Sci. Data 2019, 11, 675–686. [Google Scholar] [CrossRef]
- Filipponi, F.; Valentini, E.; Xuan, A.N.; Guerra, C.A.; Wolf, F.; Andrzejak, M.; Taramelli, A. Global MODIS Fraction of Green Vegetation Cover for Monitoring Abrupt and Gradual Vegetation Changes. Remote Sens. 2018, 10, 653. [Google Scholar] [CrossRef]
- Baret, F.; Morissette, J.T.; Fernandes, R.A.; Champeaux, J.L.; Myneni, R.B.; Chen, J.; Plummer, S.; Weiss, M.; Bacour, C.; Garrigues, S.; et al. Evaluation of the representativeness of networks of sites for the global validation and intercomparison of land biophysical products: Proposition of the CEOS-BELMANIP. IEEE Trans. Geosci. Remote Sens. 2006, 44, 1794–1803. [Google Scholar] [CrossRef]
- Myneni, R.B.; Hoffman, S.; Knyazikhin, Y.; Privette, J.L.; Glassy, J.; Tian, Y.; Wang, Y.; Song, X.; Zhang, Y.; Smith, G.R.; et al. Global products of vegetation leaf area and fraction absorbed PAR from year one of MODIS data. Remote Sens. Environ. 2002, 83, 214–231. [Google Scholar] [CrossRef]
- Deng, F.; Chen, J.; Plummer, S.; Chen, M.; Pisek, J. Algorithm for global leaf area index retrieval using satellite imagery. IEEE Trans. Geosci. Remote Sens. 2006, 44, 2219–2229. [Google Scholar] [CrossRef]
- Yu, W.; Li, J.; Liu, Q.; Zeng, Y.; Zhao, J.; Xu, B.; Yin, G. Global Land Cover Heterogeneity Characteristics at Moderate Resolution for Mixed Pixel Modeling and Inversion. Remote Sens. 2018, 10, 856. [Google Scholar] [CrossRef]
- Baret, F.; Weiss, M.; Allard, D.; Garrigue, S.; Leroy, M.; Jeanjean, H.; Fernandes, R.; Myneni, R.; Privette, J.; Morisette, J.; et al. VALERI: A network of sites and a methodology for the validation of medium spatial resolution land satellite products. Remote Sens. Environ. 2000, 1–16. [Google Scholar]
- Xu, B.; Li, J.; Liu, Q.; Huete, A.R.; Yu, Q.; Zeng, Y.; Yin, G.; Zhao, J.; Yang, L. Evaluating Spatial Representativeness of Station Observations for Remotely Sensed Leaf Area Index Products. IEEE J. Sel. Top. Appl. Earth Obs. Remote Sens. 2016, 9, 3267–3282. [Google Scholar] [CrossRef]
- Xu, B.; Li, J.; Park, T.; Liu, Q.; Zeng, Y.; Yin, G.; Zhao, J.; Fan, W.; Yang, L.; Knyazikhin, Y.; et al. An integrated method for validating long-term leaf area index products using global networks of site-based measurements. Remote Sens. Environ. 2018, 209, 134–151. [Google Scholar] [CrossRef]
- Shi, Y.; Wang, J.; Qin, J.; Qu, Y. An Upscaling Algorithm to Obtain the Representative Ground Truth of LAI Time Series in Heterogeneous Land Surface. Remote Sens. 2015, 7, 12887–12908. [Google Scholar] [CrossRef]
- Xu, S.; Chen, J.M.; Fernandes, R.; Cihlar, J. Effects of subpixel water area fraction on mapping leaf area index and modeling net primary productivity in Canada. Can. J. Remote Sens. 2004, 30, 797–804. [Google Scholar] [CrossRef]
- Fang, H.; Li, W.; Myneni, R.B. The Impact of Potential Land Cover Misclassification on MODIS Leaf Area Index (LAI) Estimation: A Statistical Perspective. Remote Sens. 2013, 5, 830–844. [Google Scholar] [CrossRef]
- Xu, B.; Li, J.; Park, T.; Liu, Q.; Zeng, Y.; Yin, G.; Yan, K.; Chen, C.; Zhao, J.; Fan, W.; et al. Improving leaf area index retrieval over heterogeneous surface mixed with water. Remote Sens. Environ. 2020, 240, 111700. [Google Scholar] [CrossRef]
- Jin, H.; Li, A.; Bian, J.; Nan, X.; Zhao, W.; Zhang, Z.; Yin, G. Intercomparison and validation of MODIS and GLASS leaf area index (LAI) products over mountain areas: A case study in southwestern China. Int. J. Appl. Earth Obs. Geoinf. 2017, 55, 52–67. [Google Scholar] [CrossRef]
- Chen, J.M. Spatial Scaling of a Remotely Sensed Surface Parameter by Contexture. Remote Sens. Environ. 1999, 69, 30–42. [Google Scholar] [CrossRef]
- Xu, B. Leaf Area Index Retrieval and Product Validation over Heterogeneous Land Surfaces; Institute of Remote Sensing and Digital Earth, Chinese Academy of Sciences: Beijing, China, 2018. [Google Scholar]
- Gong, P.; Wang, J.; Yu, L.; Zhao, Y.; Zhao, Y.; Liang, L.; Niu, Z.; Huang, X.; Fu, H.; Liu, S.; et al. Finer resolution observation and monitoring of global land cover: First mapping results with Landsat TM and ETM+ data. Int. J. Remote Sens. 2013, 34, 2607–2654. [Google Scholar] [CrossRef]
- Li, C.; Gong, P.; Wang, J.; Zhu, Z.; Biging, G.S.; Yuan, C.; Hu, T.; Zhang, H.; Wang, Q.; Li, X.; et al. The first all-season sample set for mapping global land cover with Landsat-8 data. Sci. Bull. 2017, 62, 508–515. [Google Scholar] [CrossRef] [PubMed]
- Gong, P.; Liu, H.; Zhang, M.; Li, C.; Wang, J.; Huang, H.; Clinton, N.; Ji, L.; Li, W.; Bai, Y.; et al. Stable classification with limited sample: Transferring a 30-m resolution sample set collected in 2015 to mapping 10-m resolution global land cover in 2017. Sci. Bull. 2019, 64, 370–373. [Google Scholar] [CrossRef]
- Friedl, M.A.; Sulla-Menashe, D.; Tan, B.; Schneider, A.; Ramankutty, N.; Sibley, A.; Huang, X. MODIS Collection 5 global land cover: Algorithm refinements and characterization of new datasets. Remote Sens. Environ. 2010, 114, 168–182. [Google Scholar] [CrossRef]
- Pekel, J.; Cottam, A.; Gorelick, N.; Belward, A. Global Surface Water—Data Access. 2016. Available online: https://publications.jrc.ec.europa.eu/repository/handle/JRC109054 (accessed on 1 September 2021).
- Yuan, N.; Fu, Z.; Zhang, H.; Piao, L.; Xoplaki, E.; Luterbacher, J. Detrended Partial-Cross-Correlation Analysis: A New Method for Analyzing Correlations in Complex System. Sci. Rep. 2015, 5, 8143. [Google Scholar] [CrossRef]
- Knyazikhin, Y.; Martonchik, J.V.; Diner, D.J.; Myneni, R.B.; Verstraete, M.; Pinty, B.; Gobron, N. Estimation of vegetation canopy leaf area index and fraction of absorbed photosynthetically active radiation from atmosphere-corrected MISR data. J. Geophys. Res. Atmos. 1998, 103, 32239–32256. [Google Scholar] [CrossRef]
- Knyazikhin, Y.; Martonchik, J.V.; Myneni, R.B.; Diner, D.J.; Running, S.W. Synergistic algorithm for estimating vegetation canopy leaf area index and fraction of absorbed photosynthetically active radiation from MODIS and MISR data. J. Geophys. Res. Atmos. 1998, 103, 32257–32275. [Google Scholar] [CrossRef]
- Myneni, R.; Ramakrishna, R.; Nemani, R.; Running, S. Estimation of global leaf area index and absorbed par using radiative transfer models. IEEE Trans. Geosci. Remote Sens. 1997, 35, 1380–1393. [Google Scholar] [CrossRef]
- Zeng, Y.; Li, J.; Liu, Q.; Li, L.; Xu, B.; Yin, G.; Peng, J. A Sampling Strategy for Remotely Sensed LAI Product Validation Over Heterogeneous Land Surfaces. IEEE J. Sel. Top. Appl. Earth Obs. Remote Sens. 2014, 7, 3128–3142. [Google Scholar] [CrossRef]
Disclaimer/Publisher’s Note: The statements, opinions and data contained in all publications are solely those of the individual author(s) and contributor(s) and not of MDPI and/or the editor(s). MDPI and/or the editor(s) disclaim responsibility for any injury to people or property resulting from any ideas, methods, instructions or products referred to in the content. |
© 2023 by the authors. Licensee MDPI, Basel, Switzerland. This article is an open access article distributed under the terms and conditions of the Creative Commons Attribution (CC BY) license (https://creativecommons.org/licenses/by/4.0/).