Review

Optical Satellite-Derived Bathymetry: An Overview and WoS and Scopus Bibliometric Analysis

1
Faculty of Civil Engineering, Architecture and Geodesy, University of Split, Matice Hrvatske 15, 21000 Split, Croatia
2
Faculty of Maritime Studies, University of Split, Ruđera Boškovića 37, 21000 Split, Croatia
*
Author to whom correspondence should be addressed.
Remote Sens. 2023, 15(5), 1294; https://doi.org/10.3390/rs15051294
Submission received: 24 January 2023 / Revised: 19 February 2023 / Accepted: 24 February 2023 / Published: 26 February 2023
(This article belongs to the Special Issue Satellite Derived Bathymetry for Coastal Mapping)

Abstract

:
A technical and scientific overview regarding satellite-derived bathymetry (SDB)—one of the most promising and relatively cheap methods of shallow water depth determination—is presented. The main goal of the article is to present information about the possibilities of the SDB method to meet the demanding standard of bathymetric measurements in coastal mapping areas up to 20 m deep, i.e., up to depth areas where the largest number of ports and access waterways are located, as obtained using the bibliometric analysis. The Web of Science (WoS) and Scopus scientific databases, as well as R studio applications Bibliometrix and Biblioshiny, were used for scientific analysis. The bibliometric analysis presents the quantitative aspects of producing and disseminating scientific and professional articles with SDB as their topic. Therefore, the purpose of this study was to give the academic community an insight into the current knowledge about the SDB method, its achievements and shortcomings. The results of the bibliometric analysis of articles dealing with SDB show that most authors use empirical statistical methods. However, in recent years, articles using automated artificial intelligence methods have prevailed, especially the machine learning method. It is concluded that SDB data can become a very important low-cost source of bathymetric data in shallow coastal areas. Satellite methods have been proven to be very effective in very shallow coastal areas (up to a depth of about 20 m), and their biggest advantage is that the depth data obtained in this way are relatively low cost, while major limitations are associated with the parameters that determine the properties of the atmosphere and water column (clear atmosphere and water column) and bottom material. Procedures for different bathymetric applications are being developed. Regardless of the significant progress of the SDB method, which was manifested in the development of sensors and processing methods, its results still do not meet the International Hydrographic Organization (IHO) Standards for Hydrographic Surveys S-44.

1. Introduction

We can assume that at least 50% of the total global area of the continental shelf (shelf depth is shallower than 200 m) was not surveyed or surveyed with inadequate horizontal and vertical accuracy defined according to IHO S-44 standards [1]. Continental shelves make up about 8% of the entire area covered by oceans and seas [2], and the remaining parts have poor sea bottom measurements. The reason for such a bad state of world hydrography is that sea depths were historically measured from hydrographic ships, which is a complex and very expensive job. Therefore, it was necessary to find effective and, if possible, cost-effective methods f determining shallow sea bathymetry.
The concept of single-image SDB began in the late 1960s, and it has been investigated by international hydrographic offices over the past five decades [3]. In 1975, bathymetry in the Bahamas and off the coast of Florida was calculated to a depth of 22 m (72 feet) by NASA and Jacques Cousteau using Landsat 1 and 2 (Figure 1) [4]. The U.S. Navy used the GEOSAT satellite to create the first global bathymetric dataset of the deep ocean in the mid-1980s. Since then, depth determination methods have been developed based on data from active and passive satellite missions.
Thus, the method of determining bathymetric data gradually moved from the ship’s platform to airborne platforms (airplanes, helicopters and unmanned aerial systems (UAVs) of all types) and spaceborne (active or passive satellites) acquisition. In recent times, satellite-derived bathymetry (SDB), a rapid and cost-effective method, appeared, which determines shallow-water bathymetry from space or satellite sensors. This is a physics-based method suitable for use in calm clear waters. The accuracy of this method significantly depends on the quality of the atmospheric correction [5], as well as the quality of the physical model of light penetration in the water column [6,7,8,9]. There are three such remote sensing methods: optical satellite remote sensing method or optical SDB, synthetic aperture radar (SAR) sensor SDB and radar altimeter or altimetry SDB. Bathymetry products range from optical bathymetry (high-resolution images used for shallow water) and synthetic aperture radar (SAR) bathymetry (moderate resolution images for intermediate water depths) to altimetry bathymetry (for deep and open oceans with low resolution, satellite data are free or cheap, which is a benefit; Table 1) [10,11].
One of the pioneering attempts to estimate shallow water bathymetry using remote sensing data was the scientific work of Lyzenga in 1978 [7], which first used aerial multispectral photographs and later expanded to multispectral optical satellite images [12]. The theoretical derivation of the standard bathymetric algorithm by Lyzenga [7] was supplemented by Stumpf et al. [13].
Optical SDB uses the multispectral satellite image data of multiple missions (e.g., Sentinel-2) and physics-based inversion methods to determine water depth from seafloor reflectance intensities at different wavelengths. With this method, depths can be determined from 0 to 30 m, and results depend on an image’s spatial resolution, which can range from 1 m to 30 m. The maximum water depth mapped by optical SDB is similar to the maximum penetration depth of sunlight and varies by season and location. Company EOMAP declares, based on their experimental research, the following mapping depths: Red Sea (20–30 m), Gulf region (5–15 m from north to south), Mediterranean Sea (20–30 m), Baltic Sea (2–15 m from north to south), Caribbean Sea (20–30 m), U.S. West Coast (5–15 m) and Pacific region (20–30 m) [10,12].
SAR SDB uses the SAR data of multiple missions (e.g., Sentinel-1 and TerraSAR-X) and wave shoaling effects (wavelength reduces in shallow water) to determine the depth that ranges from 10 to 100 m with a spatial resolution of up to ~100 m [13,14].
The altimeter SDB method uses altimeter satellite data (e.g., Jason-1 and Sentinel-3 A) from satellite missions that measure changes in gravity affecting sea surface levels caused by large underwater structures (~10 km to 200 km), and based on these measurements, they determined, or rather assumed, the depths of deep waters with a spatial resolution of 1 km [11].
The results of the SDB method are applicable in many hydrographic branches and generally in marine sciences (bathymetry, cartography, coastal management, water quality monitoring, etc.). The accuracy of the method does not meet current IHO Standards for Hydrographic Surveys—S-44 Edition 6.0.0 [1]. However, according to Pe’eri et al. [15], it can be used when planning the hydrographic surveying of shallow coastal areas that have not been surveyed or areas with old data. With the development of remote sensing platforms, especially their spatial and temporal resolution, and the expected reduction in image prices, this method is more accessible for use in many branches of the economy, including hydrography.
SDB costs generally depend on the costs of satellite images, which are between 0 (free of charge for Landsat and Sentinel 2) and 60 EUR/km2 (for example, WorldView 3 and 4) depending on image quality. The cost of SAR and SDB altimetry methods depends on the cost of satellite data, which can be free (Sentinel 1) or commercial. An image’s spatial resolutions can range from 0.3 (WorldView 3 and 4) to 30 m (Landsat 8 and 9) or 10 m (Sentinel 2). Today, SDB uses free Landsat 8 images with 30 m spatial resolution, while WorldView uses images at 1.25 m. The vertical accuracy achieved is approximately 10–15% of the depth and is significantly reduced in areas with depths above 20–30 m [15,16].
According to the IHO Standards S-44 [1], multibeam echo-sounder (MBES) data typically met the quality of data: positional data accuracy of ±5 m + 5% with respect to depth; vertical or depth accuracy of ±0.50 m + 1% with respect to depth; and almost all SDB data were within a positional accuracy of ±500 m and depth accuracy of ±2 m + 5% with respect to depth. Available SDB data were vertically accurate to approximately ±2–3 m. In very shallow waters (shallower than 10 m), SHOM researchers compared the results of different methods to obtain the bathymetry data [17,18] and concluded that SDB can help fill the world’s charting gaps at a reasonable cost.
According to our knowledge, there is no published work to date that systematically and quantitatively evaluates the scientific development of the articles referring to shallow water satellite-derived bathymetry (SDB) from a bibliometric perspective. To contribute to fulfilling this deficiency, this review paper aims to detect the comprehensiveness of the worldwide literature on the development of satellite-derived bathymetry for coastal mapping methods using the statistical analysis of scientific research published in the Scopus and Web of Science (WoS) databases from 1975 to 2022.
This review paper provides a summary of the global research on shallow water SDB.
The purpose of the study is to obtain information about the possibilities of the SDB method to meet the demanding standard of bathymetric measurements in the coastal mapping area up to 20 m deep, i.e., up to depth areas where the largest number of ports and access waterways are located. The bibliometric analysis presents quantitative aspects of the production and dissemination of scientific and professional articles focusing on SDB as their topic. Furthermore, the analysis presents when the SDB appeared as a method, in which periods it was developed, the latest trends and the future trends in the use of this method for depth determination. In the same way, in this article, we intend to provide an overview of the development of optical or shallow water SDB methods, as well as the most commonly used methods of determining depths in optical SDB.

2. Materials and Methods

2.1. SDB Methods

SDB is a remote sensing method for bathymetrically surveying shallow waters, and its beginnings date back to the late 1970s and can be attributed to David R. Lyzenga’s article [7] (Naval Architecture and Marine Engineering University of Michigan), which is cited 592 times. The frequency of SDB usage has considerably increased in the last decade.
According to our knowledge, the most commonly used approach today for determining bathymetry is an optimization method that uses band ratio calculations [19]. A brief overview of the different SDB methods, their measurement ranges and accuracy—as well as the advantages, limitations and applications of each method—is shown in Table 1. The table is compiled according to previous review articles dealing with this topic [3,20] and supplemented with our information.
Table 1. Summary of satellite-derived bathymetry with their advantages and limitations (source: modified after [3,20]).
MethodSystemDepth Range (m)AccuracyAffecting FactorsAdvantagesLimitationsApplications
Non-imaging Active RSLight Detection and Ranging (LiDAR)Up to 70Very high
≈ 15 cm
Water clarity or turbidity, bottom material; surface state; background lightWide depth range; concurrent measurement not essentialHigh cost;
limited swath width
Varied aquatic environments of narrow range
Radar altimetry>1000Very Low
± 60 m
The elastic thickness of the lithosphere and/or crustal thickness, sedimentsGlobal coverage, needs only simple altimetry with no iono/troposphere measurementPossible over a limited
wavelength band
Coarse bathymetry derivation in open ocean deep seas
Imaging Active RSMicrowave/SAR Spaceborne10–100Low
7 m
Image resolution slicks, fronts, weather conditions (e.g., waves)Applicable over large areas;
unaffected by cloud cover
Complex and not so accurate;
relative low accuracy
Open, coastal and oceanic waters but unreliable
Imaging Passive RSOptical—analyticalUp to 30HighWater quality (clarity or turbidity), cloud cover, atmospheric conditionsBased on physical processes;relatively high accuracyComplex execution with several required input parameters;
Real-time in situ data essential;
concurrent sea truth essential
Turbid and shallow inland waters, estuary and river nearshore and coastal waters;
(theoretically, the 0.48–0.60 μm radiation can penetrate clear, calm sea water up to 20 m)
Optical—empiricalUp to 30to 10 m with a bias of <0.1 m [21]Atmospheric calibration, water turbidity; bottom reflectanceSimple to implement; accurate at definite depthLimited depth-accuracy lower at a larger depth;
real-time ground truth essential
It should be pointed out that Table 1 shows the radar altimetry and SAR methods (although this is not the main goal of this article) for comparison with the optical SDB method.
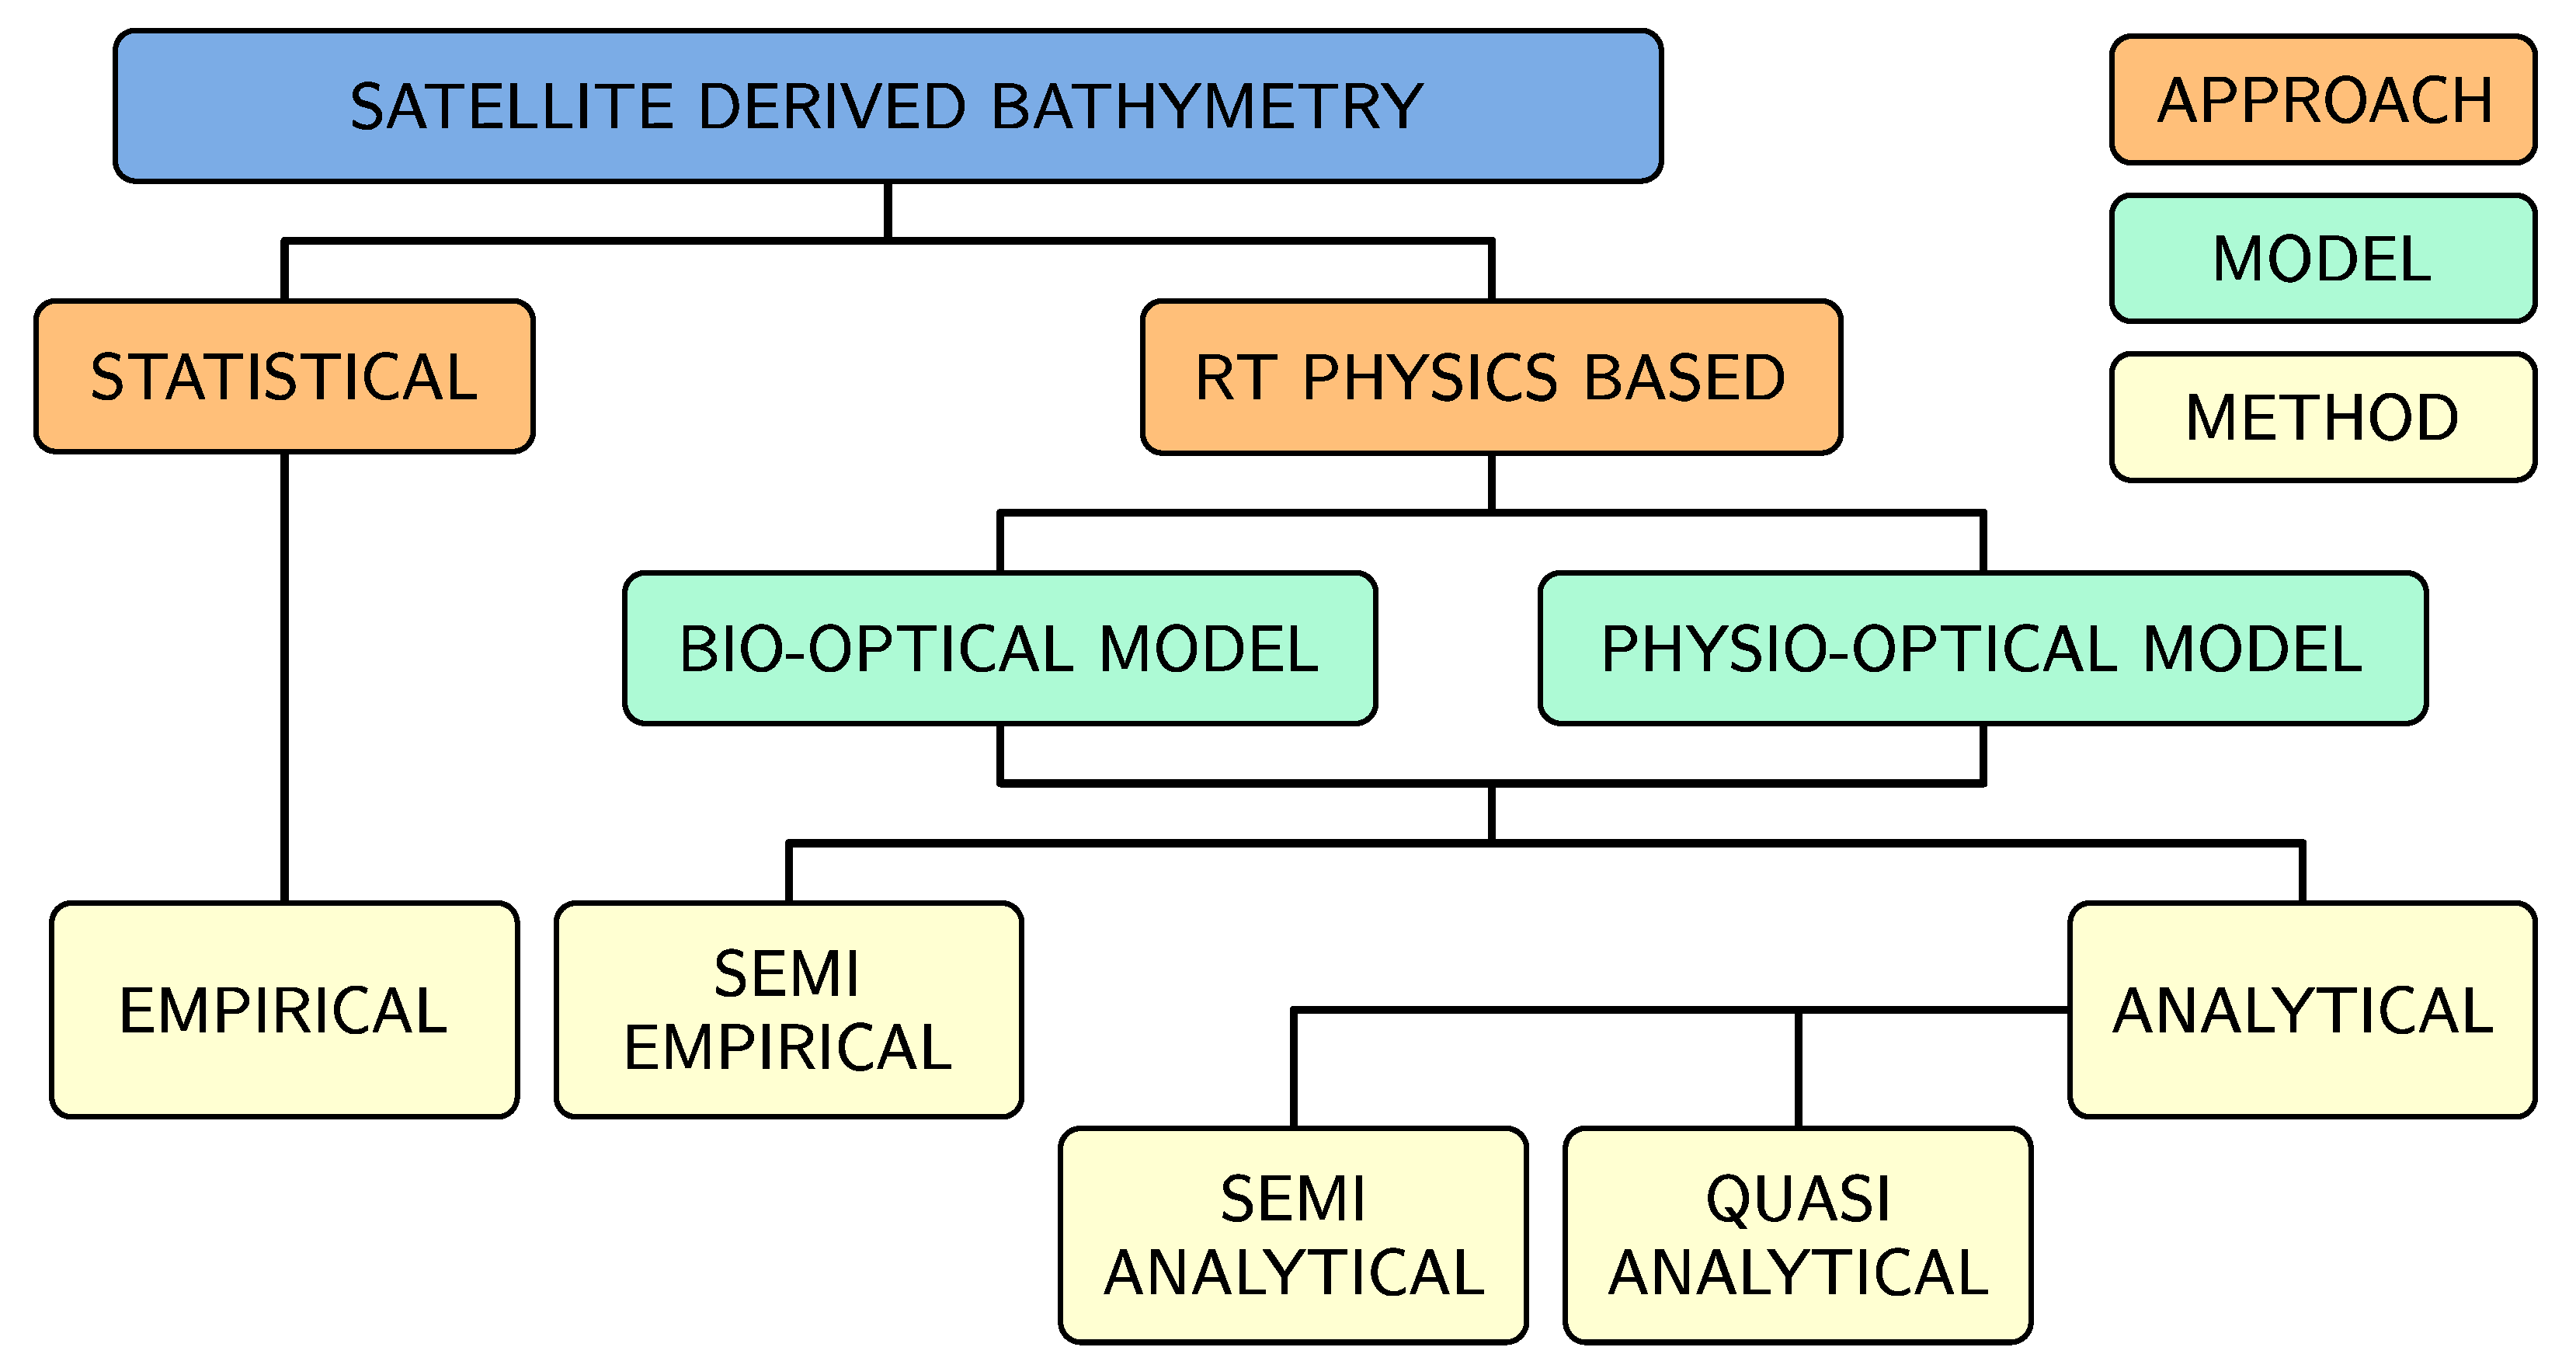
Many authors divide the algorithms and methods for determining SDB in different ways. Jawak [20] and Zoffoli [22] divide SDB methods into analytical, semi-analytical and empirical methods. Furthermore, Dickens [23] also lists new categories, namely statistical, physical and machine learning methods (ML). Studying the literature leads to the conclusion that the majority of SDB studies deal with statistical or empirical methods of depth determination using satellite methods.
Likewise, by studying the literature, a conclusion was reached that Polcyn [24] developed the first semi-analytical algorithm for depth determination using satellite scenes, and an improved algorithm was proposed [25]. Lee [26] further improved the semi-analytical method for different inherent optical properties (IOPs). Most studies, according to this bibliographic study, deal with statistical or empirical methods of depth calculation.
In the SDB literature, two main approaches were mostly cited (Figure 2):
  • The statistical method, which has recently been improved with machine learning techniques, requires in situ data when determining depths. This method uses the principle of connecting remote sensing spectral data and bathymetry without considering the propagation of the electromagnetic wave through the water column. It is a statistical approach that uses an empirical method for determining water depth [26].
  • The physically based radiative transfer approach deals with and emphasizes the journey of the electromagnetic wave and its attenuation in the atmosphere and water, and it can be divided into two models:
    • A bio-optical model that is based on the assumption that the optical properties of water vary with the amount of biological material [26]. This model for determining water depth uses the following:
      i.
      Semi-empirical method.
    • The physio-optical model explains the reflection as a function of water quality, water depth and the bottom reflection model, which inversely provides an estimate of water depth [27]. The model for determining water depth uses the following:
      i.
      Semi-analytical method;
      ii.
      Quasi-analytical method;
      iii.
      Analytical method.
The statistical or empirical method (Figure 2) for determining depths requires knowledge of the measured depths in order to evaluate the method itself. The advantages of the statistical or empirical method are that it is fast and simple, while the disadvantage of this method is the impossibility of controlling uncertainties outside the training area [28] (the method requires high-quality training area depth data). There are problems when applying the method on different types of seabed and problems related to the vertical accuracy of the obtained data [29].
The physics-based method fully models the light pathway. Its advantages are the quantification of uncertainty, depth determination without the need for in situ data, achieving high vertical depth accuracy, and it is sensor- and location-agnostic, while the biggest disadvantage is the complexity of the method and its complications [3,30].
Table 2 lists twenty known models for determining the depths of shallow areas: the year the methodology appeared, the authors and publications that presented them, the approach the methodology uses, the types of sensors used, the output result and the area of application of the methodology itself. The table was compiled according to previous articles that dealt with that methodology [3,22,23] and was supplemented with our information.

2.2. Bibliometric Analysis

Scientific communication has taken place for many years using scientific journals with the aim of making research results available to a wide range of users. Recently, the boundary between formal and informal communication has changed, which has been influenced by open access publications, the Internet, databases, bibliometric indicators, new scientific areas, a large number of scientific papers and data analysis tools [48]. Today, more than ever before, fast, accurate, high-quality and relevant data exchange is therefore extremely important.
Bibliometric analysis has been used in recent years for the examination and statistical evaluation of the published scientific literature and for measuring the literature’s influence in the scientific community [49]. Bibliometrics applies statistical methods that study and investigate the quantitative properties and behavior of the content of scientific literature, which appeared in the 1970s and developed with the appearance of scientific databases and programs for processing bibliographic data [50].
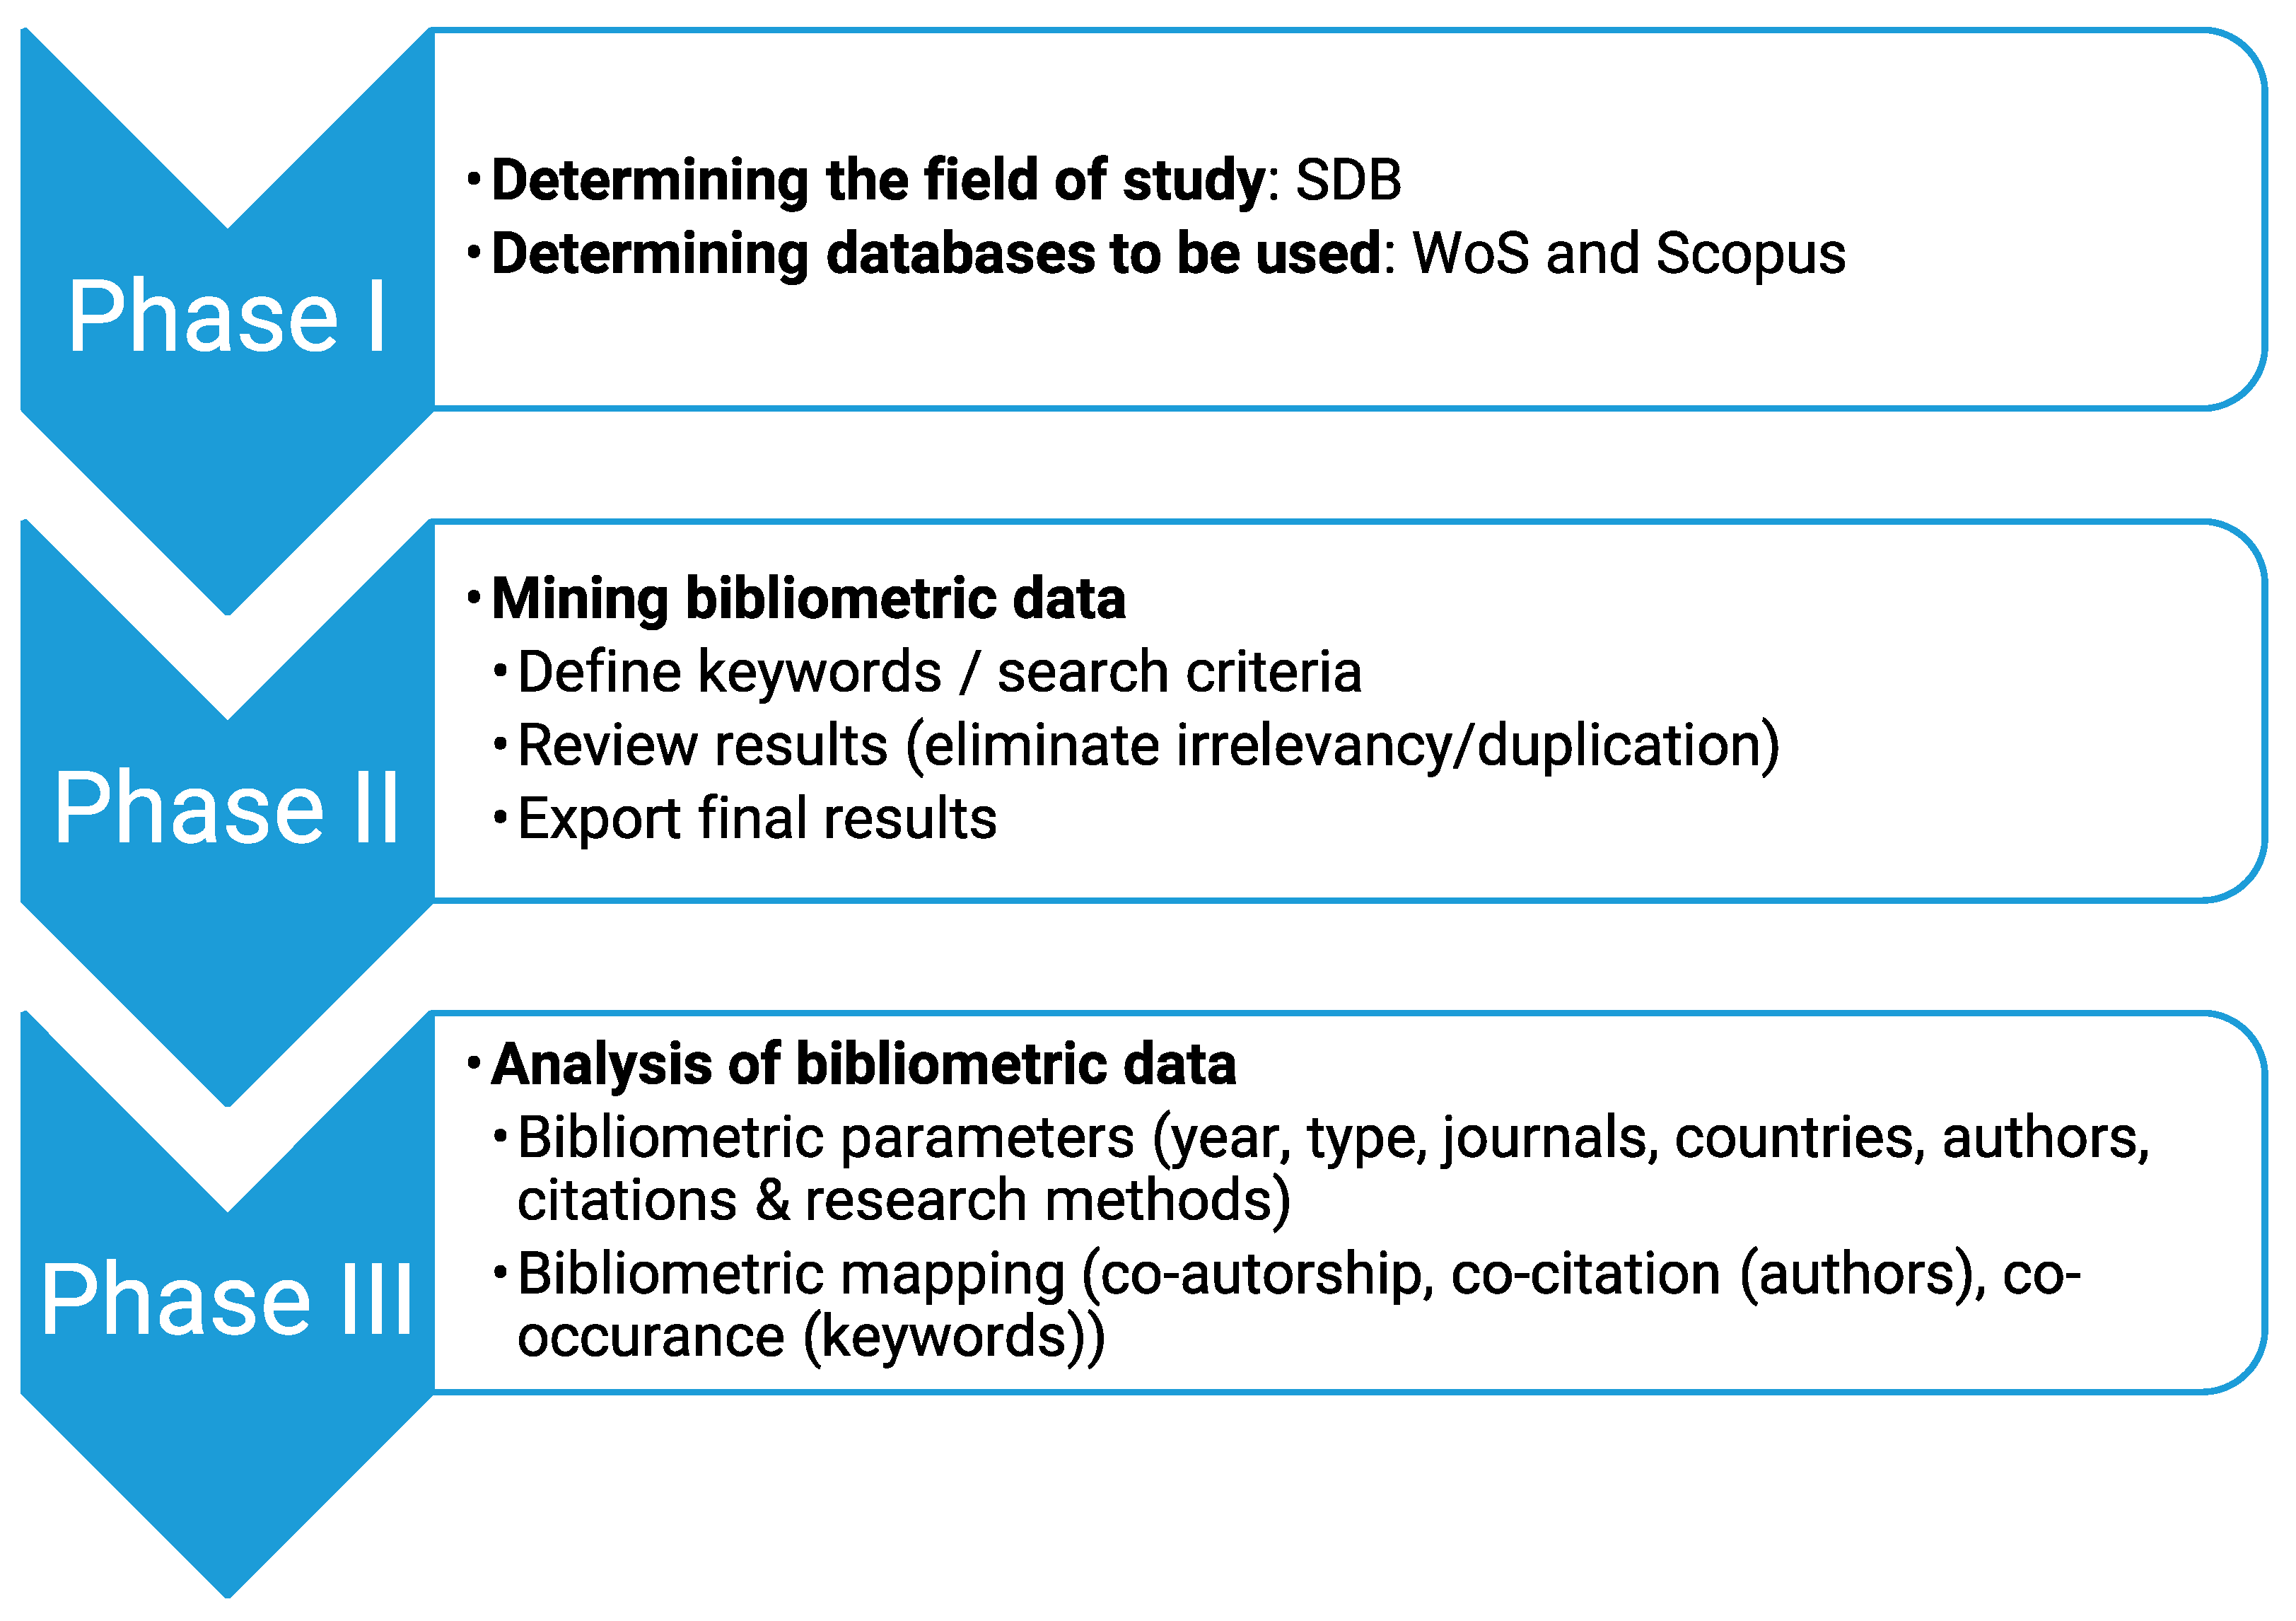
Systematic literature reviews and bibliometric studies provide a good methodological procedure that minimizes bias and errors when processing a particular scientific field of activity [51,52]. The proposed methodology of bibliometric analysis is structured in four phases that enable the full implementation of the analysis: (1) defining search criteria, keywords and time periods; (2) data compilation; (3) adjustment and improvement of criteria; (4) export and analysis of results [53] (see Figure 3).

2.3. Bibliometric Analysis of the SDB Literature

2.3.1. Bibliographic Database

Although there are several freely available databases—such as Google Scholar (GS), CiteSeerX, Microsoft Academic Search, getCITED and Dimensions—paid subscription databases—such as ISI Web of Science (WoS; previously known as Web of Knowledge) and Scopus—are currently the most reliable [54,55]. Therefore, those two databases were selected for analyses [56,57].
The list of popular software tools for bibliometric analysis and visualization is as follows: VOSviewer [58], Gephi [59], Bibliometrix [60], HistCite [61], CiteSpace [62], Pajek [63], Sci2 Tool [64], PoP (Publish or Perish) [65], BibExcel [66], UCINet [67], Biblioshine [68], BiblioMaps, CiteNetExplorer and SciMAT. Other tools for bibliometric analysis are listed as follows: BiblioTools, Citan, Metaknowledge, ScientoPy, NVivo, UCInet, SITKIS, Netdraw, CRExplorer, ScientoPyUI, etc.
Of all the mentioned software tools, the most user-friendly programs for bibliometric analysis and the programs that many authors use most often are R Studio Bibliometrix and Biblioshiny, which were also used for our analysis [69]. Most software is written in Python or R programming language [70,71].
The program easily supports scholars in using the main features of Biblioshiny by using the following steps:
  • Defining search criteria and final search results;
  • Data gathering using the WoS and Scopus APIs collection;
  • Importing data into Biblioshiny and data filtering if necessary;
  • Analytics and plots for several different level metrics (sources and affiliations; authors and publications; documents and clustering by coupling);
  • Analysis of the results obtained.

2.3.2. Defining Search Criteria

When setting the criteria for the search, we ran into a problem because some authors call this method by different names. Although the name satellite-derived bathymetry has recently become common, there are still articles and authors that do not use this term either in the title or in the keywords; therefore, we needed to widen the search field. We started the search with the initial query or search criteria of the research field, and we obtained 152 results from all databases.TS = (“Satellite Derived Bathymetry”)
In the phase of examining the criteria adjustment and refinement of criteria, the examination has been completed with the following final query:
TS = (“Satellite Derived Bathymetry” OR “Bottom Reflectance from Multispectral Imagery” OR multispectral shallow water bathymetry OR optical remote sensing shallow water depth OR satellite imagery water depth determination OR “passive remote sensing techniques for mapping water Depth”) NOT TS = (satellite altimetry OR *SAR OR gravity OR microwave OR benthic*), which resulted in 435 results from the Web of Science Core Collection.
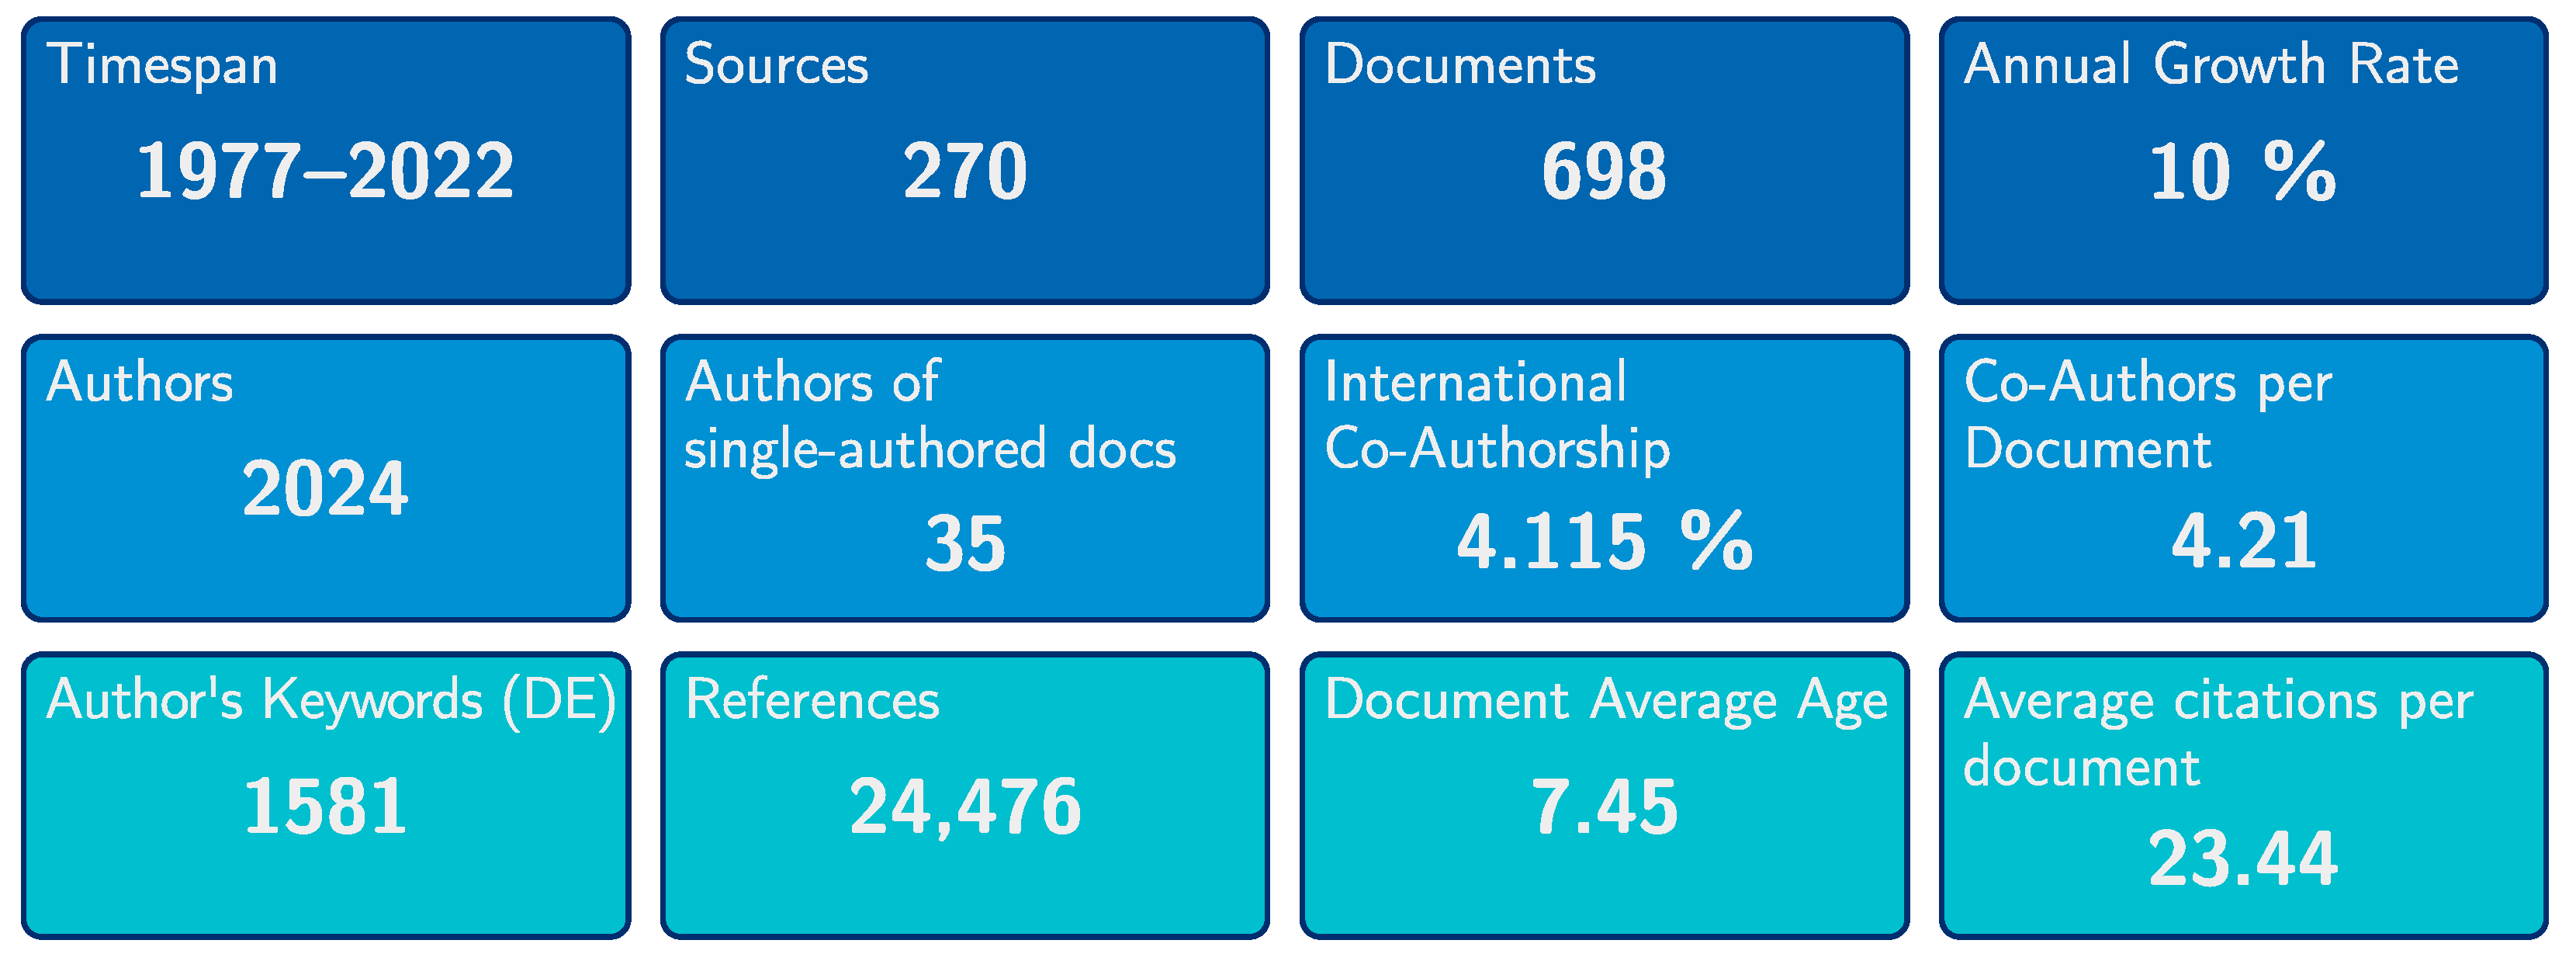
Selecting queries listed above included the optimal number of references from the WoS scientific database, and the same search parameters in the Scopus database have been repeated. In the search, 435 references were found for the search query in WoS, while a total of 567 references were obtained for the same query in Scopus. This difference occurs because most papers in WoS are articles, and there are a large number of conference papers among the Scopus references. The portage results of both databases were combined, and 304 duplicates were found. Before starting an analysis of the results, we combined the results using JabRef and Excel; after that, we filtered the data and eliminated duplicate results. The total number of unique references in Scopus and WoS is 698. Figure 4 shows the main information unified in the WoS and Scopus databases from Biblioshiny.

3. Results

The following paragraphs elaborate on the performed bibliometric analysis. The results include documents from both databases, WoSCC and Scopus, which were combined into joint results (previously cleaned of duplicate documents, as explained in the previous chapter). It should be noted that the term “document” is used since the Biblioshiny software uses that term. Thus, the following results encompass 698 documents.

3.1. Analysis of Scientific Production

For the period from 1977 to 2022, 270 sources with 698 documents covering the SDB field were found. The average age of documents is 7.45 years, and the annual growth rate is 10%. There are 2024 authors in total, of which 35 are authors of single-authored documents. International co-authorship is 4.16%. The total number of references is 24,476, and the average number of citations per document is 23.44. Figure 4 provides these and other main information about retrieved documents. Looking at the annual production, the number of publications grew from 10 in the early 1980s to 50 and more in recent years (Figure 17).

3.2. Analysis by Journals

3.2.1. Sources and Affiliations

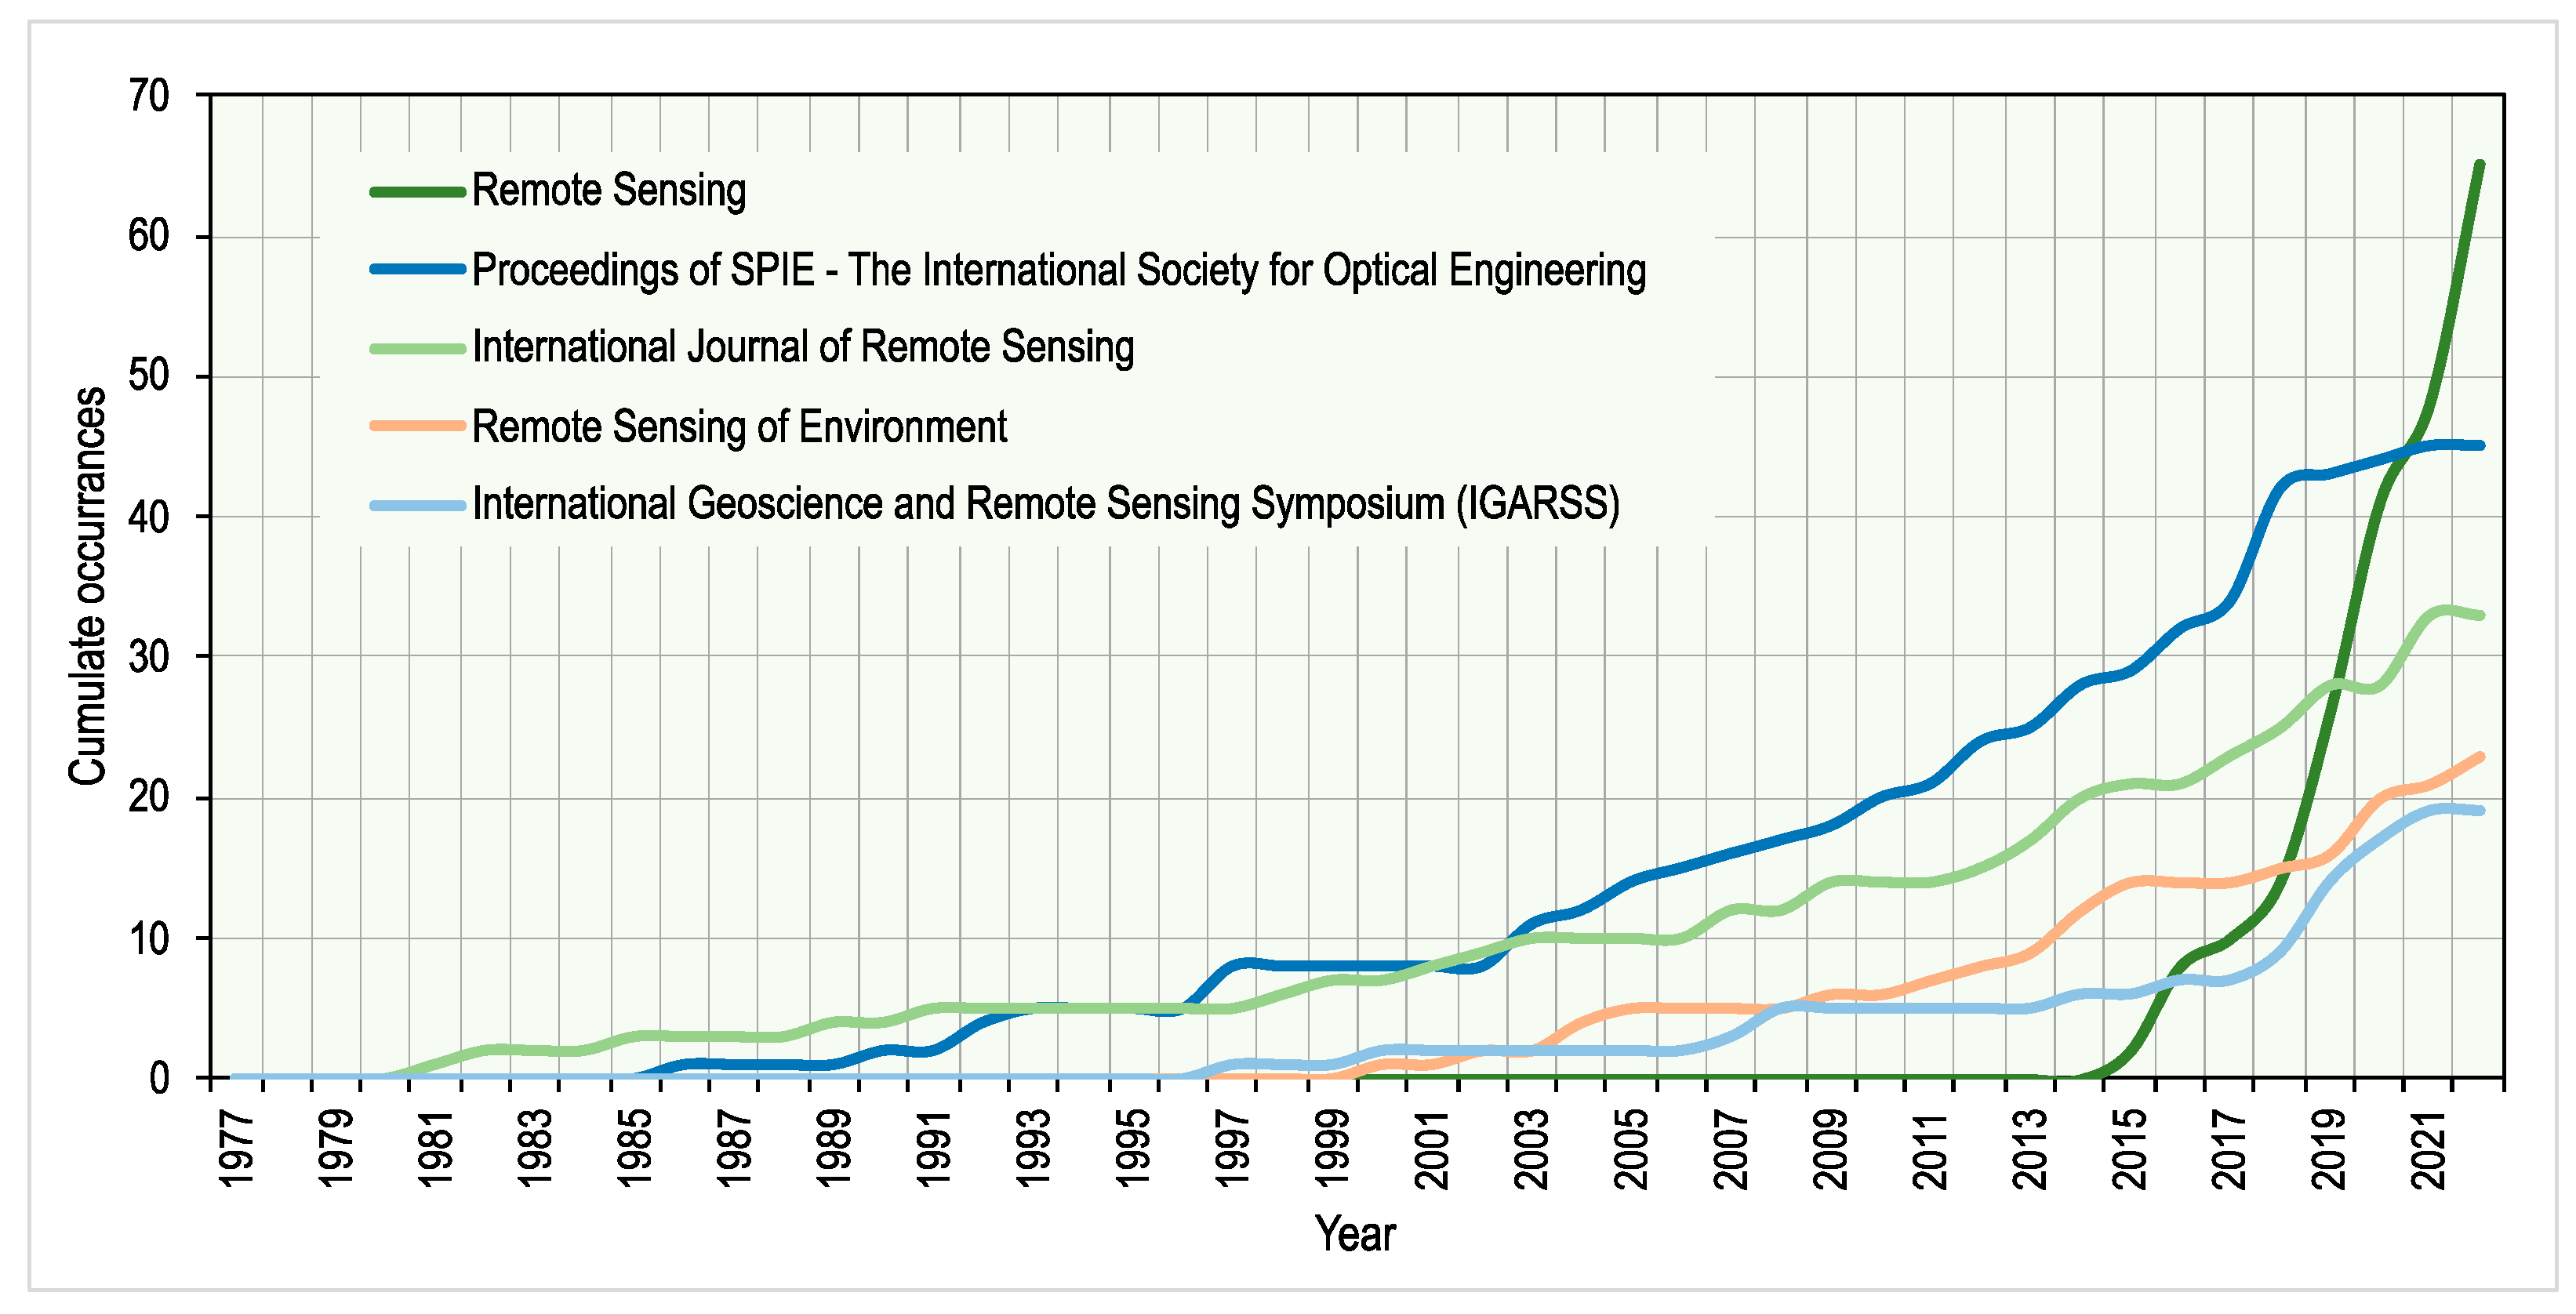
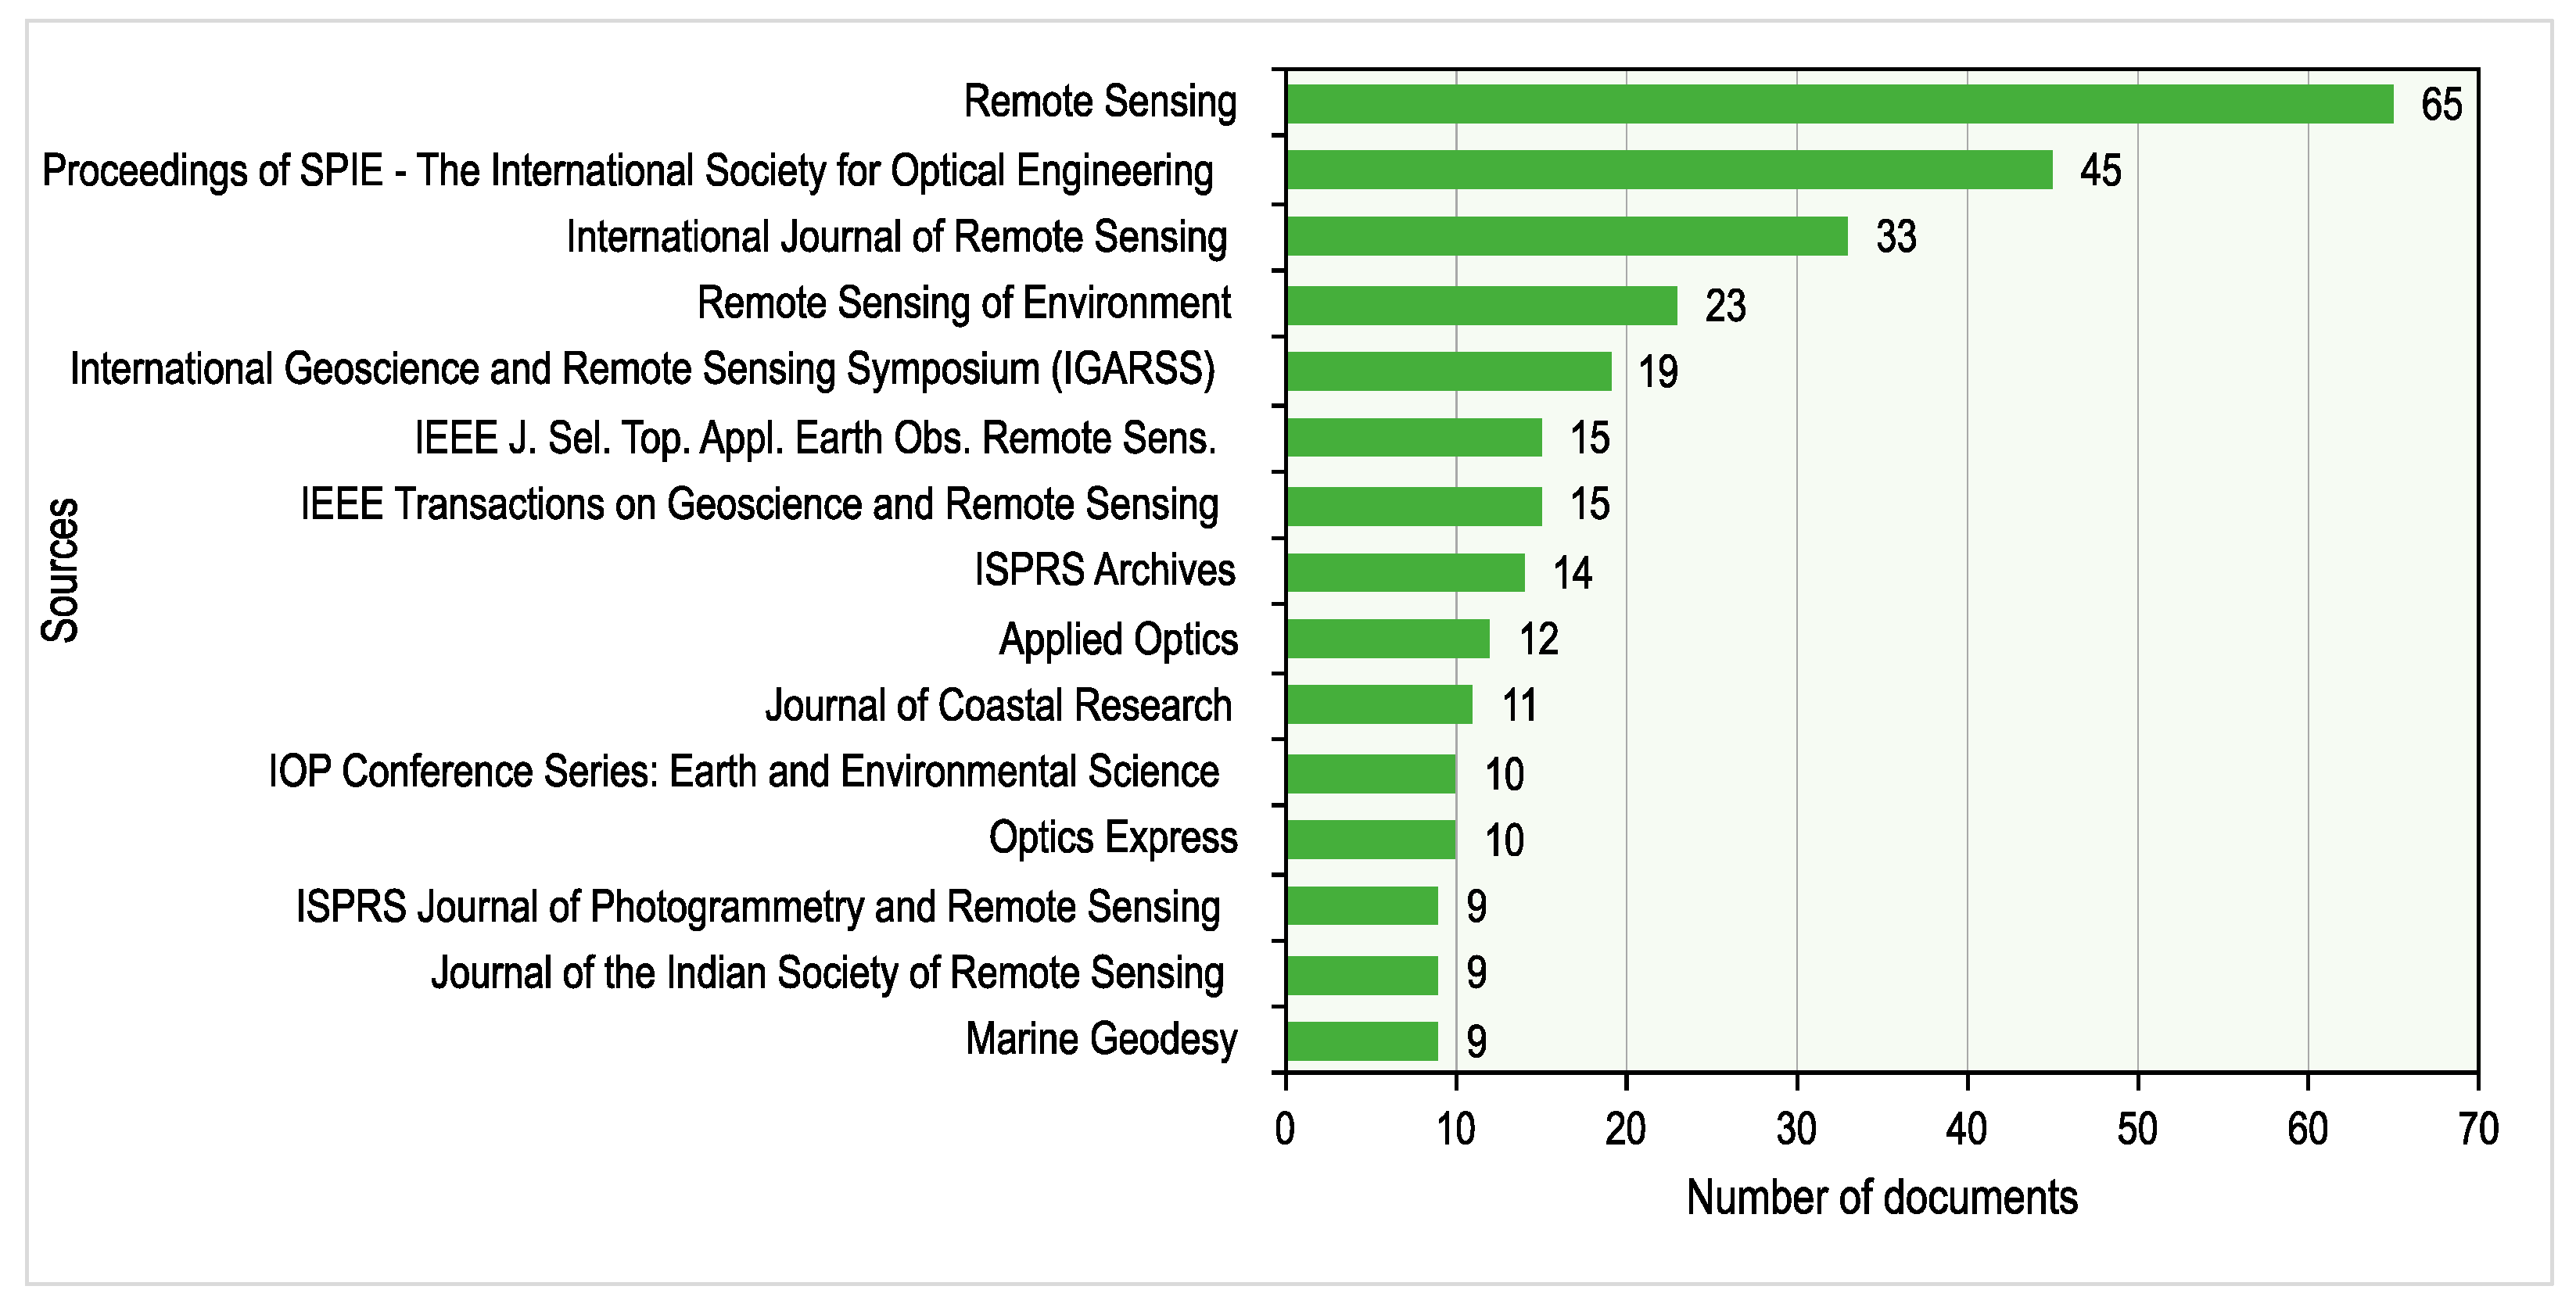
In the combined WoS and Scopus databases, we listed a total of 698 articles (documents) for optical SDB, where the WoS database mainly contains articles from scientific journals, while the Scopus database also contains a large number of conference papers. Three sources stand out from the rest in terms of the number of documents on SDB: Remote Sensing (online ISSN: 2072-4292) with 65 documents; Proceedings of SPIE—The International Society for Optical Engineering (ISSN: 0277-786X) with 45 documents; and International Journal of Remote Sensing (online ISSN: 1366-5901) with 33 documents. Other magazines published less than 30 articles. Figure 5 shows the dynamic of the cumulative number of documents in the top five sources over the years, while Figure 6 shows the total number of documents from the combined WoS and Scopus databases’ querying results that were published in each source so far. From 2014 to the present day, the Remote Sensing journal has recorded a significant growth in articles covering SDB topics—from 0 articles to a total of 53 in the year 2022. The Proceedings of SPIE—The International Society for Optical Engineering and International Journal of Remote Sensing had the largest number of papers in 2000, while in 2022, the Remote Sensing journal took the lead in the number of published articles from this scientific area.
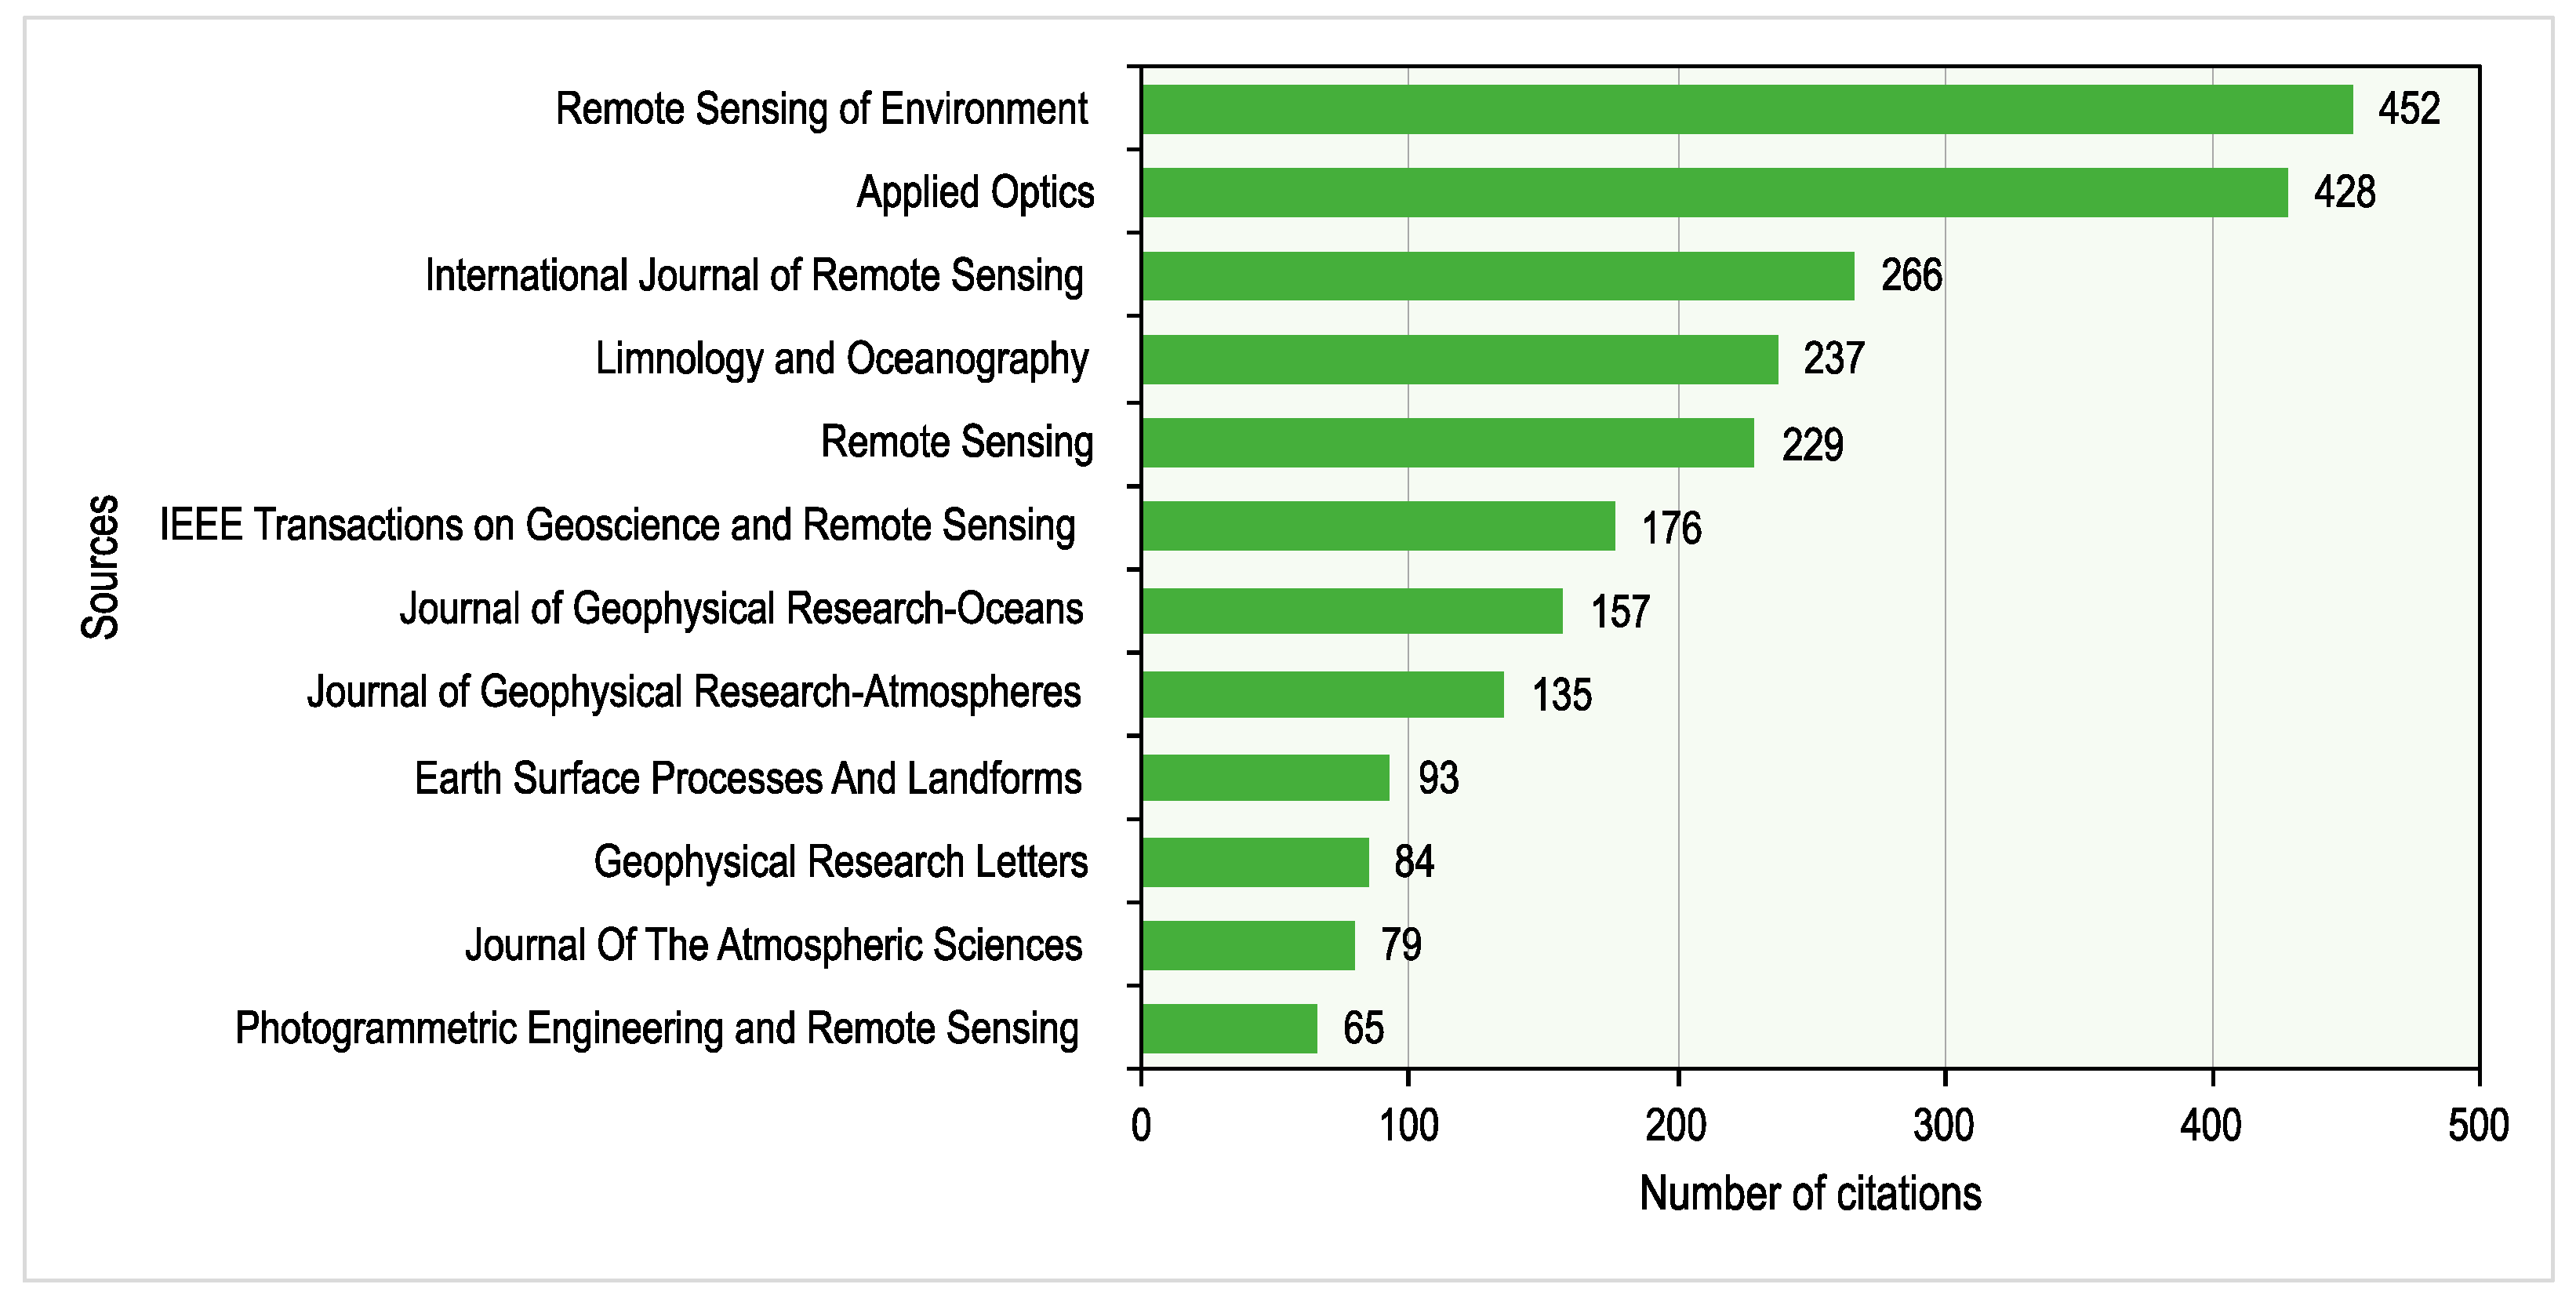
Figure 7 shows the number of local citations across sources, i.e., journals. Local citations are extracted from the reference lists of all 698 documents included in the unified WoS and Scopus database. They represent the number of documents that were cited in all 698 documents included in the analysis and are summed by sources. The top five sources by local citations are the following: Remote Sensing of Environment (online ISSN: 1879-0704) with 452 local citations is the first one, followed by Applied Optics (online ISSN: 2155-3165) with 428, International Journal of Remote Sensing (online ISSN: 1366-5901) with 266, Limnology and Oceanography (online ISSN: 1939-5590) with 237 and Remote Sensing (online ISSN: 2072-4292) with 229 local citations (Figure 7).
Table 3 shows 16 journals according to the WoS database with the largest number of published papers in the field of “optical SDB”, the citations of published papers and the ratio of published and cited papers. Most papers on the subject of SDB were published in the journal Remote Sensing (Basel) (ISSN: 2072-4292), with a total of 56, while the papers published in the journal Remote Sensing of Environment (ISSN: 344257) were the most cited, with a total of 1360 citations. Applied Optics (ISSN: 1559-128X) has the highest ratio of cited and published works with 106.73, while the lowest ratio is 1.50 with respect to the Journal of the Indian Society of Remote Sensing (ISSN: 0255660X). The table also shows different journal ranking indexes (h-index, Journal Impact Factor, Cite Score, and SJR) and the best quartile for each journal. The journal Remote Sensing (Basel) (ISSN: 2072-4292) has the highest h-index of 17, and the Journal of the Indian Society of Remote Sensing (ISSN: 0255660X) has an h-index of 3, which is the lowest. Remote Sensing of Environment (ISSN: 344257) has the highest impact factor, CiteScore factor and SJR factor among journals, and the Journal of Coastal Research (ISSN 0749-0208) has the lowest ranking factors. Most journals, i.e., twelve out of sixteen, are best ranked in the first quartile, three journals are best ranked in the second quartile, while only one journal, Journal of Coastal Research (ISSN 0749-0208), is best ranked in the third quartile.

3.2.2. Analysis by Affiliation

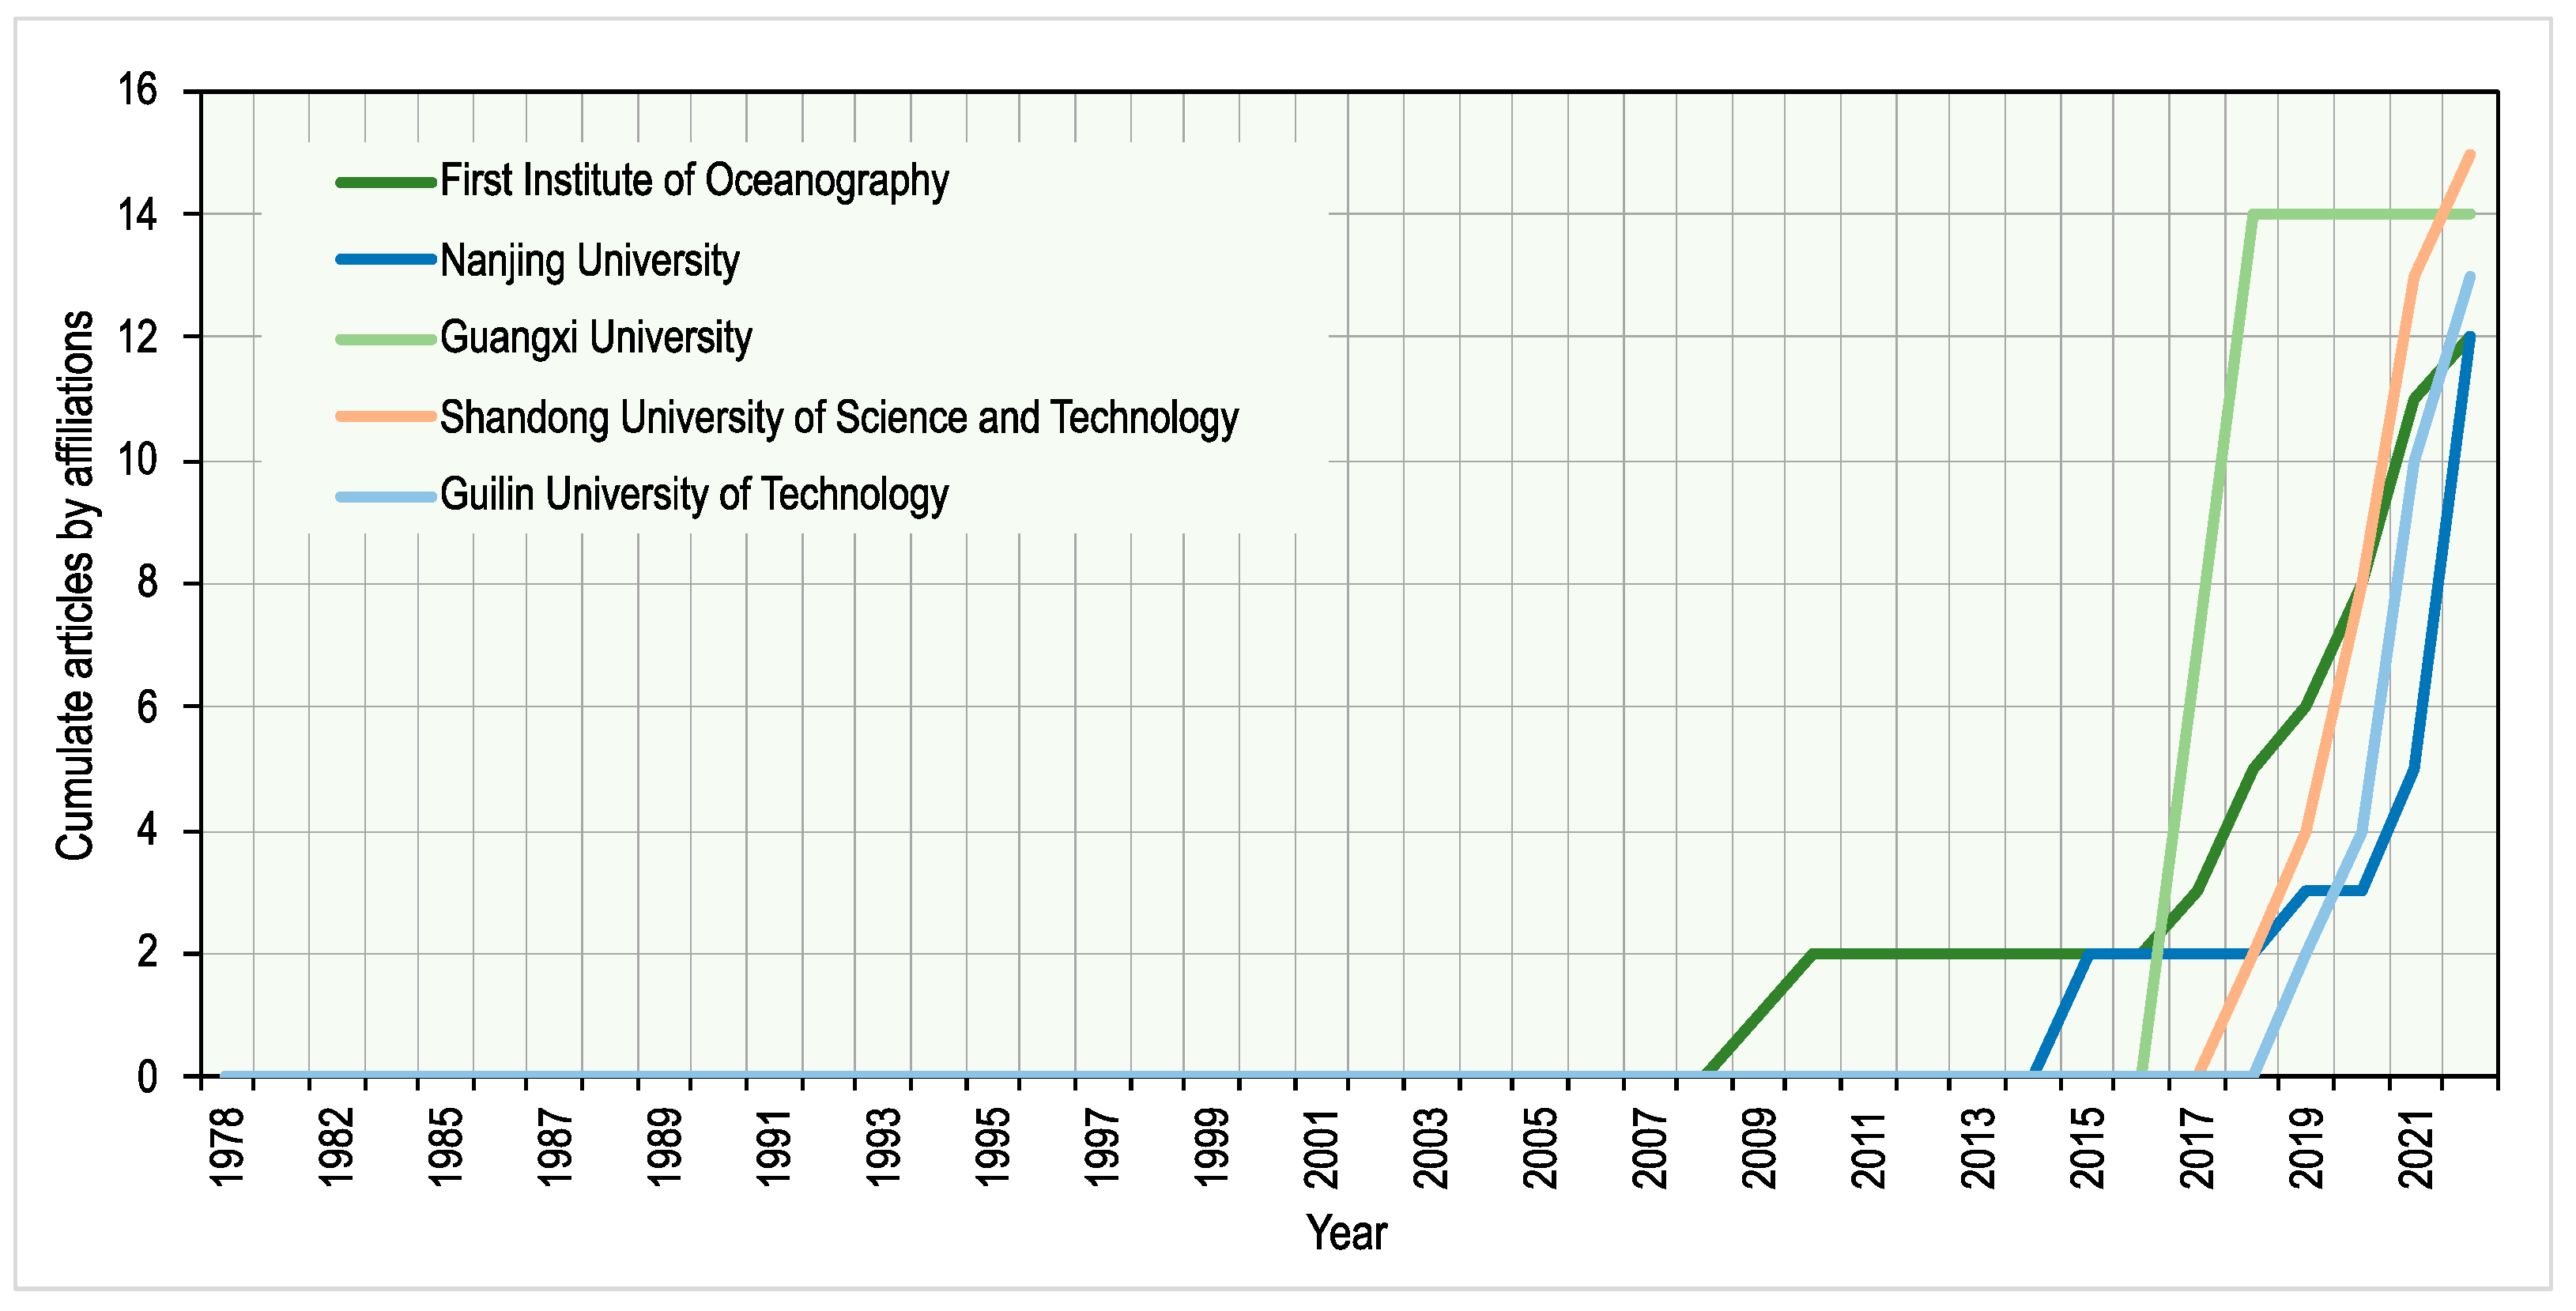
By analyzing affiliations, the most relevant affiliations by the number of articles are as follows: Shandong University of Science and Technology published 15 articles, Guilin University of Technology published 13 and First Institute of Oceanography and Nanjing University published 12 articles each (all from China; Figure 8). Considering the number of affiliations that have published articles dealing with optical SDB over time, it can be concluded that significant growth began in 2014 (Figure 9).

3.3. Authors and Publications

The analysis presented here emphasized authors who research the field of SDB. Thus, a list depicting all the authors having six and more articles related to SDB from both databases, WoSCC and Scopus, is composed, which comprises an overall number of seventeen authors in 2022 (Table 4). Table 4 lists the authors who have published more than six articles according to the unified Scopus and WoS scientific database. The main authors (corresponding) are listed considering the number of articles, affiliations, the country where they work, the total number of citations they received and the h-index. Citation and h-index data are presented according to Scopus (15 October 2022), providing additional insight into the impact of the authors’ work. To uniquely identify the authors, the ORCID is provided as well. It was relatively easy to compile this table with WoS data; however, when Scopus data are included, problems arise because finding data on authors who are not in scientific institutions and do not have their profiles in scientific databases is problematic. Finding data for authors who come from China is equally problematic because of the similar names and surnames; thus, it is possible to easily make a mistake with them. The two top authors having thirteen publications dealing with SDB are Legleiter Carl J. from the USA and Ma Yi from China (Figure 10).
A separate list comprises only the WoSCC database, depicting all the authors having five and more publications related to SDB (Table 5). There are 17 out of a total of 2024 authors with their total citations and h-indexes for each author were collected from the Scopus database, and the ORCID is provided as well. With this narrowed list on WoSCC, the same two top authors were identified—Legleiter Carl J. from the USA and Ma Yi from China—with ten and nine identified publications, respectively (citation and h-index data are presented according to Scopus, 15 October 2022).
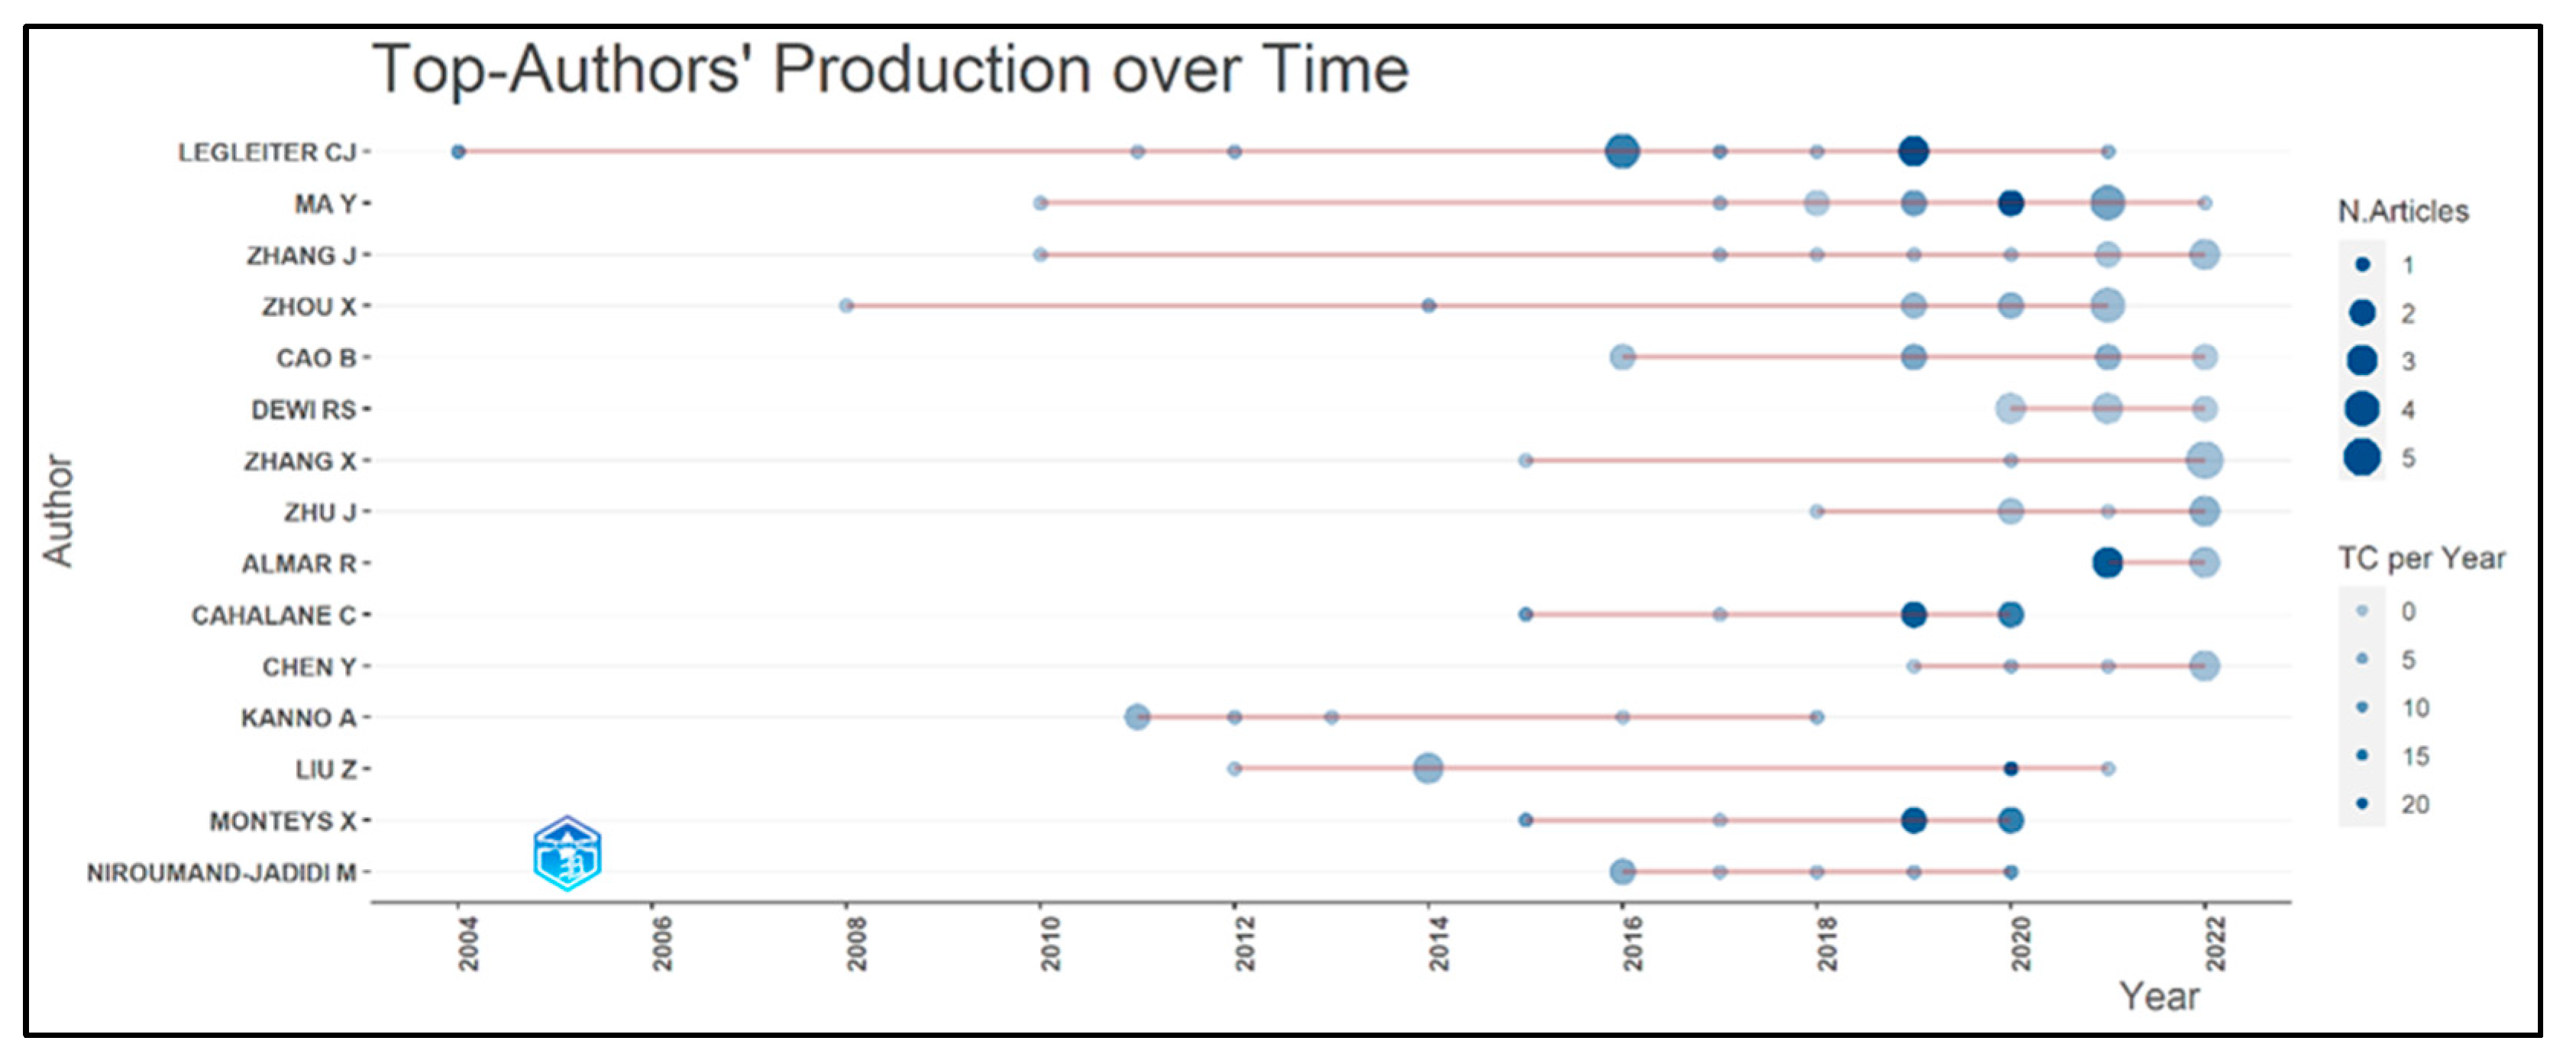
Figure 11 provides an overview of 15 of the most productive and active authors and the number of citations of their articles over time, considering WoSCC and Scopus databases. After 2014, there is a growth in the number of authors, publications and citations related to the SDB. This study tracked the publications of Carl J. Legleiter from the United States Geological Survey since 2004, while the other authors were also tracked over a longer period. Xinghua Zhou from the College of Marine Science and Engineering was tracked since 2008, Yi Ma from the Ministry of Natural Resources was tracked since 2010, Jingyu Zhang from the Ministry of Land and Resources, P.R.C., was also tracked since 2010 and Ariyo Kanno from the Graduate School of Science and Engineering was tracked since 2011. In Figure 11, we can also follow the authors’ citations per year.
An analysis of authors’ citations revealed that articles from “Passive Remote Sensing Techniques for Mapping Water Depth and Bottom Features” published in 1985 by Lyzenga, D. R. had the highest number of global citations (not only by documents included in the collection of 721). Figure 12 provides the ten most globally cited authors by WoSCC and Scopus databases. Five authors have more than 500 global citations. These authors do not correspond to the authors with the largest number of journals about SDB. The most globally cited author is Lyzenga, D. R. from the USA.
A detailed list of the 15 most globally cited articles only from the WoSCC database is provided in Table 6, including authors’ names, articles year, journal and article name, number of citations and DOI number for the unique identification of the article. The Applied Optics journal has published three of four of the most globally cited articles; thus, it is the most influential journal for the SDB topic.

3.4. Countries

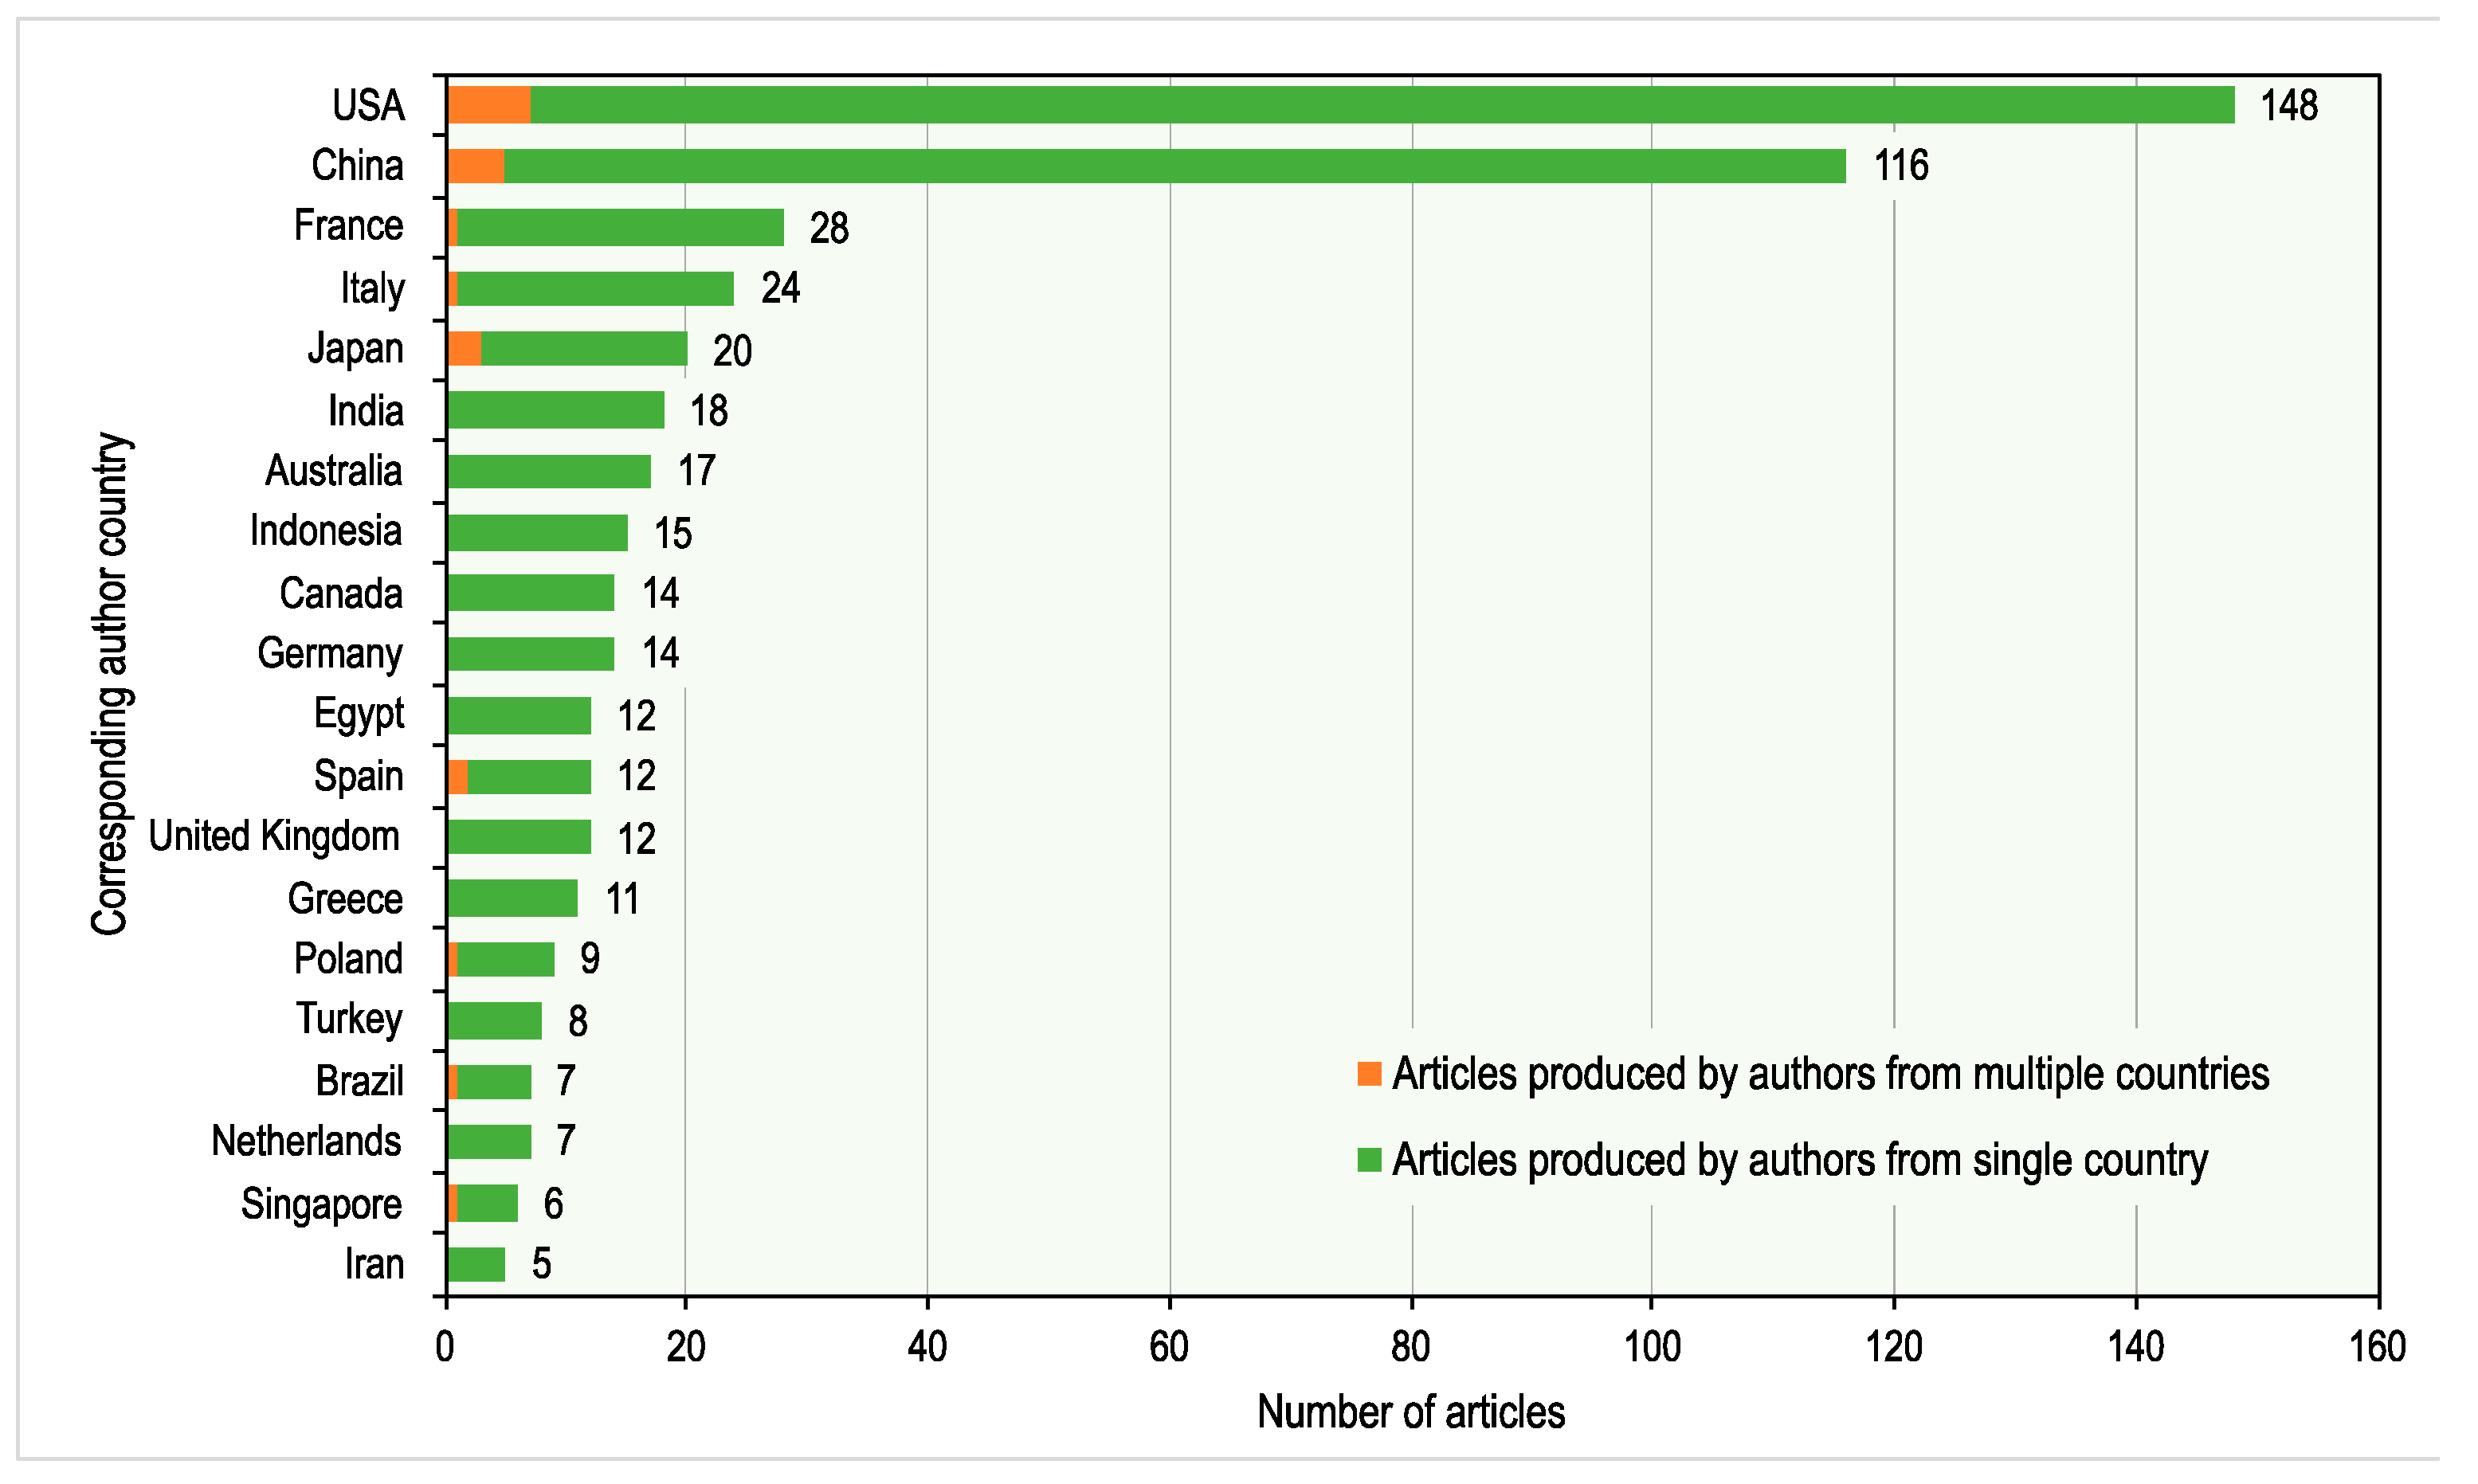
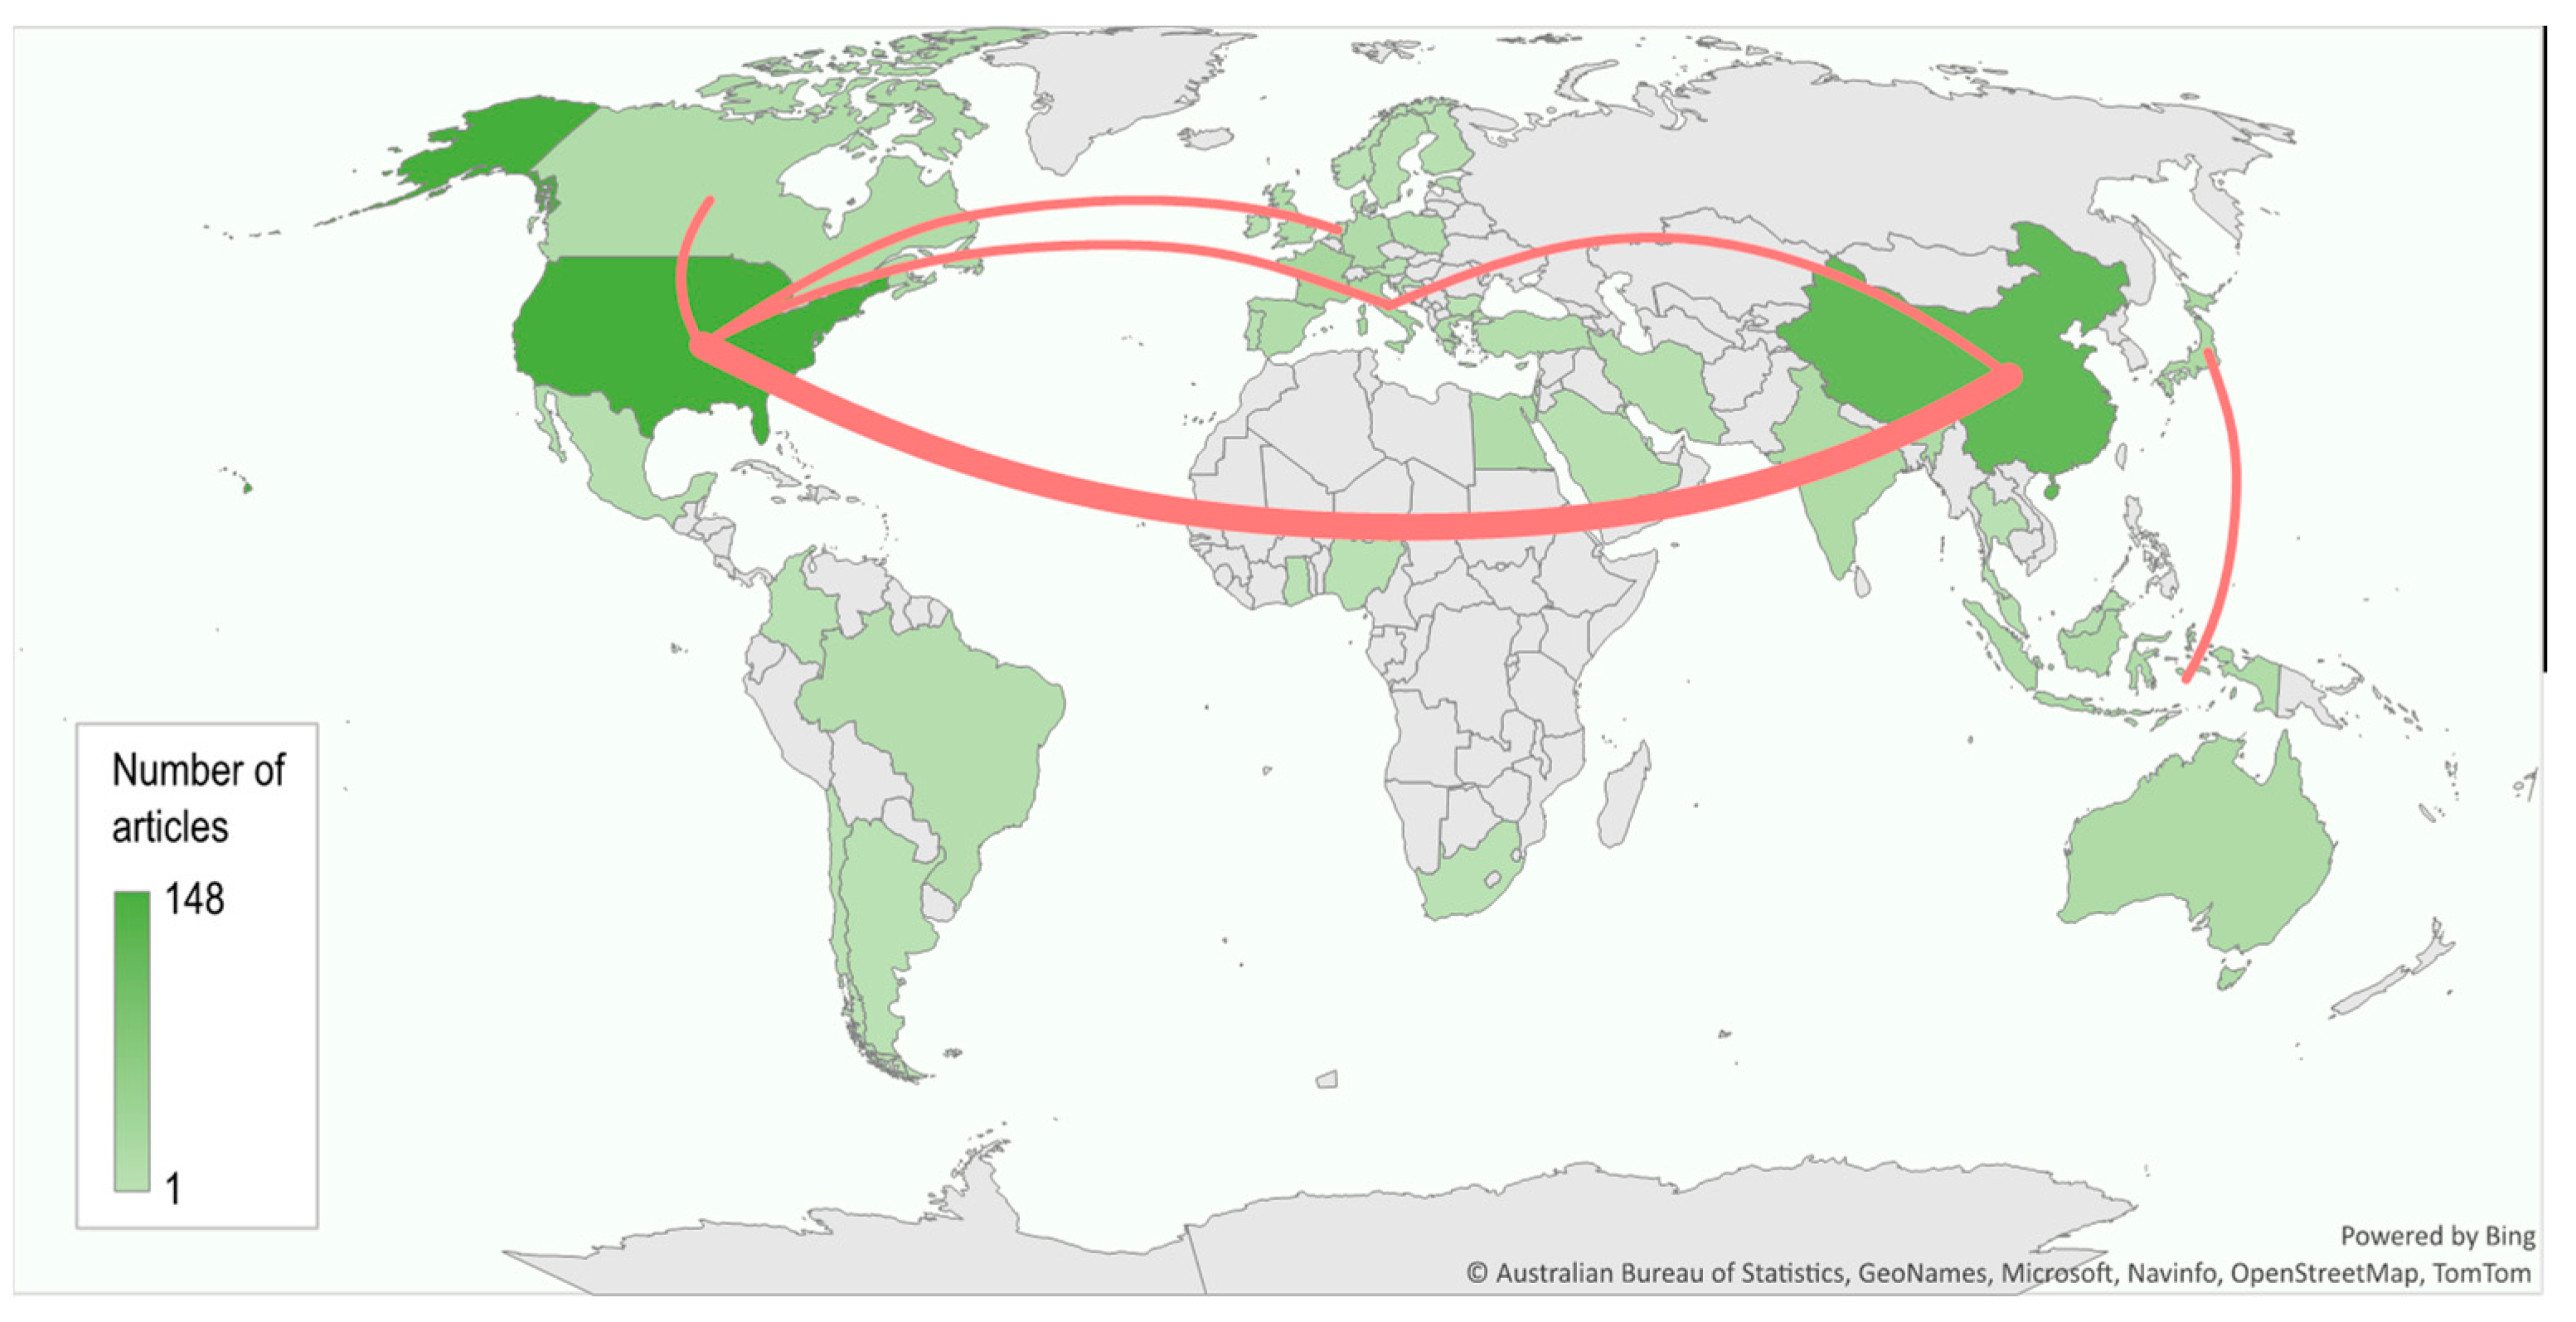
An analysis of the countries of the corresponding authors showed that the USA and China are significantly leading in the number of documents about SDB. There are 148 documents from the USA, followed by 116 from China. Other countries have up to 30 articles, as shown in Figure 13. In Figure 13, the distinction is made between articles in which all co-authors are from a single country (green part of the bar) and articles in which at least one co-author is from a country that is different from the country of the corresponding author (orange part of the bar). It is observable that the USA, China and Japan have the largest number of articles due to international cooperation; i.e., the articles are produced by authors from multiple countries.
The map shown in Figure 14 illustrates the number of documents and main collaboration among the countries. The most intensive collaboration is between the USA and China.

3.5. Keywords Analysis

The keyword analysis aimed to investigate the knowledge structure underlying the scientific fields of SDB. Both databases, WOSCC and Scopus, provide a set of Keywords Plus for each document extracted from titles and cited references. Keywords Plus captures the documents’ contents with greater depth and variety [61] and thus was selected for keyword analysis.
Table 7 lists the fifteen most-occurring Keywords Plus revealed under the search criteria for SDB. The terms remote sensing, bathymetry and satellite imagery significantly have the highest number of occurrences, because they represent terms or synonyms from which the term SDB is composed. The same can be stated for the terms, satellites and satellite data. Other terms having high occurrences could be grouped into two, with one group describing the media/water—shallow water, water depth, quality and reflection—and another group describing the methods—optical, radar, hydrographic surveys, mapping, algorithm and mean square error.
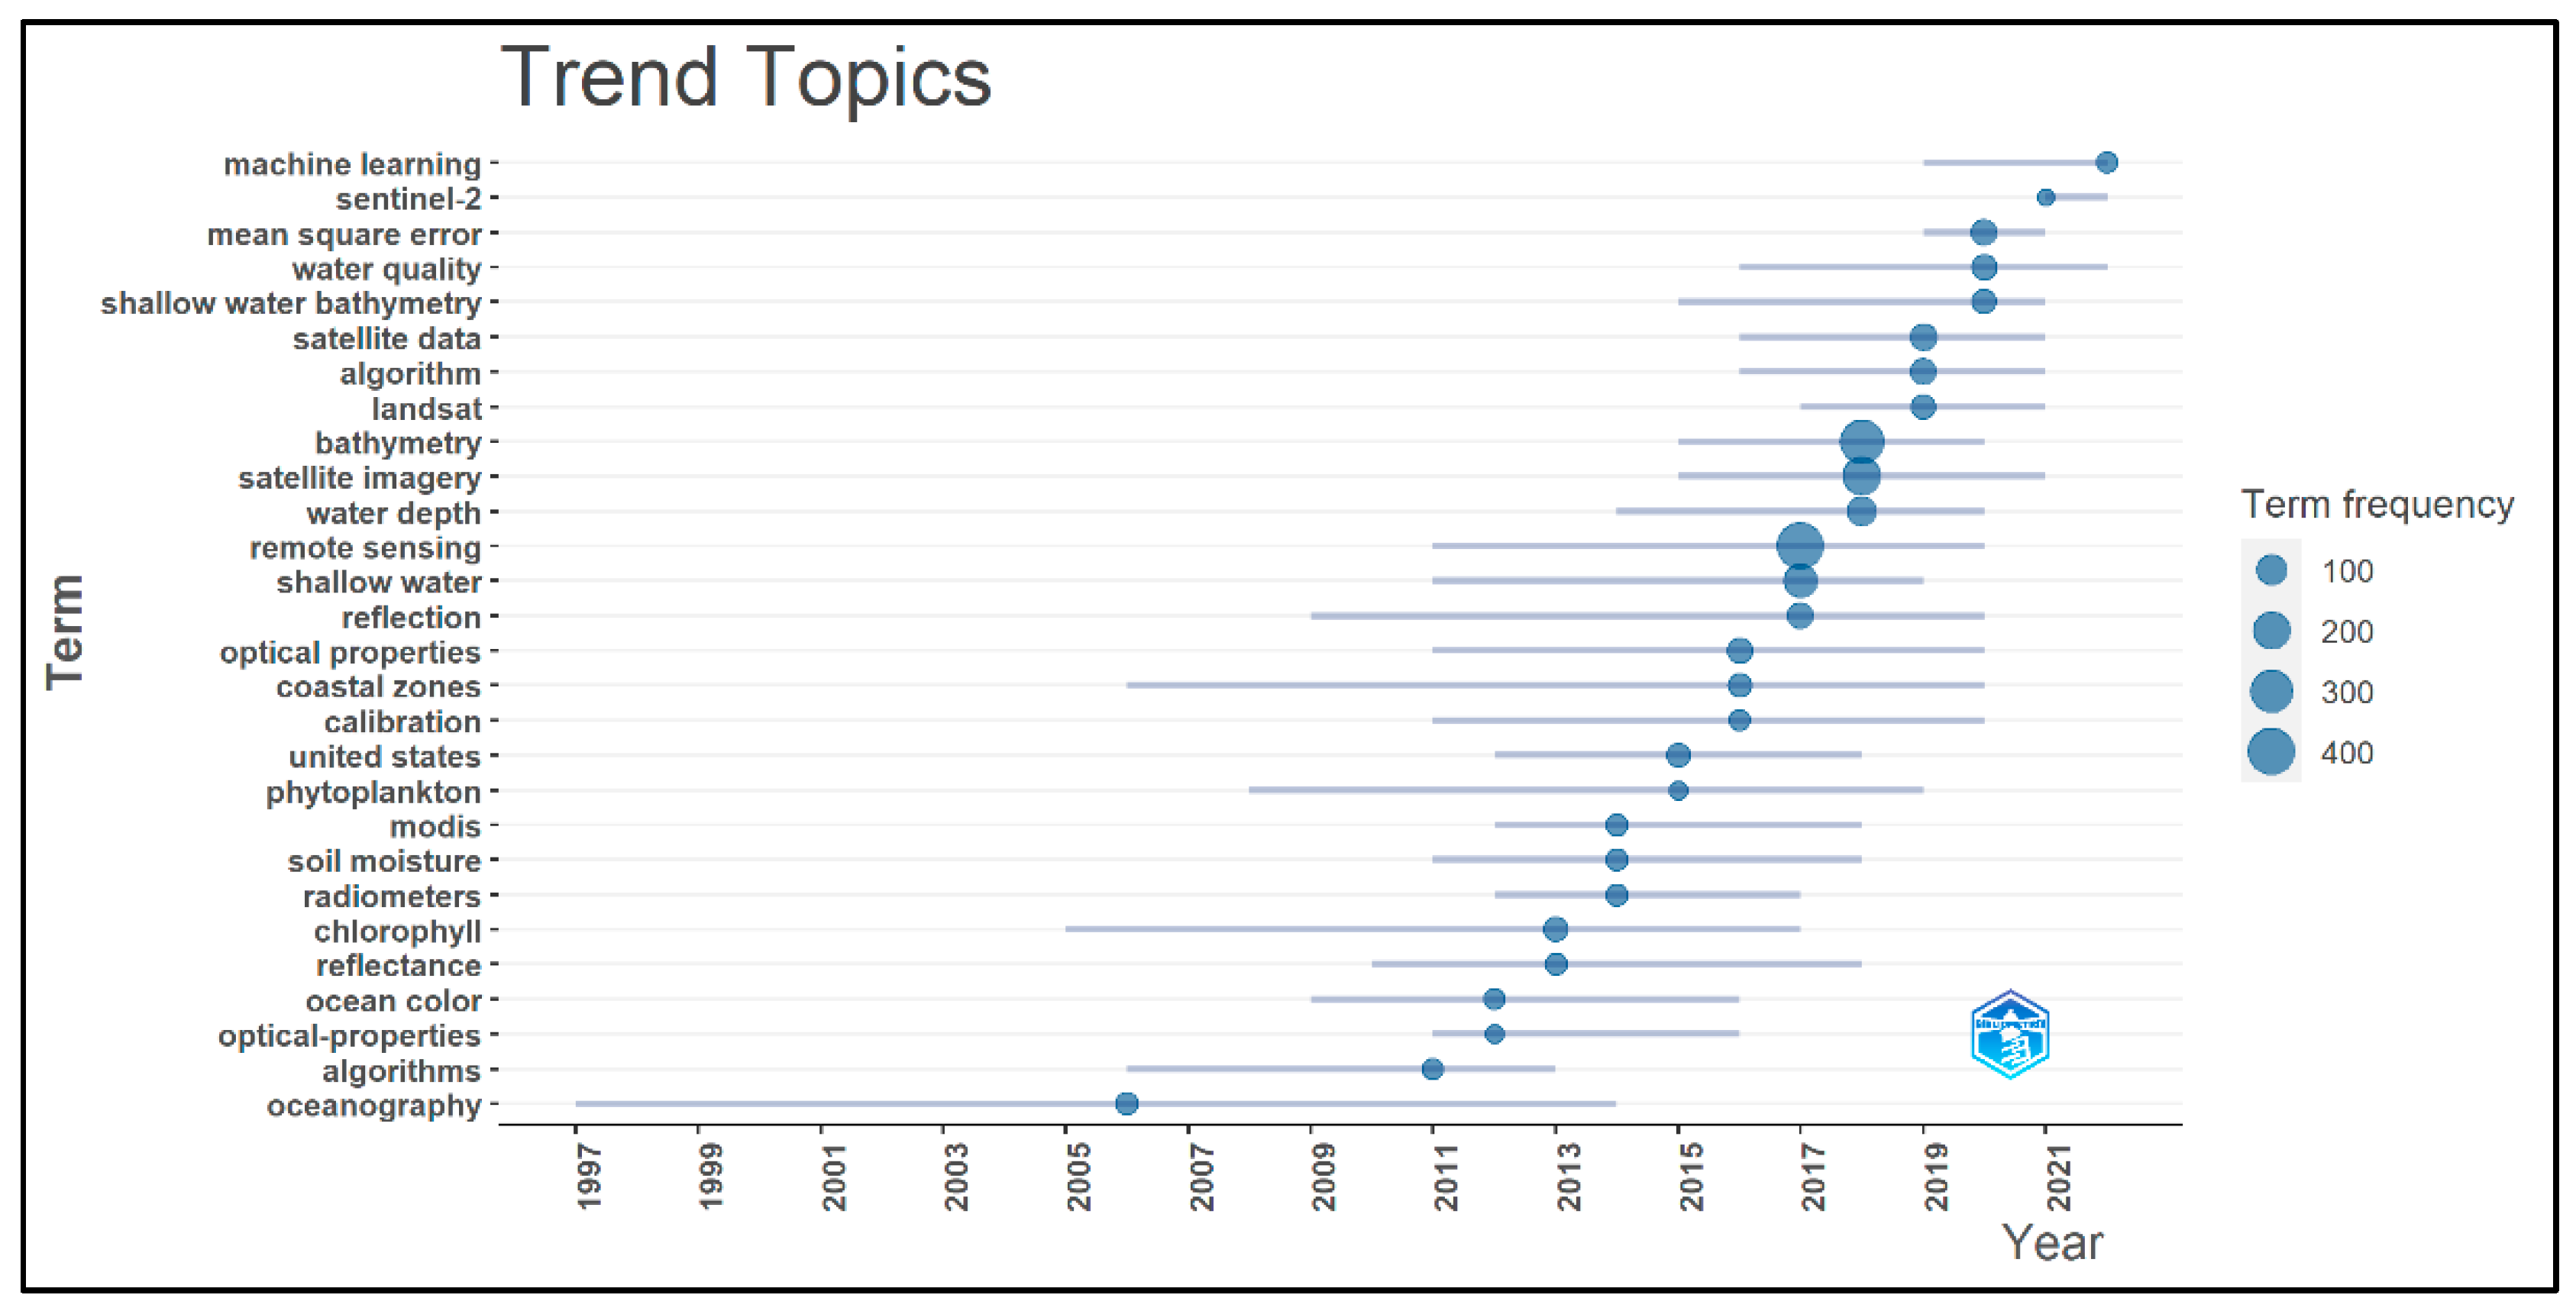
Figure 15 reveals the trend topics or evolution of SDB’s underlying scientific topics/terms over time. The analysis was conducted within a timespan ranging from the year 1977 to 2022, examining Keywords Plus with a minimum frequency of fifteen and three keywords per year. Overall, 28 terms satisfy the previous criteria, starting from the year 1997. Oceanography as the principal application domain dominated from 1997 to 2014, while coastal zones appeared in 2006. Around the year 2010, terms describing methods or media/water started to appear, such as optical properties, reflectance, reflection, radiometers, soil moisture, water depth, shallow water or calibration and also remote sensing. The terms chlorophyll and phytoplankton are continuously being presented as trend topics as they represent water specifics/challenges for SDB. Around the year 2018, new terms appeared, depicting an era of SDB based on machine learning algorithms and Sentinel 2 data.
Figure 16 shows the word cloud of fifty most-occurring Keywords Plus for SDB. “Remote sensing” and “bathymetry” are the most frequent keywords.

4. Discussion

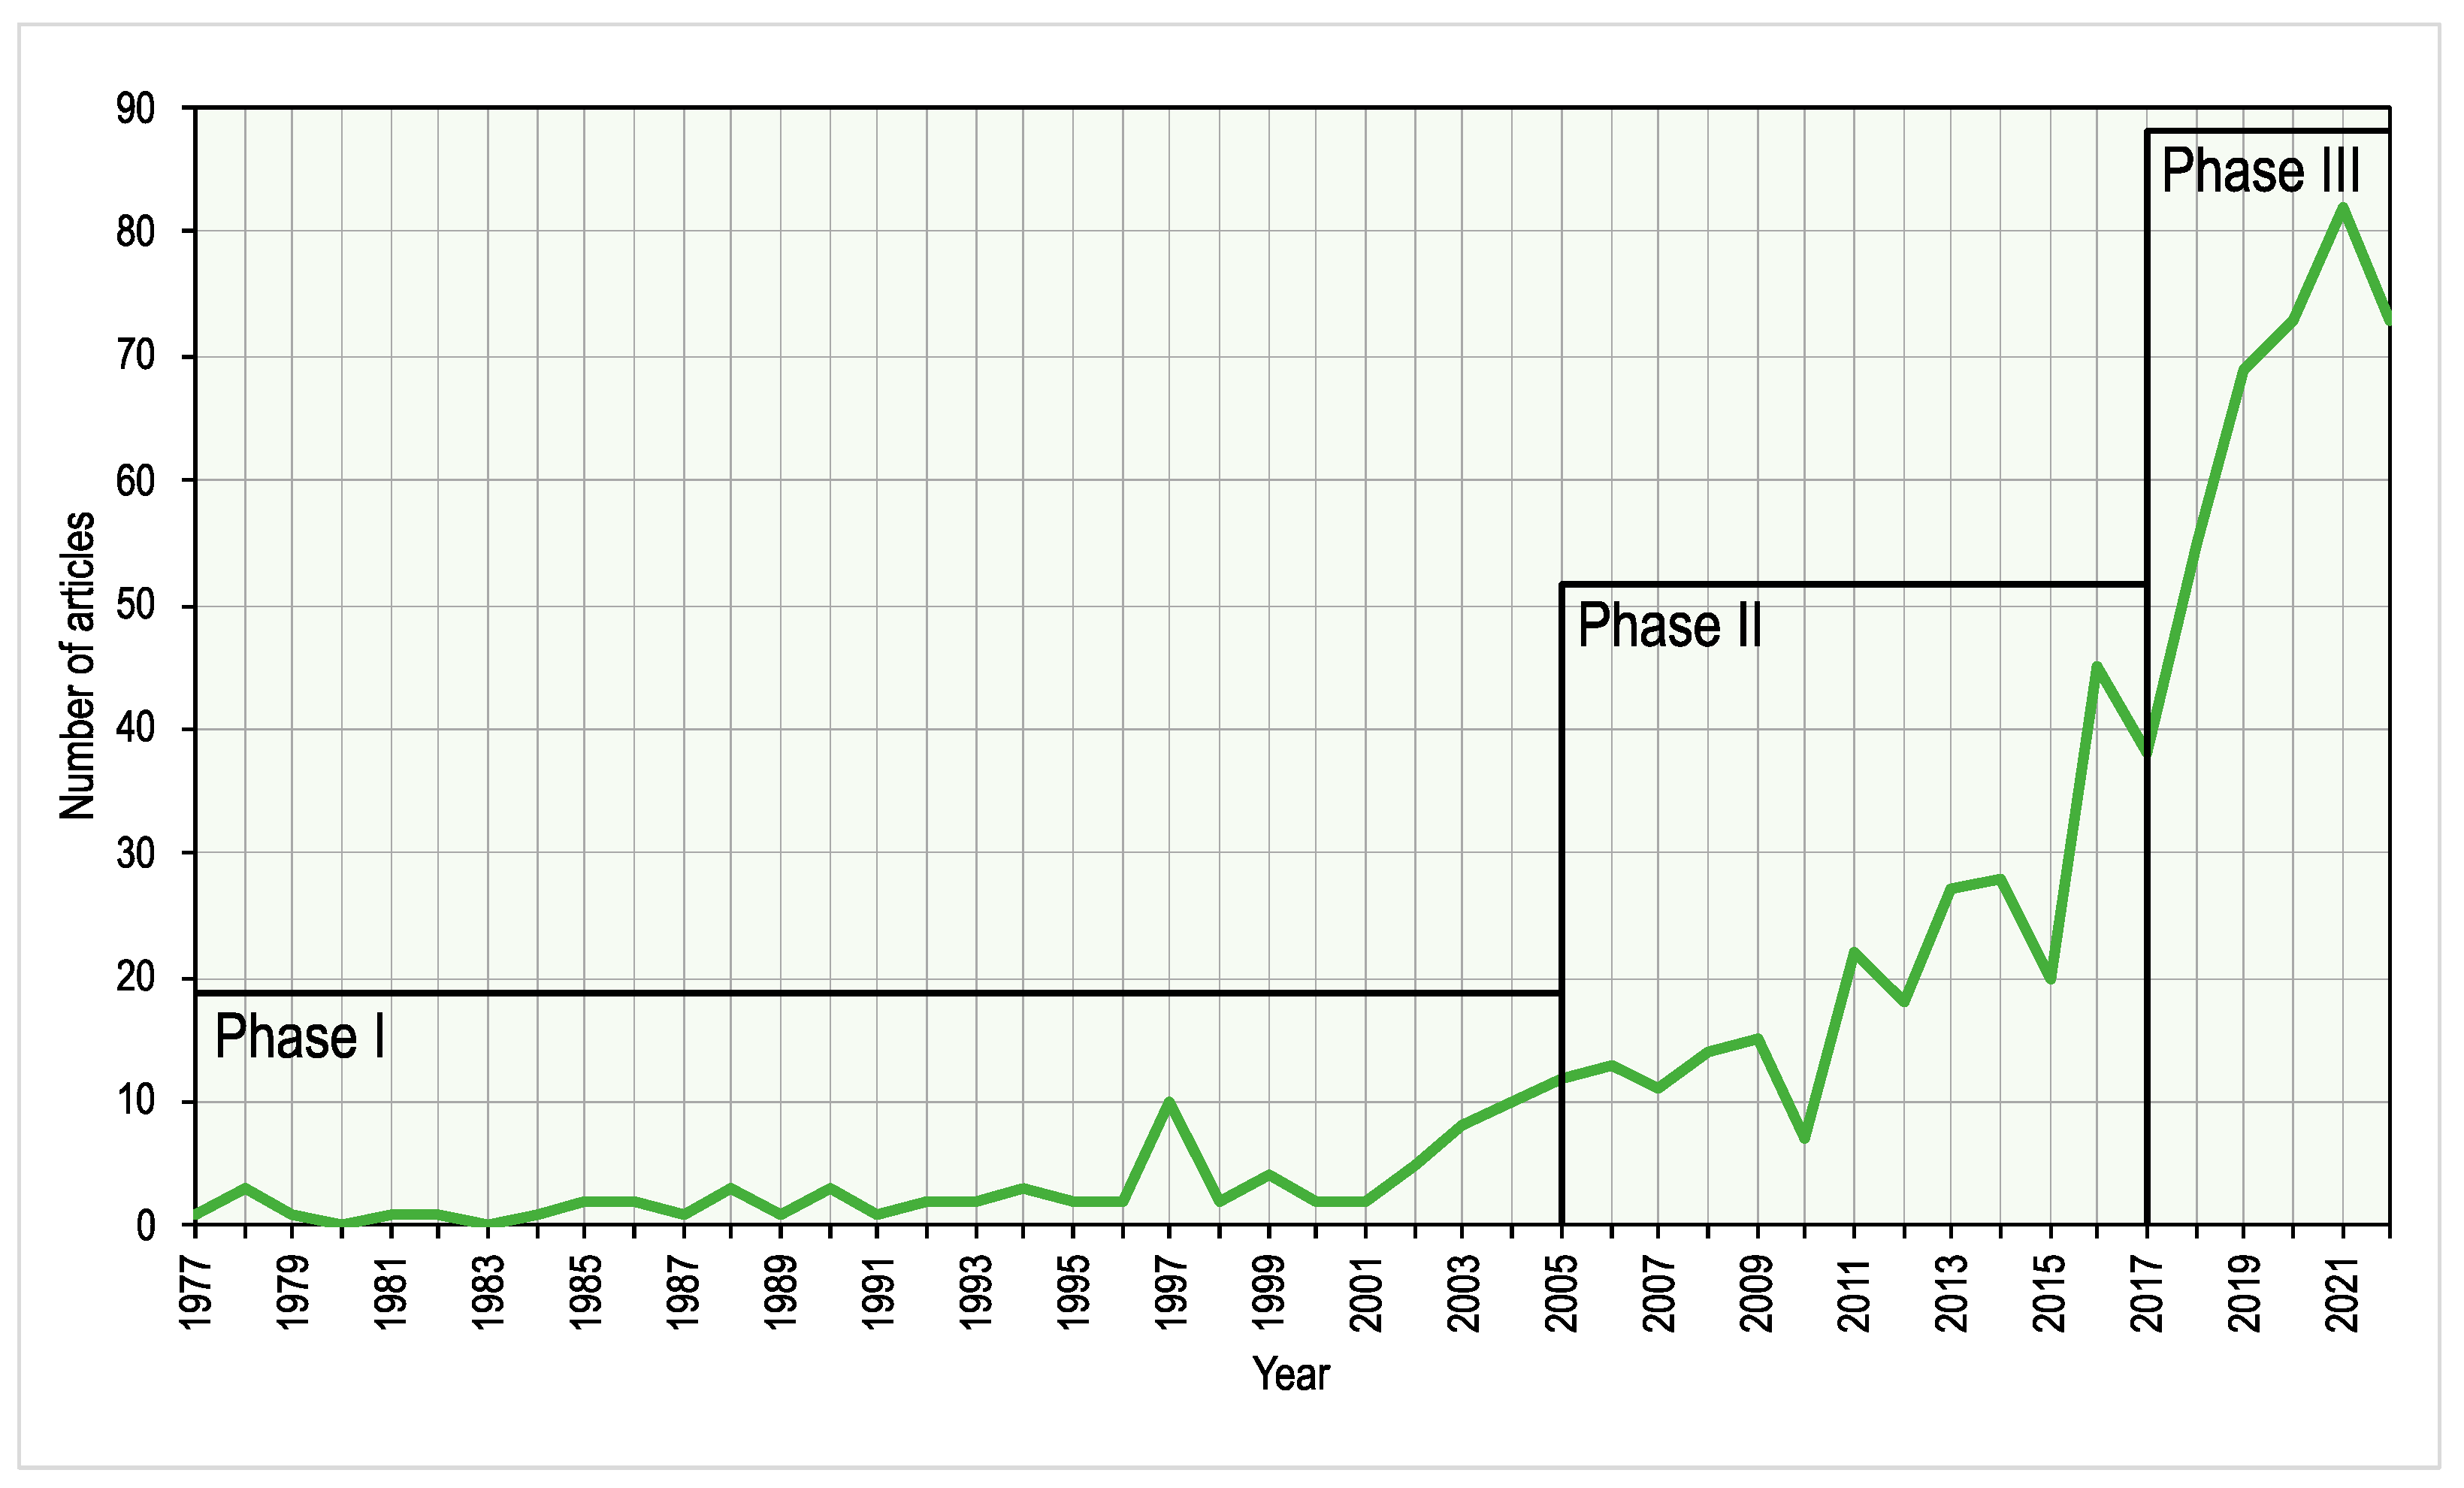
By analyzing the scientific production dealing with the SDB method, we can conclude that we can divide it into three phases (Figure 17):
  • The early or introductory phase (1974–2005), which we can call the birth of the SDB method, begins at the end of the seventies with Gordon and Brown [31] and Lyceng’s [7] articles. In this phase, less than 10 articles dealing with this method were annually published. Authors mostly used free Landsat satellite data, but they also started to experiment with commercial satellite mission data.
  • The growth and development phase (2005–2017) or method evaluation phase in which the authors annually publish more than around 20–30 articles: During this period, the authors begin to use free Copernicus Sentinel 2 satellite mission data.
  • The late phase or maturation phase (2017-today) can also be called the most productive phase of the SDB method with over 50 articles that have been annually published. In this period, authors consider many commercial and free satellite missions, for which their spatial resolution at the end of this period amounts to a satisfactory 30 cm. The assumption is that, in the future, there will be more commercial satellite missions that will have satisfactory spatial resolutions and that they will appear on market programs and modules that solve the most demanding part of the SDB method by using an automated method, as well as implementing atmospheric corrections that significantly affect the accuracy of the method itself.
The three phases can also be observed in the trend topics of the SDB method in Figure 15. In the first phase, until 2005, the articles were mainly concerned with the development of methods and algorithms. In the second phase, which lasts until 2017, authors applied the method to complex water bodies such as turbid waters, areas with high waves and intense sea currents, areas with muddy sea bottoms and sea grasses and river mouths. In recent years, authors have solved the problem of automating depth determination using the SDB method, and they have begun using machine learning and artificial intelligence methods, which can also be observed from the trend topics (Figure 15). One way of automating the SDB method’s application is by using platforms such as Google Earth Engine, which enables performing large area or even global geospatial analysis by offering computational resources and various satellite imagery and geospatial datasets.

5. Conclusions

The world’s oceans cover 71% of the Earth, but we still have mapped less than 20% of the world’s oceans, and 50% of the total global continental shelf area is unsurveyed or inadequately surveyed according to IHO S-44 standards.
Historically, measuring the depth of the sea was conducted using various devices. It is important to emphasize that in the last century, bathymetry was mainly mapped based on ship soundings, with different types of depth sounders used. This “acoustical” method of measuring depths has been very expensive and sometimes difficult to apply in a very shallow coastal area. Since large parts of the oceans and seas in the coastal zone, which is the most important for surface navigation, are not surveyed or have been surveyed with inadequate methods even today, new “electromagnetic” methods of bathymetric surveying have been researched since the 1970s.
Electromagnetic methods for determining the depth of the sea use aerial (LIDAR sensor on various aerial platforms) and satellite sensor methods (satellite-derived bathymetry—SDB). Satellite methods have been proven to be very effective in very shallow coastal areas (up to a depth of about 20 m), and their biggest advantage is that the depth data obtained in this way are relatively very cheap, while major limitations are associated with the parameters that determine the properties of the atmosphere and water column (clear atmosphere and water column) and bottom material.
The article presented and summarized new SDB techniques and methods used for bathymetric surveys, as well as their comparative advantages and disadvantages. The results were compared with traditional surveys and IHO Standards for Hydrographic Surveys S-44 [1]. Furthermore, the study systematically and quantitatively evaluated the scientific development of the literature by referring to optical shallow water satellite-derived bathymetry from a bibliometric perspective.
The results of the bibliometric analysis of articles dealing with SDB and published in WOS and Scopus databases show that most authors use empirical and statistical methods. However, in recent years, articles using automated artificial intelligence methods have prevailed, especially the machine learning method (see Figure 15 showing trend topics for SDB). In the bibliometric analysis of the WOS and Scopus scientific databases, a total of 698 articles (documents) dealing with SDB were found in the period from 1977 to 2022.
In the SDB topic research, 2024 authors took part and provided a total of 24,476 references. The most relevant journal is Remote Sensing, which published 65 articles. When the number of articles was analyzed according to the institutions from which the scientists come from, it can be observed that the most represented is Shandong University of Science and Technology, with 15 articles. The scientist who published the most articles on the topic of SDB is Legleiter, C. J. from the United States Geological Survey, who was cited 2494 times and has an h-index of 30. The most globally cited author, with 698 citations, is Lyzenga, D. R. from Naval Architecture and Marine Engineering, University of Michigan. An analysis of the countries of the corresponding authors shows that the USA and China are leading significantly in the number of publications about SDB. There are 148 documents from the USA, followed by 116 from China. It is important to point out that in recent years, China is leading in terms of the number of SDB articles and that the USA and China are the two countries with the greatest collaboration.
In the first early phase (1975–2005) of the scientific production dealing with the SDB method, the most used keywords were “remote sensing” and “oceanography”, while in the second phase (development phase, 2005–2017), the authors mostly dealt with the development of algorithms and their improvement; thus, the keywords were adapted to this, e.g., “shallow water”, “reflection”, “optical properties”, etc. In the last phase, which has lasted for the last four years, the authors used data from new satellite missions such as Sentinel-2 and developed new machine learning methods, which can be observed in the keywords used.
In general, it can be concluded that, regardless of the significant progress of the SDB method, which was manifested in the development of sensors and processing methods, its results still do not meet the standards of IHO [1]. However, despite this, the authors of this article want to motivate all scientists and engineers to continue their valuable research, the results of which would allow the SDB method to meet IHO standards.

Author Contributions

Conceptualization, T.D.L. and N.L.; methodology, T.D.L.; software, T.D.L., M.B. and F.G.; validation, T.D.L., M.B., N.L. and F.G.; formal analysis, T.D.L. and M.B.; investigation, T.D.L., M.B. and F.G.; resources, T.D.L., M.B., N.L. and F.G.; data curation, T.D.L., M.B., N.L. and F.G.; writing—original draft preparation, T.D.L., M.B., N.L. and F.G.; writing—review and editing, T.D.L., M.B., N.L. and F.G.; visualization, F.G.; supervision, T.D.L., M.B., N.L. and F.G.; project administration, T.D.L., M.B., N.L. and F.G.; funding acquisition, T.D.L., M.B., N.L. and F.G. All authors have read and agreed to the published version of the manuscript.

Funding

The bibliometric analysis was funded by the authors.

Institutional Review Board Statement

The study was conducted in accordance with the Declaration of Helsinki, and approved by the University of Split Ethics Committee.

Informed Consent Statement

Not applicable.

Data Availability Statement

Data available on request due to restrictions, e.g., privacy or ethical. The data presented in this study are available on request from the corresponding author. The data are not publicly available due to further research to be published.

Acknowledgments

This research was supported through project KK.01.1.1.02.0027, a project co-financed by the Croatian Government and the European Union through the European Regional Development Fund-the Competitiveness and Cohesion Operational Programme.

Conflicts of Interest

Nenad Leder declares a conflict of interest considering that he is the Guest Editor for the Special Issue “Satellite Derived Bathymetry for Coastal Mapping” of the journal Remote Sensing. Other authors declare no conflict of interest. The funders had no role in the design of the study; in the collection, analyses, or interpretation of data; in the writing of the manuscript, or in the decision to publish the results.

Nomenclature

ALUT: Adaptive Look-Up Trees; BOMBER: Bio-Optical Model Based tool for Estimating water quality and bottom properties from Remote sensing images; BRUCE: Bottom Reflectance Un-Mixing Computation of the Environment model; CRISTAL: Comprehensive Reflectance Inversion based on Spectrum matching and Table Lookup; IDA: Image Data Analysis; PIF: Pseudo-Invariant Feature; SAMBUCA: Semi-Analytical Model for Bathymetry, Un-mixing and Concentration Assessment; SWAM: Shallow Water SA Model.

References

  1. International Hydrographic Organization. S-44—International Hydrographic Organization Standards for Hydrographic Surveys; 6.0.0.; International Hydrographic Organization: Monaco, Monaco, 2020. [Google Scholar]
  2. Continental Shelf. Encyclopedia Britannica 2012. Available online: https://www.britannica.com/science/continental-shelf (accessed on 23 February 2023).
  3. Ashphaq, M.; Srivastava, P.K.; Mitra, D. Review of Near-Shore Satellite Derived Bathymetry: Classification and Account of Five Decades of Coastal Bathymetry Research. J. Ocean Eng. Sci. 2021, 6, 340–359. [Google Scholar] [CrossRef]
  4. Laura, E.P. Rocchio Chasing Satellites with Jacques Cousteau. Available online: https://landsat.gsfc.nasa.gov/article/chasing-satellites-with-jacques-cousteau/ (accessed on 13 January 2023).
  5. Barsi, J.A.; Schott, J.R.; Palluconi, F.D.; Hook, S.J. Validation of a Web-Based Atmospheric Correction Tool for Single Thermal Band Instruments. In Earth observing systems X; Butler, J.J., Ed.; SPIE: San Diego, CA, USA, 2005. [Google Scholar]
  6. Gao, J. Bathymetric Mapping by Means of Remote Sensing: Methods, Accuracy and Limitations. Prog. Phys. Geogr. Earth Environ. 2009, 33, 103–116. [Google Scholar] [CrossRef]
  7. Lyzenga, D.R. Passive Remote Sensing Techniques for Mapping Water Depth and Bottom Features. Appl. Opt. 1978, 17, 379–383. [Google Scholar] [CrossRef] [PubMed]
  8. Spitzer, D.; Dirks, R.W.J. Bottom Influence on the Reflectance of the Sea. Int. J. Remote Sens. 1987, 8, 279–308. [Google Scholar] [CrossRef]
  9. Louvart, P.; Cook, H.; Smithers, C.; Laporte, J. A New Approach to Satellite-Derived Bathymetry: An Exercise in Seabed 2030 Coastal Surveys. Remote Sens. 2022, 14, 4484. [Google Scholar] [CrossRef]
  10. Satellite-Derived Bathymetry (SDB)—Earth Observation & Environmental Services | EOMAP. Available online: https://www.eomap.com/services/bathymetry/ (accessed on 13 January 2023).
  11. Wiehle, S.; Martinez, B.; Hartmann, K.; Verlaan, M.; Lewis, S.; Schaap, D. The BASE-Platform Project: Deriving the Bathymetry from Combined Satellite Data. Hydrogr. Nachr. 2017, 20–23. [Google Scholar] [CrossRef]
  12. Lyzenga, D.R. Shallow-Water Bathymetry Using Combined Lidar and Passive Multispectral Scanner Data. Int. J. Remote Sens. 1985, 6, 115–125. [Google Scholar] [CrossRef]
  13. Stumpf, R.P.; Holderied, K.; Sinclair, M. Determination of Water Depth with High-Resolution Satellite Imagery over Variable Bottom Types. Limnol. Oceanogr. 2003, 48, 547–556. [Google Scholar] [CrossRef]
  14. Hartmann, K.; Heege, T.; Wettle, M. Satellite-Derived Bathymetry—An Effective Surveying Tool for Shallow-Water Bathymetry Mapping. Hydrogr. Nachr. 2017, 30–33. [Google Scholar] [CrossRef]
  15. Pe’eri, S.; Azuike, C.; Parrish, C. Satellite-Derived Bathymetry a Reconnaissance Tool for Hydrography. Hydro Int. 2013, 17, 16–19. [Google Scholar]
  16. Duplančić Leder, T.; Leder, N.; Peroš, J. Satellite Derived Bathymetry Survey Method—Example of Hramina Bay. Trans. Marit. Sci. 2019, 8, 99–108. [Google Scholar] [CrossRef] [Green Version]
  17. ARGANS. SDB Developments—Seen from an R & D Perspective; NSHC32: Dublin, Republic of Ireland, 2016. [Google Scholar]
  18. Roh, J.Y.; Shin, M.S.; Suh, Y.C.; Yang, I.T.; Lee, D.H. Evaluation of Nautical Chart Adequacy in the Coastal Area around Incheon Bay using Satellite Imagery with AIS Data. J. Coast. Res. 2017, 79, 319–323. [Google Scholar] [CrossRef] [Green Version]
  19. USGS Satellite-Derived Bathymetry. Available online: https://www.usgs.gov/special-topics/coastal-national-elevation-database-%28coned%29-applications-project/science/satellite?qt-science_center_objects=0#qt-science_center_objects (accessed on 13 January 2023).
  20. Jawak, S.D.; Vadlamani, S.S.; Luis, A.J. A Synoptic Review on Deriving Bathymetry Information Using Remote Sensing Technologies: Models, Methods and Comparisons. Adv. Remote Sens. 2015, 4, 147–162. [Google Scholar] [CrossRef] [Green Version]
  21. Casal, G.; Hedley, J.D.; Monteys, X.; Harris, P.; Cahalane, C.; McCarthy, T. Satellite-Derived Bathymetry in Optically Complex Waters Using a Model Inversion Approach and Sentinel-2 Data. Estuar. Coast. Shelf Sci. 2020, 241, 106814. [Google Scholar] [CrossRef]
  22. Zoffoli, M.L.; Frouin, R.; Kampel, M. Water Column Correction for Coral Reef Studies by Remote Sensing. Sensors 2014, 14, 16881–16931. [Google Scholar] [CrossRef] [PubMed]
  23. Dickens, K.; Armstrong, A. Application of Machine Learning in Satellite Derived Bathymetry and Coastline Detection. SMU Data Sci. Rev. 2019, 2, 4. [Google Scholar]
  24. Polcyn, F.C.; Rollin, R.A. Remote Sensing Techniques for the Location and Measurement of Shallow-Water Features. 1969. Available online: https://deepblue.lib.umich.edu/handle/2027.42/7114 (accessed on 13 January 2023).
  25. Polcyn, F.C.; Brown, W.L.; Sattinger, I.J.; The Measurement of Water Depth by Remote Sensing Techniques. 1970, Volume 47. Available online: https://apps.dtic.mil/sti/pdfs/AD0714001.pdf (accessed on 23 February 2023).
  26. Lee, Z.; Carder, K.L.; Mobley, C.D.; Steward, R.G.; Patch, J.S. Hyperspectral Remote Sensing for Shallow Waters: 2, Deriving Bottom Depths and Water Properties by Optimization. Appl. Opt. 1999, 38, 3831–3843. [Google Scholar] [CrossRef] [Green Version]
  27. Hedley, J.; Roelfsema, C.; Phinn, S.R. Efficient Radiative Transfer Model Inversion for Remote Sensing Applications. Remote Sens. Environ. 2009, 113, 2527–2532. [Google Scholar] [CrossRef]
  28. Dolou, H.; Laporte, J.; Avis, J.; Arino, O. THIRTY YEARS OF SATELLITE DERIVED BATHYMETRY The Charting Tool That Hydrographers Can No Longer Ignore. Int. Hydrogr. Rev. 2020, 25, 129–154. [Google Scholar]
  29. Green, E.P.; Mumby, P.J.; Edwards, A.J.; Clark, C.D. Remote Sensing Handbook for Tropical Coastal Management; Edwards, A.J., Ed.; Coastal Management Sourcebooks; UNESCO Pub.: Paris, France, 2000; ISBN 978-92-3-103736-8. [Google Scholar]
  30. Suomi, V.E.; Vonderhaar, T.H. Meteorological Measurements from Satellite Platforms—Annual Scientific Report on NAS5-11542 1969-1970; Space Science and Engineering Center, The University of Wisconsin: Madison, WI, USA, 1971. [Google Scholar]
  31. Gordon, H.R.; Brown, O.B. Influence of Bottom Depth and Albedo on the Diffuse Reflectance of a Flat Homogeneous Ocean. Appl. Opt. 1974, 13, 2153–2159. [Google Scholar] [CrossRef]
  32. Maritorena, S.; Morel, A.; Gentili, B. Diffuse Reflectance of Oceanic Shallow Waters: Influence of Water Depth and Bottom Albedo. Limnol. Oceanogr. 1994, 39, 1689–1703. [Google Scholar] [CrossRef]
  33. Bierwirth, P.N.; Lee, T.J.; Burne, R.V. Shallow Sea-Floor Reflectance and Water Depth Derived by Unmixing Multispectral Imagery. Photogramm. Eng. Remote Sens. 1993, 59, 6185017. [Google Scholar]
  34. Tassan, S. Modified Lyzenga’s Method for Macroalgae Detection in Water with Non-Uniform Composition. Int. J. Remote Sens. 1996, 17, 1601–1607. [Google Scholar] [CrossRef]
  35. Louchard, E.M.; Reid, R.P.; Stephens, F.C.; Davis, C.O.; Leathers, R.A.; Valerie, D.T. Optical Remote Sensing of Benthic Habitats and Bathymetry in Coastal Environments at Lee Stocking Island, Bahamas: A Comparative Spectral Classification Approach. Limnol. Oceanogr. 2003, 48, 511–521. [Google Scholar] [CrossRef] [Green Version]
  36. Purkis, S.J.; Pasterkamp, R. Integrating in Situ Reef-Top Reflectance Spectra with Landsat TM Imagery to Aid Shallow-Tropical Benthic Habitat Mapping. Coral Reefs 2004, 23, 5–20. [Google Scholar] [CrossRef]
  37. Conger, C.L.; Hochberg, E.J.; Fletcher, C.H.; Atkinson, M.J. Decorrelating Remote Sensing Color Bands from Bathymetry in Optically Shallow Waters. IEEE Trans. Geosci. Remote Sens. 2006, 44, 1655–1660. [Google Scholar] [CrossRef]
  38. Bertels, L.; Vanderstraete, T.; Van Coillie, S.; Knaeps, E.; Sterckx, S.; Goossens, R.; Deronde, B. Mapping of Coral Reefs Using Hyperspectral CASI Data; a Case Study: Fordata, Tanimbar, Indonesia. Int. J. Remote Sens. 2008, 29, 2359–2391. [Google Scholar] [CrossRef]
  39. Sagawa, T.; Boisnier, E.; Komatsu, T.; Mustapha, K.B.; Hattour, A.; Kosaka, N.; Miyazaki, S. Using Bottom Surface Reflectance to Map Coastal Marine Areas: A New Application Method for Lyzenga’s Model. Int. J. Remote Sens. 2010, 31, 3051–3064. [Google Scholar] [CrossRef]
  40. Yang, C.; Yang, D.; Cao, W.; Zhao, J.; Wang, G.; Sun, Z.; Xu, Z.; Ravi Kumar, M.S. Analysis of Seagrass Reflectivity by Using a Water Column Correction Algorithm. Int. J. Remote Sens. 2010, 31, 4595–4608. [Google Scholar] [CrossRef]
  41. Mobley, C.D.; Sundman, L.K.; Davis, C.O.; Bowles, J.H.; Downes, T.V.; Leathers, R.A.; Montes, M.J.; Bissett, W.P.; Kohler, D.D.R.; Reid, R.P.; et al. Interpretation of Hyperspectral Remote-Sensing Imagery by Spectrum Matching and Look-up Tables. Appl. Opt. 2005, 44, 3576–3592. [Google Scholar] [CrossRef]
  42. Dekker, A.G.; Phinn, S.R.; Anstee, J.; Bissett, P.; Brando, V.E.; Casey, B.; Fearns, P.; Hedley, J.; Klonowski, W.; Lee, Z.P.; et al. Intercomparison of Shallow Water Bathymetry, Hydro-Optics, and Benthos Mapping Techniques in Australian and Caribbean Coastal Environments. Limnol. Oceanogr. Methods 2011, 9, 396–425. [Google Scholar] [CrossRef] [Green Version]
  43. Brando, V.E.; Anstee, J.M.; Wettle, M.; Dekker, A.G.; Phinn, S.R.; Roelfsema, C. A Physics Based Retrieval and Quality Assessment of Bathymetry from Suboptimal Hyperspectral Data. Remote Sens. Environ. 2009, 113, 755–770. [Google Scholar] [CrossRef]
  44. Hedley, J.D.; Roelfsema, C.; Brando, V.; Giardino, C.; Kutser, T.; Phinn, S.; Mumby, P.J.; Barrilero, O.; Laporte, J.; Koetz, B. Coral Reef Applications of Sentinel-2: Coverage, Characteristics, Bathymetry and Benthic Mapping with Comparison to Landsat 8. Remote Sens. Environ. 2018, 216, 598–614. [Google Scholar] [CrossRef]
  45. Giardino, C.; Candiani, G.; Bresciani, M.; Lee, Z.; Gagliano, S.; Pepe, M. BOMBER: A Tool for Estimating Water Quality and Bottom Properties from Remote Sensing Images. Comput. Geosci. 2012, 45, 313–318. [Google Scholar] [CrossRef]
  46. Hedley, J. A Three-Dimensional Radiative Transfer Model for Shallow Water Environments. Opt. Express 2008, 16, 21887–21902. [Google Scholar] [CrossRef]
  47. Evagorou, E.; Mettas, C.; Agapiou, A.; Themistocleous, K.; Hadjimitsis, D. Bathymetric Maps from Multi-Temporal Analysis of Sentinel-2 Data: The Case Study of Limassol, Cyprus. Adv. Geosci. 2019, 45, 397–407. [Google Scholar] [CrossRef] [Green Version]
  48. Donthu, N.; Kumar, S.; Pattnaik, D. Forty-Five Years of Journal of Business Research: A Bibliometric Analysis. J. Bus. Res. 2020, 109, 1–14. [Google Scholar] [CrossRef]
  49. Aria, M.; Cuccurullo, C. Bibliometrix: An R-Tool for Comprehensive Science Mapping Analysis. J. Informetr. 2017, 11, 959–975. [Google Scholar] [CrossRef]
  50. Zupic, I.; Čater, T. Bibliometric Methods in Management and Organization. Organ. Res. Methods 2015, 18, 429–472. [Google Scholar] [CrossRef]
  51. Okoli, C. A Guide to Conducting a Standalone Systematic Literature Review. Commun. Assoc. Inf. Syst. 2015, 37, 43. [Google Scholar] [CrossRef] [Green Version]
  52. Rojon, C.; Okupe, A.; McDowall, A. Utilization and Development of Systematic Reviews in Management Research: What Do We Know and Where Do We Go from Here? Int. J. Manag. Rev. 2021, 23, 191–223. [Google Scholar] [CrossRef]
  53. Pessin, V.Z.; Yamane, L.H.; Siman, R.R. Smart Bibliometrics: An Integrated Method of Science Mapping and Bibliometric Analysis. Scientometrics 2022, 127, 3695–3718. [Google Scholar] [CrossRef]
  54. Heradio, R.; de la Torre, L.; Galan, D.; Cabrerizo, F.J.; Herrera-Viedma, E.; Dormido, S. Virtual and Remote Labs in Education: A Bibliometric Analysis. Comput. Educ. 2016, 98, 14–38. [Google Scholar] [CrossRef]
  55. Guo, Y.-M.; Huang, Z.-L.; Guo, J.; Li, H.; Guo, X.-R.; Nkeli, M.J. Bibliometric Analysis on Smart Cities Research. Sustainability 2019, 11, 3606. [Google Scholar] [CrossRef] [Green Version]
  56. Aytac, S. Library Guides: Bibliometrics—Overview and Videos. Available online: https://liu.cwp.libguides.com/bibliometrics/Bibliometrics (accessed on 13 January 2023).
  57. Moral-Muñoz, J.A.; Herrera-Viedma, E.; Santisteban-Espejo, A.; Cobo, M.J. Software Tools for Conducting Bibliometric Analysis in Science: An up-to-Date Review. Prof. Inf. 2020, 29, e290103. [Google Scholar] [CrossRef] [Green Version]
  58. van Eck, N.J.; Waltman, L. Software Survey: VOSviewer, a Computer Program for Bibliometric Mapping. Scientometrics 2010, 84, 523–538. [Google Scholar] [CrossRef] [Green Version]
  59. Boyack, K.W.; Klavans, R. Co-Citation Analysis, Bibliographic Coupling, and Direct Citation: Which Citation Approach Represents the Research Front Most Accurately? J. Am. Soc. Inf. Sci. Technol. 2010, 61, 2389–2404. [Google Scholar] [CrossRef]
  60. Sjöstedt, E.; Aldberg, H.; Jacobsson, C. Guidelines for Using Bibliometrics at the Swedish Research Council. 2015. Available online: https://www.vr.se/download/18.514d156f1639984ae0789dc2/1529480565499/Guidelines+for+using+bibliometrics+at+the+Swedish+Research+Council.pdf (accessed on 13 January 2023).
  61. Garfield, E. From the Science of Science to Scientometrics Visualizing the History of Science with HistCite Software. J. Informetr. 2009, 3, 173–179. [Google Scholar] [CrossRef] [Green Version]
  62. Cui, Y.; Mou, J.; Liu, Y. Knowledge Mapping of Social Commerce Research: A Visual Analysis Using CiteSpace. Electron. Commer. Res. 2018, 18, 837–868. [Google Scholar] [CrossRef]
  63. Mrvar, A.; Batagelj, V. Analysis and Visualization of Large Networks with Program Package Pajek. Complex Adapt. Syst. Model. 2016, 4, 6. [Google Scholar] [CrossRef] [Green Version]
  64. Lewis, D.M.; Alpi, K.M. Bibliometric Network Analysis and Visualization for Serials Librarians: An Introduction to Sci2. Ser. Rev. 2017, 43, 239–245. [Google Scholar] [CrossRef]
  65. Jacsó, P. Calculating the H-index and Other Bibliometric and Scientometric Indicators from Google Scholar with the Publish or Perish Software. Online Inf. Rev. 2009, 33, 1189–1200. [Google Scholar] [CrossRef] [Green Version]
  66. Larsen, B.; Schneider, J.W. Celebrating Scholarly Communication Studies: A Festschrift for Olle Persson at His 60th Birthday; Special volume of the e-newsletter of the International Society for Scientometrics and Informetrics; International Society for Scientometrics and Informetrics: Berlin, Germany, 2009; Volume 05-S. [Google Scholar]
  67. Huang, X.; Liu, X.; Shang, Y.; Qiao, F.; Chen, G. Current Trends in Research on Bone Regeneration: A Bibliometric Analysis. BioMed Res. Int. 2020, 2020, 1–12. [Google Scholar] [CrossRef] [PubMed]
  68. Wang, J.; Li, X.; Wang, P.; Liu, Q. Bibliometric Analysis of Digital Twin Literature: A Review of Influencing Factors and Conceptual Structure. Technol. Anal. Strateg. Manag. 2022, 1–15. [Google Scholar] [CrossRef]
  69. Bibliometrix—Biblioshiny. Available online: https://www.bibliometrix.org/home/index.php/layout/biblioshiny (accessed on 13 January 2023).
  70. Hirsch, J.E. An Index to Quantify an Individual’s Scientific Research Output. Proc. Natl. Acad. Sci. USA 2005, 102, 16569–16572. [Google Scholar] [CrossRef] [Green Version]
  71. Grant, M.J.; Booth, A. A Typology of Reviews: An Analysis of 14 Review Types and Associated Methodologies. Health Inf. Libr. J. 2009, 26, 91–108. [Google Scholar] [CrossRef]
  72. Lee, Z.; Carder, K.L.; Mobley, C.D.; Steward, R.G.; Patch, J.S. Hyperspectral remote sensing for shallow waters I A semianalytical model. Appl. Opt. 1998, 37, 6329. [Google Scholar] [CrossRef]
  73. Stramski, D.; Boss, E.; Bogucki, D.; Voss, K.J. The role of seawater constituents in light backscattering in the ocean. Prog. Oceanogr. 2004, 61, 27–56. [Google Scholar] [CrossRef]
  74. Lyzenga, D.R.; Malinas, N.P.; Tanis, F.J. Multispectral bathymetry using a simple physically based algorithm. IEEE Trans. Geosci. Remote Sens. 2006, 44, 2251–2259. [Google Scholar] [CrossRef]
  75. Giardino, C.; Pepe, M.; Brivio, P.A.; Ghezzi, P.; Zilioli, E. Detecting chlorophyll, Secchi disk depth and surface temperature in a sub-alpine lake using Landsat imagery. Sci. Total Environ. 2001, 268, 19–29. [Google Scholar] [CrossRef]
  76. Legleiter, C.J.; Roberts, D.A.; Lawrence, R.L. Spectrally based remote sensing of river bathymetry. Earth Surf. Process. Landf. 2009, 34, 1039–1059. [Google Scholar] [CrossRef]
  77. Winterbottom, S.J.; Gilvear, D.J. Quantification of channel bed morphology in gravel-bed rivers using airborne multispectral imagery and aerial photography. Regul. Rivers Res. Manag. 1997, 13, 489–499. [Google Scholar] [CrossRef]
  78. Legleiter, C.J.; Roberts, D.A.; Marcus, W.A.; Fonstad, M.A. Passive optical remote sensing of river channel morphology and in-stream habitat: Physical basis and feasibility. Remote Sens. Environ. 2004, 93, 493–510. [Google Scholar] [CrossRef] [Green Version]
  79. Casella, E.; Collin, A.; Harris, D.; Ferse, S.; Bejarano, S.; Parravicini, V.; Rovere, A. Mapping coral reefs using consumer-grade drones and structure from motion photogrammetry techniques. Coral Reefs. 2016, 36, 269–275. [Google Scholar] [CrossRef]
  80. Dietrich, J.T. Bathymetric Structure-from-Motion: Extracting shallow stream bathymetry from multi-view stereo photogrammetry. Earth Surf. Process. Landf. 2016, 42, 355–364. [Google Scholar] [CrossRef]
Figure 1. Cousteau chart made by the SDB method [4].
Remotesensing 15 01294 g001
Figure 2. The conceptual framework for satellite-derived bathymetry [3,26,27].
Remotesensing 15 01294 g002
Figure 3. Methodological scheme of the process carried out in this study.
Remotesensing 15 01294 g003
Figure 4. Main information about retrieved documents.
Remotesensing 15 01294 g004
Figure 5. Dynamics of the cumulative number of documents in the top five journals over years.
Remotesensing 15 01294 g005
Figure 6. Fifteen most relevant sources from the unified WoS and Scopus databases.
Remotesensing 15 01294 g006
Figure 7. The number of citations from different sources accumulated from documents in the unified WoS and Scopus databases.
Remotesensing 15 01294 g007
Figure 8. Most relevant affiliations that published optical SDB articles by the number of articles.
Remotesensing 15 01294 g008
Figure 9. Cumulative number of articles dealing with optical SDB for five affiliations within time interval 1978–2021.
Remotesensing 15 01294 g009
Figure 10. Most relevant corresponding authors that published articles dealing with optical SDB.
Remotesensing 15 01294 g010
Figure 11. Top authors’ production over time (WoSCC and Scopus).
Remotesensing 15 01294 g011
Figure 12. Ten most globally cited authors by WoS and Scopus databases.
Remotesensing 15 01294 g012
Figure 13. Number of documents by the corresponding author’s country (WoSCC and Scopus databases).
Remotesensing 15 01294 g013
Figure 14. Countries’ collaboration map indicating the number of documents (green) for every country and the main collaboration among the countries (orange) (WoSCC and Scopus databases).
Remotesensing 15 01294 g014
Figure 15. Trend topics for SDB (WoSCC and Scopus databases).
Remotesensing 15 01294 g015
Figure 16. Word cloud of fifty most-occurring Keywords Plus for SDB (WoSCC and Scopus databases, from 1977 to 2022).
Remotesensing 15 01294 g016
Figure 17. The time interval of the optical SDB method application divided into three phases according to the annual number of published articles.
Remotesensing 15 01294 g017
Table 2. Summary of models reviewed considering the methodological approach, data spectral resolution, data required, model results and other observations [3].
YearReference Approach Resolution Output Applicability
1974Gordon and Brown [31]AlgebraicMulti and Hyperspectralρ indexAssumes homogeneous environment and empirical determination of parameters.
1978Lyzenga [7]Band combination Multispectral Combination of bandsFirst “empiric” model (1978) applicable in high-transparency waters and homogeneous bottoms. Poor in shallow waters.
1987Spitzer and Dirks [8]Band combinationMultispectralComposition of 2 to 3 bandsDeveloped for SPOT and Landsat. Same as Lyzenga.
1994Maritorena et al. [32]AlgebraicMulti and Hyperspectralρ indexAssumes a homogeneous environment and high transparency.
1994Bierwirth et al. [33]AlgebraicMulti and Hyperspectralρ derivationNeeds clear water. Yields composite maps of depths structure and bottom reflectance.
1996Tassan [34]Band combinationMultispectralCombination of bandsSequential application to turbidity gradients.
1999Lee et al. [26]AlgebraicMultispectralρ indexSemi-analytical. Uses detailed IOP and assumes a homogeneous environment.
2003Louchard et al. [35]Optimized matchingHyperspectralBottom types, Z and OACRequires careful preparation of spectral library.
2004Purkis and Pasterkamp [36]AlgebraicMultispectralρ indexAssumes high transparency and needs good map references.
2006Conger et al. [37]Band combinationMulti and HyperspectralPseudo-color bandsAssumes a homogeneous environment. Ineffective in the red band.
2008Bertels et al. [38]Geo-morphologicMulti and HyperspectralBottom types, Z and OACSuitable to reefs of consistent bottoms and environment.
2010Sagawa et al. [39]Band combinationMulti and Hyperspectralρ indexSuitable to poor transparent waters but needs good map references.
2010Yang et al. [40]AlgebraicMultispectralρ indexAnalytical. Suitable to the multi-layered water column.
2005CRISTAL [41]Optimized matchingHyperspectralBottom types, Z and OACRequires careful preparation of spectral library.
2007BRUCE [42]Optimized matchingHyperspectralBottom types, Z and OACRequires careful preparation of spectral library. Useful in low diversity areas.
2014SAMBUCA-Brando et al. [43]AlgebraicHyperspectralBottom types, Z and OACAssumes that the bottom is a linear combination of two substrates. Derived adaptation of Lee et al.’s inversion scheme to optimize depth retrieval.
2015SWAM [44]AlgebraicHyperspectralBottom types, Z and OACAdaptation of SAMBUCA developed for integration into SNAP/Sentinel-2 toolbox. This still needs software optimization to make it perform and be user-friendly.
2012BOMBER [45]AlgebraicHyperspectralBottom types, Z and OACDerived adaptation of Lee et al.’s inversion scheme to optimize bio-optical outputs.
2008Hedley’s Image Data Analysis (IDA, ex-ALUT) [46]Optimized matchingHyperspectralBottom types, Z and OACDerived adaptation of Lee et al.’s inversion scheme. A user-friendly workhorse that optimizes computing time by subdividing parameter space.
2019PIF [47]Multitemporal analysisMulti and HyperspectralBottom types, Z and OACPseudo-invariant features using DNs (digital numbers) of the co-registered time series of the same satellite.
Table 3. Top 16 journals for SDB (according to WoS).
Journal Name (ISSN)NPNCNC/NPHIIFCSSJRBQ
Remote Sensing (Basel) (ISSN: 2072-4292)5686015.37175.3497.4144Q1
Remote Sensing of Environment (ISSN: 344257)18136075.561513.85020.73.862Q1
International Journal of Remote Sensing (ISSN: 01431161)1787451.41113.5316.50.873Q1
Applied Optics (ISSN: 1559-128X)111174106.7391.9053.80.581Q2
IEEE Transactions on Geoscience and Remote Sensing (ISSN: 01962892)1165159.1878.12512.22.404Q1
IEEE Journal of Selected Topics in Applied Earth Observations and Remote Sensing (ISSN: 19391404)1012412.4034.7156.41.335Q1
Journal of Coastal Research (ISSN 0749-0208)1017817.841.111.20.237Q3
Estuarine, Coastal and Shelf Science (ISSN: 0272-7714)820625.7573.2295.30.875Q1
IEEE Geoscience and Remote Sensing Letters (ISSN: 1545598X)88811.0055.3438.51.403Q1
Journal of the Indian Society of Remote Sensing (ISSN: 0255660X)8121.5031.8942.20.405Q2
Optics Express (ISSN: 10944087)816020.0063.8947.21.233Q1
ISPRS Journal of Photogrammetry and Remote Sensing (ISSN: 09242716)718726.71611.77417.63.481Q1
Marine Geodesy (ISSN 01490419, 1521060X)715021.4341.5793.00.448Q1
Geomorphology (ISSN: 0169555X)617829.6764.4067.31.207Q1
Journal of Applied Remote Sensing (ISSN: 19313195)69916.5031.5683.00.471Q2
Sensors (ISSN: 14243210)69616.0043.84715.00.803Q1
NP—Total number of SDB publications; NC—total number of SDB citations; HI—h-index; IF—factor 2021; CS—Elsevier CiteScore metrics 2021; SJR—Scientific Journal Rankings 2021; BQ—best quartile.
Table 4. Authors with six and more publications related to SDB (WoSCC and Scopus databases).
Author/S AT Affiliation COCIHIORCID
Legleiter Carl J.13United States Geological Survey, RestonUSA2494300000-0003-0940-8013
Ma Yi13Ministry Nat Resources, Inst Oceanog, QingdaoChina725150000-0001-7710-7752
Zhang Jingyu10Ministry of Land and Resources P.R.C., BeijingChina3540000-0001-9120-7354
Zhou Xinghua10Ministry of Land and Resources P.R.C., BeijingChina3149not found
Cao Bin8Sun Yat-Sen University, GuangzhouChina8250000-0002-1088-9603
Dewi Ratna Sari8Research Division of Geospatial Information Agency of Indonesia, Bogor, Jawa Barat,Indonesia23890000-0003-3396-2954
Zhang Xuechun7Ministry of Land and Resources P.R.C., Beijing China61not found
Zhu Jianhua7Department at State Oceanic Administration, National Ocean Technology Center, TianjinChina469120000-0002-6659-8442
Almar Rafael 5Laboratoire d’Etudes en Géophysique et Océanographie Spatiales, Toulouse France2357270000-0001-5842-658X
Cahalane Conor6Maynooth University, Dept Geog, KildareIreland30490000-0003-1657-5688
Chen Yifu6Key Laboratory of Geological Survey and Evaluation of Ministry of Education, Wuhan China935not found
Kanno Ariyo6Graduate School of Science and Engineering, Yamaguchi University, Ube Japan467130000-0003-3162-7327
Liu Zhen6Shandong University of Science and Technology, Qingdao China733not found
Monteys Xavier6Geological Survey Ireland, Dublin Ireland769150000-0003-4733-3681
Niroumand-Jadidi Milad6Deutsches Zentrum für Luft- und Raumfahrt (DLR), Cologne Germany305100000-0002-9432-3032
Overstreet Brandon T.6University of Wyoming, Dept Geol and Geophys
LARAMIE, WY
USA725150000-0001-7845-6671
QI Jiawei6College of Geodesy and Geomatics, Shandong University of Science and Technology, Qingdao China920000-0001-8379-3293
Abbreviations: AT = no. of articles; CO = country; CI = citations; HI = h-index.
Table 5. Authors with five and more publications related to optical SDB—only from the WoSCC database.
Author/S AT Affiliation COCIHIORCID
Legleiter Carl J.10United States Geological Survey, RestonUSA2494300000-0003-0940-8013
Ma Yi9Ministry Nat Resources, Inst Oceanog, QingdaoChina725150000-0001-7710-7752
Zhang Jingyu7Ministry of Land and Resources P.R.C., BeijingChina3440000-0003-0825-8690
Kanno Ariyo7Graduate School of Science and Engineering, Yamaguchi University, Ube Japan467130000-0003-3162-7327
Negm Abdelazim6Faculty of Engineering, Zagazig University, ZagazigEgypt1239180000-0002-4838-5558
Overstreet Brandon T.6University of Wyoming, Dept Geol and Geophys
LARAMIE, WY
USA725150000-0001-7845-6671
Cao Bin6Sun Yat-Sen University, GuangzhouChina8250000-0002-1088-9603
Caballero Isabel 5Instituto de Ciencias Marinas de Andalucía (ICMAN), Consejo Superior de Investigaciones Científicas (CSIC), CadizSpain644160000-0001-7485-0989
Monteys Xavier5Geological Survey Ireland, Dublin Ireland769150000-0003-4733-3681
Niroumand-Jadidi Milad5Deutsches Zentrum für Luft- und Raumfahrt (DLR)disabled, Cologne Germany305100000-0002-9432-3032
Harris Paul5Rothamsted Research, Harpenden, DevonUK154321not found
Carder Kendall L.5College of Marine Science, University of South Florida, St Petersburg, FloridaUSA1286749not found
Deng Ruru5Sun Yat Sen University, Sch Geog and Planning, Guangzhou, GuangdongChina611110000-0002-4560-2000
Alevizos Evangelos5Fdn Res and Technol Hellas FORTH, Inst Mediterranean Studies, RethimnonGreece20970000-0001-7276-8666
Cahalane Conor5Maynooth University, Dept Geog, KildareIreland30490000-0003-1657-5688
Almar Rafael 5Laboratoire d’Etudes en Géophysique et Océanographie Spatialesdisabled, Toulouse France2357270000-0001-5842-658X
Poursanidis Dimitris5Foundation for Research and Technology, Heraklion, Crete Hellas1866280000-0003-3228-280X
Hedley John D.5Numerical Optics Ltd., WitheridgeUK1587190000-0003-3675-3736
Abbreviations: AT = no. of articles; CO = country; CI = citations; HI = h-index.
Table 6. Fifteen globally most cited publications—only from the WoSCC database.
Author/S
DOI
YearJournalArticles TitlesCI
Lee, Z.; et al.
10.1364/AO.37.006329 [26]
1999Appl. Opt.Hyperspectral Remote Sensing for Shallow Waters: 2. Deriving Bottom Depths and Water Properties by Optimization598
Lyzenga, D. R.;
10.1364/AO.17.000379 [7]
1978Appl. Opt.Passive Remote Sensing Techniques for Mapping Water Depth and Bottom Features592
Stumpf, R.P.; et al.;
10.4319/lo.2003.48.1_part_2.0547 [13]
2003Limnol. Oceanogr.Determination of Water Depth with High-Resolution Satellite Imagery over Variable Bottom Types477
Lee, Z.P., et al.;
10.1364/AO.37.006329 [72]
1998Appl. Opt.Hyperspectral Remote Sensing for Shallow Waters. I. A Semianalytical Model434
Maritorena, S.;
10.4319/LO.1994.39.7.1689 [32]
1994Limnol. Oceanogr.Diffuse-Reflectance of Oceanic Shallow Waters: Influence of Water Depth and Bottom Albedo297
Stramski, D., et al.;
10.1016/j.pocean.2004.07.001 [73]
2004Prog. Oceanogr.The Role of Seawater Constituents in Light Backscattering in the Ocean290
Lyzenga, D. R.;
10.1109/TGRS.2006.872909 [74]
2006IEEE Trans. Geosci. Remote Sens.Multispectral Bathymetry using a Simple Physically Based Algorithm.255
Brando, V.E.;
10.1016/J.RSE.2008.12.003 [43]
2009Remote Sens. Environ.A Physics Based Retrieval and Quality Assessment of Bathymetry from Suboptimal Hyperspectral Data176
Lyzenga, D. R.;
10.1080/01431168508948428 [12]
1985Int. J. Remote Sens.Shallow-Water Bathymetry Using Combined LIDAR and Passive Multispectral Scanner Data175
Giardino, C., et al.;
10.1016/S0048-9697(00)00692-6 [75]
2001Sci. Total Environ.Detecting Chlorophyll, Secchi Disk Depth and Surface Temperature in a Sub-Alpine Lake Using Landsat Imagery170
Legleiter, C.J., et al.;
10.1002/esp.1787 [76]
2009Earth Surf. Process. Landf.Spectrally Based Remote Sensing of River Bathymetry163
Winterbottom, S.J.; et al.;
10.1002/(SICI)1099-1646(199711/12)13:6<489::AID-RRR471>3.0.CO;2-X [77]
1997Regul. Rivers Res. Manag.Quantification of Channel Bed Morphology in Gravel-Bed Rivers Using Airborne Multispectral Imagery and Aerial Photography148
Legleiter, C.J., et al.;
10.1016/j.rse.2004.07.019 [78]
2004Remote Sens. Environ.Passive Optical Remote Sensing of River Channel Morphology and In-Stream Habitat: Physical Basis and Feasibility144
Casella, E., et al.;
10.1007/s00338-016-1522-0 [79]
2017Coral ReefsMapping Coral Reefs Using Consumer-Grade Drones and Structure from Motion Photogrammetry Techniques143
Dietrich, J.T.;
10.1002/esp.4060 [80]
2017Earth Surf. Process. Landf.Bathymetric Structure-from-Motion: Extracting Shallow Stream Bathymetry from Multi-View Stereo Photogrammetry133
Abbreviations: DOI; CI = citations.
Table 7. Fifteen most-occurring Keywords Plus for SDB (WoSCC and Scopus databases).
Keywords PlusOccurrences
remote sensing405
bathymetry343
satellite imagery214
shallow water (shallow waters)142
water depth89
optical radar85
hydrographic surveys72
satellites71
mapping64
satellite data62
algorithm54
mean square error54
reflection50
optical properties47
water quality46
Disclaimer/Publisher’s Note: The statements, opinions and data contained in all publications are solely those of the individual author(s) and contributor(s) and not of MDPI and/or the editor(s). MDPI and/or the editor(s) disclaim responsibility for any injury to people or property resulting from any ideas, methods, instructions or products referred to in the content.