Abstract
In this paper, we present a new approach to subpixel infrared (IR) emitter detection in VIIRS mid-wave (MWIR) infrared bands M12–M13 at night, based on the presence of a tightly clustered background diagonal present in full granule scattergrams of M12 versus M13 radiances. This diagonal is found universally in night-time VIIRS data collected worldwide. The diagonal feature is absent during the day due to solar reflectance. The existence of the diagonal is attributed to close spacing in the bandpass centers of the VIIRS’ two MWIR bands. Apparently, the M12 and M13 emissivities are highly correlated to background objects, such clouds, ocean and land surfaces. The VIIRS Nightfire (VNF) algorithm detects pixels containing IR emitters based on their departure from the background diagonal. This paper outlines the method and compares VNF results with those from MODIS and VIIRS hotspot detection.
1. Introduction
In 2013, we introduced the VIIRS Nightfire (VNF) algorithm [1] for the detection and characterization of subpixel infrared (IR) emitters at night with a combination of near-infrared (NIR), shortwave infrared (SWIR) and mid-wave infrared (MWIR) radiances, collected by the Visible Infrared Imaging Radiometer Suite (VIIRS) and flown by the NASA/NOAA Joint Polar Satellite System (JPSS). Currently, VNF data are produced worldwide on a nightly basis with VIIRS data collected from the Suomi NPP and NOAA-20 satellites. From radiance values in all night-time infrared channels, we can extract a discrete spectrum of electromagnetic radiation, corresponding to a given pixel in the image (Figure 1). The pixel itself corresponds to a certain area on the Earth’s surface; therefore, the resulting discrete spectrum is the sum of the spectra of all sources located inside the pixel footprint as seen from space. The VIIRS pixel footprint of the moderate resolution (M) bands ranges from 0.6 to 2.5 square kilometers from the edge of the scan [2]. The VIIRS pixel footprints are large enough to contain several subpixel IR emitters, plus ambient-temperature background objects, each contributing to the pixel’s total emission spectrum. The presence of subpixel IR emitters results in enhanced radiances in the shorter wavelength channels, with the background dominating longwave infrared. VNF identifies pixels containing subpixel IR emitters and then iteratively fits two or three Planck curves to match the observed radiances. The Planck curves point to the temperature and source size of the emitter, which can be extracted using Wein’s displacement law [3] and Planck’s law [4]. IR emitter temperatures and source sizes are input to the Stefan–Boltzmann law [5] to calculate radiant heat in terms of megawatts (MW).
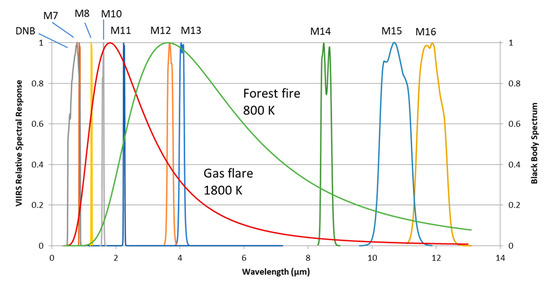
Figure 1.
Relative spectral responses of the VIIRS visible (DNB) and infrared (M7–M16) channels available in the satellite night-time observation mode. Spectral bands are overplayed with the Planck blackbody radiance for typical temperatures 1800 K (gas flare) and 800 K (forest fire).
VNF uses two distinct detectors for subpixel IR emitters. The first detector operates on NIR and SWIR night-time images, which are dominated by the sensors noise floor due to the lack of solar irradiance. The IR emitters stand out as bright pixels immersed in a dark background. For bands M7, M8, M10 and M11, the detection algorithm is the same, and the pixels that confidently exceed the sensor’s noise floor are marked as detections. The detection threshold is set as the image mean plus four standard deviations.
The second VNF detector operates on the two mid-wave infrared (MWIR) channels, namely M12 and M13. These channels trace their roots back to the MODIS instrument, which has six MWIR channels. The M12–M13 brightness temperature difference is used in the VIIRS cloud detection algorithm to distinguish between cloud and snow during daylight hours [6]. VIIRS band M13 is the key spectral band in the NASA and NOAA active fire detection algorithm, which detects hotspot pixels based on the enhanced brightness temperature in the mid-wave relative to the brightness temperature in longwave infrared (LWIR). VNF takes a different approach to subpixel IR emitter detection in MWIR, leveraging the high correlation that background radiant emission have in the two MWIR spectral bands (M12–M13).
2. Background
To unmix the observed spectrum into its constituent elements, in VNF, we approximate the real scene with a model of several blackbody emitters within a pixel footprint of a known size. Each of the selected black bodies contribute radiance to the full pixel signal. For each emitter in the model scene, there are two parameters: the blackbody temperature and the area of its projection onto the pixel footprint.
The spectral density of electromagnetic radiation emitted by a blackbody at a given temperature T (K) is defined by the Planck law:
where Bλ(T) (W/m2/sr/µm) is the spectral radiance at the wavelength (µm); kB is the Boltzmann constant (1.380649 × 10⁻²³ J⋅K−1); h is the Planck constant (6.62607015 × 10⁻³⁴ J⋅s); and c is the speed of light (~300,000 km/s). From a programming point of view, the Boltzmann and Planck constants are very small and difficult to represent digitally. In practice, they are often replaced by:
These terms are referred to as the first radiation constant (1.191042869 × 10⁻¹⁶ W⋅sr−1⋅m2) and the second radiation constant (1.438777 m⋅K). Using the radiation constants, the Planck law Equation (1) becomes:
With Equation (2), we can fit a Planck curve and estimate the parameters T and ε that the resulting curve most closely (in the least squares sense) matches the observed radiances in the night-time VIIRS bands. The Planck curves are fitted using the simplex algorithm [7] for the IR spectral bands where the signal from the subpixel heat source exceeds the noise and the background level. An example of a Planck curve fit to the VIIRS observed radiances is shown in Figure 2. In pixels with both SWIR and MWIR detection, the original VNF algorithm performs dual Planck curve fitting for an IR emitter and a cool background. EOG currently implements a new version of VNF that will analyze pixels for two IR emitters and a cool background.
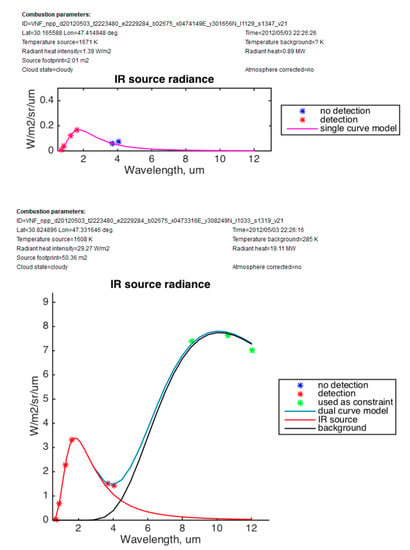
Figure 2.
Two types of the spectral fitting in VNF. Single heat source spectrum is fitted when no signal detected in MWIR bands (top). Sum of the heat source and the background fitted when MWIR signal detected (bottom).
Note that in Equation (2), there is a unitless emissivity scaling factor ε, which can range from zero to one. Blackbody emitters have an emissivity close to one. The emitters analyzed in VNF are subpixels and thus appear as “graybodies” with emissivities less than one. VNF calculates IR emitter source areas based on the ratio between the observed emitter Planck curve and the amplitude of an emitter at the temperature filling the entire pixel footprint. Instead of “ε”, we refer to this ratio as the “emission scaling factor” or ESF [1].
The VNF method is used to detect and analyze heat sources with a temperature significantly higher than the background and a size much smaller than that of the full pixel footprint. Examples include forest fires, gas flares, volcanic eruptions, industrial kilns, etc. [8]. Therefore, an important stage in VNF is the detection of a subpixel heat source in the analyzed pixel.
To detect a subpixel heat source, we need to find when the radiances of the entire pixel in the IR spectral bands exceed the thermal noise of the sensor and the background from the Earth surface or clouds compared to nearby pixels without a heat source. The full pixel spectrum has mixed signals from both the background and the subpixel heat source. If the temperature difference between the subpixel source and the background is large enough, or the heat source has a sufficiently large area, then the contribution of its spectrum to the total radiance can be detected.
High-temperature sources, such as gas flares (T~1800 K), have peak radiant emissions in the SWIR region near the VIIRS spectral band M10 (see Figure 1 and Figure 3). The background radiant emission from the Earth’s surface in the M10 band at night is negligible compared to the internal thermal noise of the sensor (Figure 3). Therefore, the presence of high-temperature subpixel sources in VNF can be detected using a simple threshold in the M10 band equal to four standard deviations of the thermal noise.
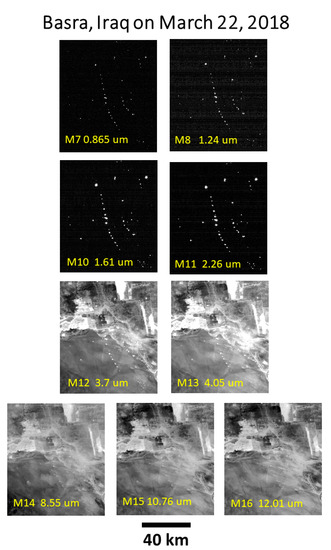
Figure 3.
VIIRS night-time satellite images of gas flares near Basra, Iraq from 22 March 2018. There are two strings of flares near the center of the image, plus many others. The flares are brightest and most evident in the two SWIR bands, M10 and M11, where they are embedded in the sensor’s noise floor. The flares become gradually dimmer stepping towards both shorter and longer wavelengths. In bands M12–M16, the image features are dominated by the radiant self-emission from the Earth’s surface and clouds.
For heat sources of a lower temperature, e.g., forest fires (T~800 K), the peak of the Planck curve shifts towards MWIR bands M12–M13 (see Figure 1). In these bands, a background radiant emission from the terrain and clouds is already clearly visible (Figure 3). In contrast to the NIR and SWIR bands, a fixed threshold detector cannot be used in the MWIR bands because the varying background radiance is comparable to the signal from the heat source.
The classic “hotspot” method by Dozier [9] and others finds pixels with enhanced brightness temperatures in a single MWIR channel relative to the brightness temperature in a longwave infrared (LWIR) reference band. In this paper, we present a new approach to the subpixel heat source detection in VIIRS bands M12–M13, based on the fact that the center wavelengths of these bands are close and the background radiances in these bands are strongly correlated (Section 3). At night, the M12 and M13 radiances are so highly correlated that a dense diagonal baseline is present (Figure 4 and pixels containing IR emitters are displaced from the baseline. The baseline is dissipated in daytime due to the inclusion of solar-reflected radiance (Figure 4). In Section 4, we estimate the sensitivity of this method and its utility in the detection of subpixel saturation in the VIIRS band M12. In Section 5, we compare the new approach with the well-known MODIS and VIIRS thermal anomalies algorithm [10,11,12,13] and its subsequent modifications implemented in the active fire product (AFP).
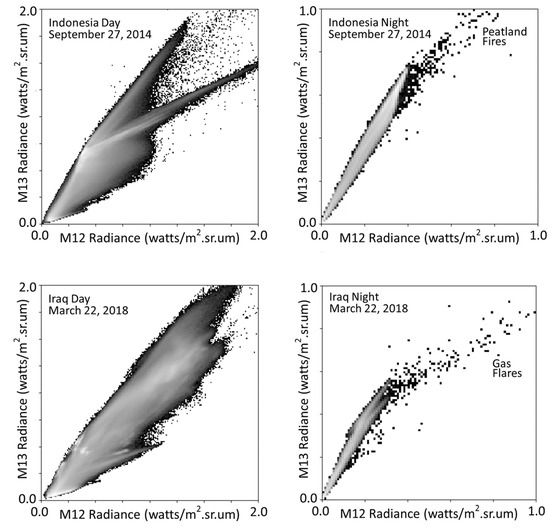
Figure 4.
Daytime versus night-time M12 versus M13 scattergrams for VIIRS granules containing subpixel IR emitters in Indonesia and Iraq. Portions of the Iraq granule are shown in Figure 3. The diagonal background feature is only evident at night. The feature is dissipated during the day due to reflected sunlight.
AFP is used to detect fires at both day and night and is produced from both MODIS and VIIRS data. The AFP detects pixels in MODIS images corresponding to open fire or other thermal anomalies, such as volcanic eruptions, based on enhanced MWIR brightness temperature (BT) at 4 um, relative to the BT in the LWIR. For VIIRS, AFP is produced for both the moderate spatial resolution M bands and the finer resolution imagery band (I-bands) [14]. Because AFP hotspot detection is performed with a single spectral band, the temperature and source size of the IR emitter cannot be calculated. Without those details, heat output cannot be calculated with the Stefan–Boltzmann law. Instead, AFP calculates “fire radiative power”, or FRP, by assuming the IR emitter’s temperature is 1000 K [15].
3. Method
3.1. The M12 Versus M13 Background Baseline
EOG’s MWIR IR emitter detection algorithm is based on machine learning to recognize a tightly clustered diagonal baseline formed by background pixels lacking IR emitters (Figure 4). Once this diagonal feature is defined, hotspot pixels are detected based on their departure from the diagonal. It is important to note that this diagonal baseline is absent in daytime VIIRS data due to the presence of solar reflectance in addition to the background radiant emissions.
3.2. MWIR IR Emitter Detection Algorithm
At night, VIIRS granules contain a range of MWIR brightness levels arising from the variation in temperature and the emissivity of the background materials, such as clouds, water bodies and land surfaces. Because the two MWIR bands are relatively close spectrally, the background emissivities are highly correlated between the two wavelength ranges. Using Planck’s law (Equation (2)) to model M12 and M13 radiances over a wide range of full pixel temperatures (e.g., 300 to 3000 K), it is possible to trace a one-dimensional curve, which gradually bends towards higher M12 radiances as the temperature increases, an expression of Wien’s displacement law. Over the narrow range of background temperatures present on Earth (e.g., from 250 to 310 K), the background diagonal can be modeled as a straight line with a definable width. This is basically a temperature line for pure background pixels, with the temperature increasing with the distance out from the origin (Figure 5). VNF uses AI to recognize the location of the diagonal and the placement of a convex hull line encasing the pure background pixels. Moving along this curve corresponds to changes in the background temperature, which defines the radiances in narrow-band MWIR channels according to Equation (2). However, if pixels contain a mixture of background and subpixel IR emitters, such as fires or flares, the pixels are pulled away from the diagonal. VNF detects pixels containing IR emitters based on their departure from the diagonal background.
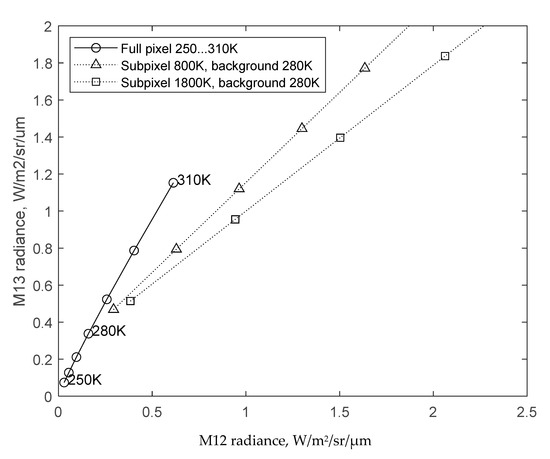
Figure 5.
Modeled sum of radiances in VIIRS bands M12 and M13 for different background temperatures (250…310 K) and different subpixel heat source temperatures (800 K or 1800 K) and sizes.
3.3. MWIR Algorithm Steps
The main steps in EOG’s MWIR detection algorithm are as follows:
- Define the Cartesian coordinate system (M12, M13), in which the radiance values in band M12 are plotted along the horizontal axis and M13 along the vertical axis.
- Scatterplot all pixel radiances from the analyzed VIIRS satellite image in this coordinate system. They are shown by red dots in Figure 6
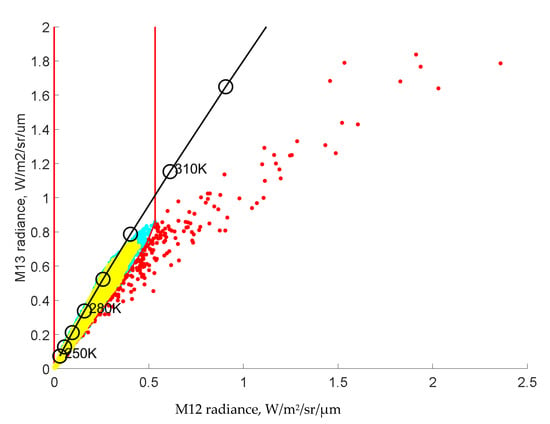 Figure 6. Scatterplot of observed radiances in VIIRS bands M12 and M13 for the satellite image with gas flares in the Near East. Full pixel background in shown in yellow, heat source outliers are shown in red. More details in the text.
 - Define a regular rectangular grid with the equal step d = 0.01 W/m2/sr/µm along the M12 and M13 axes.
- Distribute all pixels from the analyzed scattergram into the rectangular grid cells to form a 2D histogram.
- Select grid cells with a tally of more than 100 pixels. Let us denote this set of grid cells by D. It is shown in yellow in Figure 6.
- Extend the D cells along the reference full pixel curve in the higher-temperature direction using mathematical morphology dilation [16] with a linear structural element length of 20 grid cells, slope 60 deg. to the X axis, which is approximately parallel to the reference full pixel curve. Let us denote this set of grid cells D’. It is shown in cyan in Figure 6.
- Find the convex hull [17] of the set D’. Let us denote it by D”. It is shown by the red line in Figure 6.
- For each pixel, determine whether it falls inside the D” shell. If so, then this pixel is the full background, and it is removed from the candidate detection set.
- Pixels with large IR emitters can saturate the sensor, particularly in the M12 band, which has a lower saturation radiance compared to M13. Pixels can either be fully saturated in M12, or they can be partially saturated [1]. For each remaining pixel, determine if its values in channels M12 and M13 are near the sensor saturation limit (limit values that the sensor can measure). If so, then the given pixel is noise and is removed from the candidate detection set.
- All remaining pixels contain a subpixel heat source. The subpixel emitter pixels are analyzed using Planck curve fitting to calculate the temperature, source size and radiant heat of the subpixel emitters.
4. Results
The M12–M13 scattergram detection algorithm has been used in VNF records since 2012. The VNF detections are available online (https://eogdata.mines.edu/products/vnf/, accessed on 15 February 2023) for open access with a two-to-six-hour delay after the satellite observation and are aggregated into a relational spatiotemporal database for global monitoring of gas flares (https://eogdata.mines.edu/download_global_flare.html, accessed on 15 February 2023) [12]. In VNF, the MWIR scattergram detector is used in parallel with the other two SWIR threshold detectors in bands M10 and M11, which are more sensitive at night-time than the MWIR detector [9]. However, the MWIR detector is essential for selecting the type of Planck curve fitting, i.e., a single curve for the IR emitter only (2), or a dual curve for the IR emitter and the background (3). In the first case, the radiances from the MWIR and LWIR bands are not used in the least-squares estimate of the IR emitter size and temperature. Followed by atmospheric correction in the SWIR and MWIR bands, the MWIR scattergram detector is used to unmix secondary subpixel IR emitters, such as smoldering and pyrolysis, in the multispectral signal from forest fires [18].
After the launch of the JPSS-1 satellite in late 2017, there was a significant change in the VNF algorithm because of the addition of the M11 band to the night-time data stream from both the Suomi NPP and JPSS-1 satellites. Before 2018, it was not possible to fit the Planck curve to lower-temperature IR emitters, such as forest fires and industrial sites, if there was no detection in M12–M13. This is because SWIR bands M7-M10 are all located too far left on the tail of their Planck spectra and do not provide enough data for the positioning of Wien’s displacement peak.
4.1. Detector Sensitivity
The adaptive nature of the MWIR scattergram detector makes it difficult to define its sensitivity in terms of absolute radiance thresholds. However, we can statistically “reverse engineer” the thresholds using quantiles of the cumulative probability function (CDF) of the radiances in the M12 and M13 bands over a long period of time.
To estimate the CDF detection thresholds, we selected all MWIR detections from the VNF database in 2018. Radiance detection limits were taken as the 0.5% point on the CDF coming from the radiance histogram generated for each spectral band (Figure 7). The detection limits for M12 and M13 were found to be 0.073 and 0.071 W/m2/sr/µm.
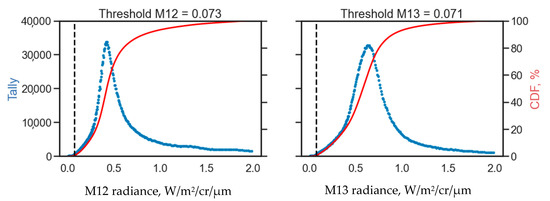
Figure 7.
Detection limits for VIIRS bands M12 and M13 are set to the 0.5% point on the CDF generated from the histogram of the radiance values from VNF pixels from entire 2018.
With Planck’s law, we can interpret the detection limits of our algorithm in terms of the temperature and source area of the detected heat source. The central wavelength of the M12 and M13 bands and their radiance detection limit were used as constraints. Then, the minimum detectable source area can be estimated by varying its temperature. Figure 8 shows a scattergram of the temperature versus the source area for one year of operational VNF detections, together with the resulting detection limit lines.
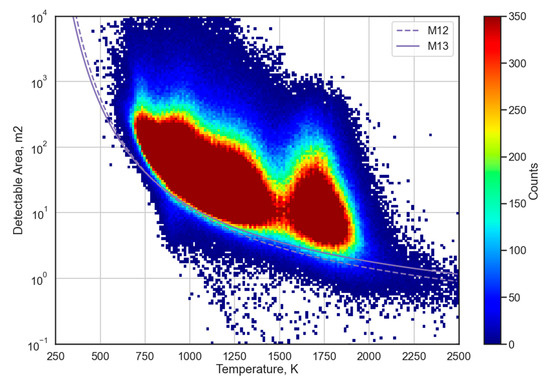
Figure 8.
Scattergram of the temperature versus source area for VNF pixels with detection in M12–M13 spectral bands from entirety of 2018 with the detection limit lines.
4.2. Subpixel Saturation in VIIRS Band M12
Detection algorithm should take into account possible incorrect measurements associated with the sensor noise and limited dynamic range. One criterion may be that the observed values should be below saturation limits of the sensor. For VIIRS bands M12 and M13, they are 4.41 and 404.3 W/m2/sr/µm, respectively. The general effect of saturation reduces the pixel radiance relative to the unaffected bands. Saturation can occur anywhere in the swath. However, in the M12 band, the incorrect values can occur even below its saturation level. This is because the pixel radiances in the M12 sensor plane are averaged over several neighboring photodetectors to compensate for geometrical distortion (bowties) at the scan edges. The number of photodetectors contributing to a single M-band pixel can vary from one detector at the edges of the scan to three detectors in the middle of the scan at nadir. If the signal is saturated in only one of the averaged detectors, then the resulting radiance is less than the saturation limit, but it still cannot be used for the VNF Planck curve fitting. Typically, only pixels from the outer aggregation zone reach saturation radiances. Thus, there are two styles of saturation, namely “full pixel saturation” and “subpixel saturation”. Subpixel saturation does not occur in the outer aggregation zone. Full pixel saturation is unambiguous because the recorded radiance matches the saturation radiances.
The VIIRS constrains the expansion of the M-band pixel footprints from nadir to the edge of scan by systematically varying the number of pixels aggregated on board [12]. In the region of ±31.72 degrees out from nadir, three pixels are aggregated. The instrument then switches to aggregate two pixels out to ±44.86 degrees. In the final segment of the scan (out to ±56.28 degrees), no aggregation is used, and the instrument records a signal from single pixels. While successfully controlling the footprint size, this aggregation scheme alters the signal-to-noise ratios and saturation in the aggregation zones.
Based on the long-term database of VNF detections, we devised an empirical rule to identify the presence of subpixel saturation:
M12radiance < 1.35 × M13 radiance − 1.5
In Figure 9, such a case corresponds to falling into the region of the upper wedge outlined by the dashed line.
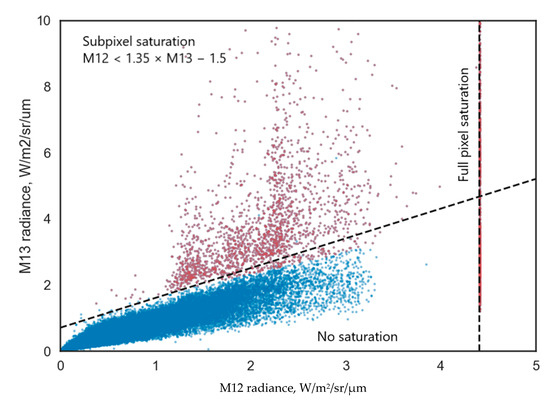
Figure 9.
Scattergram of the VNF pixels with detection in M12–M13 spectral bands from entirety of 2018 with full and subpixel saturation regions.
5. Discussion
The sensitivity of the scattergram detection algorithm and VNF radiative heat estimates of the detected subpixel sources can be compared with the two other operational fire detection products, MODIS and VIIRS AFP.
5.1. Data Sources
To compare the nocturnal sensitivity of AFP and our detector, we selected two regions in Siberia. One region of interest (ROI) with frequent forest fires was in Khabarovsk Krai (NW corner coordinates: 56N 114E; SE corner 44S 140E). The overview map for that region with VNF detections used in this study is shown in Figure 10. The second ROI with gas flares from oil fields in Khanty-Mansiysk Autonomous Okrug (NW corner coordinates: 65N 70E; SE corner: 60S 80E). The gas flare map for that region is shown in Figure 11. All comparisons were made with the data collected in 2015.
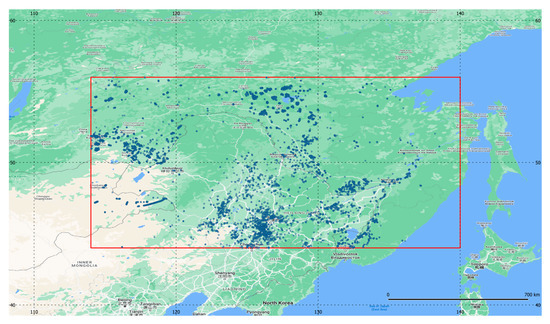
Figure 10.
Region of Interest (ROI) with frequent forest fires in Khabarovsk Krai (NW corner coordinates: 56N 114E; SE corner: 44S 140E). VNF detections used in this study are shown with blue circles. Background is from Google Maps.
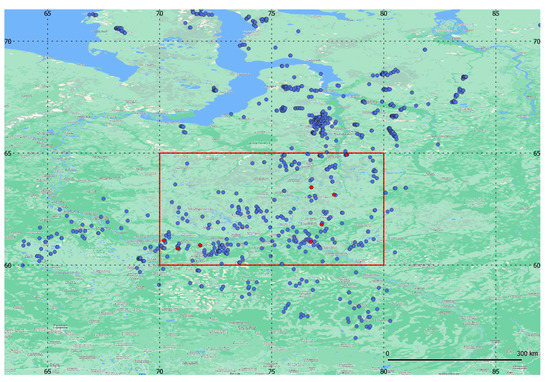
Figure 11.
ROI with gas flares from oil fields in Khanty-Mansiysk Autonomous Okrug (NW corner coordinates: 65N 70E; SE corner: 60S 80E). Upstream gas flares detected with VNF in 2021 are shown with blue circles. Gas flares used in this study are shown with red circles. Background is from Google Maps.
To increase the reliability of the comparison between VNF and MODIS AFP, we selected orbits in 2015 with close satellite overpass times over the selected regions. To reduce the error from geometrical distortion at the edges of the scan, we used only the satellite passes with a satellite zenith angle of less than 30 degrees (nadir views). VNF and VIIRS AFP detections that come from the same satellite and overpass time alignment are not needed, but we used the same orbits as before to have all three detection methods cross-comparable.
Finally, we selected 114 MODIS and Suomi NPP orbits with close overpass times in Khanty-Mansiysk (time difference from 18 s to 38 min) and 45 orbits with close overpass times in Khabarovsk (time difference from 24 s to 13 min).
5.2. Method of Comparison
For the three detection methods, namely VNF, MODIS AFP and VIIRS AFP, we compare both the probability of detection (sensitivity) and the estimated radiative power in the two classes of IR emitters, i.e., gas flares and forest fires.
To compare the probability of the of detection for gas flares, we took eight flares and for each satellite pass, we count whether this flare was detected or not. We make this comparison separately for cloudy and cloud-free detections. To determine the presence of clouds, we use cloud flag values from the VNF algorithm. To compare the radiative power estimates, we use the fire radiative power (FRP) parameter in the AFP products and the radiative heat (RH) parameter from VNF. To compare the power of gas flares, we take only the pairs of VNF and AFP detections with one-to-one correspondence in location and time (we call such detections “mutual”, see Figure 12). We take all mutual detections for all intersections of the orbits and build a linear regression between RH and FRP.
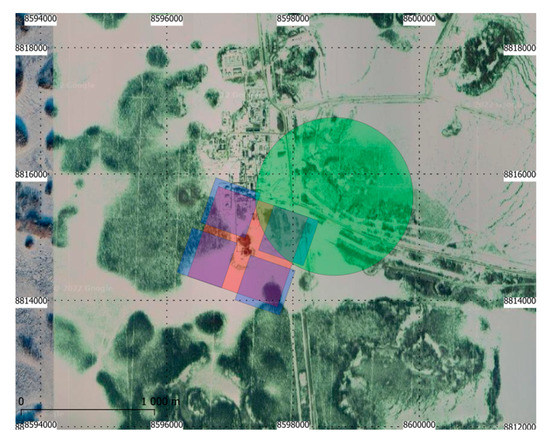
Figure 12.
Footprints of the “mutual” detections of the same gas flare in Khanty-Mansiysk at 61.809N 77.237E in EPSG:900913 projection observed with three satellites on 23 August 2015. Daytime background comes from satellite view in Google Maps.
The detection probability of forest fires is compared with the area covered by VNF and AFP detections. Because the sensor pixels have different shapes and resolutions, we cover the entire ROI with a regular grid with a 0.25-degree step in latitude and longitude. We assume that if at least one detection falls into a certain grid cell, then this cell and the corresponding area are covered by the detections. For each intersection of the orbits, we separately determine the number of cells covered with VNF and AFP detections and analyze the linear regression.
To compare the estimates of radiative power from forest fires, we take only the “overlapping” subsets of VNF and AFP detections at each orbital crossing. We call the detection subsets A and B “overlapping” if for any detection from subset A, there is a detection in subset B within the distance ε and if the opposite also holds true, i.e., for any detection from subset B, there is a detection in the subset A within the distance ε (see Figure 13). This approach to the selection of “overlapping” detection differs from the one we used to compare gas flares. The reason for this is that forest fires often have an extended source area, covered by multiple pixels from the same image. Because the sensors have different spatial resolutions and pixel footprints, it is incorrect to use “one-to-one” correspondence between detection pixels. Instead, we sum up the radiative power over the entire pixel sets detected by VNF and AFP and analyze the linear regression between the integrated radiative power.
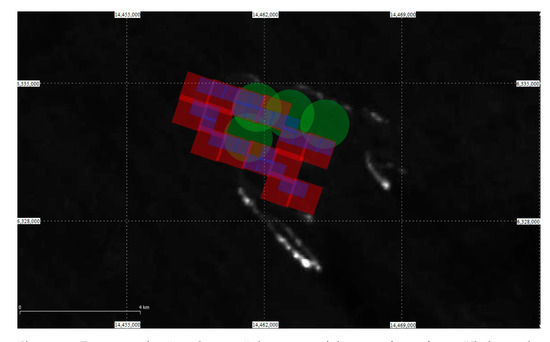
Figure 13.
Footprints for “overlapping” detections of the same forest fire in Khabarovsk region at 49.353N 129.914E in EPSG:900913 projection observed with three satellites on 23 October 2015. Thermal background comes from the next night image at Band 8 from the Landsat 8 satellite path/row 116/26. Note the shift of the fire front between the satellite overpasses.
5.3. Detector Comparison Results
When comparing radiative heat estimates for gas flares by VNF and MODIS AFP, only 32 “mutual” detections were found in Khanty-Mansi for MODIS and VIIRS orbital crossings. Using the VNF flare catalog [19], we identified these flares. There are many more “mutual” detections between VNF and VIIRS AFP. The red lines on both plots in Figure 14 represent regression through the origin. It shows that for gas flares, VNF gives radiative heat values that are, on average, four times higher than the fire radiative power from MODIS and VIIRS AFP.
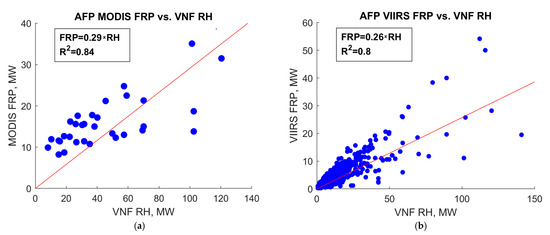
Figure 14.
Comparison of VNF and AFP radiative heat estimates for gas flares: (a) VNF vs. MODIS AFP; (b) VNF vs. VIIRS AFP.
A comparison of the MWIR detection probability of gas flares by VNF vs MODIS and VIIRS AFP is shown in Figure 15. The detection probability by VNF for gas flares is higher than by both MODIS and VIIRS AFP.
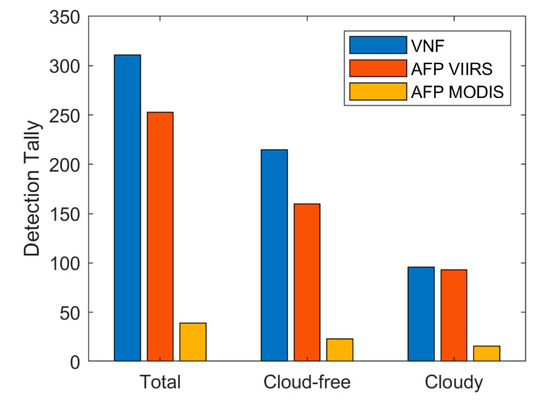
Figure 15.
Comparison of VNF and AFP detection probability of gas flares.
For the MWIR detections of gas flares, we estimated the accuracy and F-score. The accuracy shows the ratio of correct answers to the total number of all questions and is calculated by Equation (3):
The F-score is the harmonic mean between the precision, showing the number of correct positive answers out of the total number of correct answers, and the recall, showing the number of correct positive answers and the total number of questions, suggesting a positive answer. The F-score is calculated by Equation (4):
In Equations (4) and (5), we assume that the gas flares are constantly active because we have no ground validation. As such, any detection is a correct positive response, any lack of detection is an incorrect negative response, and there are no correct negative and incorrect positive responses in this case. Thus:
- -
- TP (true positive) is the number of detections for all overpasses (only detections for eight flares are counted, meaning one detection for each flare);
- -
- FP (false positive) is always zero because we assume that the flares are constantly active;
- -
- TN (true negative) is always zero for the same reason;
- -
- FN (false negative) is the number of overpasses without flare detections.
Our estimates of the accuracy and F-scores for different algorithms are shown in Table 1.

Table 1.
Accuracy and F-score for detection algorithms VNF (MWIR only), AFP VIIRS and AFP MODIS.
In Figure 16, we compare VNF vs MODIS and VIIRS AFP in terms of the detection probability of forest fires. The probability of detection by VNF at night is eight times higher than that of MODIS AFP, and it is slightly less than the VIIRS AFP method.
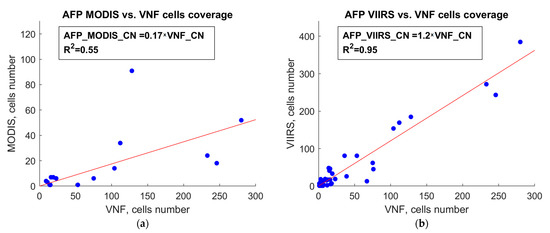
Figure 16.
Comparison of VNF and AFP detection probability of forest fires: (a) VNF vs MODIS AFP; (b) VNF vs VIIRS AFP.
Figure 17 shows the comparison of VNF and AFP radiative heat estimates for forest fires. The red line in both plots shows regression through zero. In both cases, the correlation level when comparing VNF with both MODIS AFP and VIIRS AFP is high (R2 > 0.95), and the regression coefficient is close to one.
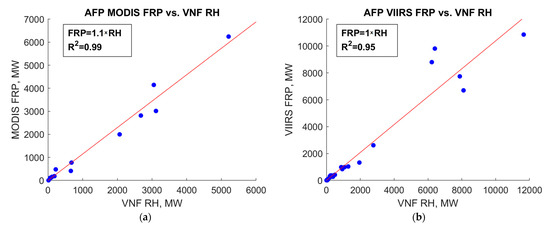
Figure 17.
Comparison of VNF and AFP by radiative power from forest fires: (a) VNF vs. MODIS AFP; (b) VNF vs. VIIRS AFP.
6. Conclusions
The mid-wave infrared (3–5 um) has been referred to as a crossover zone [20], in which the radiance observed from space contains both a reflected sunlight component and thermal emissions from objects within pixels, such as clouds, water bodies and land surfaces. This is shown in Figure 18, where it can be seen that the VIIRS MWIR bands fall on the trailing edge of the solar spectrum and the leading edge of the Earth’s radiant emissions. The situation becomes even more complicated when it comes to the remote sensing of IR emitters, where both flaming and non-flaming components have significant radiant emissions in MWIR. Note that the IR emitter Planck curves are offset by the temperature differences, with flaring and flaming shifted to shorter wavelengths compared to non-flaming components, such as pyrolysis.
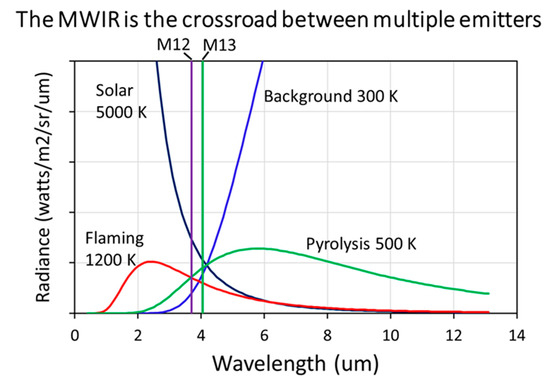
Figure 18.
Scaled blackbody Planck curves for objects ranging from 300 to 5000 K. Radiance contributors to the VIIRS MWIR radiances include reflected sunlight, background and temperature phase present in flaming biomass burning and pyrolysis.
The detection of subpixel IR emitters and the spectral unmixing of the flaming, non-flaming and background radiances in MWIR can be vastly simplified by working with night-time data. With the solar component eliminated, background pixels form a sharp diagonal baseline, which can be located and encased using AI methods. Pixels containing subpixel IR emitters, such as biomass burning and natural gas flaring, fall outside of the background diagonal. The unmixing of the radiances from IR emitters and the background is accomplished using Planck curve fitting, performed with the observed radiances. With sunlight eliminated, the full radiance recorded in NIR and SWIR bands can be attributed to IR emitters and can be fed directly into Planck curve fitting for a primary emitter [18].
VNF uses Planck curve fitting to unmix the radiance components from the background and IR emitters in MWIR. The original VNF algorithm solved for the temperature, ESF, source area and radiant heat of a single subpixel IR emitter. The more recently developed VNF version four uses a flaming subtractive method to analyze primary and secondary emitters [18]. The primary emitter has higher temperature than the secondary emitter, which is warmer than the background. Radiances from NIR and SWIR define the primary emitter and residual radiances from M12–M16 are used in dual-curve Planck curve fitting to define the secondary emitter and background.
The VNF algorithms only work with night-time data, which is a shortcoming in terms of defining the diurnal dynamics of fires. However, the VNF output products provide spectrally based estimates of temperature, source area and radiant heat—variables that are missing from MODIS and VIIRS active fire products (AFPs). It should be noted that the AFPs calculate fire radiative power (FRP), which has the same units (megawatts) as VNF’s radiant heat (RH). However, FRP is calculated assuming a temperature of 1000 K. VNF’s RH is calculated with the IR emitter’s temperature and source area as input to the Stefan–Boltzmann law. The FRP fixed temperature assumption results in an over- and underestimation of heat output for IR emitters that are hotter or colder than 1000 K.
EOG processes VNF in near real time and maintains an archive available to researchers. We encourage wide utilization of the VNF data for analyses of fire, flares and industrial emitters.
Author Contributions
Conceptualization, C.E. and M.Z.; methodology, software and validation, M.Z. and A.P.; data curation, M.Z. and C.E.; writing—original draft preparation, M.Z. and A.P.; writing—review and editing, C.E. All authors have read and agreed to the published version of the manuscript.
Funding
VIIRS Nightfire development and operations have been funded by multiple sponsors over the years. The original VNF algorithm development was sponsored by the NOAA Joint Polar Satellite System (JPSS) proving ground program (2012–2014). Gas flaring analysis methods were subsequently sponsored by NASA’s Carbon Monitoring System, the World Bank Global Gas Flaring Reduction (GGFR) Partnership and the Oil and Gas Climate Initiative (OGCI).
Data Availability Statement
VNF data are available at: https://eogdata.mines.edu/products/vnf/, accessed on 15 February 2023.
Conflicts of Interest
The authors declare no conflict of interest.
References
- Elvidge, C.D.; Zhizhin, M.N.; Hsu, F.; Baugh, K. VIIRS Nightfire: Satellite Pyrometry at Night. Remote Sens. 2013, 5, 4423–4449. [Google Scholar] [CrossRef]
- Baker, N.; Kilcoyne, H. Joint polar satellite system (JPPS) VIIRS geolocation algorithm theoretical basis document (ATBD). NASA Goddard Space Flight Center Tech. 2011, 144, 474. [Google Scholar]
- Wien, W. On the division of energy in the emission-spectrum of a black body. Lond. Edinb. Dublin Philos. Mag. J. Sci. 1897, 43, 214–220. [Google Scholar] [CrossRef]
- Planck, M. On the law of the energy distribution in the normal spectrum. Ann. Phys. 1901, 553, 1–11. [Google Scholar]
- Boltzmann, L. Ueber eine von Hrn. Bartoli entdeckte Beziehung der Wärmestrahlung zum zweiten Hauptsatze. Annalen der Physik 1884, 5, 31–39. [Google Scholar] [CrossRef]
- Kopp, T.J.; William, T.; Andrew, K.H.; Botambekov, D.; Richard, A.; Frey, K.D.; Hutchison, B.; Iisager, D.; Kurt, B.; Bonnie, R. The VIIRS Cloud Mask: Progress in the first year of S-NPP toward a common cloud detection scheme. J. Geophys. Res. Atmos. 2014, 5, 2441–2456. [Google Scholar] [CrossRef]
- Lagarias, J.C.; Reeds, J.A.; Wright, M.H.; Wright, P.E. Convergence properties of the Nelder-Mead simplex method in low dimensions. Siam J. Optim 1998, 9, 112–147. [Google Scholar] [CrossRef]
- Liu, Y.; Hu, C.; Zhan, W.; Sun, C.; Murch, B.; Ma, L. Identifying industrial heat sources using time-series of the VIIRS Nightfire product with an object-oriented approach. Remote Sens. Environ. 2018, 204, 347–365. [Google Scholar] [CrossRef]
- Dozier, J. A method for satellite identification of surface temperature fields of sub-pixel resolution. Remote Sens. Environ. 1981, 11, 221–229. [Google Scholar] [CrossRef]
- Giglio, L.; Descloitres, J.; Justice, C.O.; Kaufman, Y.J. An enhanced contextual fire detection algorithm for MODIS. Remote Sens. Environ. 2003, 87, 273–282. [Google Scholar] [CrossRef]
- Giglio, L.; Schroder, W.; Justice, C. The Collection 6 MODIS active fire detection algorithm and fire products. Remote Sens. Environ. 2016, 178, 31–41. [Google Scholar] [CrossRef] [PubMed]
- Csiszar, I.; Schroeder, W.; Giglio, L.; Ellicott, E.; Vadrevu, K.P.; Justice, C.O.; Wind, B. Active fires from the Suomi NPP Visible Infrared Imaging Radiometer Suite: Product status and first evaluation results. J. Geophys. Res. Atmos. 2013, 119, 803–816. [Google Scholar] [CrossRef]
- Schroeder, W.; Oliva, P.; Giglio, L.; Csiszar, I. The new VIIRS 375 m active fire detection data product: Algorithm description and initial assessment. Remote Sens. Environ. 2014, 143, 85–96. [Google Scholar] [CrossRef]
- Elvidge, C.D.; Zhizhin, M.; Baugh, K.; Hsu, F.C.; Ghosh, T. Extending Nighttime Combustion Source Detection Limits with Short Wavelength VIIRS Data. Remote Sens. 2019, 11, 395. [Google Scholar] [CrossRef]
- Wooster, M.J.G.; Roberts, G.L.W.; Perry, Y.; Kaufman, J. Retrieval of biomass combustion rates and totals from fire radiative power observations: FRP derivation and calibration relationships between biomass consumption and fire radiative energy release. J. Geophys. Res. Atmos. 2005, 110, D24. [Google Scholar] [CrossRef]
- Rein van den, B.; van Balen, R. Methods for Fast Morphological Image Transforms Using Bitmapped Binary Images. CVGIP Graph. Model. Image Proc. 1992, 54, 252–258. [Google Scholar] [CrossRef]
- Barber, C.B.; David, P.D.; Hannu, H. The quickhull algorithm for convex hulls. ACM Trans. Math. Softw. (TOMS) 1996, 22, 469–483. [Google Scholar] [CrossRef]
- Elvidge, C.D.; Zhizhin, M.; Hsu, F.C.; Sparks, T.; Ghosh, T. Subpixel Analysis of Primary and Secondary Infrared Emitters with Nighttime VIIRS Data. Fire 2021, 4, 83. [Google Scholar] [CrossRef]
- Elvidge, C.D.; Zhizhin, M.; Baugh, K.; Hsu, F.-C.; Ghosh, T. Methods for Global Survey of Natural Gas Flaring from Visible Infrared Imaging Radiometer Suite Data. Energies 2016, 9, 14. [Google Scholar] [CrossRef]
- Salvaggio, C.; Craig, J.M. Methodologies and protocols for the collection of midwave and longwave infrared emissivity spectra using a portable field spectrometer. In Algorithms for Multispectral, Hyperspectral, and Ultraspectral Imagery VII; SPIE: Bellingham, DC, USA, 2001; Volume 4381, pp. 539–548. [Google Scholar]
Disclaimer/Publisher’s Note: The statements, opinions and data contained in all publications are solely those of the individual author(s) and contributor(s) and not of MDPI and/or the editor(s). MDPI and/or the editor(s) disclaim responsibility for any injury to people or property resulting from any ideas, methods, instructions or products referred to in the content. |
© 2023 by the authors. Licensee MDPI, Basel, Switzerland. This article is an open access article distributed under the terms and conditions of the Creative Commons Attribution (CC BY) license (https://creativecommons.org/licenses/by/4.0/).