Article

Analysis and Correction of Water Forward-Scattering-Induced Bathymetric Bias for Spaceborne Photon-Counting Lidar

1
School of Electronic Information, Wuhan University, Wuhan 430072, China
2
School of Geodesy and Geomatics, Shandong University of Science and Technology, Qingdao 266590, China
3
Wuhan Institute of Quantum Technology, Wuhan 430206, China
*
Author to whom correspondence should be addressed.
Remote Sens. 2023, 15(4), 931; https://doi.org/10.3390/rs15040931
Submission received: 3 December 2022 / Revised: 26 January 2023 / Accepted: 5 February 2023 / Published: 8 February 2023

Abstract

:
The new spaceborne photon-counting lidar, i.e., ICESat-2, has shown great advantages in obtaining nearshore bathymetry at a global scale. The forward-scattering effect in the water column is one of the main error sources in airborne lidar bathymetry (ALB). However, the magnitude of the bathymetric bias for spaceborne lidars and how can we effectively correct this bias have not been evaluated and are very worthy of investigation. In this study, the forward-scattering effect on spaceborne photon-counting lidar bathymetry is quantitatively modeled and analyzed based on the semi-analytic Monte Carlo simulation method. Meanwhile, an empirical formula for correcting forward-scattering-induced bathymetric bias specific to ICESat-2 is derived. When the water depth exceeds 20 m, this bias cannot be neglected for ICESat-2 even in clear open ocean waters. In two study areas with local in situ measurements (St. Thomas and Hawaii), the bathymetric bias of ICESat-2 in deep waters (>20 m) is corrected from exceeding 50 cm to less than 13 cm using the proposed empirical formula. This study is valuable to evaluate and correct the forward-scattering-induced bias for the existing ICESat-2 and is also fundamental to optimizing the hardware parameters of a possible future photon-counting bathymetric lidar.

Graphical Abstract

1. Introduction

Nearshore and inland water bodies’ bathymetry provides fundamental information for ship navigation, underwater cable routing, hydrodynamic model development, coral reef investigation, and water volume estimation [1,2,3,4,5,6]. Many kinds of active and passive sensors (e.g., echo sounders, radars, lidars, ocean color sensors, etc.) on a series of platforms (e.g., shipborne, airborne, spaceborne, etc.) have been used to obtain or estimate the water depth and seafloor topography [7,8,9,10,11,12,13,14,15,16,17,18]. For bathymetric lidars, shipborne or airborne full-waveform lidars are traditionally used to obtain accurate bathymetric information in shallow and clear water areas [14]. Recently, a novel UAV-borne topo-bathymetric lidar was able to obtain topography and bathymetry [15]. Spaceborne sensors have shown many advantages especially in generating nearshore and inland water bodies’ bathymetry at a global scale [17,19].
Recently, the spaceborne photon-counting lidar, i.e., ICESat-2 (Ice, Cloud, and land Elevation Satellite-2), obtained along-track seafloor topography up to 40 m in depth [20]. The equipped photon-counting sensors (PMTs in ICESat-2) are much more sensitive (normally two or three orders of magnitudes) than the APD (avalanche photodiode) detectors in full-waveform lidars. Each responded photon event of ICESat-2 corresponds to an independent signal point (or a noise point). By contrast, the traditional full waveform is constructed by thousands of received photons and corresponds to one or several points by the waveform decomposition [21,22,23]. Combining active ICESat-2 lidar bathymetric points (that have high vertical accuracy and can replace the in situ bathymetric measurements) with passive spectral imagery (that has high horizontal resolution and spatial coverage), satellite-derived bathymetry has been achieved in many previous studies [6,18,24,25,26,27,28,29,30,31]. Considering that satellite-based bathymetry becomes increasingly important in shallow waters, especially in light of climate change, dealing with errors in depth determination is of great importance.
To improve the accuracy of ICESat-2 bathymetric data, Parrish et al. [20] proposed an effective correction method to compensate for the refraction effect in the water column (the dominant error source) and achieved a root mean squared error (RMSE) of 0.4–0.6 m in the St. Thomas study site. Ma et al. [18] and Chen et al. [32] further analyzed and corrected the bathymetric error due to the fluctuating water surface and the air–water interface refraction. In addition to the above error sources, irregular seafloor surface and water column forward-scattering effects also introduce bathymetric errors [33,34,35]. In contrast to the random ranging error arising from the irregular seafloor surface, the forward-scattering effect generally introduces a bathymetric bias or ranging delay. To be specific, when a laser beam propagates through the water column, some photons are scattered by organic and inorganic materials [36]. If the forward-scattered photons are finally received by the detector, the broken line of the laser path is longer than a straight line, i.e., a ranging delay occurs. The effect of forward scattering is generally a main error source in airborne lidar bathymetry (ALB) [37] and is greatly influenced by the receiver field of view (FOV) [38]. A larger FOV on ALB systems increases the received signal level to achieve a larger maximum bathymetric depth but simultaneously introduces bathymetric error in receiving more of the photons scattered in the water column. For full-waveform ALB systems, previous studies indicated that the waveform decomposition method can partially reduce the water forward-scattering bias [22,37,38].
However, to suppress the background noise, the FOV of spaceborne lidars is only a few tens of µrad (e.g., 83.5 µrad of ICESat-2) [39,40], whereas the FOV of ALBs normally exceeds several to tens of mrad for deeper water applications [41]. Whether the water forward-scattering effect of spaceborne lidars can be ignored is very worthy of investigation. In addition, a photon-counting lidar does not have a waveform. If the water forward-scattering bias must be corrected, the current waveform decomposition method for full-waveform ALBs cannot be used to compensate for the bias of photon-counting lidars. As a result, this study aims to address the following issues.
(1)
What is the magnitude of the bathymetric bias caused by the water column forward scattering for spaceborne photon-counting lidars and specific to ICESat-2? When and where can it be ignored?
(2)
If the bias cannot be ignored, how to effectively correct this bias? What are the specific bathymetric accuracies before and after the water forward-scattering correction?
(3)
Is the influence of the FOV of spaceborne lidars similar to that of ALBs? Can a larger FOV of spaceborne lidars increase the received signal level to achieve a better bathymetric capability?
The answers to the above questions are of importance in achieving better bathymetric accuracy for an existing spaceborne lidar (e.g., ICESat-2) or designing a future spaceborne lidar with reasonable system parameters. Currently, three categories of methods (i.e., in situ measurement, analytical function modeling, and numerical simulation) are used to investigate and model the forward-scattering effect [42,43]. The in situ measurement is limited for spaceborne lidars with global spatial coverage, and the analytical function modeling is very complicated considering the multiple-scattering effects that are indeed in the water column [44,45,46,47]. Schwarz et al. recently gave a novel physical explanation for this depth-dependent error [48]. Specifically, this depth-dependent error is explained by considering the group velocity of light as water is one of the chromatic dispersive media [48]. The Monte Carlo numerical simulation is a general technique that is applicable to solve the radiative transfer equation (RTE), which can track numerous photon packets to simulate the interaction with particles in settings with arbitrary water intrinsic optical parameters (IOP) and arbitrary boundary geometry [49,50]. This technique has been widely used and validated in airborne and spaceborne lidars [51,52,53,54,55]. Previous studies used the Monte Carlo simulation to evaluate the performance of airborne bathymetric lidars [49] and also of spaceborne oceanic lidars that detect the parameters of the water column such as IOP [51,52,53]. For the ICESat-2 photon-counting lidar, the DART-Lux model is mainly designed and used for land and vegetation targets [54,55].
In this study, a semi-analytic Monte Carlo model is proposed to quantitatively estimate the water forward-scattering bias of spaceborne lidars. Then, an empirical formula specific to ICESat-2, which employs the system parameters of ICESat-2 and environmental parameters from MODIS (Moderate-Resolution Imaging Spectroradiometer) data [56], is derived to correct this bias. The validation experiments are performed in two study areas with ICESat-2 bathymetric data and local in situ measurements. Finally, the specific influence of the FOV of spaceborne lidars on the bathymetric capability and accuracy is discussed.

2. Bathymetric Bias Model of Water forward Scattering

2.1. Basic Model of Bathymetric Bias Caused by Water forward Scattering

When a laser pulse penetrates the water column, some photons are scattered by particles, which changes the propagation path of these scattered photons (as shown in Figure 1). If the forward-scattered photons are still within the FOV and received by a lidar system, the travel distance of forward-scattered photons is greater than that without scattering, and the measured water depth will be overestimated, i.e., a bathymetric bias is introduced.
The basic analytic model of the water forward-scattering bias can be approximated as follows. The expected received signal from the seafloor fb(t) can be expressed as
f b ( t ) = h f s ( t ) f s ( t ) ,
where represents a convolution operation, hfs(t) corresponds to the channel impulse response (CIR) of the water forward scattering, and fs(t) is the expected signal without water forward scattering as shown in Equation (2).
f s ( t ) = f t ( t ) h o t h e r ( t )
ft(t) is the waveform of the transmitted laser pulse, and hother(t) is the response function of other system and environmental effects except for the water forward-scattering effect, which considers the influence of the atmosphere, water–air interface, seafloor, and receiver as well as the water column refraction. The bathymetric bias ΔD due to the water forward scattering can be expressed as
Δ D = 1 2 c w [ 4 σ 4 σ t f b ( t ) d t 4 σ 4 σ f b ( t ) d t 4 σ 4 σ t f s ( t ) d t 4 σ 4 σ f s ( t ) d t ] cos θ 0 ,
where cw is the light velocity in the water column, and θ0 is the nadir angle in the water column. When we focus on the influence of the water forward scattering, ΔD can be simplified as
Δ D = 1 2 c w [ [ 4 σ 4 σ t f s ( t ) h f s ( t ) d t 4 σ 4 σ f s ( t ) h f s ( t ) d t ] 4 σ 4 σ t f s ( t ) d t 4 σ 4 σ f s ( t ) d t ] cos θ 0 1 2 c w 4 σ 4 σ t h f s ( t ) d t 4 σ 4 σ h f s ( t ) d t cos θ 0 .
In Equation (4), the signal duration is centered at the peak value from −4σ to +4σ, where σ is the pulse width.
Equations (3) and (4) indicate that the bathymetric bias due to the water forward scattering is strongly related to hfs(t). It is important to note that the derivative process from Equation (1) to Equation (4) explains this depth-dependent error by the property of linear time-invariant systems, where a delay of the center of gravity of a pulse is introduced by an amount that can be calculated as the center of gravity of its impulse response [57]. This explanation may be not the only answer to the basic question of a longer pulse round trip time due to the scattering-induced path extension. Schwarz et al. give a novel fundamental answer to this basic question [48] and describe this bathymetric bias from a completely new perspective. Specifically, water is a chromatic dispersive media where the group velocity is lower than the phase velocity [48]. The impulses (the photon packets or even a single photon can be considered an impulse) propagate at a lower speed in the water column with the group velocity than that given by the phase velocity. The group velocity is determined by the frequency dependence of the refractive index of the medium [58].
In this study, we use the semi-analytic Monte Carlo method [59] to obtain the numerical solution of hfs(t) with the given system and environmental parameters, which will be described in Section 2.2 in detail. To describe environmental parameters and the scattering effect in the water column, the water medium can be determined by the absorption coefficient a, scattering coefficient b, and the normalized volume scattering function (VSF). The VSF determines the probability of scattering angles and is of vital importance in simulating the laser transmission characteristics in the water volume. The most commonly used VSF dataset consists of eight VSFs measured by Petzold [60]. Mobley et al. [36] compared six analytical phase functions with Petzold’s datasets and indicated that the Fournier–Forand (FF) phase function had the best performance, which is selected in this study.
It should be noted that for photon-counting lidars, in the above derivation process, the expected received signals from the seafloor with and without water scattering should have been their detection Probability Density Functions (PDF) that consider the dead-time effect of photon-counting detectors. However, when the expected signal photon number per detector per laser shot is small (e.g., <0.2 counts), the expected received signals can be directly used for approximation [61,62], and the bathymetric signal level of ICESat-2 satisfies this assumption. In addition, the centroid of the PDF depends on its normalized shape rather than its amplitude as long as the dead-time effect can be ignored. In other words, the expected signal photon number per detector varying from 0 to 0.2 count has no impact on the PDF centroid of a photon-counting lidar.

2.2. Monte Carlo Simulation Process

Figure 2 is the flow chart of the semi-analytic Monte Carlo simulation method used in this study, which can be divided into four parts. (1) Initializing the parameters required by the simulation, including the weight distribution of photon packets on the water surface, FOV, laser nadir angle, absorption coefficient, and scattering coefficient in the water column, etc. (2) Photon packet transmission, i.e., determining the laser propagation path length and the scattering angle in each scattering event and updating the positions and weights of photon packets. (3) Seafloor reflection when a photon packet reaches the seafloor. (4) Setting termination conditions, e.g., whether a photon packet is outside the FOV in the transmission. As shown by red arrows in Figure 2, after the refraction by the water surface, if the laser path of a photon packet can be received by the satellite telescope (the transmission direction of the remaining photons is towards the satellite telescope and within the FOV), the time of flight (TOF) of this photon packet will be recorded as belonging to a specific time bin. Additionally, the residual weights of photon packets in each time bin are summed to obtain the histogram of the TOF, which can be used to calculate the CIR of the forward scattering hfs(t).

2.2.1. Parameter Initialization

Based on Equations (3) and (4), the bathymetric bias due to the water forward scattering is related to the centroid of the expected received signal, not the amplitudes. As a result, the initial weight w0 of all photon packets is set to 1 on the water surface, and the cross-section of the laser spot on the water surface is assumed as a normalized 2D Gaussian distribution [63,64], i.e.,
I ( x , y ) = 1 2 π R D 2 exp [ ( x u x ) 2 + ( y u y ) 2 2 R D 2 ] ,
where RD is the laser footprint radius on the water surface, and (ux, uy) is the location of the laser footprint center. The water surface is divided into grids with horizontal intervals dx and dy, and the energy weight of each grid can be expressed as
w ( x , y ) = I ( x , y ) d x d y = d x d y 2 π R D 2 exp [ ( x u x ) 2 + ( y u y ) 2 2 R D 2 ] .
The initial polar angle θ0 is the laser nadir angle in the water column, which can be calculated based on Snell’s principle and the laser nadir angle θp in the atmosphere, where the azimuth angle φ0 is evenly distributed between 0 and 2π. Given that spaceborne lidars have a nearly nadir incident angle θp (e.g., ICESat-2 has ~0.38°), the refraction effect at the air-water interface is relatively weak; therefore, the water surface is assumed as a flat surface in the simulation. For each grid, a photon packet in the grid (x, y) starts to penetrate the water column with the weight w0(x, y) and the direction of a unit vector (ux,0, uy,0, uz,0) as expressed in Equation (7). The initial state of a photon packet is (x0, y0, z0, ux,0, uy,0, uz,0, w0) and will be updated in the i-th interaction as (xi, yi, zi, ux,i, uy,i, uz,i, wi).
{ u x , 0 = sin θ 0 cos φ 0 u y , 0 = sin θ 0 sin φ 0 u z , 0 = cos θ 0

2.2.2. Photon Packet Penetration in Water Column

When a photon packet interacts with particles, it is either absorbed by particles and disappears, or is scattered in a new direction. The distance that a photon packet travels between adjacent absorptions and/or scatterings by particles can be expressed as [59]
L i = 1 c ln ( ξ 1 ) ,
where c is the beam attenuation coefficient (c = a + b), and ξ1 is a random number evenly distributed between 0 and 1. The probability of scattering is ω0 = b/c. As a result, after an interaction, the ratio of (1 − ω0) is absorbed, and the remaining weight of the scattering part becomes wi+1 = wi·ω0.
After an interaction occurs, the azimuth angle φ satisfies the uniform distribution of [0, 2π], and the polar angle θ satisfies the FF phase function as [36,65,66]
β F F ( θ ) = 1 4 π ( 1 δ ) 2 δ v [ v ( 1 δ ) ( 1 δ v ) + [ δ ( 1 δ v ) v ( 1 δ ) ] sin 2 ( θ 2 ) ] + 1 δ 180 v 16 π ( δ 180 1 ) δ 180 v ( 3 cos 2 ( θ ) 1 ) ,
where   v = 3 u 2   and   δ = 4 3 ( n 1 ) 2 sin 2 ( θ 2 ) .
n is the refractive index of particles, and u is the slope parameter of the hyperbolic distribution. The cumulative distribution function (CDF) PFF can be expressed as
P F F ( θ i ) = 1 ( 1 δ ) δ v [ ( 1 δ v + 1 ) ( 1 δ v ) sin 2 ( θ i 2 ) ] + 1 δ 180 v 8 ( δ 180 1 ) δ 180 v cos θ i sin 2 θ i = ξ 2 .
Using a random number ξ2 that follows the uniform distribution of [0, 1], the polar angle of i-th interaction θi can be calculated by the numerical solution. The polar angle θi and azimuth angle φi can be obtained to update the propagation direction of the photon packet as
{ μ x , i + 1 = sin θ i 1 μ z , i 2 ( μ x , i μ z , i cos φ i μ y , i sin φ i ) + μ x , i cos θ i μ y , i + 1 = sin θ i 1 μ z , i 2 ( μ y , i μ z , i cos φ i + μ x , i sin φ i ) + μ y , i cos θ i μ z , i + 1 = sin θ i 1 μ z , i 2 cos φ i + μ z , i cos θ i .
Using above steps, a photon packet state can be updated from (xi, yi, zi, ux,i, uy,i, uz,i, wi) to (xi+1, yi+1, zi+1, ux,i+1, uy,i+1, uz,i+1, wi+1). The state of the photon packet will continue to update unless the photon packet meets the boundary conditions (e.g., reach the seafloor or water surface) or termination conditions.

2.2.3. Seafloor Reflection

When a photon packet reaches the seafloor and satisfies the condition of zi+1 > h (water depth), the position of the photon packet should be at the seafloor (rather than penetrating the seafloor); therefore, Li should be adjusted to (h − zi)/uz,I, and the coordinates [xi+1, yi+1, zi+1] at the seafloor are re-calculated using the adjusted Li. For the seafloor reflection, we assume that the seafloor is an approximately flat surface and satisfies a Lambertian reflector with a reflection coefficient ρb. From Lyzenga’s classical study [67], the average reflectance of the sand, mud, and vegetation is approximately ρb = 0.15 at the wavelength of 532 nm. After the seafloor reflection, the propagation direction and remaining weight can be expressed as
{ μ x , i + 1 = sin θ b cos φ b μ y , i + 1 = sin θ b sin φ b μ z , i + 1 = cos θ b w i + 1 = ρ b w i ,
where θb can be obtained by θ b = arcsin ( ξ 3 ) for a Lambertian reflector, which is clarified in Equations (14) and (15); ξ3 is a random number evenly distributed between 0 and 1, and φb satisfies the uniform distribution of [0, 2π]. A Lambertian surface reflects radiance equally in all directions, and the Bidirectional Reflectance Distribution Function (BRDF) of a Lambertian reflector can be expressed as [68]
B R D F L a m b ( θ i , ϕ i , θ r , ϕ r ) = ρ b π .
The incident light comes from direction (θi, φi) and the reflected light travels toward the viewing direction (θr, φr). The CDF for the angle θb can be expressed as
ξ 3 = C D F ( θ b ) = 0 θ b   B R D F L a m b ( θ i , ϕ i , θ , ϕ r )   cos θ   sin θ   d θ 0 π 2   B R D F L a m b ( θ i , ϕ i , θ , ϕ r )   cos θ   sin θ   d θ   = sin 2 θ b .
It should be noted that after the seafloor reflection, the propagation direction of the unit vector in Equation (13) is upward, and the photon packet will continue to penetrate the water column until reaches the water surface, which can be calculated using Equation (8) to Equation (12).

2.2.4. Termination Conditions

Once the state of a photon packet arriving at the water surface is achieved, the photon packet will be received by detectors when it satisfies
{ x s 2 + y s 2 < D 2 / 4 z s = 0 | θ s θ p | δ θ ,
where D is the FOV diameter on the water surface, θs is the zenith angle of the photon packet after the water surface refraction, which can be calculated based on Snell’s principle and the last unit vector of the propagation direction in the water column, and θp is the laser incident angle on the water surface. The photon packets that locate within the FOV and propagate towards the satellite receiver (instead of in an arbitrary direction) can be received by the telescope. The condition of θsθp means that the propagation direction of photon packets should be towards the satellite receiver telescope. The symbol “≈” rather than “=” is used because the receiver telescope has a certain size rather than a point, and the range of deviation δθ depends on the diameter of the receiving telescope and the flight altitude.
The TOF of a photon packet traveling in the water column can be calculated as T = Lpath/cw, where Lpath is the total two-way propagation distance in the water column (from the water surface to the seafloor, and then back to the water surface). After simulating all photon packets, the information of the propagation times and corresponding weights of all photon packets are accumulated to generate the TOF histogram in time slots, i.e., the discrete CIR of the forward-scattering hfs(t). Then, the bathymetric bias is estimated by Equation (4). In the simulation process, considering the simulation efficiency, when the weight wi drops to a level lower than the threshold ws (i.e., the contribution of the current photon packet can be neglected for the total received photon packets) or the position of the photon packet is out of the FOV after multiple interactions with particles, the tracking of the current photon packet is terminated. As terminating the photon packet whose remaining weight is lower than ws violates the law of energy conservation, Russian roulette is used to compensate [69].

2.3. Empirical Formula on Correcting Bias for ICESat-2

By inputting the system and environmental parameters, the water forward-scattering bias due can be estimated using the above semi-analytic method. However, to precisely correct this bias, it is difficult to obtain global in situ water intrinsic optical parameters (IOP), and it is very time-consuming to simulate the specific bias with different depths, water qualities, and lidar system parameters. Alternatively, in this study, we aim to derive an empirical formula that can be easily used to correct the water forward-scattering-induced bathymetric bias specific to ICESat-2, the only satellite-based photon-counting lidar that can obtain the bathymetry currently. In addition, the used environmental parameters should be at a global scale.
ICESat-2 uses a green laser at 532 nm to penetrate water, and the equipped photon-counting detectors can collect the photons reflected from the seafloor. The system parameters of ICESat-2 used in this study are listed in Table 1. The MODIS Level 3 standard product [56] (https://oceancolor.gsfc.nasa.gov/cgi/l3 accessed on 1 December 2021) provides the total backscattering coefficient bb and the absorption coefficient a at 531 nm (that is very close to the ICESat-2 laser wavelength) with a 4 km × 4 km grid. The backscatter ratio that is equal to B = bb/b is set to 0.013 in coastal water [70], and scattering coefficient b can be calculated by bb/B. In the FF phase function, n can be related to u through n = 1.01 + 0.1542(u − 3), where n = 1.09 and u = 3.517 are used here [36].
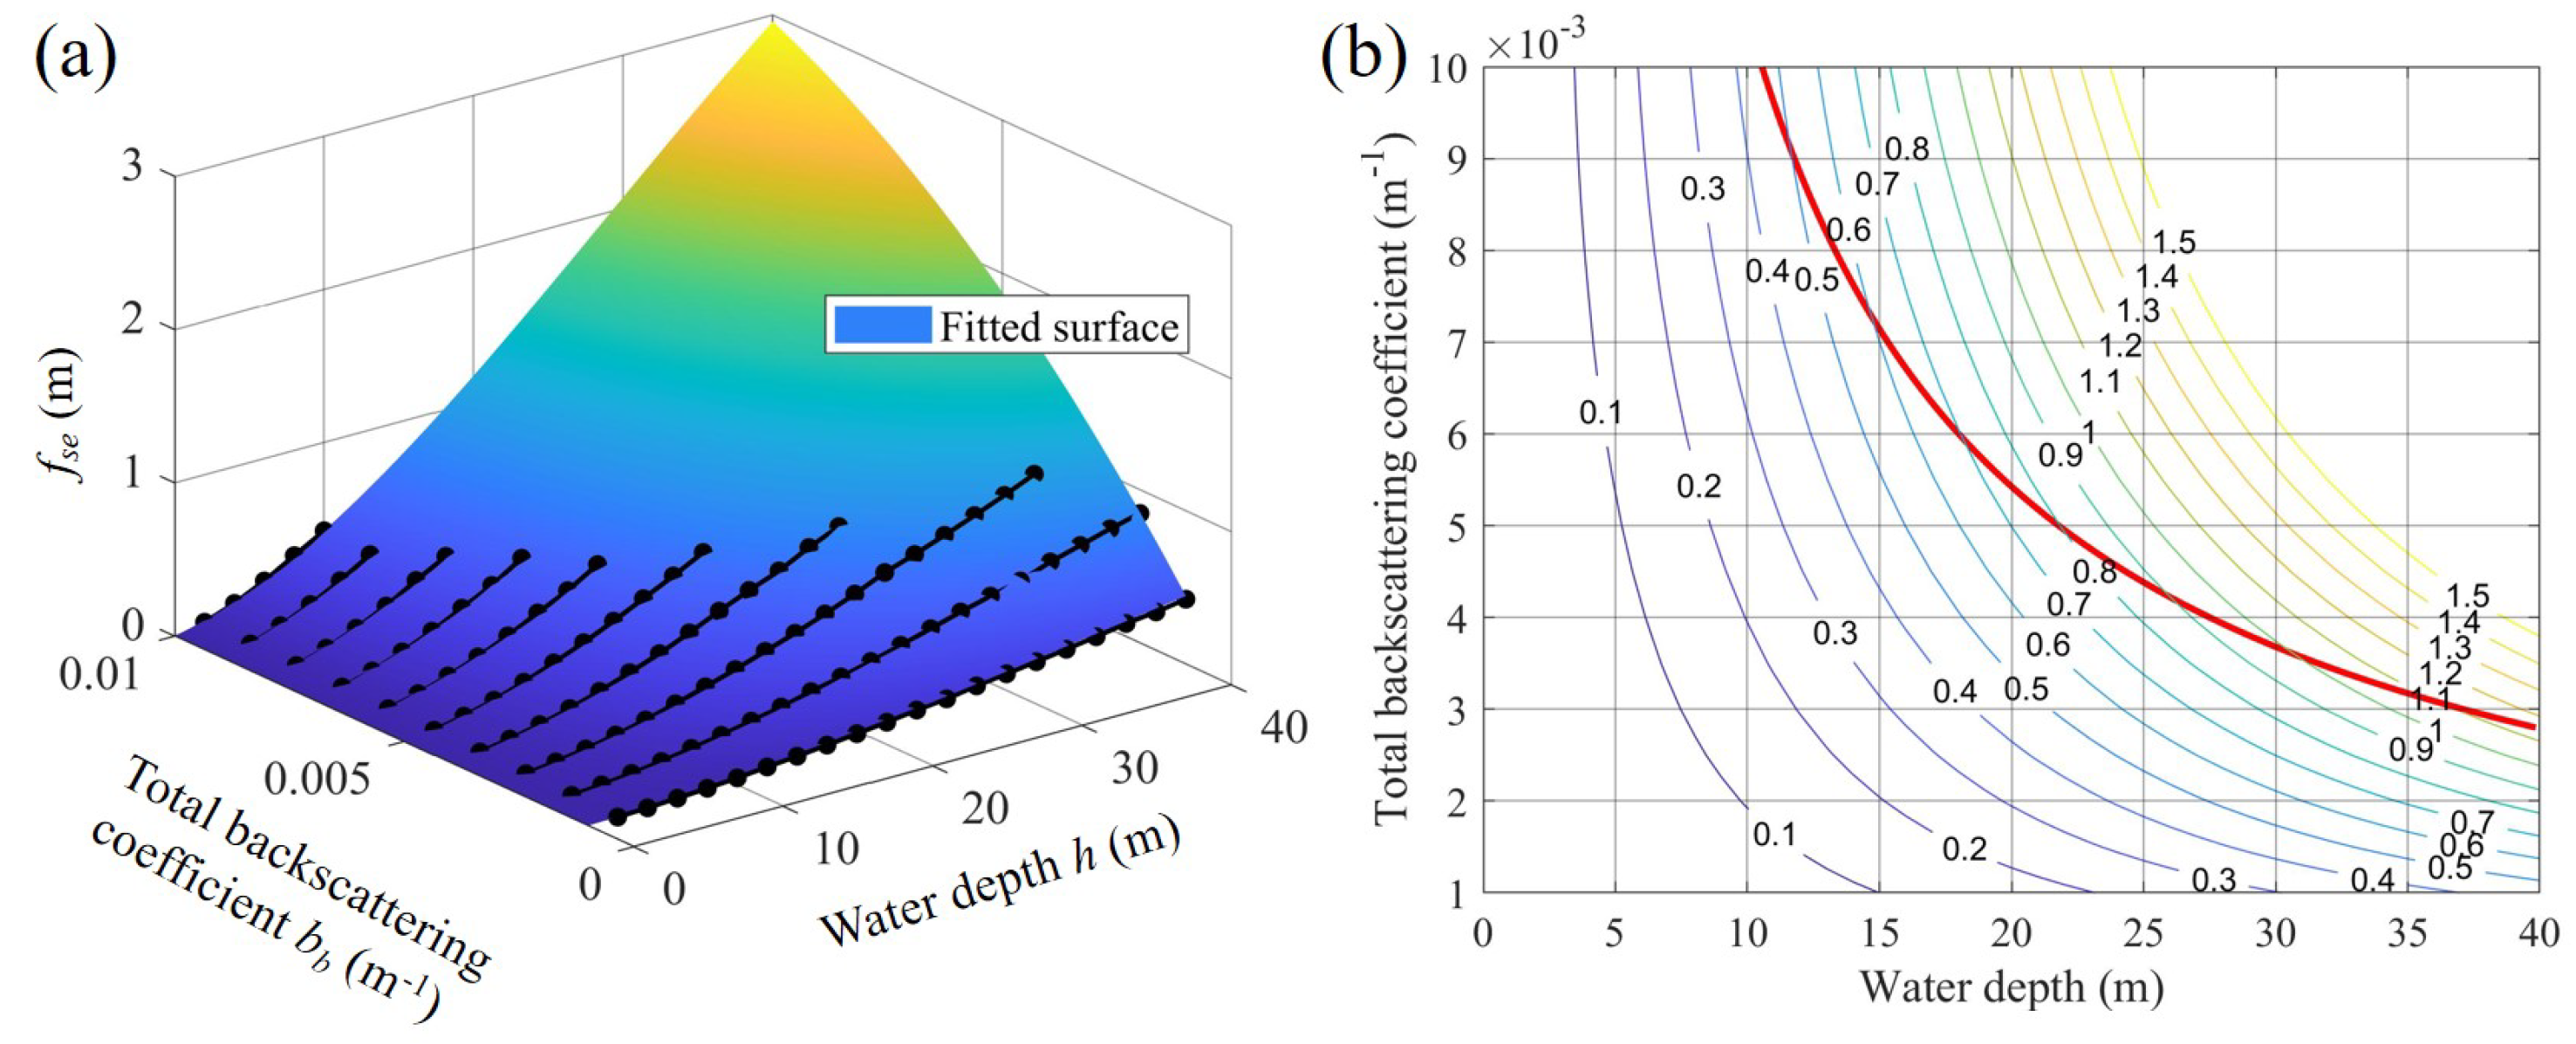
The absorption mainly determines the weight of photon packets, and with a given probability of scattering ω0 = b/c, the water forward-scattering-induced bathymetric bias of ICESat-2 fse can be approximated with two parameters (i.e., the total backscattering coefficient bb and water depth h). The typical probability of scattering ω0 for coastal waters [41,71] is 0.85. For each independent variable combination (bb, h), the bathymetric bias fse(bb, h) of ICESat-2 is simulated with h varying from 0 to 40 m and bb varying from 10−3 to 10−2 m−1 (as illustrated in Figure 3), and a cubic polynomial function is used to fit the simulated fse(bb, h) as an empirical formula shown as
f s e ( b b , h ) = [ b b b b 2 b b 3 ] T [ p 11 p 12 p 13 p 21 p 22 p 23 p 31 p 32 p 33 ] [ h h 2 h 3 ] ,
where bb2 and bb3 are the square and cubic of bb, whereas h2 and h3 are the square and cubic of h, respectively.
Figure 3a illustrates the simulated results (using black points) and fitted surface. The nine parameters in Equation (17) are [1.547, 0.4126, −0.004064; 277.2, −32.78, 0.3668; −22,500, 1620, −24.46], and the RMSE and R2 between the simulated and fitted results are 0.007 m and 0.9998, respectively. It should be noted that the simulation results, i.e., the black points in Figure 3a, only include the bias fse within the maximum bathymetric depth of ICESat-2. For typical coastal water, the maximum bathymetric depth of ICESat-2 is nearly hmax = 1.81/Kd [20]. Kd is the diffuse attenuation coefficient and can be expressed as [7]
K d = a + 4.18 ( 1 0.52 e 10.8 a ) b b .
Figure 3b illustrates the contour of fse(bb, h), which is calculated using the derived empirical formula in Equation (17). In Figure 3b, the red curve represents the maximum bathymetric depth varying with the total backscattering coefficient, and the area in the top right corner generally cannot be measured by ICESat-2. For clear waters (e.g., open ocean water), ICESat-2 can achieve a bathymetry depth exceeding 40 m and the corresponding fse(bb, h) is approximately 1 m. It is obvious that fse(bb, h) becomes larger with the increase in water depth and the backscattering coefficient. In previous studies, after the refraction correction, the remaining bathymetric error of ICESat-2 is approximately 0.5 m [20]. In relatively deep water (>20 m), the ICESat-2 bathymetric bias cannot be neglected because this bias will be several tens of centimeters.
In Equation (17), the absorption coefficient a is not involved. When a can be directly obtained (e.g., from the MODIS data), the empirical formula considering a can be corrected as
f s e ( a , b b , h ) = f s e ( b b , h ) exp [ ( a a c a l ) · f s e ( b b , h ) ] ,
which will be more accurate due to the consideration of the absorption coefficient a. The term exp[−(aacalfse(bb,h)] in Equation (19) is the influence of the absorption coefficient, and acal is the calculated absorption coefficient by a fixed probability of scattering ω0. Equation (19) will be identical to Equation (17) when a = acal. Generally, the bias fse(a, bb, h) mainly depends on the scattering, whereas the absorption mainly impacts the maximum bathymetric depth. For example, with fse(bb, h) of 0.5 m, even if the difference between a and acal is 0.05 m−1, the term exp[−(aacalfse(bb,h)] is equal to 0.975 and has a very weak impact on fse(bb, h). We aim to derive a simple and effective empirical formula for correcting (at least partly) the bathymetric bias of ICESat-2, and as a result, Equation (17) is recommended when a is difficult to obtain directly. It must be emphasized that the empirical formula is an approximated solution for bathymetric data of ICESat-2 and is not applicable to other bathymetric lidars. Nevertheless, the basic model and simulation method used in this study can be expanded to other lidar systems.

3. Experiments and Validations

3.1. Study Area Selection and Data Pre-Processing

The photon-counting lidars are quite different from the full-waveform lidars. As mentioned above, previous studies [22,35,37,38] have shown that the water forward-scattering-induced bathymetric bias of full-waveform airborne bathymetric lidars can be partially corrected through the waveform decomposition method. However, each photon event responded to by the photon-counting detector corresponds to an independent bathymetric point; therefore, the traditional waveform decomposition method cannot be used for correcting this bias for photon-counting lidars. For spaceborne photon-counting bathymetric lidars, in addition to the forward-scattering error from the water column, many other effects introduce bathymetric errors, e.g., the air–water interface refraction, water column refraction, irregular seafloor surface, fluctuating water surface, laser pointing error, etc. [18,20,35].
For ICESat-2, with a near nadir incidence on the water surface (~0.38°), some of these error sources have relatively weak impacts on the total bathymetric accuracy [18], and the dominant error is the refraction effect in the water column [20]. Based on previous studies, after correcting water column refraction errors, the RMSE of ICESat-2 bathymetric photons is approximately 0.5 m [20], and the remaining error includes bias and random error. It should be noted that this statistical RMSE of 0.5 m averaged the errors of bathymetric photons from shallow water to deep water. Given that each photon event corresponds to an independent bathymetric point, the number of bathymetric photons in shallow waters is much larger than that in deep waters due to the water column attenuation. As a result, the remaining error after refraction correction (i.e., the speed correction due to the difference of the light speeds in air and water) is larger than 0.5 m in deep waters (e.g., >20 m).
As mentioned in Section 2, the water forward-scattering effect introduces a ranging delay, which overestimates the ranging result and belongs to a bias. The total RMSE is generally the root sum squares (RSS) of the total bias and random noise. Only when the bias is sufficiently large is it necessary to compensate; otherwise, even if we correct this bias, the total RMSE will improve little. As shown in Figure 3b, only when the water depth is deeper than 15 m may the water forward-scattering bias reach 0.5 m. As a result, to verify the performance of the derived correction method in this study, the study area should correspond to the fact that ICESat-2 has a large water scattering-induced bathymetric bias. From Figure 3b and the maximum bathymetric depth of ICESat-2, two study areas are selected (i.e., at St. Thomas and Hawaii), where ICESat-2 should have a relatively obvious bathymetric bias (up to 0.7 m) and local in situ measurements with high bathymetric accuracy (at ~10 cm level) are available.
In this study, based on the approach in our previous study [18], the bathymetric signal photons of ICESat-2 are detected by the Density-Based Spatial Clustering of Applications with Noise (DBSCAN) method, and the bathymetric error from the air–water interface refraction, water column refraction, and fluctuating water surface are corrected. The remaining bathymetric error includes the water forward-scattering bias and random ranging noise from other error sources. Due to the tidal effect, the local water levels are different when the acquisition dates of ICESat-2 and in situ measurements are different. When the local tidal data are unavailable, the vertical accuracy validation in bathymetry is normally based on the ellipsoidal height (or orthometric height) rather than the changeable water depth. As a result, in the validation, the orthometric height is used. Using the VDatum tool [72], all used datasets are converted to the local orthometric height, i.e., Virgin Islands Vertical Datum of 2009 (VIVD09 specific to St. Thomas, epsg:6642) and Local Mean Sea Level (LMSL specific to Hawaii, epsg:5714).

3.2. Description of Study Areas and Used Data

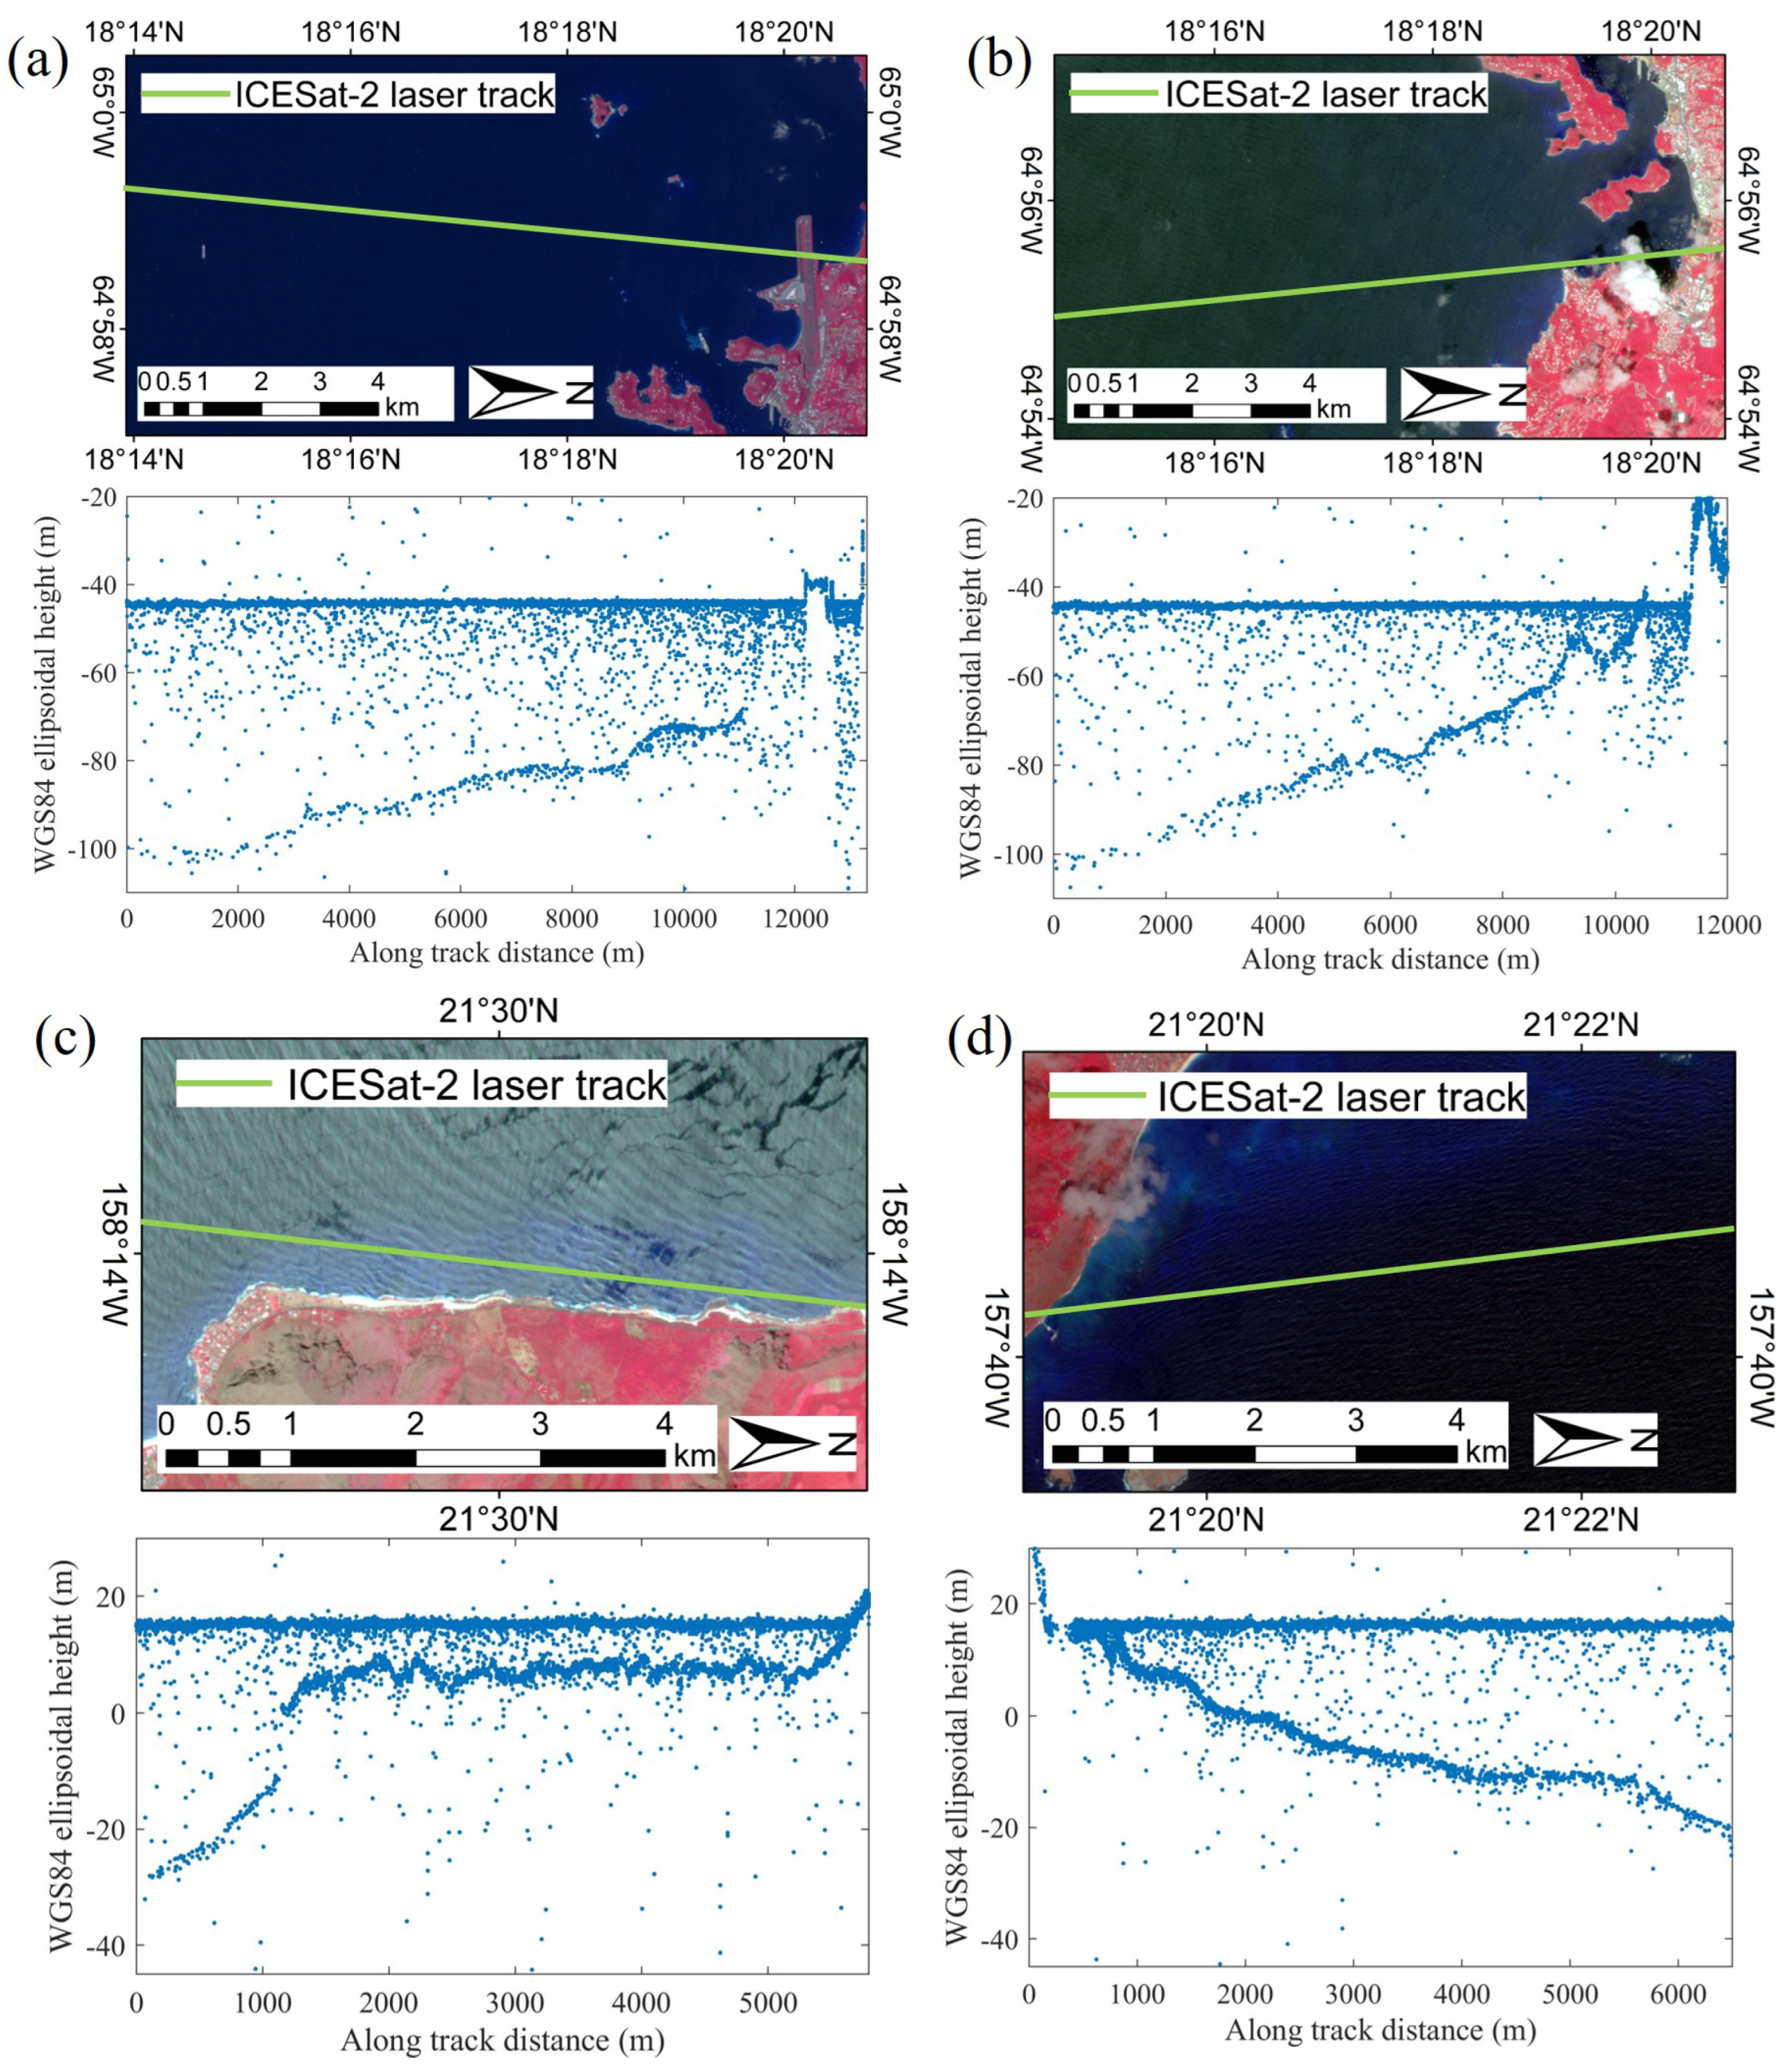
St. Thomas [18°20′N, 64°55′W] (located approximately 100 km southwest of Puerto Rico) is one of the main islands of the U.S. Virgin Islands in the Caribbean Sea as shown in Figure 4b. Hawaii State [21°29′N, 157°58′W] (located approximately in the middle of the Pacific Ocean) is an archipelago of the U.S. as shown in Figure 4c. The two study areas mainly consist of coral reefs and hard soil, and the seafloor terrain varies little, which is suitable for validation. The available in situ measurement at St. Thomas is the bathymetric lidar data collected by the Experimental Advanced Airborne Research Lidar-B (EAARL-B) in 2014 (https://coast.noaa.gov/dataviewer/#/lidar/search/where:ID=4940 accessed on 1 December 2021) [73]. The average point spacing of the EAARL-B lidar is from 0.15 to 0.60 m with a vertical accuracy of 0.14 m. The in situ data at St. Thomas are in geographic coordinates of NAD83 and orthometric heights of VIVD09. The available in situ measurement at Hawaii was collected by the Coastal Zone Mapping and Imaging Lidar (CZMIL) system in 2013 (https://coast.noaa.gov/dataviewer/#/lidar/search/where:ID=5034 accessed on 1 December 2021) [74], and the vertical accuracy of these data is approximately 0.10 m. The in situ data at Hawaii are in geographic coordinates of the NAD83 and orthometric heights of LMSL.
For ICESat-2, the ATL03 datasets within the study area are freely downloaded from the National Snow and Ice Data Center (NSIDC) website [75]. The ICESat-2 ATL03 datasets provide geolocated photons (including signal and noise photons) in geographic coordinates and ellipsoid heights of WGS84. A series of geophysical corrections have been implemented for these geolocated photons, including but not limited to the laser-pointing bias, atmospheric correction, ocean, and solid tide [76]. After these corrections, the height uncertainty is ~0.2 m for plain terrain [77]. Four ground tracks of ATL03 datasets (as illustrated in Figure 4 and Figure 5) are used in the validation experiment, and the details of the granule ID, acquisition date, and water intrinsic optical parameters (from MODIS products) are listed in Table 2. As mentioned above, the bathymetric photons in ATL03 datasets are detected and the bathymetric errors (including the air-water interface refraction, water column refraction, and fluctuating water surface) are corrected using our previous method [18].
Via the VDatum tool, the WGS84 geographic coordinates and ellipsoid heights of ICESat-2 data are converted to the NAD83 geographic coordinates and VIVD09 orthometric heights (at St. Thomas) or LMSL heights (at Hawaii) that are identical to the in situ data. To conduct the validation, for each available bathymetric photon from ICESat-2, all in situ bathymetric points within the circle of a 5 m radius centered by the current ICESat-2 point are selected by the latitude and longitude coordinates. Then, after a 3-sigma filter (to discard the possible gross errors), the mean height of the selected in situ bathymetric points is calculated as the truth value for the current ICESat-2 bathymetric photon. In addition, the derived empirical formula for correcting the water forward-scattering bias of ICESat-2 needs the intrinsic optical parameters (IOPs) of local water. The total backscattering coefficient bb and the absorption coefficient a provided by MODIS are used here for four ICESat-2 ground tracks (shown in Table 2).

3.3. Experimental Results

Figure 6 illustrates the result of ICESat-2 data pre-processing for four ground tracks, i.e., via the VDatum tool, the ellipsoid heights of ICESat-2 ATL03 data in Figure 5 are converted to the local heights that are identical to in situ data. In Figure 6, the signal points on the water surface (red points) and seafloor (yellow points) are detected by the DBSCAN method, and the bathymetric errors arising from the air–water interface refraction, water column refraction, and fluctuating water surface are further corrected (purple points). The water depths are calculated as the height differences between the ocean surface photons and seafloor photons, and then, they are substituted into Equation (19) to estimate water forward-scattering biases.
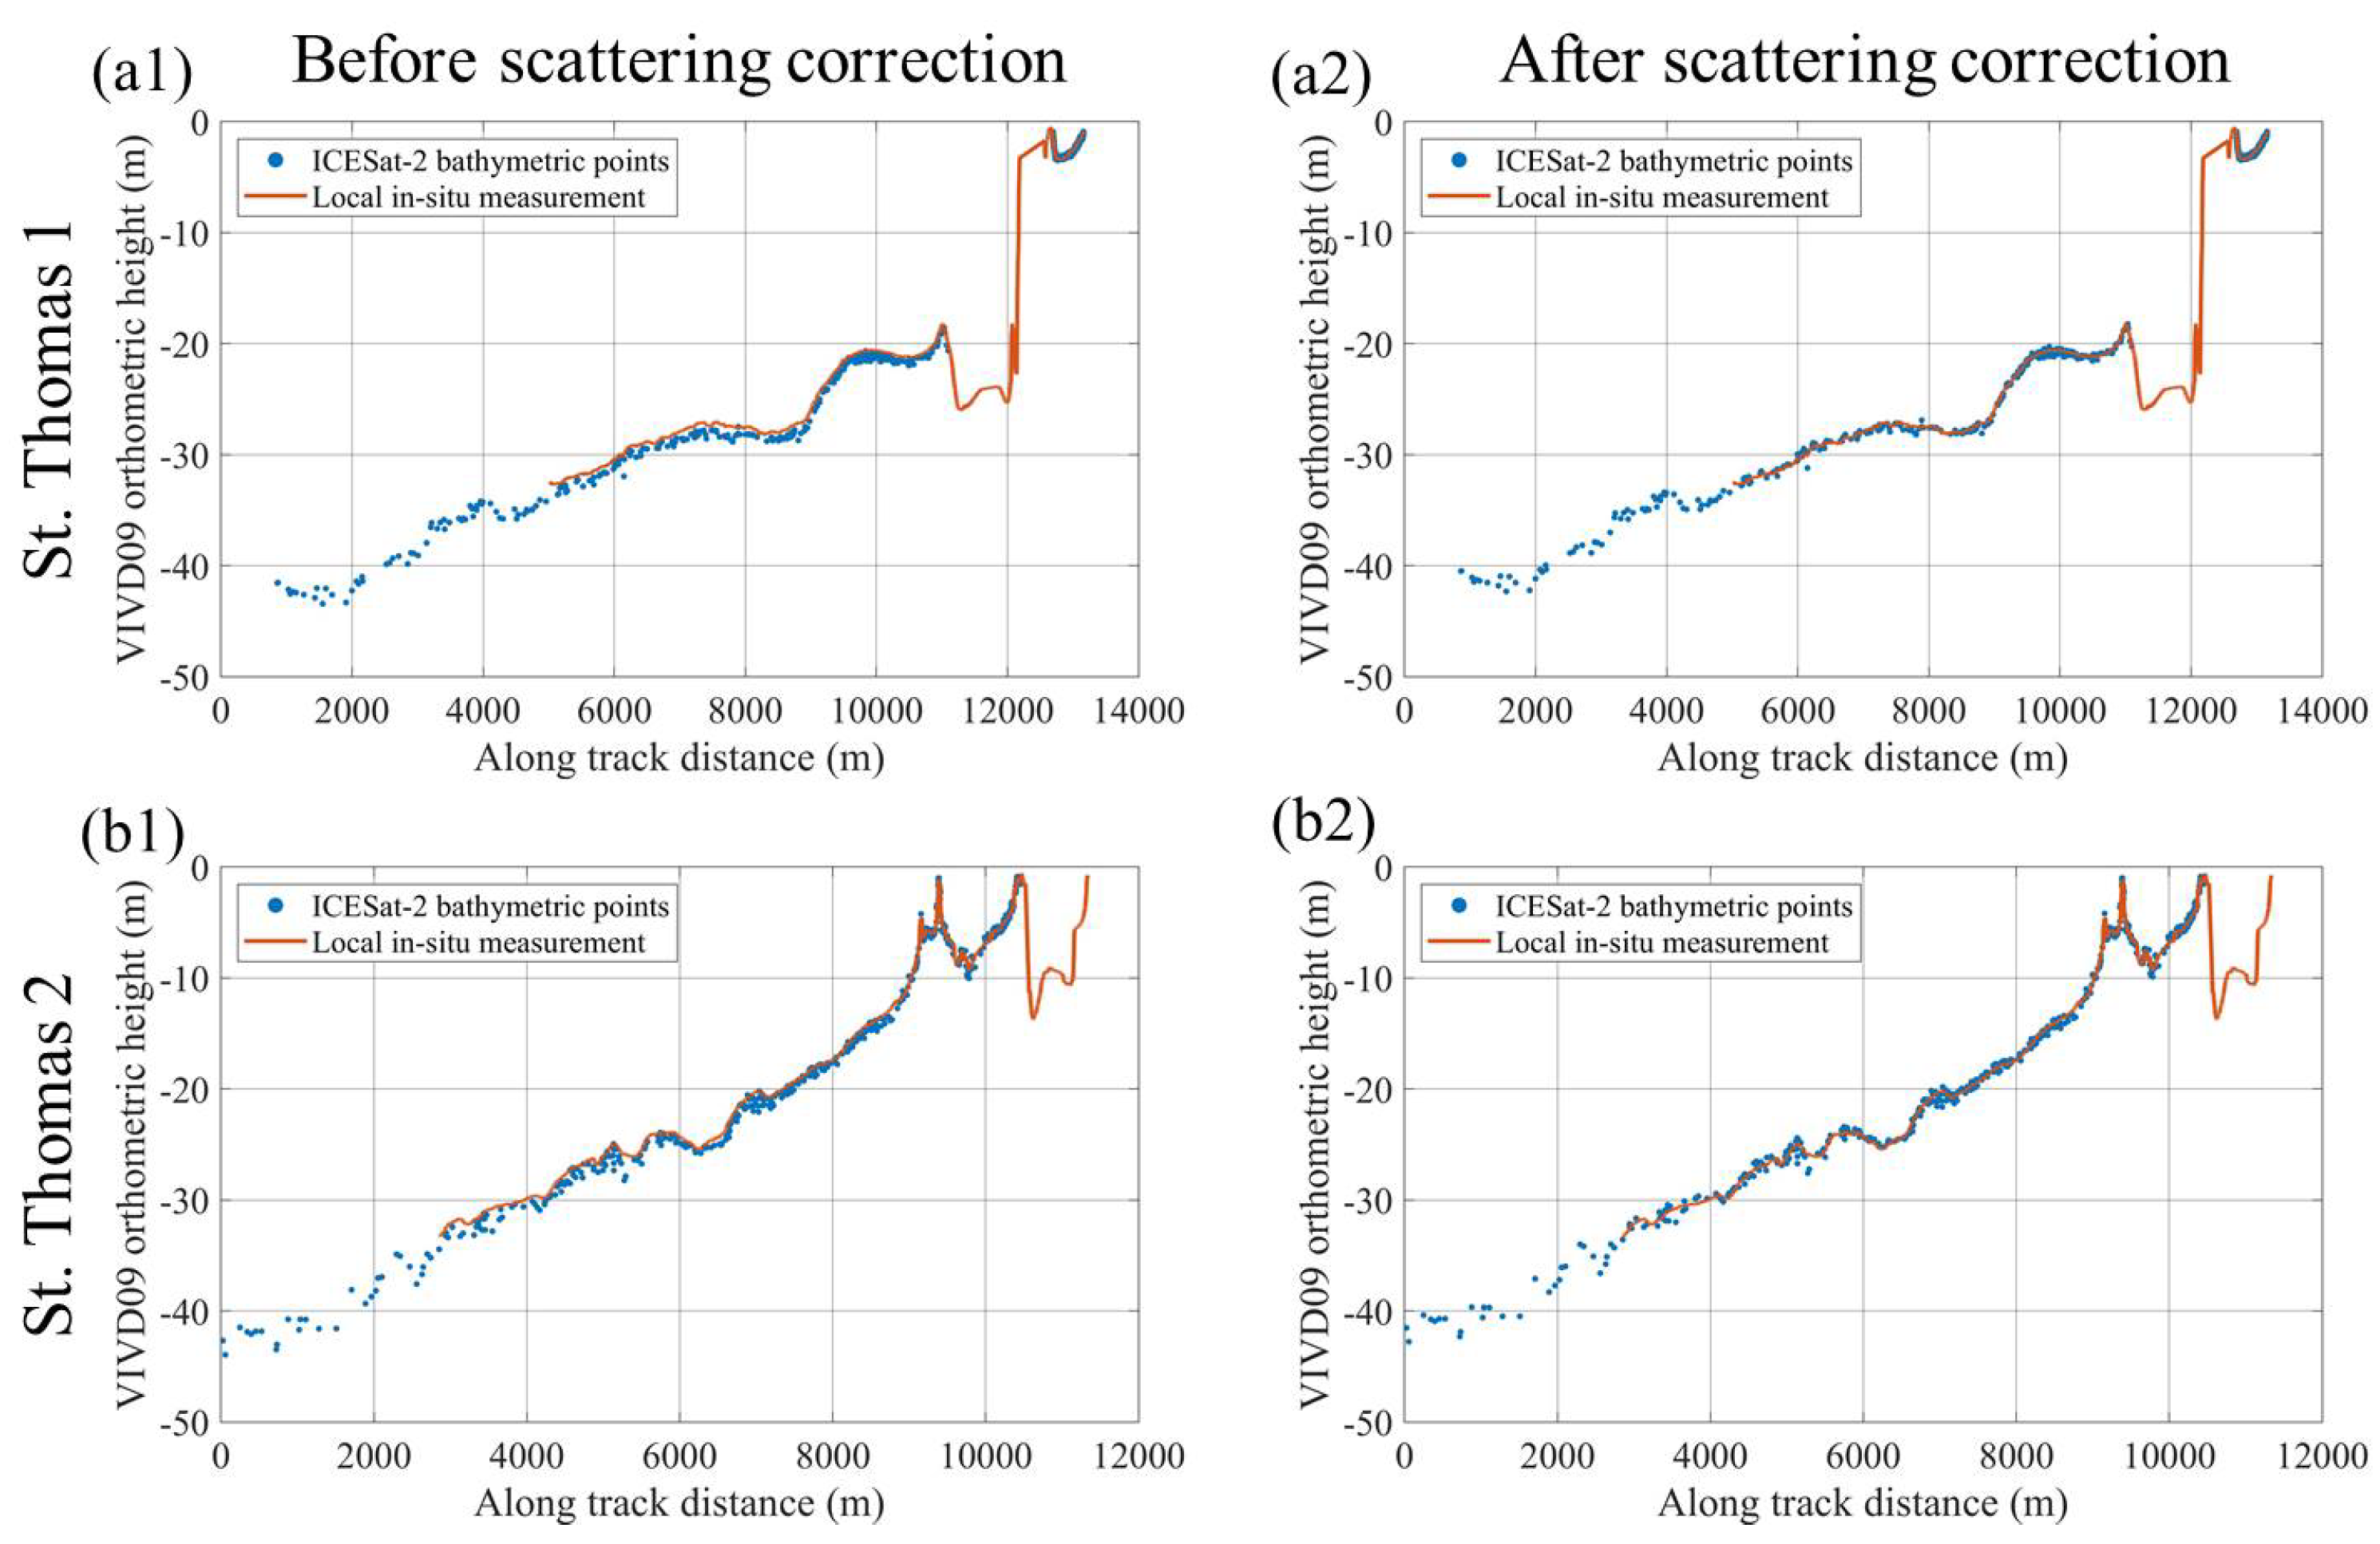
Then, the correction method for water forward-scattering errors is verified by comparing the orthometric height differences between ICESat-2 along-track bathymetric points and “truth” seafloor profiles from local in situ measurements. The truth profile is calculated using the 5 m average by geographic coordinate matching, which has been described in Section 3.1. Figure 7 provides the comparisons between ICESat-2 along-track bathymetric points (before and after water forward-scattering corrections) and truth profiles at St. Thomas, where all height values are in VIVD09 orthometric heights. Without forward-scattering correction, an obvious bias can be found in Figure 7(a1,b1) in water depths >20 m, and this phenomenon disappears (ICESat-2 along-track profiles are nearly overlapped by truth profiles) after scattering corrections in Figure 7(a2,b2).
To clearly show this bathymetric bias in deep water, Figure 8 illustrates comparisons between ICESat-2-derived depths and their corresponding truth values under the vertical datum of water depths. In Figure 8(a2,b2), ICESat-2 points are closer to the 1:1 line after scattering corrections, i.e., the water forward-scattering biases have been effectively eliminated. In addition, the water depths are overestimated in both Figure 7 and Figure 8 if water forward-scattering corrections are not conducted, which is consistent with the theoretical derivations in Section 2.
Table 3 shows the statistics of two ground tracks at St. Thomas, where the MEs (mean errors) and RMSEs in different water depths are used to reveal the differences before and after scattering corrections. The MEs in Table 3 are the orthometric height differences between ICESat-2 and in situ data, i.e., a minus value means that the orthometric height of an ICESat-2 bathymetric point is underestimated or the water depth is overestimated by ICESat-2. After water forward-scattering corrections, the MEs (which correspond to the bias rather than random errors) in deep water (>20 m) are reduced from approximately 60 cm to less than 10 cm, i.e., the main part of the water forward-scattering bias has been corrected. Accordingly, the corresponding RMSEs in deep water (>20 m) are reduced from 67~75 cm to 26~44 cm, benefitting from scattering corrections. It must be emphasized that this scattering correction method can only correct the bias but cannot correct random errors, i.e., the remaining errors of 26~44 cm are mainly arising from random errors (e.g., irregular bottom surface) and residual other error sources (e.g., the refraction effect).
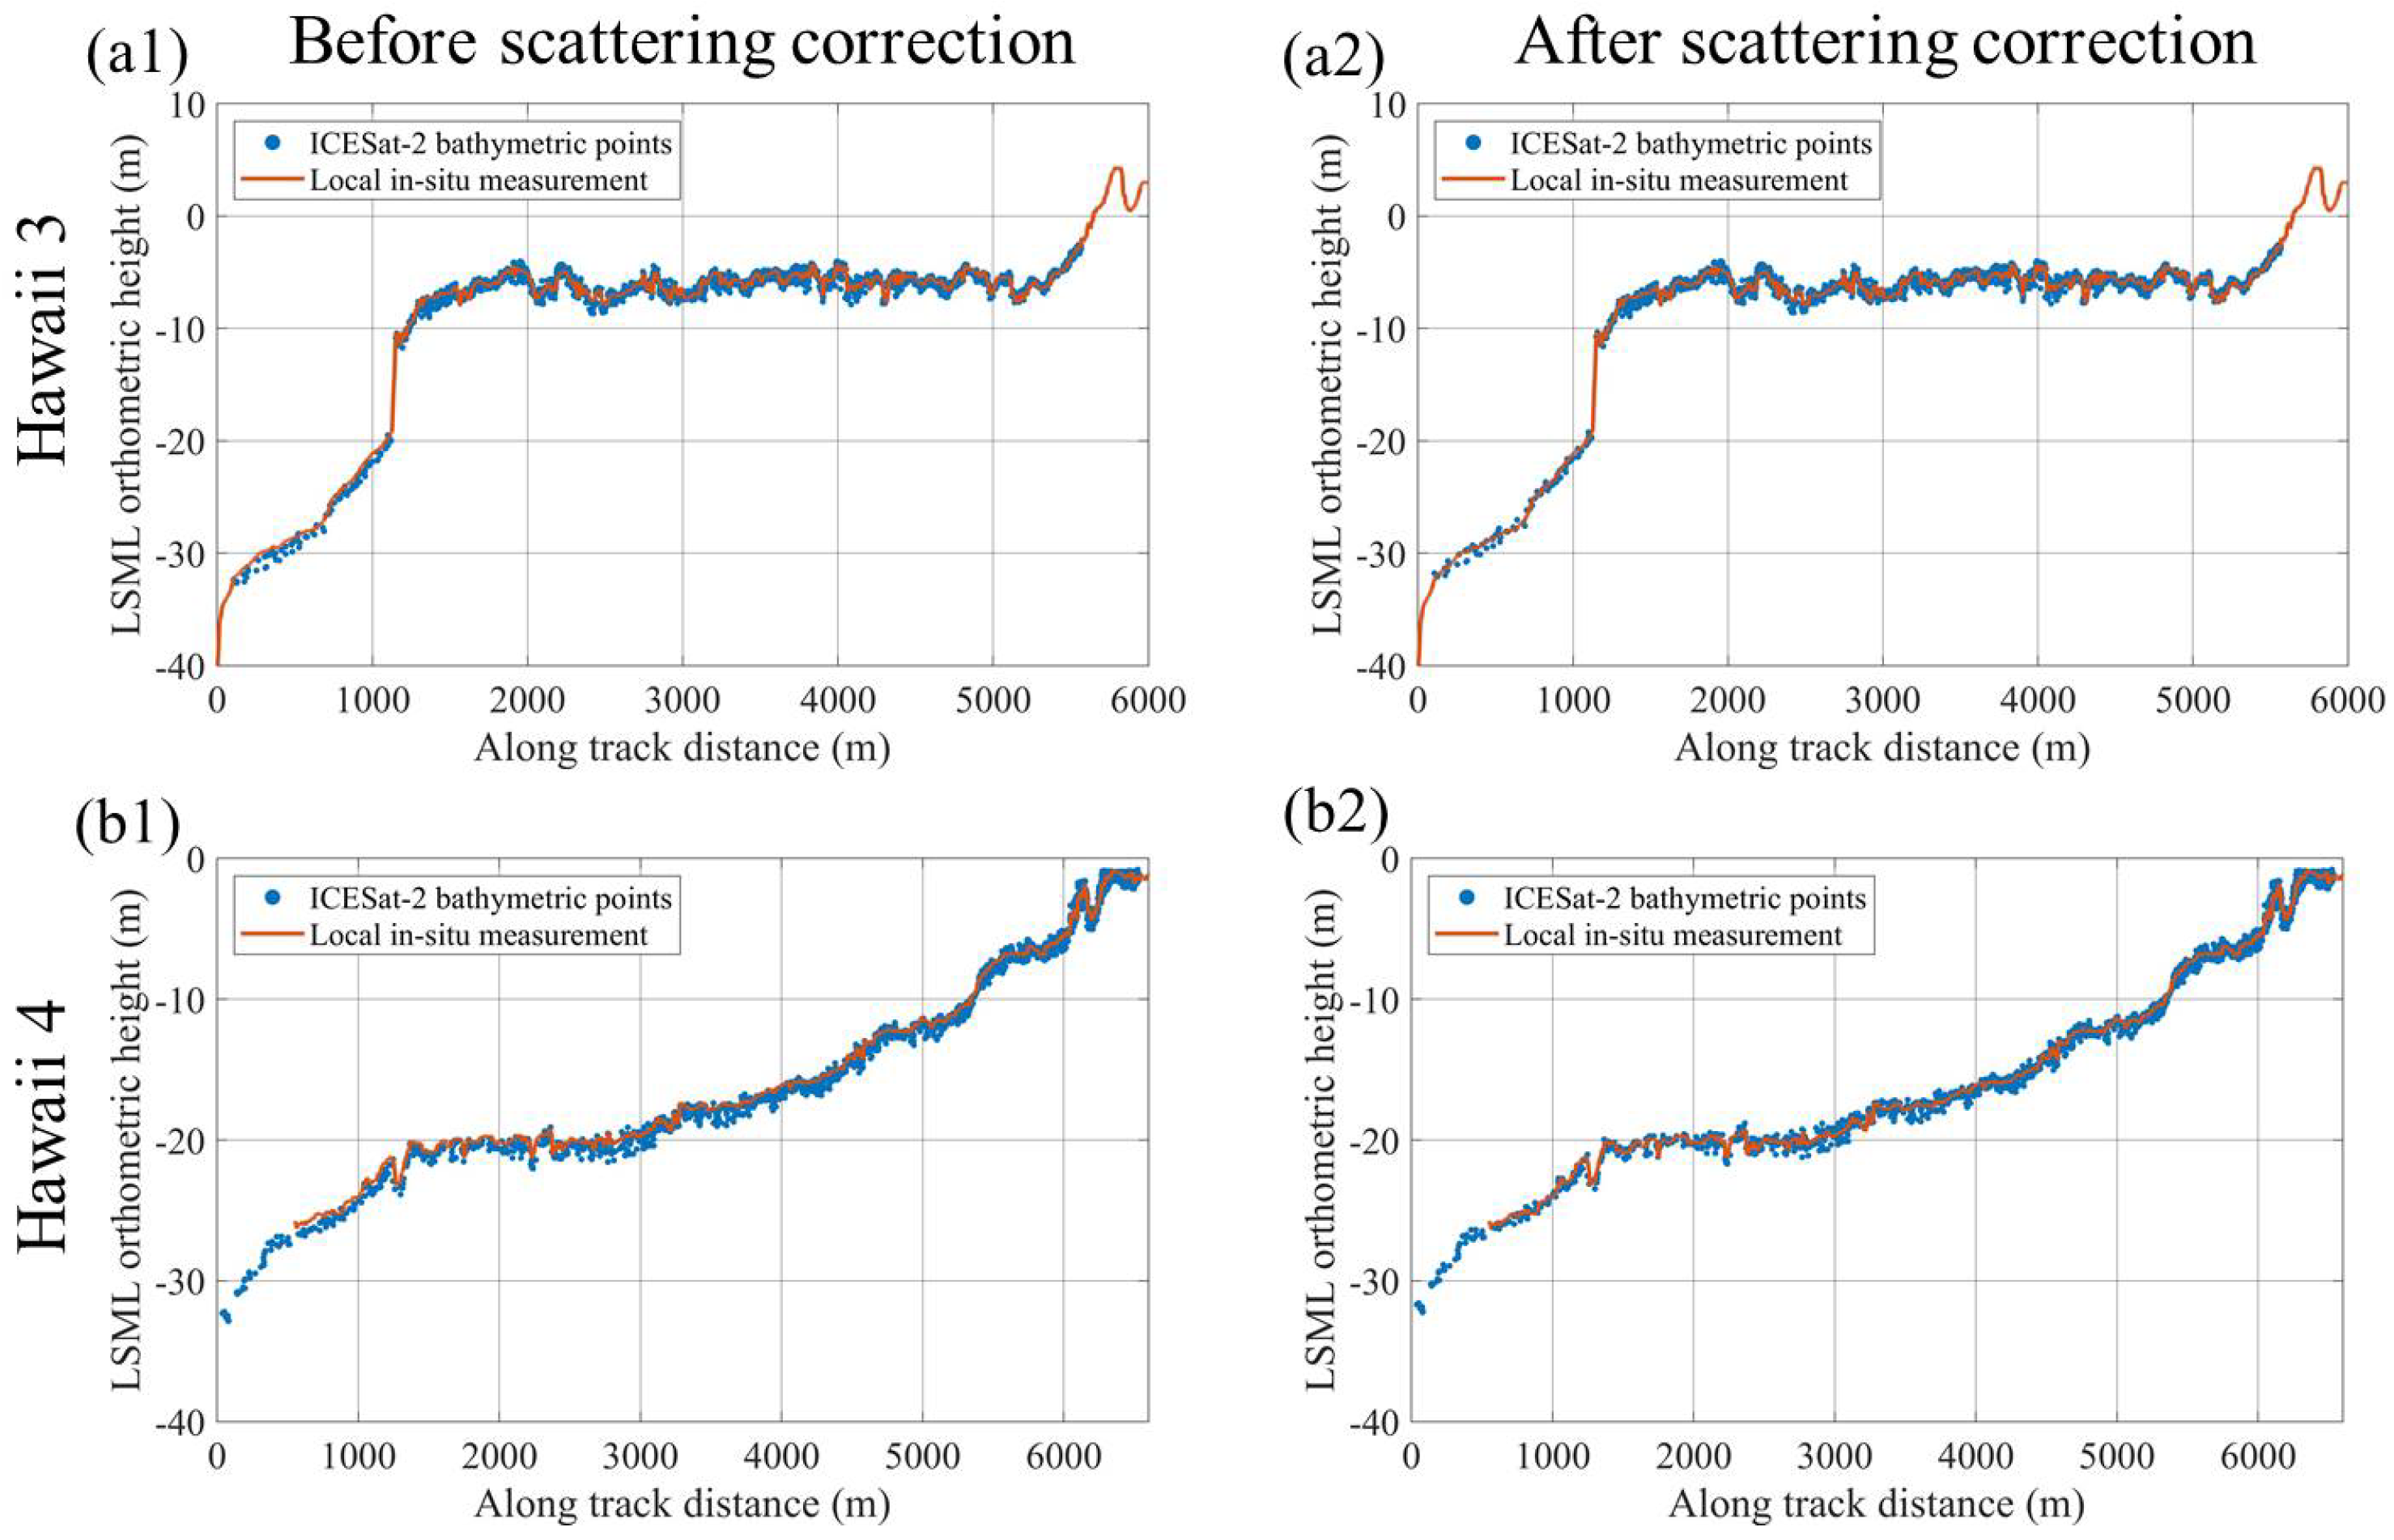
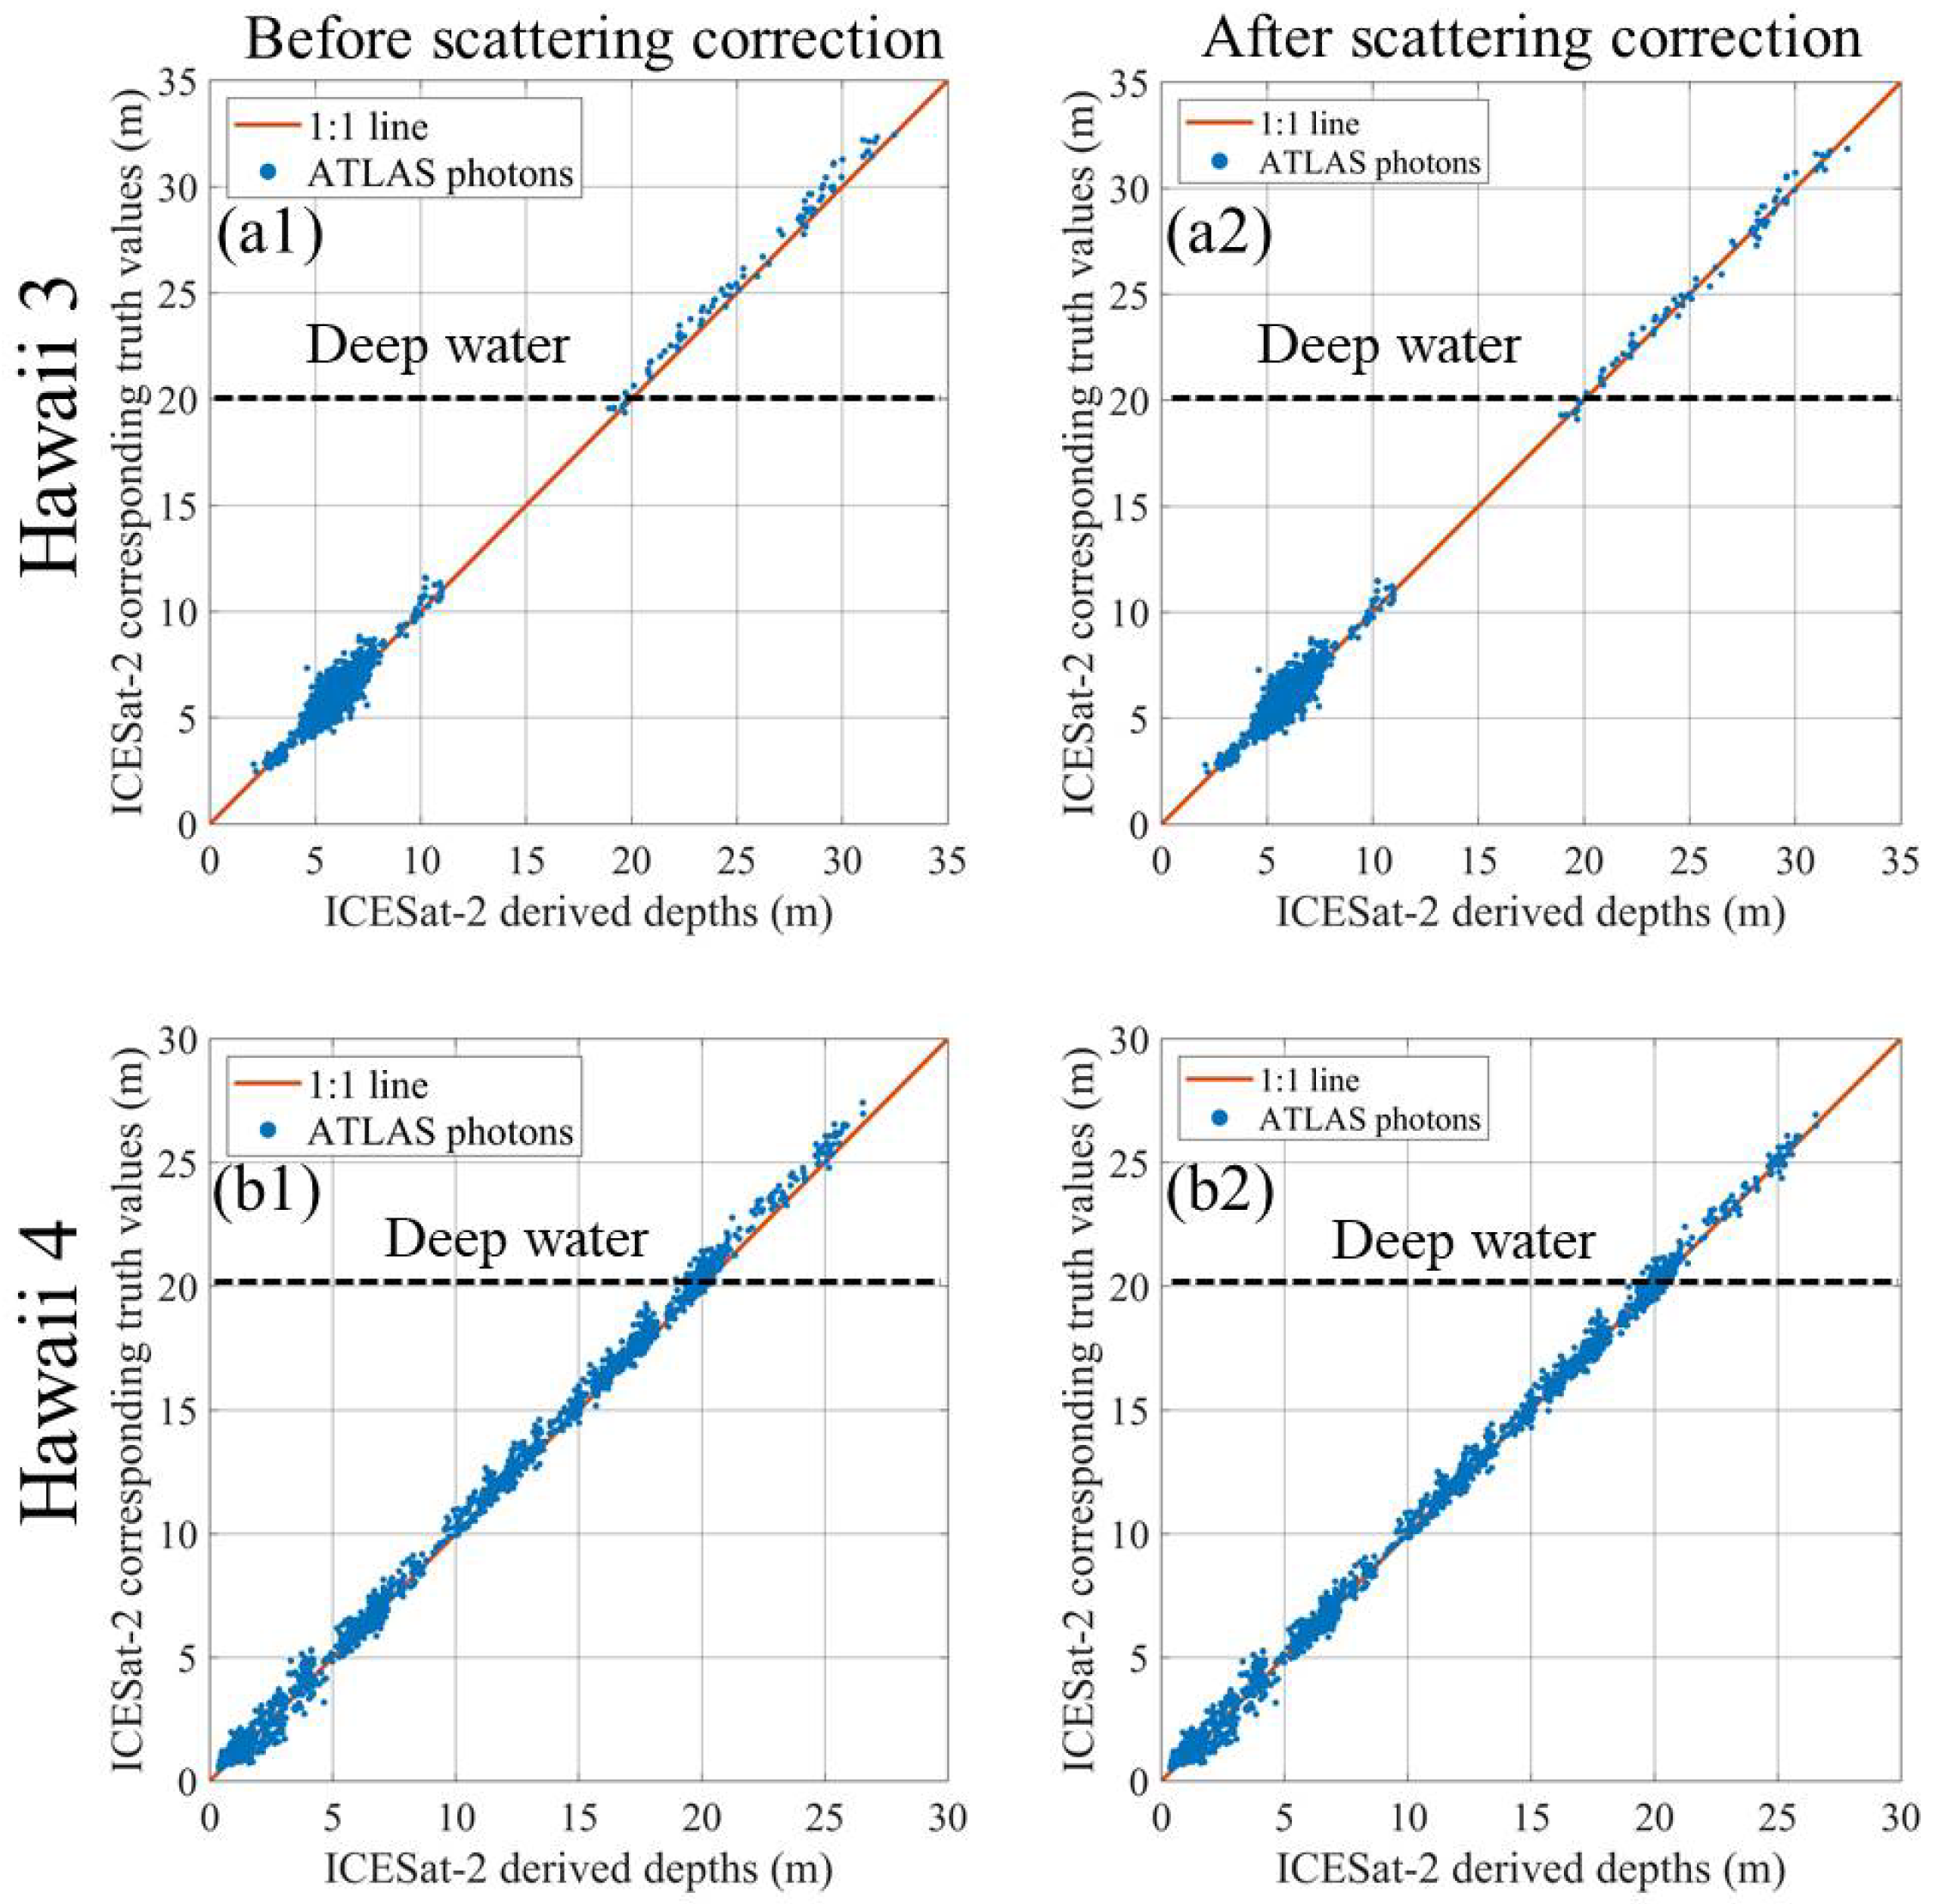
Similar to the procedures at St. Thomas island, Figure 9 provides the comparisons between ICESat-2 along-track bathymetric points (before and after forward-scattering corrections) and truth profiles at Hawaii, where all height values are in LMSL orthometric heights. To clearly show the bathymetric bias in deep water, Figure 10 illustrates comparisons between ICESat-2-derived depths and their corresponding truth values under the vertical datum of water depths in Hawaii. Table 4 shows the statistics of two ground tracks in Hawaii. In Table 4, the bias (MEs) are exceeding or approximately 50 cm in deep water (>20 m) and are corrected to less than 13 cm, and the corresponding RMSEs reduce from greater than 60 cm to less than 40 cm. In Hawaii, the statistics in Table 4 indicate that this scattering correction method can effectively improve the bathymetric accuracy in deep water areas (>20 m).
Note that in Equations (17) and (19), to correct the water forward-scattering bias, the “true depth (h)” is needed. However, in practice, we cannot obtain the “true depth (h)” even if we have corrected all error sources. In this study, before correcting the water column forward-scattering bias, the other main factors (i.e., the air–water interface refraction, water column refraction, and water surface fluctuation) that have impacts on the measured water depth of ICESat-2 have been corrected using the method in our previous study [18]. Here, we directly use this derived water depth in place of the “true depth (h)”. As shown in Table 3 and Table 4, after the above three corrections, the RMSE of derived water depths (h) is close to 0.7 m or 3% in water depths of 20~35 m. We use the data of St. Thomas Island 1 as an example: the water column forward-scattering bias varies by ~2% with the water depth. As a result, considering the residual error of the water depth (~3%) and the water column forward-scattering bias itself (~2% of the water depth), the product of 3% and 2% is 0.06% of the water depth, which can be neglected.

3.4. Result Analysis

To double verify the proposed model and empirical formula of the water forward-scattering bathymetric bias, the experimental results in Section 3.3 are compared with the theoretical predictions. Using the intrinsic optical parameters of local waters in Table 2, the empirical formula for ICESat-2 in Equation (19) is applied to estimate the forward-scattering biases for four ground tracks as illustrated in Figure 11. Blue curves in Figure 11 represent the theoretical biases and red asterisks represent the experimental MEs (i.e., the uncorrected MEs in Table 3 and Table 4). Figure 11 indicates that the experimental results agree well with the model predictions in St. Thomas island 1 and 2 as well as Hawaii 4. At Hawaii 3 as shown in Figure 9(a1), the seafloor is relatively steep where the water depth ranges from 10 m to 30 m, and the number of reflected photons is very small, which may explain the relatively large difference between the blue curve and red asterisks in Figure 11c and the relatively poor performance in reducing MEs in Table 4. Nevertheless, this forward-scattering correction method achieves an evident improvement in deep water (i.e., the RMSE reduces from 67 cm to 40 cm) at Hawaii 3.
At Hawaii 3 and Hawaii 4 (shown in Table 4), the RMSEs of all ICESat-2 bathymetric points do not significantly improve because (1) random errors dominate the total error in shallow water and the water forward-scattering bias is relatively weak; (2) the number of valid bathymetric points in shallow water is much larger than that in deep water (due to the attenuation in the water column). In Section 3.1 above, we have pointed out that only when the water forward-scattering bias is sufficiently large is it necessary to correct it; otherwise, even if we correct this bias, the total RMSE will improve little. The statistics in Table 3 and Table 4 confirm this assumption. The ratio of the number of valid bathymetric points in deep water to the number of all valid bathymetric points is 83/2362 at Hawaii 3 and 203/1575 at Hawaii 4. The total number of ICESat-2 bathymetric photons with deep water depths (>20 m) at Hawaii 3 is only 83 while the number is 249/192/203 for the other three tracks, which can explain why the results at Hawaii 3 are worse than the other three tracks. A lower point cloud density corresponds to a higher false alarm probability, which introduces more noise photons in the data processing step and decreases the effectiveness of the correction method. In summary, in two study areas, this forward-scattering correction method achieves an obvious improvement for ICESat-2 in deep water areas (>20 m). When the water depth is shallower than 10 m in open ocean water (the maximum bathymetric depths can reach 30 m or even more), the forward-scattering effect is relatively weak and can be neglected considering other error sources.
The proposed forward-scattering correction method still has some limitations. First, the time and resolution inconsistency between MODIS and ICESat-2 data may introduce some errors due to inaccurate input water optical parameters, i.e., a and bb in Equation (19). However, we do not have a more reasonable dataset containing water optical parameters with global coverage and daily updates. In this study, the water optical parameters derived from the MODIS daily product with the identical acquisition date or monthly average product (if the daily product is not available) at a 4 km grid are selected and then bilinearly interpolated to the locations of ICESat-2 bathymetric points. Second, the sea surface is assumed to be flat to simplify the forward-scattering correction model. Given that the incident angle on the sea surface is nearly nadir, this assumption is reasonable when the wind speed above the sea surface is relatively low; otherwise, it may introduce some errors to the correction results. Although there are some limitations in the proposed scattering correction model, the MEs in Table 3 and Table 4 that are mainly related to the bias have been significantly improved after correction.

4. Discussion

The returning laser energy (i.e., the photons) within the receiver FOV can be collected by a telescope. The size of the receiver FOV is normally larger than the transmitted beam divergence since the laser beam will be expanded by scattering in the water column [38,41,78]. For airborne bathymetric lidars, the laser divergence is normally nearly 1 mrad, and the diameter of laser footprints on the water surface will be close to 1 m at a 1 km flight altitude. A larger FOV (e.g., a few tens of mrad and ten times the laser divergence) can effectively increase the received signal level (corresponding to a larger maximum bathymetric depth) but simultaneously introduce greater bathymetric error in receiving a greater part of the laser energy scattered by the water column. Accordingly, two general types of ALB systems are optimized for shallow water (with a small FOV and less bathymetric error) and deep water (with a large FOV and more receiving energy), respectively. Some ALB systems (such as CZMIL and EAARL-B used in this study) have both small and large FOV channels to conduct the bathymetry in different water depths [73,79]. However, for spaceborne bathymetric lidars flying at several hundreds of kilometers, is it also an effective way of using a large ratio between the FOV and laser divergence to achieve a large maximum bathymetric depth?
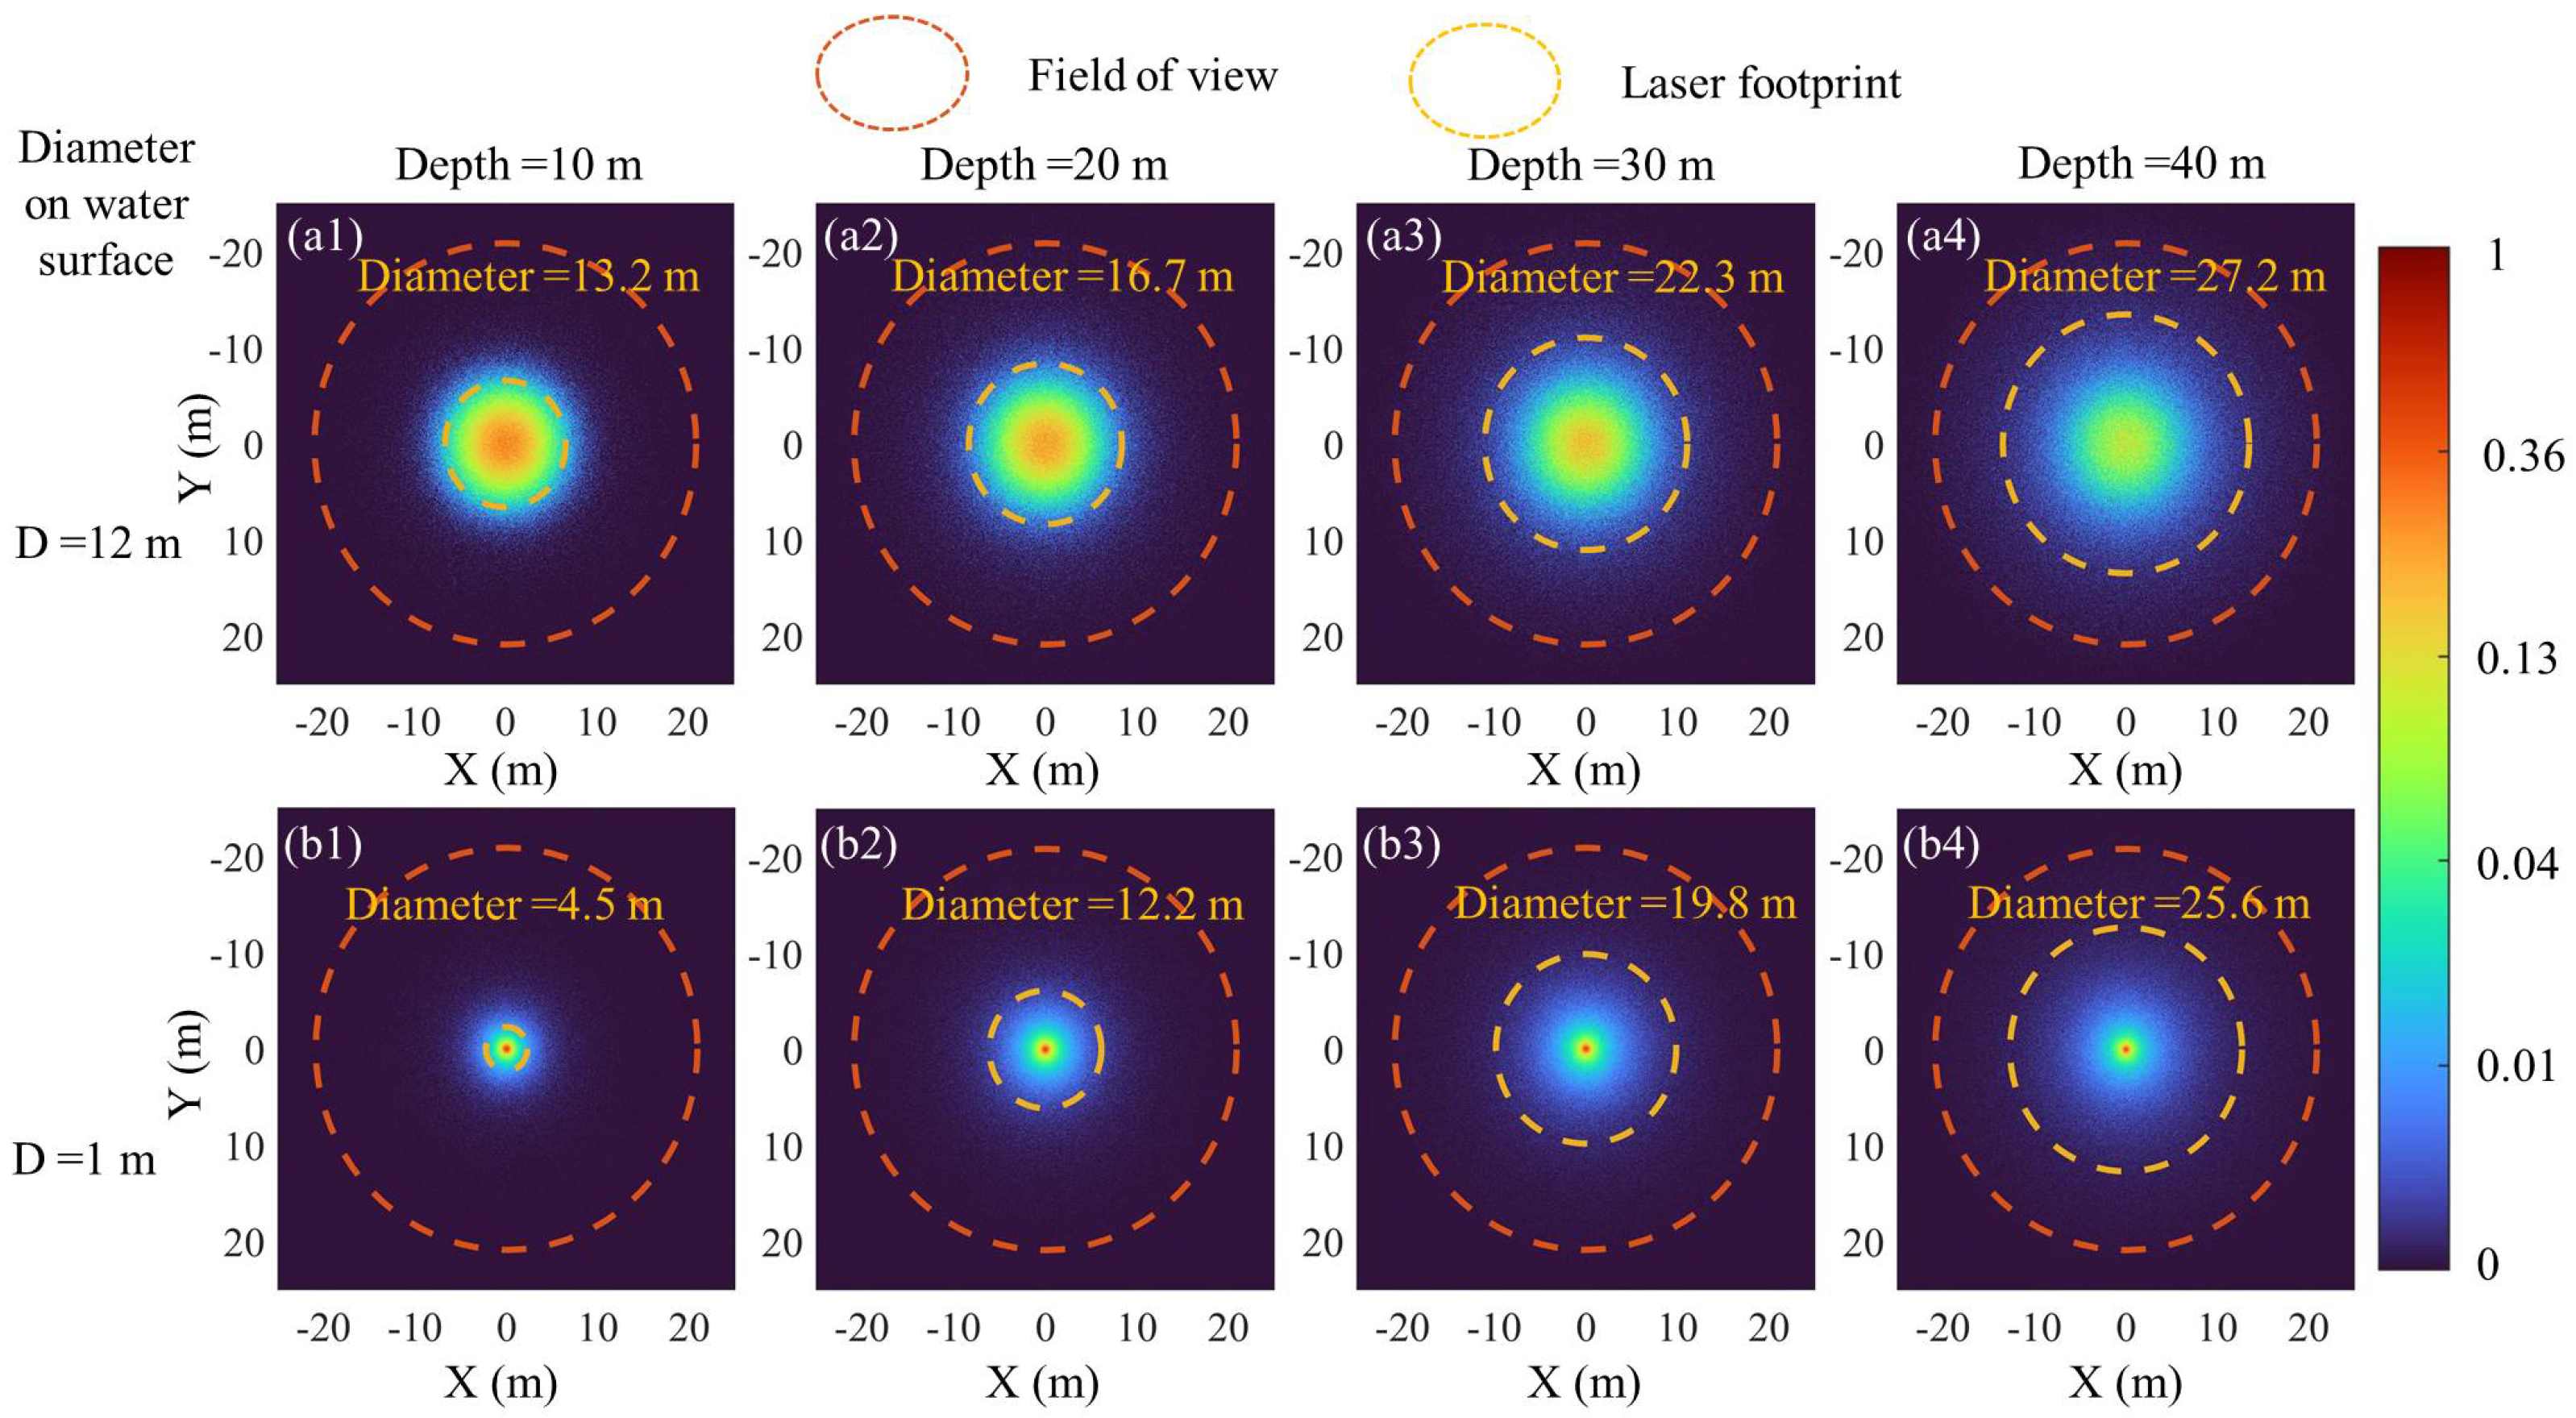
By analyzing the relative energy distribution of laser footprints at the seafloor (which has undergone scattering in the column) and the proportion of laser energy within the FOV at the seafloor, the effect of expanding FOV can be investigated. Figure 12 (which is generated by the Monte Carlo simulation process in Section 2.2) illustrates the normalized energy distributions at the seafloor with different laser footprints on the water surface and water depths. In Figure 12, the system parameters of ICESat-2 and environmental parameters in the experimental area of Thomas island 1 are used. In Figure 12(a1–a4), the 12 m diameter of laser footprints on the water surface corresponds to ICESat-2 (which has an approximately 24 µrad laser divergence and 500 km flight altitude), whereas the 1 m diameter is a typical laser footprint for ALB systems (corresponding to the laser divergence of 1 mrad at a 1 km flight altitude) in Figure 12(b1–b4). The yellow dotted circles contain approximately 87.5% of the total laser energy (i.e., 2 sigma), and the red dotted circles represent a 42 m diameter of FOV on the water surface (i.e., ICESat-2 has an 83.5 µrad FOV). The laser footprint diameter at the seafloor can be approximately regarded as the convolution of the laser footprint diameter on the water surface and the beam spread function (BSF) in the water column [70]. The VSF (depending on the optical properties in the water column in Section 2.1) describes a single scattering event that determines the probability of scattering angles. The BSF describes the cumulative effects of the absorption and scattering between the seafloor and water surface, which depends on the water depth and optical properties.
The laser footprint diameter of ICESat-2 spreads little in shallow water as shown in Figure 12(a1) because the diameter on the water surface is larger than the BSF expanded effect and plays a major role in the convolution. By contrast, in Figure 12(b1), the laser footprint diameter significantly expanded from 1 m to 4.7 m in shallow water because the BSF has a primary impact on ALB systems. With a flight altitude of several hundreds of kilometers, the laser footprint of a spaceborne lidar is normally a few tens of meters [39,80]. Even though the ratio between the FOV and laser divergence is only 3.5 (i.e., 83.5 µrad FOV/24 µrad laser divergence) for ICESat-2, most of the total laser energy is within the FOV at a water depth of 40 m as shown in Figure 12(a4). A larger FOV cannot further increase the received seafloor signal for ICESat-2 and will introduce much more solar-induced background noise (that is proportional to the squared FOV). In other words, further expanding the FOV of ICESat-2 has a negative impact on the maximum bathymetric depth due to the lower signal-noise ratio (SNR). ICESat-2 has a very brilliant system design, which can just receive almost all of the laser energy scattering by the water column at its maximum bathymetric depth.
The above conclusions can also be explained by the findings of Churnside [81], which indicate that if the FOV is greater than the forward peak of the scattering phase function, the appropriate lidar attenuation coefficient α will be close to the diffuse attenuation coefficient Kd. The lidar attenuation coefficient α is normally used for ALBs and can be expressed as [44,81]
α = K d + ( c K d ) exp ( 0.85 c D ) ,
where c is the beam attenuation coefficient (c = a + b), and D is the diameter of the FOV on the water surface [44]. With a flight altitude of several hundreds of kilometers, D exceeds several tens of meters on the water surface for spaceborne lidars even with a small FOV of many tens of µrad; therefore, the second item in Equation (20) has a weak impact. This is the main reason that, in Equation (18) in Section 2.3, we directly use diffuse attenuation coefficient Kd for ICESat-2 rather than the beam attenuation coefficient c or lidar attenuation coefficient α. In Parrish’s pioneering study [20], Kd was also used to estimate the maximum bathymetric depth for ICESat-2. It should be emphasized that the conclusion is only applicable to a large footprint lidar system (e.g., satellite-based), not to a small footprint lidar system (e.g., airborne-based). By contrast, the footprint diameter of 1 m on the water surface can be expanded to more than 10 m at a 20 m water depth as shown in Figure 12(b2); therefore, increasing the ratio between the FOV and laser divergence is very helpful to receive more energy for ALB systems.

5. Conclusions

The spaceborne photon-counting lidar of ICESat-2 has shown great potential in bathymetry applications. In this study, the water forward-scattering effect on spaceborne photon-counting lidar bathymetry is quantitatively modeled and analyzed. Then, an empirical formula for correcting bathymetric bias due to forward scattering specific to ICESat-2 is derived based on the proposed forward-scattering model. By inputting the environmental parameters (provided by MODIS globally) and system parameters of ICESat-2 into this empirical formula, the scattering-induced bathymetric biases of ICESat-2 can be easily estimated and corrected accordingly. In two different sites (St. Thomas and Hawaii), the model predictions of scattering-induced bathymetric biases generally agree with measured results of ICESat-2 by comparing with local in situ “truth” data.
For ICESat-2, the water forward-scattering-induced bathymetric bias can reach or even exceed several tens of centimeters in deep water (i.e., depth > 20 m), where this error source cannot be ignored. The derived empirical formula can effectively correct the water forward-scattering-induced bathymetric bias for ICESat-2. Specifically, in two study areas, the bathymetric bias (or the mean error) in deep water (>20 m) is corrected from exceeding 50 cm to less than 13 cm, and the corresponding RMSEs are also improved accordingly. In shallow water (<20 m), although the mean errors significantly decrease, the RMSEs do not significantly improve because random errors (e.g., irregular bottom surface) and residual other error sources (e.g., the refraction effect) dominate the total error, and the water forward-scattering-induced bias is relatively weak. As a result, if the maximum water depth of ICESat-2 is larger than 20 m in a study area, it is recommended to correct the water forward-scattering-induced bias. With the help of globally distributed MODIS intrinsic optical parameters and this empirical formula, it is easy to conduct the bathymetric correction for the water forward-scattering-induced bias of ICESat-2.
Additionally, the influence of FOV on satellite and airborne lidar bathymetry is analyzed. A larger FOV effectively increases the received signal level on airborne bathymetric lidars but increases little on satellite lidars. An FOV diameter of a few tens of meters (corresponding to several tens of µrad) is sufficient to receive most of the scattered photons at a water depth of 40 m. Further increasing the FOV of ICESat-2 will greatly increase the background noise level but make little improvement on the signal level. The diffuse attenuation coefficient Kd can be directly used for satellite-based bathymetric lidars. This study is valuable to evaluate and correct the water forward-scattering-induced bias for existing spaceborne photon-counting bathymetric lidars (e.g., for ICESat-2) and also is fundamental to balancing and optimizing the hardware parameters of a possible future photon-counting bathymetric lidar.

Author Contributions

Conceptualization, Y.M. and J.Y.; methodology, J.Y. and Y.M.; software, J.Y. and Y.G.; validation, H.Z. (Huiying Zheng), J.Y., and Y.G.; investigation, J.Y. and H.Z. (Huiying Zheng); data curation, H.Z. (Huiying Zheng); writing—original draft preparation, J.Y. and H.Z. (Huiying Zheng); writing—review and editing, Y.M. and H.Z. (Hui Zhou); supervision, S.L.; project administration, H.Z. (Hui Zhou) and Y.M; funding acquisition, H.Z. (Hui Zhou), S.L., and Y.M. All authors have read and agreed to the published version of the manuscript.

Funding

This research was funded by the National Natural Science Foundation of China, grant number 41971302; Hubei Provincial Key Research and Development Program, China, grant number 2022BID6; and the Shandong Provincial Natural Science Foundation, China, grant number ZR2020MD022.

Data Availability Statement

The ICESat-2 ATL03 product can be downloaded from https://doi.org/10.5067/ATLAS/ATL03.005 (accessed on 1 December 2021); the Sentinel-2 imagery can be downloaded from https://doi.org/10.5066/F76W992G (accessed on 1 December 2021); the MODIS Level 3 standard product can be downloaded from https://doi.org/10.5067/ORBVIEW-2/SEAWIFS/L2/OC/2018 (accessed on 1 December 2021); and the airborne lidar data can be downloaded from https://coast.noaa.gov/dataviewer (accessed on 1 December 2021).

Acknowledgments

We sincerely thank the NASA National Snow and Ice Data Center (NSIDC) for distributing the ICESat-2 data, the NASA Goddard Space Flight Center (GSFC) for distributing the MODIS data, the National Oceanic and Atmospheric Administration (NOAA) for distributing the airborne lidar data, and the European Space Agency (ESA) for distributing the Sentinel-2 imagery.

Conflicts of Interest

The authors declare that there are no conflicts of interest.

References

  1. Gao, J. Bathymetric mapping by means of remote sensing: Methods, accuracy and limitations. Prog. Phys. Geog. 2009, 33, 103–116. [Google Scholar]
  2. Nicholls, R.J.; Cazenave, A. Sea-Level Rise and Its Impact on Coastal Zones. Science 2010, 328, 1517–1520. [Google Scholar] [CrossRef]
  3. Su, D.; Yang, F.; Ma, Y.; Zhang, K.; Huang, J.; Wang, M. Classification of Coral Reefs in the South China Sea by Combining Airborne LiDAR Bathymetry Bottom Waveforms and Bathymetric Features. IEEE Trans. Geosci. Remote. Sens. 2019, 57, 815–828. [Google Scholar] [CrossRef]
  4. Dong, Y.; Liu, Y.; Hu, C.; Xu, B. Coral reef geomorphology of the Spratly Islands: A simple method based on time-series of Landsat-8 multi-band inundation maps. ISPRS J. Photogramm. Remote. Sens. 2019, 157, 137–154. [Google Scholar] [CrossRef]
  5. Ma, Y.; Xu, N.; Sun, J.; Wang, X.H.; Yang, F.; Li, S. Estimating water levels and volumes of lakes dated back to the 1980s using Landsat imagery and photon-counting lidar datasets. Remote. Sens. Environ. 2019, 232, 111287. [Google Scholar] [CrossRef]
  6. Babbel, B.J.; Parrish, C.E.; Magruder, L.A. ICESat-2 Elevation Retrievals in Support of Satellite-Derived Bathymetry for Global Science Applications. Geophys Res Lett. 2021, 48, e2020GL090629. [Google Scholar]
  7. Lee, Z.-P.; Darecki, M.; Carder, K.L.; Davis, C.O.; Stramski, D.; Rhea, W.J. Diffuse attenuation coefficient of downwelling irradiance: An evaluation of remote sensing methods. J. Geophys. Res. Atmos. 2005, 110, C02017. [Google Scholar] [CrossRef]
  8. Barton, J.S.; Jasinski, M.F. Sensitivity of Depth-Integrated Satellite Lidar to Subaqueous Scattering. Remote. Sens. 2011, 3, 1492–1515. [Google Scholar] [CrossRef]
  9. Holman, R.; Haller, M.C. Remote Sensing of the Nearshore. Annu. Rev. Mar. Sci. 2013, 5, 95–113. [Google Scholar] [CrossRef]
  10. Mehdi, G.; Tiit, K.; Abbas, E.S.; Ali, A.; Babak, N. Remotely Sensed Empirical Modeling of Bathymetry in the Southeastern Caspian Sea. Remote Sensing 2013, 5, 2746–2762. [Google Scholar]
  11. Maas, H.-G. On the Accuracy Potential in Underwater/Multimedia Photogrammetry. Sensors 2015, 15, 18140–18152. [Google Scholar] [CrossRef]
  12. Forfinski-Sarkozi, N.A.; Parrish, C.E. Analysis of MABEL Bathymetry in Keweenaw Bay and Implications for ICESat-2 ATLAS. Remote. Sens. 2016, 8, 772. [Google Scholar] [CrossRef]
  13. Yang, F.; Su, D.; Yue, M.; Feng, C.; Yang, A.; Wang, M. Refraction correction of airborne LiDAR bathymetry based on sea surface profile and ray tracing. IEEE Trans. Geosci. Remote Sens. 2017, 55, 6141–6149. [Google Scholar] [CrossRef]
  14. Westfeld, P.; Maas, H.-G.; Richter, K.; Weiß, R. Analysis and correction of ocean wave pattern induced systematic coordinate errors in airborne LiDAR bathymetry. ISPRS J. Photogramm. Remote. Sens. 2017, 128, 314–325. [Google Scholar] [CrossRef]
  15. Mandlburger, G.; Pfennigbauer, M.; Schwarz, R.; Flöry, S.; Nussbaumer, L. Concept and Performance Evaluation of a Novel UAV-Borne Topo-Bathymetric LiDAR Sensor. Remote Sens. 2020, 12, 986. [Google Scholar] [CrossRef]
  16. Pereira, P.; Baptista, P.; Cunha, T.; Silva, P.; Romão, S.; Lafon, V. Estimation of the nearshore bathymetry from high temporal resolution Sentinel-1A C-band SAR data A case study. Remote. Sens. Environ. 2019, 223, 166–178. [Google Scholar] [CrossRef]
  17. Kutser, T.; Hedley, J.; Giardino, C.; Roelfsema, C.; Brando, V.E. Remote sensing of shallow waters A 50 year retrospective and future directions. Remote. Sens. Environ. 2020, 240, 111619. [Google Scholar] [CrossRef]
  18. Ma, Y.; Xu, N.; Liu, Z.; Yang, B.; Yang, F.; Wang, X.H.; Li, S. Satellite-derived bathymetry using the ICESat-2 lidar and Sentinel-2 imagery datasets. Remote. Sens. Environ. 2020, 250, 112047. [Google Scholar] [CrossRef]
  19. Chen, B.; Yang, Y.; Xu, D.; Huang, E. A dual band algorithm for shallow water depth retrieval from high spatial resolution imagery with no ground truth. ISPRS J. Photogramm. Remote. Sens. 2019, 151, 1–13. [Google Scholar] [CrossRef]
  20. Parrish, C.E.; Magruder, L.A.; Neuenschwander, A.L.; Forfinski-Sarkozi, N.; Alonzo, M.; Jasinski, M. Validation of ICESat-2 ATLAS Bathymetry and Analysis of ATLAS’s Bathymetric Mapping Performance. Remote. Sens. 2019, 11, 1634. [Google Scholar] [CrossRef]
  21. Mallet, C.; Bretar, F. Full-waveform topographic lidar: State-of-the-art. ISPRS J. Photogramm. Remote. Sens. 2009, 64, 1–16. [Google Scholar] [CrossRef]
  22. Wang, C.; Li, Q.; Liu, Y.; Wu, G.; Liu, P.; Ding, X. A comparison of waveform processing algorithms for single-wavelength LiDAR bathymetry. ISPRS J. Photogramm. Remote. Sens. 2015, 101, 22–35. [Google Scholar] [CrossRef]
  23. Pan, Z.; Glennie, C.; Hartzell, P.; Fernandez-Diaz, J.C.; Legleiter, C.; Overstreet, B. Performance Assessment of High Res-olution Airborne Full Waveform LiDAR for Shallow River Bathymetry. Remote Sensing 2015, 7, 5133–5159. [Google Scholar]
  24. Forfinski-Sarkozi, N.A.; Parrish, C.E. Active-Passive Spaceborne Data Fusion for Mapping Nearshore Bathymetry. Photogramm. Eng. Remote. Sens. 2019, 85, 281–295. [Google Scholar] [CrossRef]
  25. Li, Y.; Gao, H.; Jasinski, M.F.; Zhang, S.; Stoll, J.D. Deriving High-Resolution Reservoir Bathymetry From ICESat-2 Pro-totype Photon-Counting Lidar and Landsat Imagery. IEEE Trans. Geosci. Remote Sens. 2019, 57, 7883–7893. [Google Scholar]
  26. Armon, M.; Dente, E.; Shmilovitz, Y.; Mushkin, A.; Cohen, T.J.; Morin, E.; Enzel, Y. Determining Bathymetry of Shallow and Ephemeral Desert Lakes Using Satellite Imagery and Altimetry. Geophys. Res. Lett. 2020, 47, e2020GL087367. [Google Scholar] [CrossRef]
  27. Albright, A.; Glennie, C. Nearshore Bathymetry From Fusion of Sentinel-2 and ICESat-2 Observations. IEEE Geosci. Remote. Sens. Lett. 2021, 18, 900–904. [Google Scholar] [CrossRef]
  28. Xu, N.; Ma, Y.; Zhou, H.; Zhang, W.; Zhang, Z.; Wang, X.H. A Method to Derive Bathymetry for Dynamic Water Bodies Using ICESat-2 and GSWD Data Sets. IEEE Geosci. Remote. Sens. Lett. 2020, 19, 1–5. [Google Scholar] [CrossRef]
  29. Thomas, N.; Pertiwi, A.; Traganos, D.; Lagomasino, D.; Poursanidis, D.; Moreno, S.; Fatoyinbo, L. Space-Borne Cloud-Native Satellite-Derived Bathymetry (SDB) Models Using ICESat-2 and Sentinel-2. Geophys. Res. Lett. 2021, 48, e2020GL092170. [Google Scholar] [CrossRef]
  30. Hsu, H.J.; Huang, C.Y.; Jasinski, M.; Li, Y.; Gao, H.; Yamanokuchi, T.; Wang, C.G.; Chang, T.M.; Ren, H.; Kuo, C.Y. A semi-empirical scheme for bathymetric mapping in shallow water by ICESat-2 and Sentinel-2: A case study in the South China Sea. ISPRS J. Photogramm. Remote Sens. 2021, 178, 1–19. [Google Scholar] [CrossRef]
  31. Fassoni-Andrade, A.C.; Durand, F.; Moreira, D.; Azevedo, A.; Fassoni-Andrade, A. Comprehensive bathymetry and in-tertidal topography of the Amazon estuary. Earth Syst. Sci. Data 2021, 13, 2275–2291. [Google Scholar] [CrossRef]
  32. Chen, Y.; Zhu, Z.; Le, Y.; Qiu, Z.; Chen, G.; Wang, L. Refraction correction and coordinate displacement compensation in nearshore bathymetry using ICESat-2 lidar data and remote-sensing images. Opt. Express 2021, 29, 2411–2430. [Google Scholar] [CrossRef]
  33. Cossio, T.; Slatton, K.C.; Carter, W.; Shrestha, K.; Harding, D. Predicting Topographic and Bathymetric Measurement Performance for Low-SNR Airborne Lidar. IEEE Trans. Geosci. Remote. Sens. 2009, 47, 2298–2315. [Google Scholar] [CrossRef]
  34. Eren, F.; Jung, J.; Parrish, C.E.; Sarkozi-Forfinski, N.; Calder, B.R. Total Vertical Uncertainty (TVU) Modeling for Topo-Bathymetric LIDAR Systems. Photogramm. Eng. Remote. Sens. 2019, 85, 585–596. [Google Scholar] [CrossRef]
  35. Su, D.; Yang, F.; Ma, Y.; Wang, X.H.; Yang, A.; Qi, C. Propagated Uncertainty Models Arising From Device, Environment, and Target for a Small Laser Spot Airborne LiDAR Bathymetry and its Verification in the South China Sea. IEEE Trans. Geosci. Remote. Sens. 2020, 58, 3213–3231. [Google Scholar] [CrossRef]
  36. Mobley, C.D.; Sundman, L.K.; Boss, E. Phase function effects on oceanic light fields. Appl. Opt. 2002, 41, 1035–1050. [Google Scholar] [CrossRef]
  37. Guenther, G.C.; Cunningham, A.; LaRocque, P.E.; Reid, D.J. Meeting the accuracy challenge in airborne lidar bathymetry. In Proceedings of the EARSeL-SIG-Workshop LIDAR, Dresden/FRG, EARSeL, Silver Spring, MD, USA, 16–17 June 2000. [Google Scholar]
  38. Philpot, W.; Wozencraft, J. Airborne Laser Hydrography II. In American Geophysical Union, Ocean Sciences Meeting; AGU: New Orleans, Louisiana, USA, 2016. [Google Scholar]
  39. Markus, T.; Neumann, T.; Martino, A.; Abdalati, W.; Brunt, K.; Csatho, B.; Farrell, S.; Fricker, H.; Gardner, A.; Harding, D.; et al. The Ice, Cloud, and land Elevation Satellite-2 (ICESat-2): Science requirements, concept, and implementation. Remote Sens. Environ. 2017, 190, 260–273. [Google Scholar] [CrossRef]
  40. Martino, A.J.; Neumann, T.A.; Kurtz, N.T.; McLennan, D. ICESat-2 mission overview and early performance. In Proceedings of the Sensors, Systems, and Next-Generation Satellites XXIII, Strasbourg, France, 9–12 September 2019; p. 111510C. [Google Scholar]
  41. Guenther, G.C. Airborne Laser Hydrography System Design and Performance Factors. In NOAA Professional Paper Series; Nat. Ocean Service 1, Nat. Oceanic Atmos. Admin.; U.S. Dept. Commerce: Washington, DC, USA, 1985; pp. 1–385. Available online: https://repository.library.noaa.gov/view/noaa/2811/noaa_2811_DS1.pdf (accessed on 1 December 2021).
  42. Cox, W.; Muth, J. Simulating channel losses in an underwater optical communication system. J. Opt. Soc. Am. A 2014, 31, 920–934. [Google Scholar] [CrossRef]
  43. Sahu, S.K.; Shanmugam, P. A theoretical study on the impact of particle scattering on the channel characteristics of un-derwater optical communication system. Opt. Commun. 2018, 408, 3–14. [Google Scholar] [CrossRef]
  44. Gordon, H.R. Interpretation of airborne oceanic lidar: Effects of multiple scattering. Appl. Opt. 1982, 21, 2996–3001. [Google Scholar] [CrossRef]
  45. Punjabi, A.; Venable, D.D. Effects of multiple scattering on time- and depth-resolved signals in airborne lidar systems. Int. J. Remote. Sens. 1986, 7, 615–626. [Google Scholar] [CrossRef]
  46. Duda, D.P.; Spinhirne, J.D.; Eloranta, E.W. Atmospheric multiple scattering effects on GLAS altimetry. I. calculations of single pulse bias. IEEE Trans. Geosci. Remote Sens. 2001, 39, 92–101. [Google Scholar]
  47. Mahesh, A.; Spinhirne, J.; Duda, D.; Eloranta, E. Atmospheric multiple scattering effects on GLAS altimetry. II. Analysis of expected errors in Antarctic altitude measurements. IEEE Trans. Geosci. Remote. Sens. 2002, 40, 2353–2362. [Google Scholar] [CrossRef]
  48. Schwarz, R.; Pfeifer, N.; Pfennigbauer, M.; Mandlburger, G. Depth Measurement Bias in Pulsed Airborne Laser Hydrog-raphy Induced by Chromatic Dispersion. IEEE Geosci. Remote Sens Lett. 2021, 18, 1332–1336. [Google Scholar] [CrossRef]
  49. Abdallah, H.; Baghdadi, N.; Bailly, J.; Pastol, Y.; Fabre, F. Wa-LiD: A new lidar simulator for waters. IEEE Geosci. Remote Sens. Lett. 2012, 9, 744–748. [Google Scholar] [CrossRef]
  50. Sahu, S.K.; Shanmugam, P. Scattering phase function for particulates-in-water: Modeling and validation. Remote Sens. Model. Atmos. Ocean. Interact. VI 2016, 9882, 98821. [Google Scholar] [CrossRef]
  51. Zhou, Y.; Chen, W.; Cui, X.; Malinka, A.; Liu, Q.; Han, B.; Wang, X.; Zhuo, W.; Che, H.; Song, Q.; et al. Validation of the Analytical Model of Oceanic Lidar Returns: Comparisons with Monte Carlo Simulations and Experimental Results. Remote. Sens. 2019, 11, 1870. [Google Scholar] [CrossRef]
  52. Liu, Q.; Cui, X.; Jamet, C.; Zhu, X.; Mao, Z.; Chen, P.; Bai, J.; Liu, D. A Semianalytic Monte Carlo Simulator for Spaceborne Oceanic Lidar: Framework and Preliminary Results. Remote. Sens. 2020, 12, 2820. [Google Scholar] [CrossRef]
  53. Chen, P.; Jamet, C.; Mao, Z.; Pan, D. OLE: A Novel Oceanic Lidar Emulator. IEEE Trans. Geosci. Remote. Sens. 2021, 59, 9730–9744. [Google Scholar] [CrossRef]
  54. Yin, T.; Lauret, N.; Gastellu-Etchegorry, J.-P. Simulation of satellite, airborne and terrestrial LiDAR with DART (II): ALS and TLS multi-pulse acquisitions, photon counting, and solar noise. Remote. Sens. Environ. 2016, 184, 454–468. [Google Scholar] [CrossRef]
  55. Yang, X.; Wang, Y.; Yin, T.; Wang, C.; Lauret, N.; Regaieg, O.; Xi, X.; Gastellu-Etchegorry, P. Comprehensive LiDAR simulation with efficient physically-based DART-Lux model (I): Theory, novelty, and consistency validation. Remote Sens. Environ. 2022, 272, 112952. [Google Scholar]
  56. Werdell, P.J.; Franz, B.A.; Bailey, S.W.; Feldman, G.C.; Boss, E.; Brando, V.E.; Dowell, M.; Hirata, T.; Lavender, S.J.; Lee, Z.; et al. Generalized ocean color inversion model for retrieving marine inherent optical properties. Appl. Opt. 2013, 52, 2019–2037. [Google Scholar] [CrossRef]
  57. Eugene, H. Optics, 5th ed.; Pearson: New York, NY, USA, 2016. [Google Scholar]
  58. Sophocles, J. Orfanidis, Electromagnetic Waves and Antennas. 2016. Available online: http://eceweb1.rutgers.edu/~orfanidi/ewa/ewa-1up.pdf (accessed on 1 December 2021).
  59. Poole, L.R.; Venable, D.D.; Campbell, J.W. Semianalytic Monte Carlo radiative transfer model for oceanographic lidar systems. Appl. Opt. 1981, 20, 3653–3656. [Google Scholar] [CrossRef]
  60. Petzold, T.J. Volume Scattering Functions for Selected Ocean Waters. In Proceedings of the Scripps Institution of Oceanography La Jolla Ca Visibility Lab, Naval Air Development Center, Warminster, PA, USA, 1 October 1972. [Google Scholar]
  61. Yang, J.; Ma, Y.; Li, S.; Liu, X.; Zhang, W.; Zhang, Z. Theoretical model considering optimal ranging performance and energy efficiency for photon-counting lidars with multiple detectors. Appl. Opt. 2021, 60, 8838–8850. [Google Scholar] [CrossRef]
  62. Zhang, W.; Xu, N.; Ma, Y.; Yang, B.; Zhang, Z.; Wang, X.H.; Li, S. A maximum bathymetric depth model to simulate satellite photon-counting lidar performance. ISPRS J. Photogramm. Remote. Sens. 2021, 174, 182–197. [Google Scholar] [CrossRef]
  63. Gardner, C.S. Target signatures for laser altimeters: An analysis. Appl. Opt. 1982, 21, 448–453. [Google Scholar] [CrossRef]
  64. Tsai, B.M.; Gardner, C.S. Remote sensing of sea state using laser altimeters. Appl. Opt. 1982, 21, 3932–3940. [Google Scholar] [CrossRef]
  65. Fournier, G.R.; Forand, J.L. Analytic phase function for ocean water. In Ocean Optics XII; International Society for Optics and Photonics: Bellingham, WA, USA, 1994; Volume 2258, pp. 194–201. [Google Scholar]
  66. Fournier, G.R.; Jonasz, M. Computer-based underwater imaging analysis. In Airborne and In-Water Underwater Imaging; SPIE: Bellingham, DC, USA, 1999; pp. 62–71. [Google Scholar]
  67. Lyzenga, D.R. Passive remote sensing techniques for mapping water depth and bottom features. Appl. Opt. 1978, 17, 379–383. [Google Scholar] [CrossRef]
  68. Mobley, C.; Boss, E.; Roesler, C. Ocean Optics Web book. 2021. Available online: https://oceanopticsbook.info/ (accessed on 1 December 2021).
  69. Rubinstein, R.Y.; Kroese, D.P. Simulation and the Monte Carlo Method; John Wiley & Sons, Inc.: Hoboken, NJ, USA, 2016. [Google Scholar]
  70. Mobley, C.D. Light and Water: Radiative Transfer in Natural Waters; Academic Press: Cambridge, MA, USA, 1994. [Google Scholar]
  71. Feygels, V.I.; Kopilevich, Y.; Park, J.Y.; Kim, M.; Aitken, J. Particularities of hydro lidar missions in the Asia-Pacific region. In Lidar Remote Sensing for Environmental Monitoring; SPIE: Bellingham, DC, USA, 2014; pp. 62–70. [Google Scholar]
  72. Wang, J.; Myers, E.; Jeong, I.; White, S. VDatum for the Coastal Waters of Puerto Rico and the U. S. Virgin Islands: Tidal Datums, Marine Grid, and Sea Surface Topography; NOAA Technical Memorandum NOS CS 33: Silver Spring, MD, USA, 2013. [Google Scholar]
  73. Wright, C.W.; Kranenburg, C.; Battista, T.A.; Parrish, C. Depth Calibration and Validation of the Experimental Advanced Airborne Research Lidar, EAARL-B. J. Coast. Res. 2016, 76, 4–17. [Google Scholar] [CrossRef]
  74. Feygels, V.I.; Park, J.Y.; Wozencraft, J.; Aitken, J.; Macon, C.; Mathur, A.; Payment, A.; Ramnath, V. CZMIL (coastal zone mapping and imaging lidar): From first flights to first mission through system validation. In Ocean Sensing and Monitoring V; SPIE: Bellingham, DC, USA, 2013; Volume 8724. [Google Scholar] [CrossRef]
  75. Neumann, T.; Brenner, A.; Hancock, D.; Robbins, J.; Saba, J.; Harbeck, K.; Gibbons, A.; Lee, J.; Luthcke, S.B.; Rebold, T. AT-LAS/ICESat-2 L2A Global Geolocated Photon Data, Version 4; NASA National Snow and Ice Data Center Distributed Active Archive Center: Boulder, CO, USA, 2021; Available online: https://nsidc.org/sites/default/files/atl03-v004-userguide_1.pdf (accessed on 1 December 2021).
  76. Neumann, T.; Brenner, A.; Hancock, D.; Luthcke, S.; Lee, J.; Robbins, J.; Harbeck, K.; Bae, S.; Brunt, K.; Gibbons, A.; et al. Ice, Cloud, and Land Elevation Satellite—2 (ICESat-2) Project, Algorithm Theoretical Basis Document (ATBD) for Global Geolocated Photons ATL03; Goddard Space Flight Center: Greenbelt, MD, USA, 2019. [Google Scholar]
  77. Tian, X.; Shan, J. Comprehensive Evaluation of the ICESat-2 ATL08 Terrain Product. IEEE Trans. Geosci. Remote. Sens. 2021, 59, 8195–8209. [Google Scholar] [CrossRef]
  78. Feygels, V.I.; Wright, C.W.; Kopilevich, Y.I.; Surkov, A.I. Narrow-field-of-view bathymetrical lidar: Theory and field test. In Ocean Remote Sensing and Imaging II; SPIE: Bellingham, DC, USA, 2003. [Google Scholar]
  79. Feygels, V.I.; Park, J.Y.; Aitken, J.; Kim, M.; Payment, A.; Ramnath, V. Coastal Zone Mapping and Imaging Lidar (CZMIL): First flights and system validation. In Remote Sensing of the Ocean, Sea Ice, Coastal Waters, and Large Water Regions; SPIE: Bellingham, DC, USA, 2012; 85321C–85321C-10. [Google Scholar] [CrossRef]
  80. Schutz, B.E.; Zwally, H.J.; Shuman, C.A.; Hancock, D.; DiMarzio, J.P. Overview of the ICESat Mission. Geophys. Res. Lett. 2005, 32, L21S01. [Google Scholar] [CrossRef]
  81. Churnside, J.H. Review of profiling oceanographic lidar. Opt. Eng. 2013, 53, 051405. [Google Scholar] [CrossRef] [Green Version]
Figure 1. Schematic diagram of the influence of the water forward scattering in lidar bathymetry. θp is the incident laser nadir angle on the water surface from the lidar; θs is the zenith angle of photon packets leaving the water surface back to the lidar; θ0 is the laser nadir angle entering the water column; and (xi, yi, zi) are the photon packet coordinates after the i-th interaction with particles. Note that only the photon packets whose coordinates are within the field of view (FOV) can be received by the lidar telescope. ΔD is the bathymetric bias due to the water forward-scattering effect, i.e., the length difference between the broken lines of the laser path with scattering and the straight line without scattering.
Remotesensing 15 00931 g001
Figure 2. Flow chart of semi-analytic Monte Carlo simulation for water forward scattering in lidar bathymetry.
Remotesensing 15 00931 g002
Figure 3. Bathymetric bias due to the forward scattering fse(bb, h) of ICESat-2 with total backscattering coefficients and different depths. (a) Black points correspond to the simulated results, which are used to fit the nine parameters in Equation (17). The fitted surface is then drawn by inputting the nine fitted parameters into Equation (17). (b) fse(bb, h) contours of the fitted surface in units of meters. The red curve represents the estimated maximum bathymetric depth of ICESat-2 and the upper right area is generally not measurable for ICESat-2.
Remotesensing 15 00931 g003
Figure 4. (a) Locations of the two study areas used to verify the water forward-scattering bias model. (b) ICESat-2 ground tracks at St. Thomas island. (c,d) ICESat-2 ground tracks at Hawaii. In all image subfigures (from Sentinel-2 images), green lines represent the ICESat-2 tracks.
Remotesensing 15 00931 g004
Figure 5. Four ICESat-2 ground tracks in enlarged Sentinel-2 images and their corresponding along-track geolocated photons from ICESat-2 ATL03 products in two study areas. (a,b) correspond to St. Thomas, whereas (c,d) correspond to Hawaii. In all image subfigures, green lines represent the ICESat-2 ground tracks. In all subfigures containing ATL03 raw geolocated photons, the x-axis denotes the relative along-track distance of the ICESat-2 ground track, and the y-axis is the WGS84 ellipsoidal height in meters.
Remotesensing 15 00931 g005
Figure 6. ICESat-2 along-track signal points after bathymetric corrections (not including the forward-scattering correction) in two study areas. (a,b) correspond to St. Thomas, whereas (c,d) correspond to Hawaii. Note that the ICESat-2 points have been converted to VIVD09 orthometric heights (at St. Thomas) or LMSL heights (at Hawaii), which are identical to the local in situ data. The height values of ICESat-2 water surface points are close to 0 m in orthometric heights.
Remotesensing 15 00931 g006
Figure 7. Comparisons between ICESat-2 along-track bathymetric points and truth profiles (calculated from local in situ measurements) at St. Thomas. Two left subfigures (a1,b1) correspond to ICESat-2 points without water forward-scattering corrections, whereas (a2,b2) correspond to that with scattering corrections. It should be noted that all height values are in VIVD09 orthometric heights.
Remotesensing 15 00931 g007
Figure 8. Comparisons between ICESat-2-derived depths and their corresponding truth values under the vertical datum of water depths at St. Thomas island. Two left subfigures (a1,b1) correspond to ICESat-2 points without water forward-scattering corrections, whereas (a2,b2) correspond to that with scattering corrections.
Remotesensing 15 00931 g008
Figure 9. Comparisons between ICESat-2 along-track bathymetric points and truth profiles (calculated from local in situ measurements) at Hawaii. Two left subfigures (a1,b1) correspond to ICESat-2 points without water forward-scattering corrections, whereas (a2,b2) correspond to those with scattering corrections. It should be noted that all height values are in LMSL orthometric heights.
Remotesensing 15 00931 g009
Figure 10. Comparisons between ICESat-2-derived depths and their corresponding truth values under the vertical datum of water depths at Hawaii. Two left subfigures (a1,b1) correspond to ICESat-2 points without water forward-scattering corrections, whereas (a2,b2) correspond to that with scattering corrections.
Remotesensing 15 00931 g010
Figure 11. Relationship between water scattering-induced biases and water depths of four tracks. Blue curves are estimated by intrinsic optical parameters of local water and the empirical formula for ICESat-2, and red asterisks are the experimental mean errors in Table 3 and Table 4. (a,b) correspond to St. Thomas, whereas (c,d) correspond to Hawaii.
Remotesensing 15 00931 g011
Figure 12. Normalized energy distributions at the seafloor with different laser footprints on the water surface and water depths. The yellow dotted circles contain 87.5% of the total laser energy (i.e., 2 sigma), and the red dotted circles represent a 42 m diameter of FOV on the water surface (i.e., ICESat-2 has an 83.5 µrad FOV and a flight altitude of approximately 500 km). In (a1a4), the 12 m diameter of laser footprints on the water surface corresponds to ICESat-2 (which has an approximately 24 µrad laser divergence). In (b1b4), the 1 m diameter is a typical laser footprint for ALB systems.
Remotesensing 15 00931 g012
Table 1. System parameters of ICESat-2 used in this study [39,40].
ParameterValueParameterValue
Field of view 2θr83.5 µradLaser nadir angle θp~0.38°
Laser divergence 2θt24 µradFlight altitude Rh500 km
Table 2. Information of ICESat-2 tracks and intrinsic optical parameters of local water from MODIS data.
Result FiguresSiteGeographical LocationDate a (m−1)bb (m−1)
Figure 5a, Figure 6a, Figure 7a, Figure 8a and Figure 11aSt. Thomas Island 1[18.29°N, 64.98°W]2018/11/220.05010.00244
Figure 5b, Figure 6b, Figure 7b, Figure 8b and Figure 11bSt. Thomas Island 2[18.29°N, 64.92°W]2019/12/150.05030.00255
Figure 5c, Figure 6c, Figure 7c, Figure 8c and Figure 11cHawaii Island 3[21.50°N, 158.23°W]2019/04/160.04510.00181
Figure 5d, Figure 6d, Figure 7d, Figure 8d and Figure 11dHawaii Island 4[21.35°N, 158.67°W]2019/06/090.04470.00197
1 corresponds to the ATL03 dataset (ATL03_20181122060325_08340107, GT3R); 2 corresponds to the ATL03 dataset (ATL03_20191215232113_12230501, GT2R); 3 corresponds to the ATL03 dataset (ATL03_20190416052049_02740307, GT3L); 4 corresponds to the ATL03 dataset (ATL03_20190609143524_11050301, GT1L).
Table 3. Statistics of orthometric height differences between ICESat-2 points and their corresponding truth values before and after water forward-scattering corrections at St. Thomas island. The mean errors (MEs) are the orthometric height differences between ICESat-2 and in situ data, i.e., a minus value means that the orthometric height of an ICESat-2 bathymetric point is underestimated or the water depth is overestimated.
TracksParametersWater Depths (m)
0~55~1010~1515~2020~2525~3030~35>20All
St. Thomas 1Number of ICESat-2 Points44600111319127249706
MEs (m)Uncorrected−0.02NaNNaN−0.48−0.49−0.73−0.75−0.61−0.23
Corrected−0.01NaNNaN−0.13−0.07−0.100.00−0.07−0.03
RMSEs (m)Uncorrected0.17NaNNaN0.520.530.780.840.670.43
Corrected0.17NaNNaN0.230.210.290.370.260.21
St. Thomas 2Number of ICESat-2 Points411514373857631192500
MEs (m)Uncorrected0.00−0.08−0.35−0.29−0.53−0.60−0.76−0.60−0.33
Corrected0.03−0.01−0.140.04−0.060.010.01−0.02−0.01
RMSEs (m)Uncorrected0.480.380.530.390.660.780.910.750.57
Corrected0.480.360.400.270.390.480.470.440.40
Table 4. Statistics of orthometric height differences between ICESat-2 points and their corresponding truth values before and after water forward-scattering corrections at Hawaii.
TracksParametersWater Depths (m)
0~55~1010~1515~2020~2525~3030~35>20All
Hawaii 3Number of ICESat-2 Points3431912168343910832362
MEs (m)Uncorrected−0.06−0.06−0.30−0.28−0.58−0.52−0.60−0.56−0.08
Corrected−0.03−0.02−0.19−0.01−0.22−0.04−0.03−0.11−0.02
RMSEs (m)Uncorrected0.390.430.610.410.640.690.730.670.44
Corrected0.390.420.570.290.350.430.420.400.42
Hawaii 4Number of ICESat-2 Points2043513684491772602031575
MEs (m)Uncorrected−0.02−0.15−0.28−0.35−0.49−0.51NaN−0.49−0.26
Corrected−0.01−0.09−0.14−0.09−0.15−0.06NaN−0.13−0.09
RMSEs (m)Uncorrected0.440.380.440.490.600.62NaN0.610.49
Corrected0.440.360.350.360.360.34NaN0.360.38
Disclaimer/Publisher’s Note: The statements, opinions and data contained in all publications are solely those of the individual author(s) and contributor(s) and not of MDPI and/or the editor(s). MDPI and/or the editor(s) disclaim responsibility for any injury to people or property resulting from any ideas, methods, instructions or products referred to in the content.