Article

The Potential of Monitoring Carbon Dioxide Emission in a Geostationary View with the GIIRS Meteorological Hyperspectral Infrared Sounder

1
Space Science and Engineering Center, University of Wisconsin-Madison, 1225 W. Dayton St., Madison, WI 53706, USA
2
School of Environment, Nanjing Normal University, Nanjing 210023, China
*
Author to whom correspondence should be addressed.
Remote Sens. 2023, 15(4), 886; https://doi.org/10.3390/rs15040886
Submission received: 1 January 2023 / Revised: 26 January 2023 / Accepted: 2 February 2023 / Published: 5 February 2023
(This article belongs to the Special Issue Advances in Infrared Observation of Earth’s Atmosphere II)

Abstract

:
With the help of various polar-orbiting environment observing platforms, the atmospheric concentration of carbon dioxide (CO2) has been well established on a global scale. However, the spatial and temporal pattern of the CO2 emission and its flux dependence on daily human activity processes are not yet well understood. One of the limiting factors could be attributed to the low revisit time frequency of the polar orbiting satellites. With high revisiting frequency and CO2-sensitive spectrum, the Geostationary Interferometric Infrared Sounder (GIIRS) onboard the Chinese FY-4A and FY-4B satellites have the potential to measure the CO2 concentration at a higher temporal frequency than polar-orbiting satellites. To provide a prototypical demonstration on the CO2 monitoring capability using GIIRS observations, a hybrid-3D variational data assimilation system is established in this research and a one-month-long experiment is conducted. The evaluations against the Goddard Earth Observing System version 5 (GEOS-5) analysis field and Orbiting Carbon Observatory -2/-3 (OCO-2/-3) CO2 retrieval products reveal that assimilating GIIRS observations can reduce the first guess’s CO2 concentration mean bias and standard deviation, especially over the lower troposphere (975–750 hPa) and improve the diurnal variation of near surface CO2 concentration.

1. Introduction

The global-scale atmospheric carbon dioxide (CO2) concentration has been monitored through ground observation networks, e.g., the World Data Centre for Greenhouse Gases (WDCGG) [1] and Total Carbon Column Observing Network (TCCON) [2], for a long time, which provides a fundamental contribution on revealing the fundamental climatological impact from Green House Gases (GHG). However, the spatial and temporal uncertainties from underlying processes, e.g., the diurnal flux variation caused by human activities and international transportation, are not yet well quantified [3,4].
Observation from space holds immense potential to settle the pre-existing ground-based network’s spatial coverage problem. The Greenhouse gas Observing Satellite (GOSAT) and Greenhouse gas Observing Satellite-2 (GOSAT-2), launched in 2009 and 2018, can monitor the atmospheric CO2 concentration from the Thermal and Near infrared Sensor for carbon Observations-Fourier Transform Spectrometer (TANSO-FTS) with a 10.5 km horizontal resolution [5]. The OCO-2 and OCO-3, launched in 2014 and 2019, monitors the CO2 concentration at high spatial resolution (1.29 km cross-track, 2.25 km along-track) with the grating spectrometer [6,7]. The meteorological hyperspectral infrared sounders, designed for high-vertical-resolution temperature and water vapor profiles, are also capable of measuring variations in carbon trace gasses such as CO2, e.g., Atmospheric Infrared Sounder (AIRS) [8,9,10,11], Infrared Atmospheric Sounding Interferometer (IASI) [12,13,14], Cross-track Infrared Sounder (CrIS) [15,16,17], and Infrared Fourier Spectrometer-2 (IKFS-2) [18].
Recently, the need for CO2 concentration observation with a much higher spatiotemporal resolution has led us to the Geostationary Carbon Cycle Observatory (GeoCarb), which will deliver CO2 concentration observation on (at least) a daily basis at fine (10 km) spatial scales over the Americas [19]. Meanwhile, such demand also gives rise to investigations on exploiting the meteorological geostationary hyperspectral infrared sounder’s CO2 concentration monitoring capability, e.g., GIIRS [20], Meteosat Third Generation–InfraRed Sounder (MTG-IRS) [21], and Geostationary Extended Observations (GeoXO) Hyperspectral InfraRed Sounder [22]. In addition to CO2 monitoring, observations from geostationary hyperspectral infrared sounders have been used in estimating other trace gas emissions, e.g., ammonia [23,24].
This paper demonstrates the geostationary hyperspectral infrared sounder’s capability to provide CO2 monitoring products with reasonable spatial, but much higher temporal, resolution by generating a one-month-long (from 1 August 2022 to 1 September 2022) CO2 profile dataset at 16 km horizontal and 3 h temporal resolution. Section 2 describes the basics of the CO2 data assimilation system and the usage of GIIRS observation. Section 3 presents results and relevant error statistics. Section 4 is the summary.

2. Materials and Methods

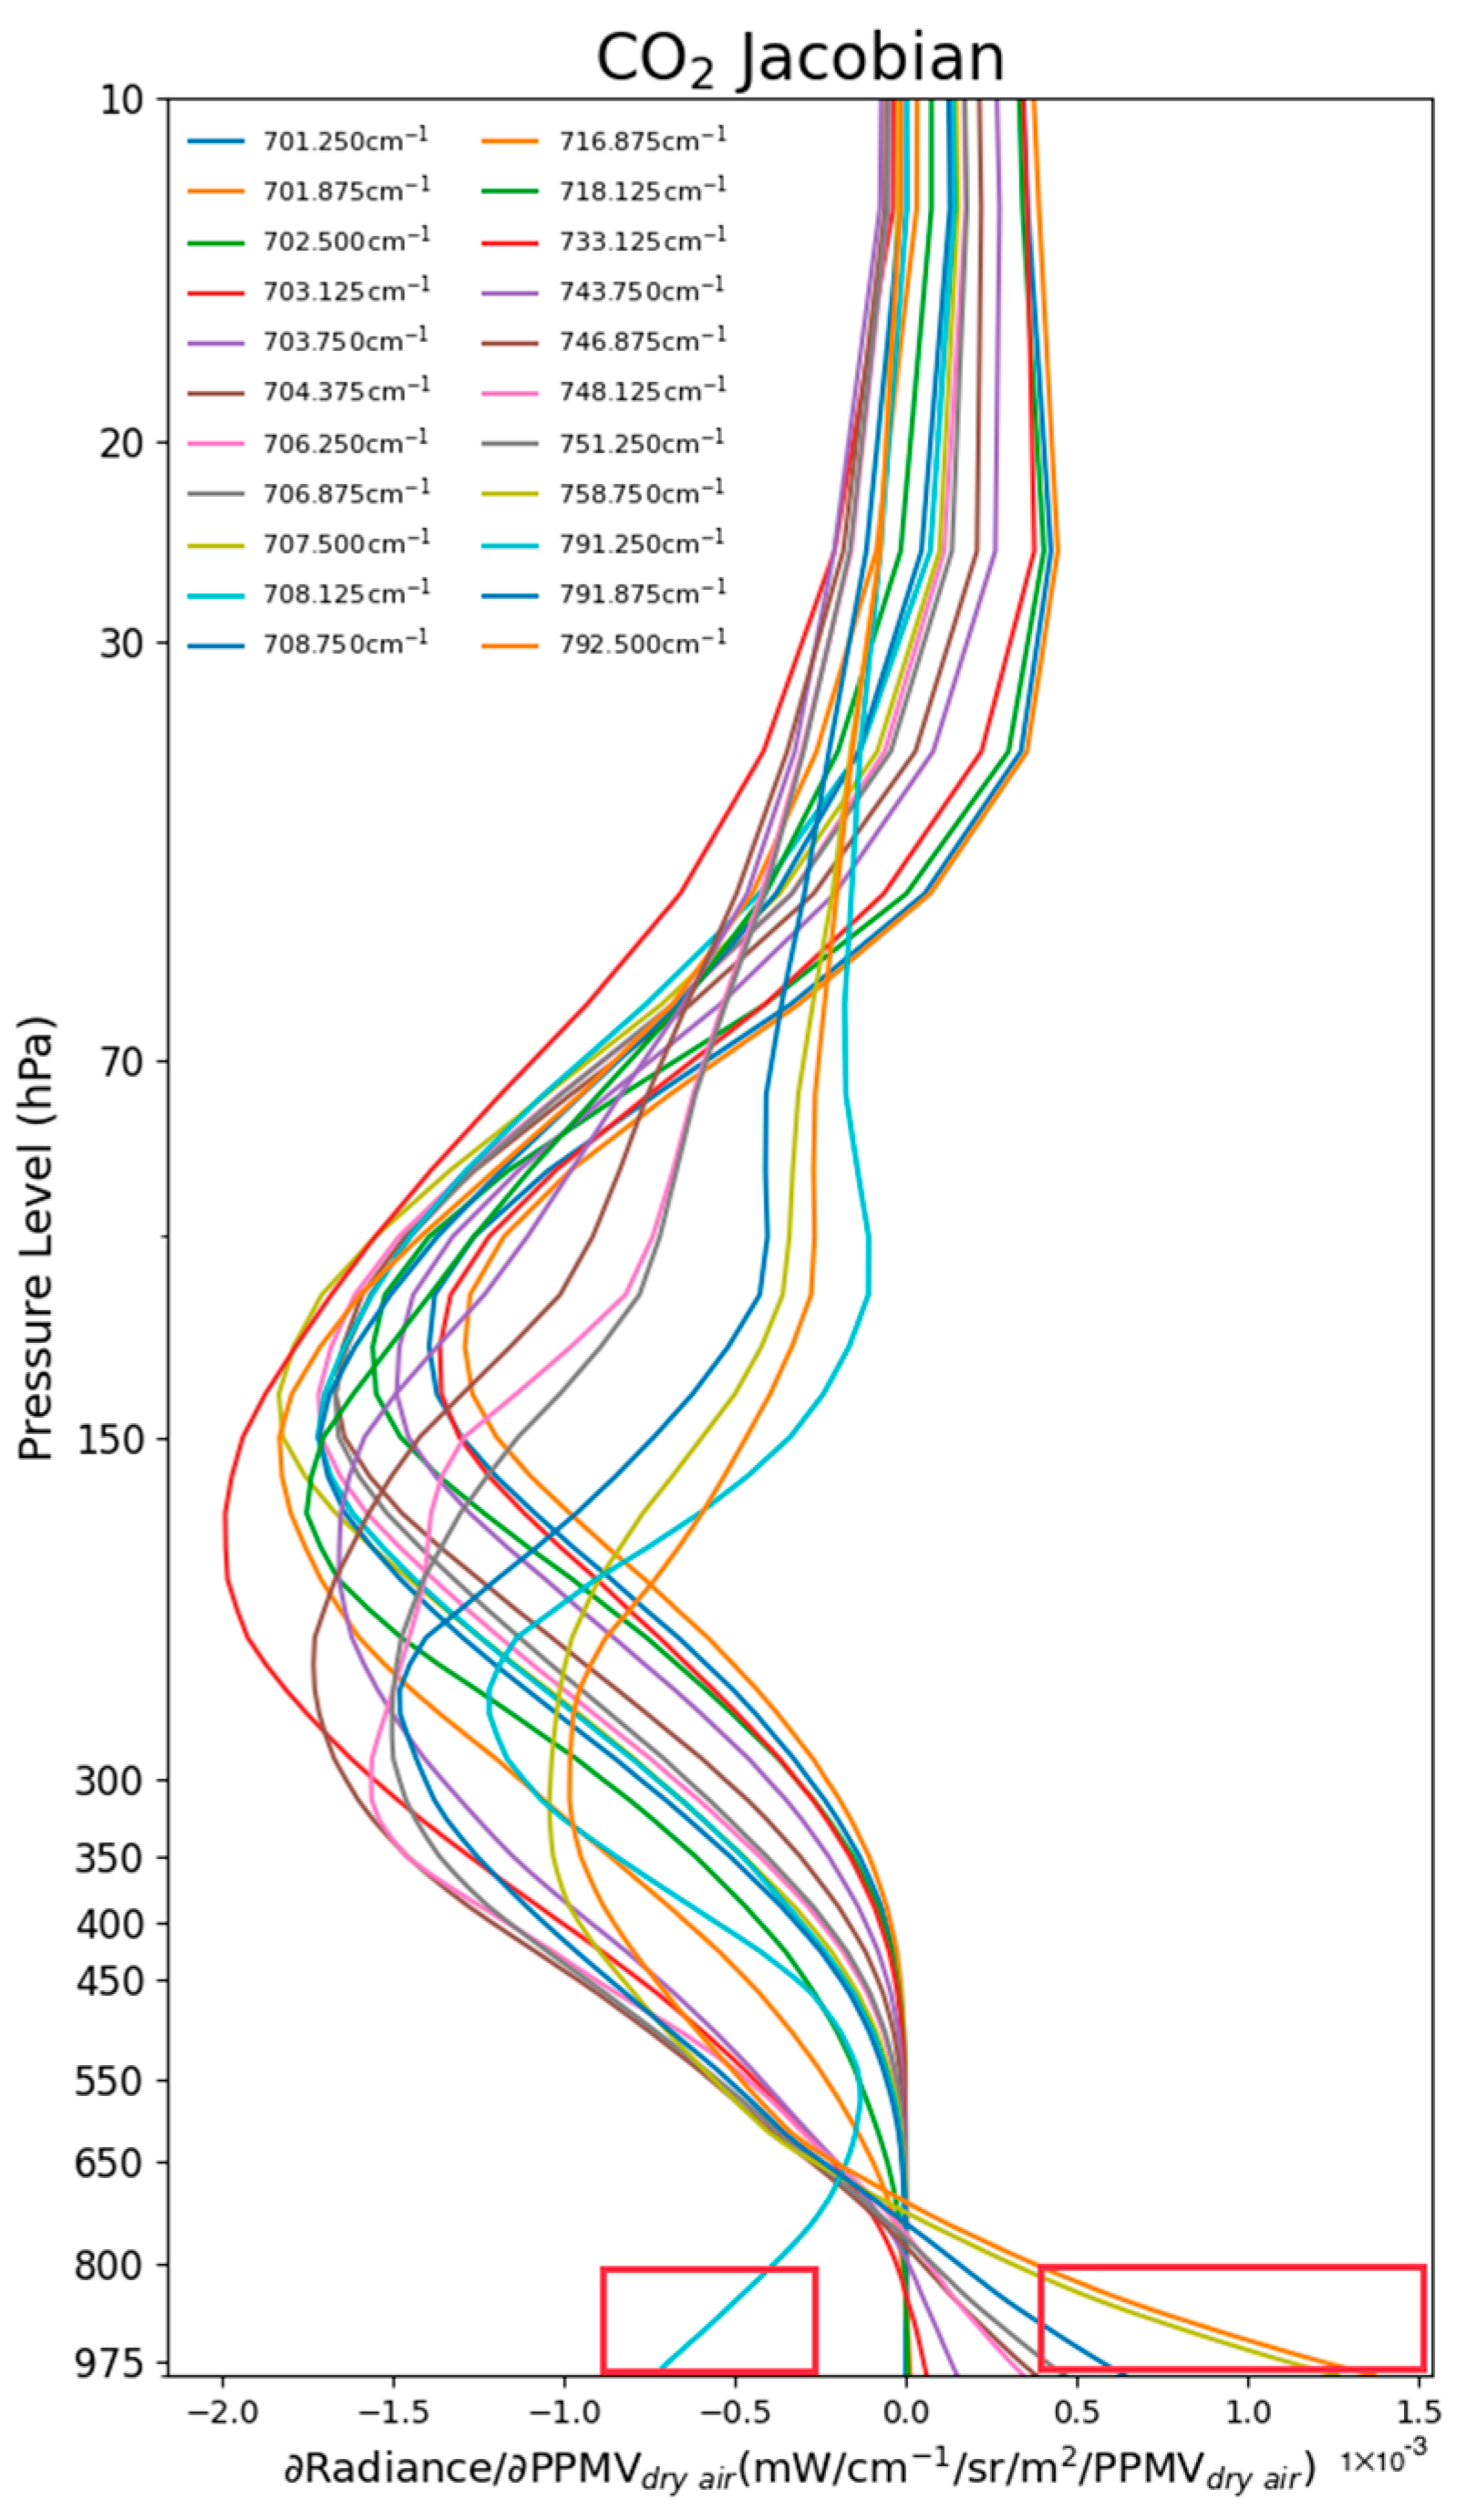
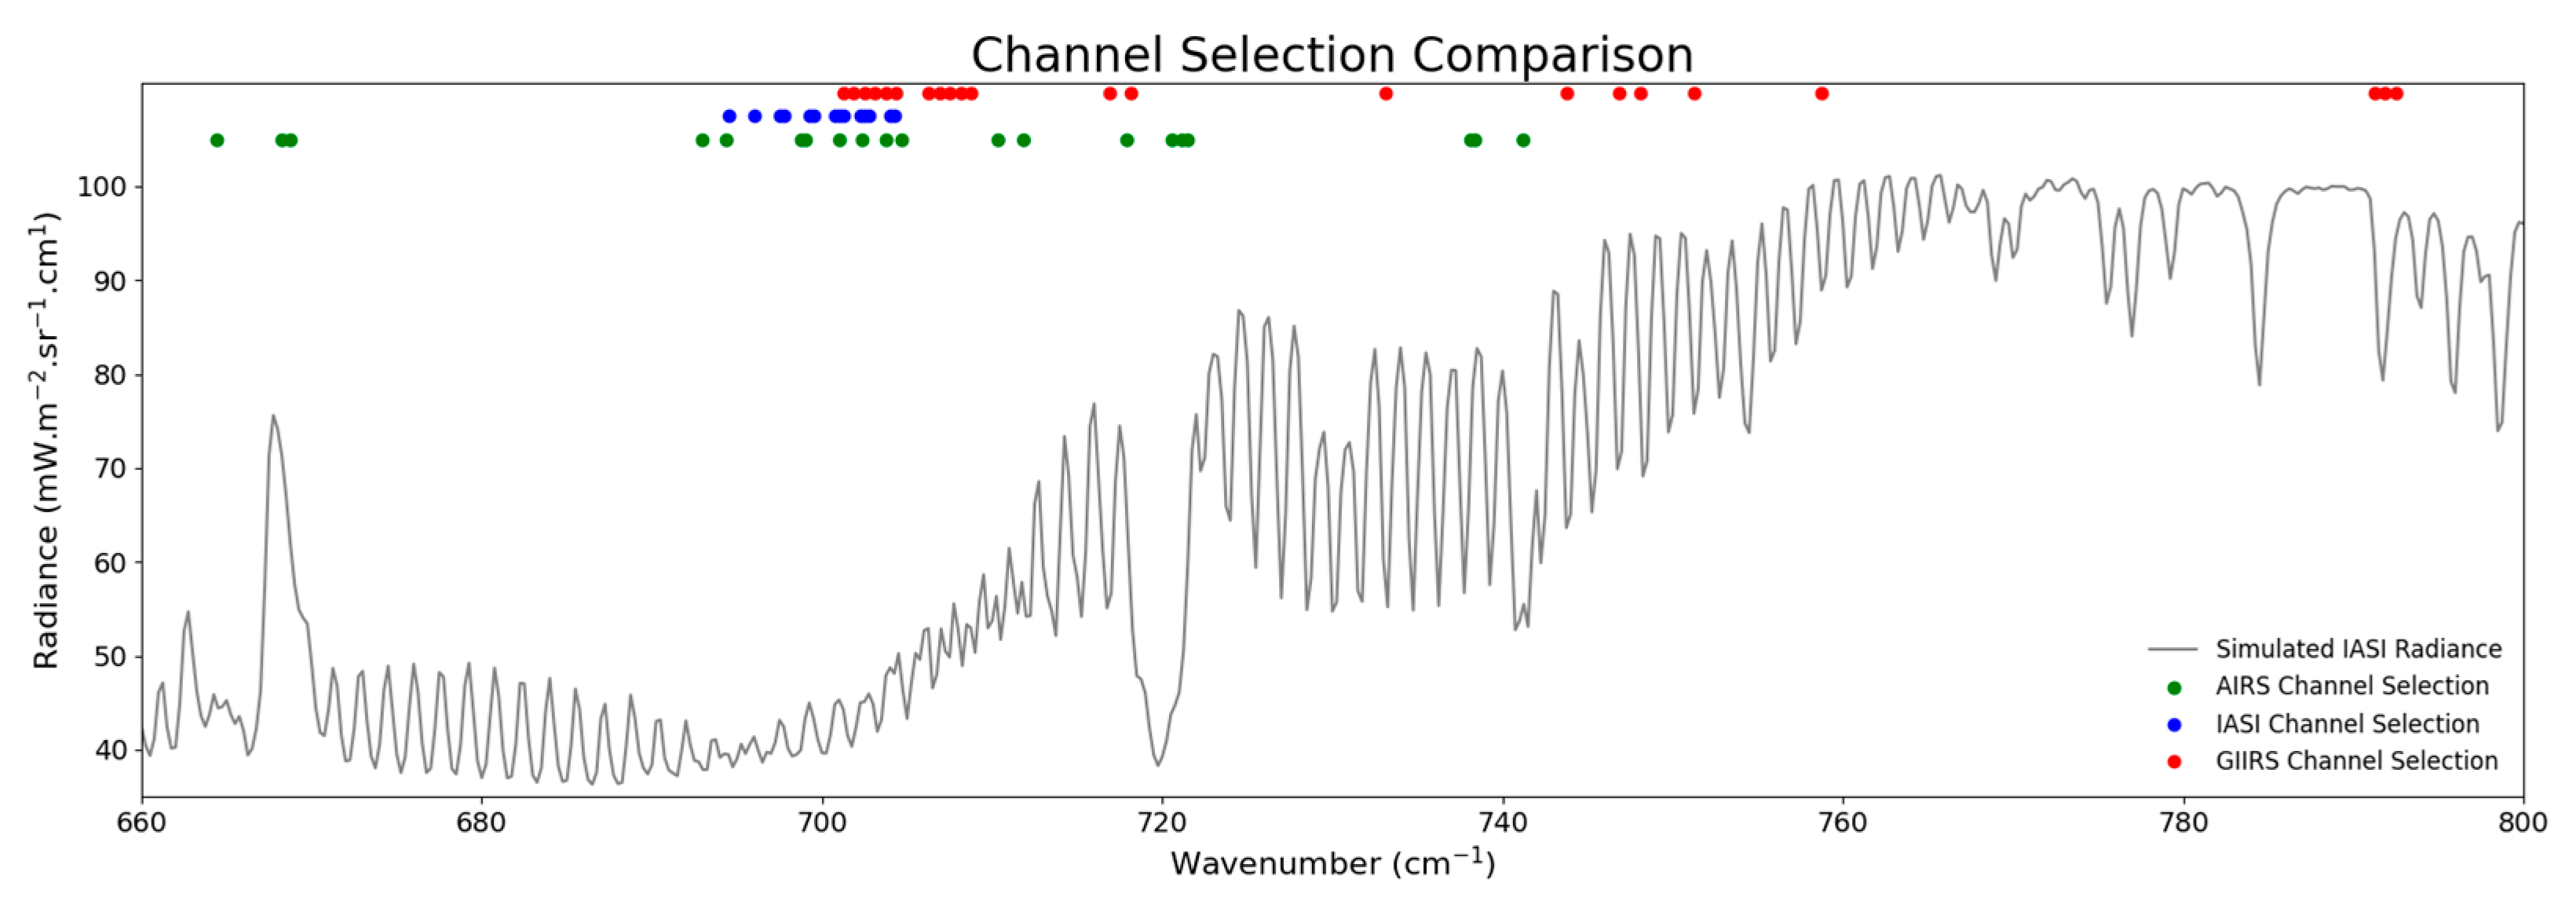
The GIIRS onboard the Chinese FY-4A and FY-4B satellites (data available at https://satellite.nsmc.org.cn/portalsite/ (accessed on 31 December 2022)) can measure the CO2 concentration with scanning frequencies of ten times per day (at 0, 2, 4, 6, 8, 10, 12, 14, 20, and 22 h UTC) and a spectrum sampling rate of 0.625 cm−1. To avoid interference from other trace gases and retain CO2 information content, we selected 22 spectral channels with CO2 (other trace gases) absorbance higher (lower) than 0.6 (0.3) within the long-wave IR band (700–1130 cm−1) (Figure 1a). The absorbance dataset in this study comes from the HIRTRAN 2020 dataset (available at https://hitran.org (accessed on 31 December 2022)). For further validation of this channel selection scheme, we calculated the CO2 Jacobian for each selected channel using the European Organization for the Exploitation of Meteorological Satellites (EUMETSAT) 60-level sample profile dataset from the Monitoring Atmospheric Composition and Climate (MACC) project (available at https://nwp-saf.eumetsat.int/site/download/profile_datasets/60l_macc.dat.tar.bz2 (accessed on 31 December 2022)). The Jacobian peak pressure level (Figure 2) indicates that the CO2 information content from the selected spectrum mostly stays below 100 hPa, and the last six spectral channels (central wavenumber larger than 751.250 cm−1) can modify the low-troposphere CO2 concentration. Even though there are extra absorption channels located within the GIIRS mid-wave IR channel (1650–2250 cm−1) (Figure 1b), due to their low sensitivity (compared to selected long-wave IR spectrum) to CO2, these spectral observations are not used in this study. The channel selection differences among GIIRS, AIRS, and IASI [8,12] can be found in Figure 3. As can be seen, GIIRS channel selection scheme adds five channels whose wavenumber is higher than 750 cm−1 (751.250 cm−1, 758.750 cm−1, 791.250 cm−1, 791.875 cm−1, 792.500 cm−1) to increase its low troposphere CO2 inversion capability, since the weighting function peak level of this spectrum stays below 800 hPa (Figure 2).
Generating CO2 concentration profiles using a variational Data Assimilation (DA) method can ensure that the CO2 added value and meteorological fields are consistent with each other [25]. Particularly, the atmospheric temperature produces the most significant uncertainty to CO2 inversion for two reasons: (1) CO2-sensitive spectral observations are highly related to atmospheric temperature, and (2) the channel selection scheme renders the water vapor and other trace-gas side effects to a low degree on CO2 profile retrieval. In this study, the priori CO2 and meteorological background is derived from the NASA (National Aeronautics and Space Administration) GEOS-5 48 h lead-time forecast (data available at https://portal.nccs.nasa.gov/datashare/gmao/geos-fp/forecast (accessed on 31 December 2022)) [26]. Taking advantage of the hybrid 3-Dimensional Variational (hybrid 3DVar) assimilation scheme [27], the DA system adjusts the background using 22 GIIRS spectral radiance observations. The L-BFGS-B method [28] is chosen to minimize the cost function:
J x = x x b T B h y b 1 x x b + y H x T R 1 y H x
where x   is the analysis result; x b is the background field; B h y b is the hybrid background error covariance; y   is the GIIRS observation; R   is the observational error covariance; and H   is the observation operator, which converts the x   to the observation space. In this study, we choose RTTOV (Radiative Transfer for TOVS) fast radiative transfer model [29] version 13.1 as the observation operator to provide the DA system with simulated radiance and Jacobian ( K ) in channel space. Compared to the former version, RTTOV 13.1 allows the maximum surface skin temperature value over land to be 1250 K; this change can potentially reduce the radiance simulation error over wildfire, biomass burning, and high-fossil-fuel-consuming enterprises. Since the impact from other trace gases are removed in the channel selection, we use the “rtcoef_fy4_1_giirs_o3co2.H5” coefficient (available at https://nwp-saf.eumetsat.int/downloads/rtcoef_rttov13 (accessed on 31 December 2022)), which only considers the trace gas absorption impact from O3 and CO2, to generate the simulated GIIRS radiance and Jacobian. At each iteration ( n ), the first-order approximation can simplify the calculation of H x to:
H x n = H x n 1 + K x n 1   x n x n 1
In this study, the static background error covariance matrix ( B s t a t i c ) consists of three variables: surface skin temperature, air temperature, and CO2 concentration (Figure 4a) is calculated from a three-month-long GEOS-5 forecast dataset via the NMC (National Meteorological Center, now National Centers for Environmental Prediction) method [30]. The ensemble background error covariance ( B e n s e m b l e ), which only consists of surface skin temperature and air temperature, is calculated from NOAA (National Oceanic and Atmospheric) Global Ensemble Forecast System (GEFS, data available at https://noaa-gefs-pds.s3.amazonaws.com/index.html (accessed on 31 December 2022)) [31] 48 h lead-time forecast via the ensemble-mean method [32,33]. The B e n s e m b l e can reduce the CO2 retrieval accuracy uncertainty by better representing the meteorological field’s uncertainty caused by localized weather systems. The meteorological part of B h y b includes 80% B s t a t i c and 20% B e n s e m b l e , but the CO2 part is identical to the B s t a t i c due to the shortage of atmospheric CO2 forecast ensembles. The observation error covariance matrix ( R ) (Figure 4b) takes advantage of the Hollingworth–Lönnberg method [34,35], which is widely accepted and used in meteorological and atmospheric composition of the DA system [36,37,38,39,40]. As the observations located from 701.250 cm−1 to 704.375 cm−1, from 706.250 cm−1 to 708.750 cm−1, and from 791.250 cm−1 to 792.500 cm−1 are adjacent spectral channels, which causes a high cross-channel correlation (Figure 4c), the DA system cannot merely use the diagonal values in the R   matrix to minimize the cost function; thus, the off-diagonal values must be included. The cut-off iteration step amount is set to 200, accordingly, because of the inclusion of R Matrix off-diagonal values.
Before initiating the DA process, cloudy and high-noise-level pixel observations must be discarded. We quantify the cloud-covering possibility with Cloudy Pixel Percentage ( C P P ):
C P P = c l o u d y   p i x l e l   a m o u n t s e a r c h i n g   r a d i u s ,   t i m e   w i n d o w t o t a l   p i x e l   a m o u n t s e a r c h i n g   r a d i u s ,   t i m e   w i n d o w
In the calculation, the cloudiness information comes from the FY-4A Advanced Geostationary Radiation Imager (AGRI, data available at https://satellite.nsmc.org.cn/portalsite/ (accessed on 31 December 2022)) China regional cloud mask product (4 km horizontal resolution, 7 min refresh rate) [41]. At each GIIRS observation location, the t o t a l   p i x e l   a m o u n t is the AGRI pixel amount within a 10 km spatial (14 min temporal) searching radius, and the c l o u d y   p i x e l   a m o u n t is the cloudy and possible cloudy AGRI pixel amount. Any observations with CPP higher than 0.1 cannot enter the Quality Control (QC) process. The QC method primarily relies on the Observation-minus-Background (OmB) estimation, which ensures that the observation-background departures are tolerant to the minimization algorithm and computational cost, especially when assimilating observations gathered from multiple instruments. Another approach to representing observation quality is using the Noise Equivalent spectral Radiation ( N E Δ R ), which defines the amount of change in radiance required to produce a signal equivalent to the noise of the system. In this project, we adopt a N E Δ R   -based QC method for two reasons: (1) smaller observation amount, where the observations are gathered from 22 spectral channels via a single instrument; (2) data selection independence, where the OmB-based QC methods could bring about the over-similarity problem between observation and background and thus render the observation’s impact on background modification. The QC method calculates the mean ( M e a n N E Δ R ) and the standard deviation ( S D N E Δ R ) of each spectrum’s N E Δ R   from the clear-sky observations, then discards the entire pixel observation if it has more than 3 “bad” spectral observations, where bad means the absolute N E Δ R departure ( N E Δ R     M e a n N E Δ R ) is higher than 0.5 S D N E Δ R . In this study, the N E Δ R -based QC method accepts 44.3% of the clear-sky observations, while the OmB-based method’s data acceptance rate is 37.1%.
Based on the Emissions Database for Global Atmospheric Research (EDGAR) Green-House Gas (GHG) emission dataset [42], the experiment domain (Figure 5) in this study covers the primary GHG source regions in East Asia: China, Japan, and South Korea. The DA system assimilates GIIRS observation gathered within a 3 h time window (±1.5 h relative to the analysis validation time) and generates analysis of CO2 fields seven times per day (at 00, 03, 06, 09, 12, 15, 21 UTC). For performance comparison, the experimental analysis CO2 concentration generated from the DA system and the background (GEOS-5 48-h lead-time forecast) are compared against GEOS-5 initial conditions (data available at https://portal.nccs.nasa.gov/datashare/gmao/geos-fp/das/ (accessed on 31 December 2022)) and OCO-2/-3 retrieval products (data available at https://disc.gsfc.nasa.gov/datasets/ (accessed on 31 December 2022)). Mean Bias (MB) and Standard Deviation (SD) are chosen to indicate the performance difference in the evaluation.
M B = i = 0 n B i a s n
S D = i = 0 n B i a s     M B 2 n
B i a s = E s t i m a t i o n A n a l y s i s   G E O S 5   f o r e c a s t   T r u t h G E O S 5   a n a l y s i s   O C O 2 / 3   o b s e r v a t i o n

3. Results

3.1. Validation against GEOS-5 Initial Condition

By comparing the mean bias profile from the experimental analysis and GEOS-5 48 h lead-time forecast product (Figure 6a), it is shown that the GIIRS observation can increase the first guess’s accuracy. Regarding the mean bias, the first-guess field from the GEOS-5 48 h lead-time forecast has a 0.27 ppm CO2 concentration over-estimation at 975 hPa. This error is brought down by 0.04 ppm after assimilating the GIIRS observation. Furthermore, the low troposphere (975–800 hPa) benefits from the assimilation of the GIIRS observation since the experimental analysis’s mean bias is smaller than the mean bias of the first guess. The impact of the GIIRS observation tends to be neutral over the mid-troposphere (700–500 hPa), as neither accuracy improvement nor downgrade can be detected in the experimental analysis product. This phenomenon could result from the shortage of mid-troposphere CO2-sensitive spectral channels in the GIIRS observation (Figure 2). Unlike the observation shortage in the mid-troposphere, every selected spectral channel has one of its Jacobian peaks above 450 hPa. However, due to the relatively low CO2 concentration in the upper troposphere, the added value from the GIIRS observation assimilation is smaller than that provided for the low troposphere. If the mean bias deduction is expressed as a percentage (Figure 6c), it shows that the GIIRS observation contributes more information to the upper-level CO2 mean bias deduction, where the highest deduction ratio is almost 30%, whereas for the low troposphere, the highest deduction ratio is 27%. Rather than a positive contribution, the GIIRS observation increases the mid-troposphere mean bias by 5% (maximum). Despite the mid-troposphere performance drawback, the GIIRS observation still declares its potential in decreasing the first guess’s CO2 concentration bias on a broad scale. Other information concluded from the standard deviation profiles (Figure 6b,d) indicates that the GIIRS observation can diminish the random error in the background profiles.
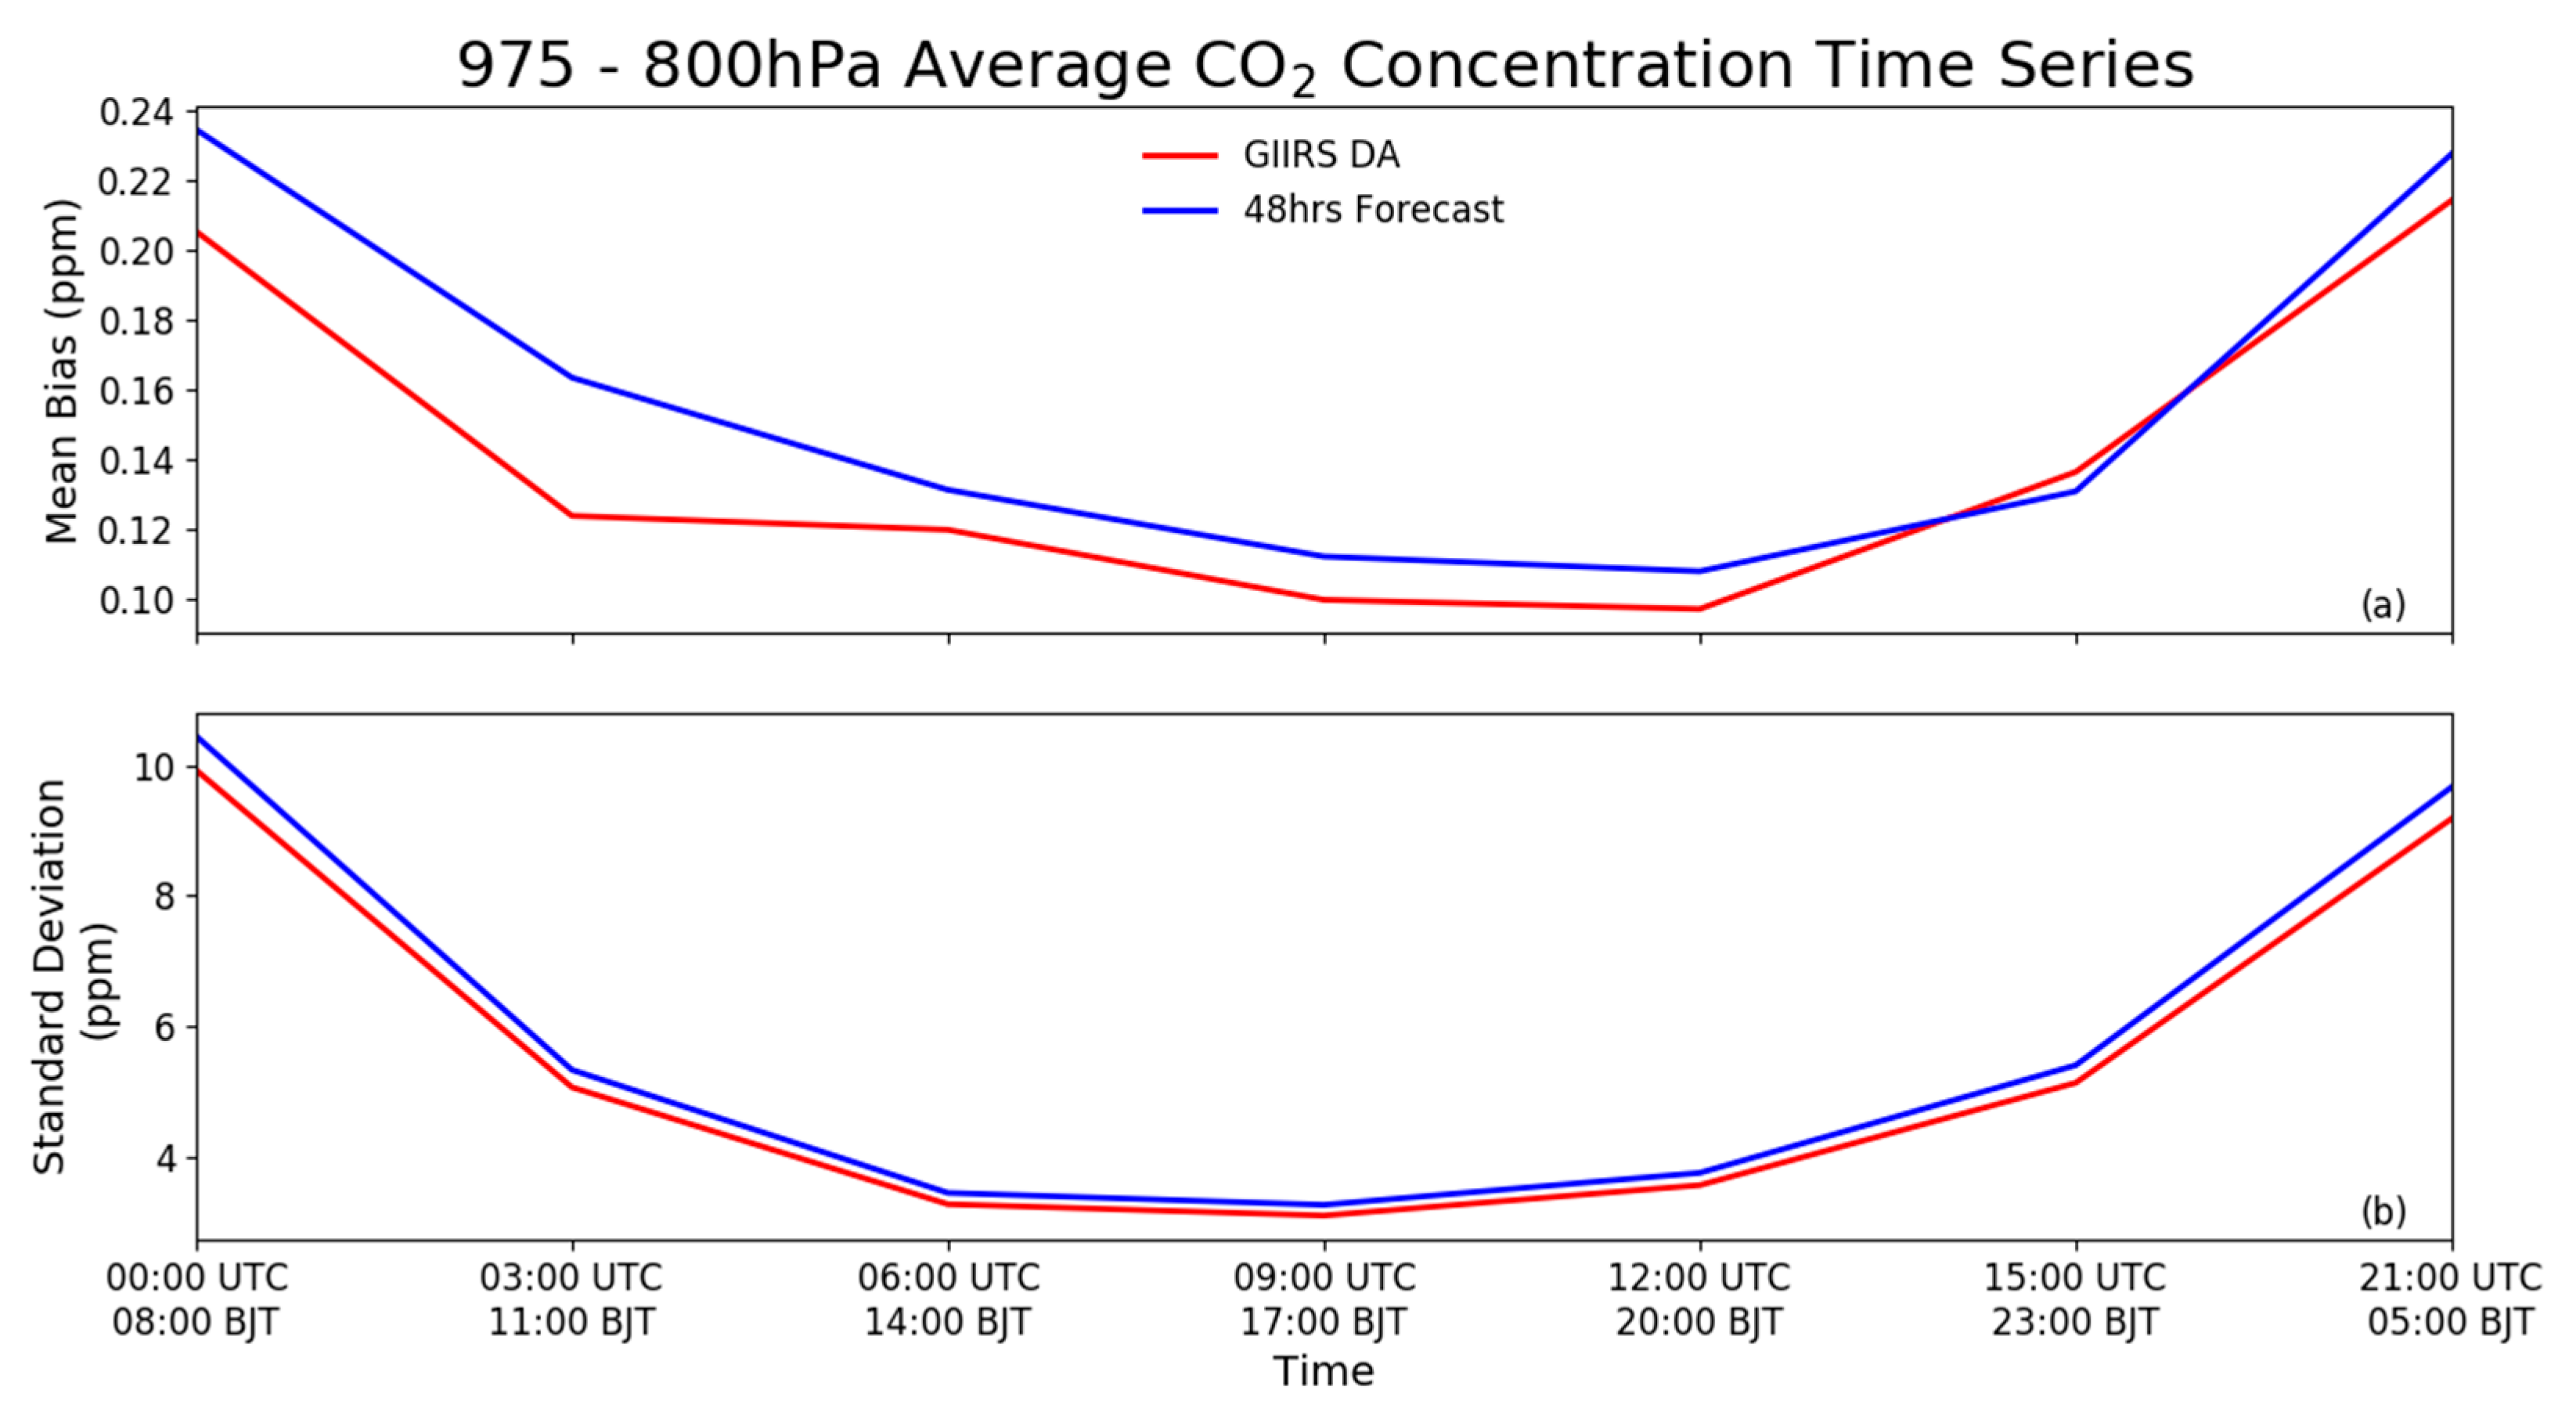
Since the low troposphere (975–800 hPa) CO2 concentration is highly related to human activities, it is useful to show how the GIIRS observation can detect the diurnal cycle. The diurnal change in mean bias (Figure 7a) indicates a higher value during midnight and twilight, but this anomaly drops below 0.16 ppm during the daytime. This situation happens not only in the first guess but also the experimental analysis product, but the DA system brings the analysis field’s mean bias down by 0.016 ppm (20:00 BJT/12:00 UTC) to 0.035 ppm (08:00 BJT/00:00 UTC) by assimilating the GIIRS observation. At 23:00 BJT/15:00 UTC, the GIIRS observation increases the mean bias, which can be attributed to the instrument’s insatiability before the GIIRS scheduled a 2-hour-long offline time centered at 02:00 BJT/18:00 UTC. The standard deviation diurnal cycle (Figure 7b) shares the same pattern with the mean bias (Figure 7a), in which the GIIRS observation contributes a 0.12 ppm (20:00 BJT/12:00 UTC) to 0.34 ppm (08:00 BJT/00:00 UTC) standard deviation deduction upon the first guess. Unlike the mean bias result at 23:00 BJT/15:00 UTC, the experimental analysis’s standard deviation is smaller than the first guess, but with a marginal magnitude.
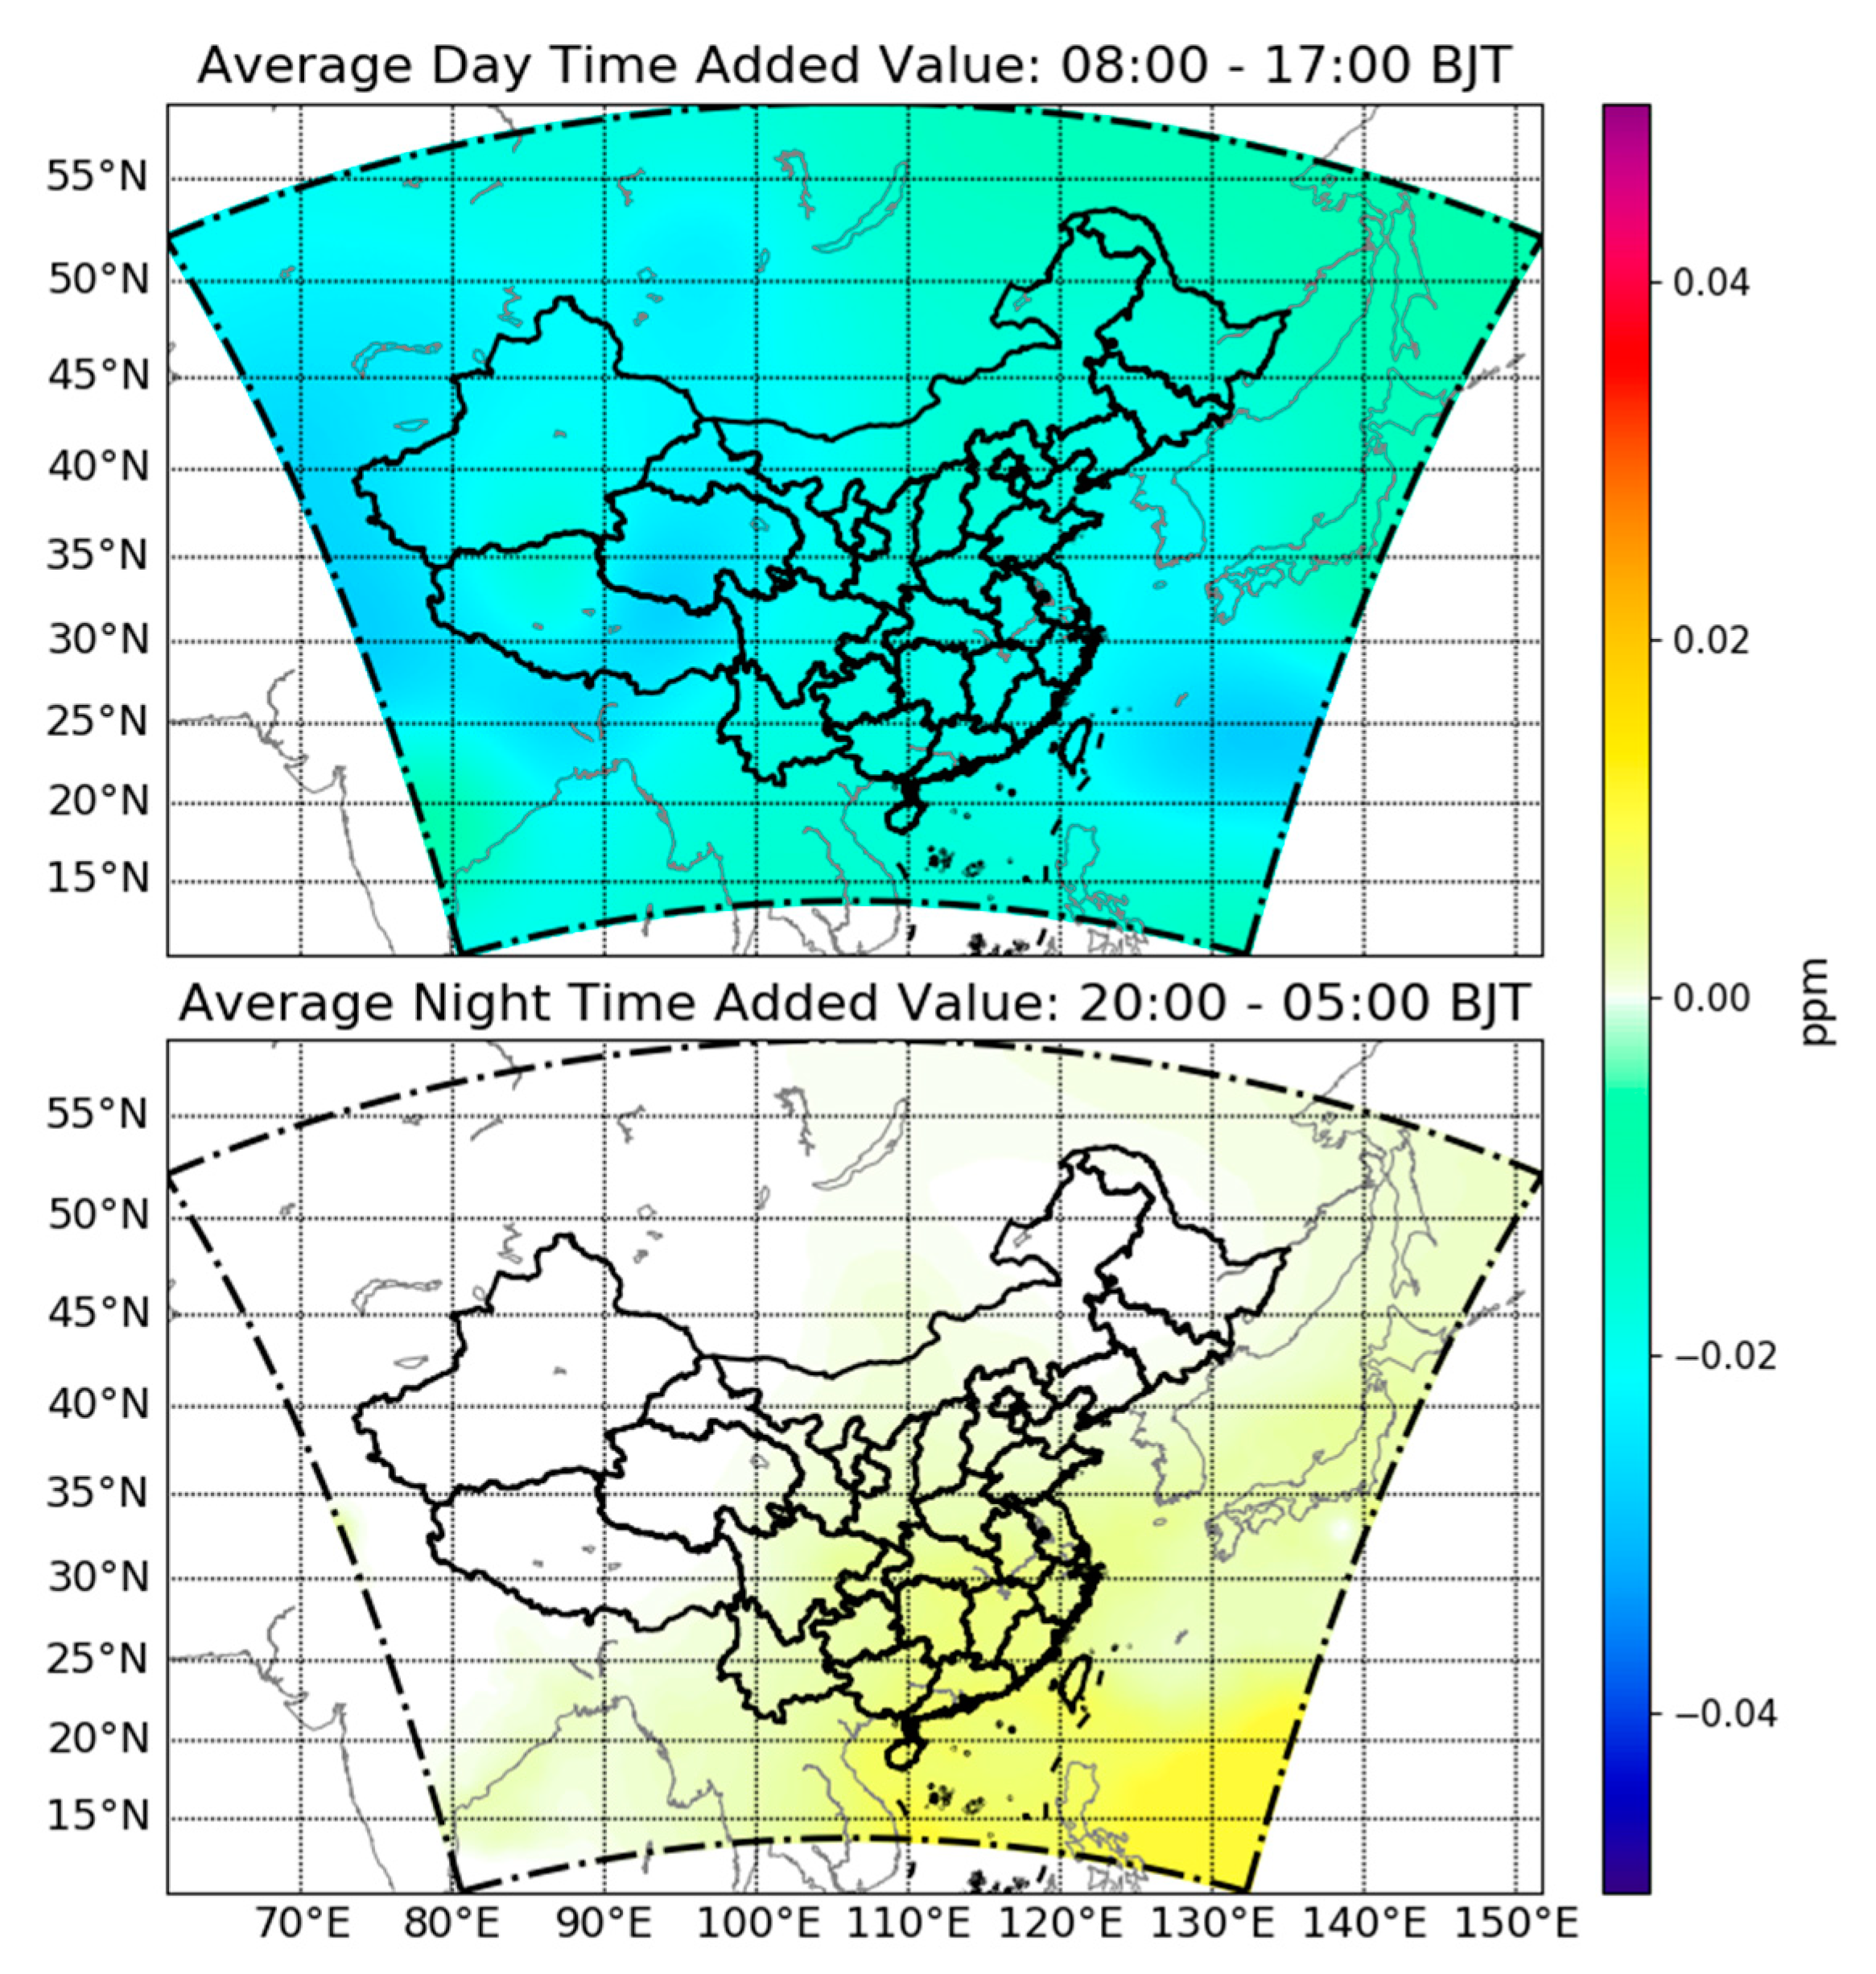
The low-troposphere CO2 added value (experimental analysis minus first guess) spatial distribution (Figure 8) depicts the experimental analysis product lowers (increases) the CO2 concentration in the first guess during local daytime (nighttime). This spatial distribution shows where the GIIRS observation modifies the first guess to minimize the bias in the low-troposphere CO2 concentration field: in the daytime, the primary CO2 concentration reductions being located in west and southeast China (Figure 8a), while at night, south China produces more CO2 emissions (Figure 8b).
As can be seen from Figure 9a, assimilation of GIIRS observations lowers the daytime low-troposphere standard deviation spatial distribution over most regions in China, except the west and central areas, where complex terrain is located. Comparing the random error reduction with the GHG emission (Figure 5), it can be concluded that the places with high standard deviation reduction coincide with high GHG-emission regions. The phenomenon indicates that assimilating the GIIRS observation can reduce the CO2 concentration random error where the GHG emission level is high. The nighttime standard deviation reduction spatial distribution (Figure 9b) differs from the daytime one: the random error increases after GIIRS assimilation in north and northeast China; and the tropical northwest Pacific Ocean (lower right corner) has the highest standard deviation increment above that for other regions. The human activity uncertainties (primarily industrial and high-energy-absorption activities) can be one of the causes of the nighttime random-error increase over north and northeast China since these regions have the most extended heavy industry history in China. For the random error increase over the tropical northwest Pacific, the coefficient for the GIIRS instrument could be the cause: the default GIIRS coefficient in RTTOV is calculated from a global training set, but according to the results from Di et al. [43], a coefficient calculated from a localized training set can improve fast radiative transfer models’ simulation accuracy since the geostationary hyperspectral infrared sounder is supposed to be more localized than other polar-orbiting ones.

3.2. Validation against OCO-2/3 Observation

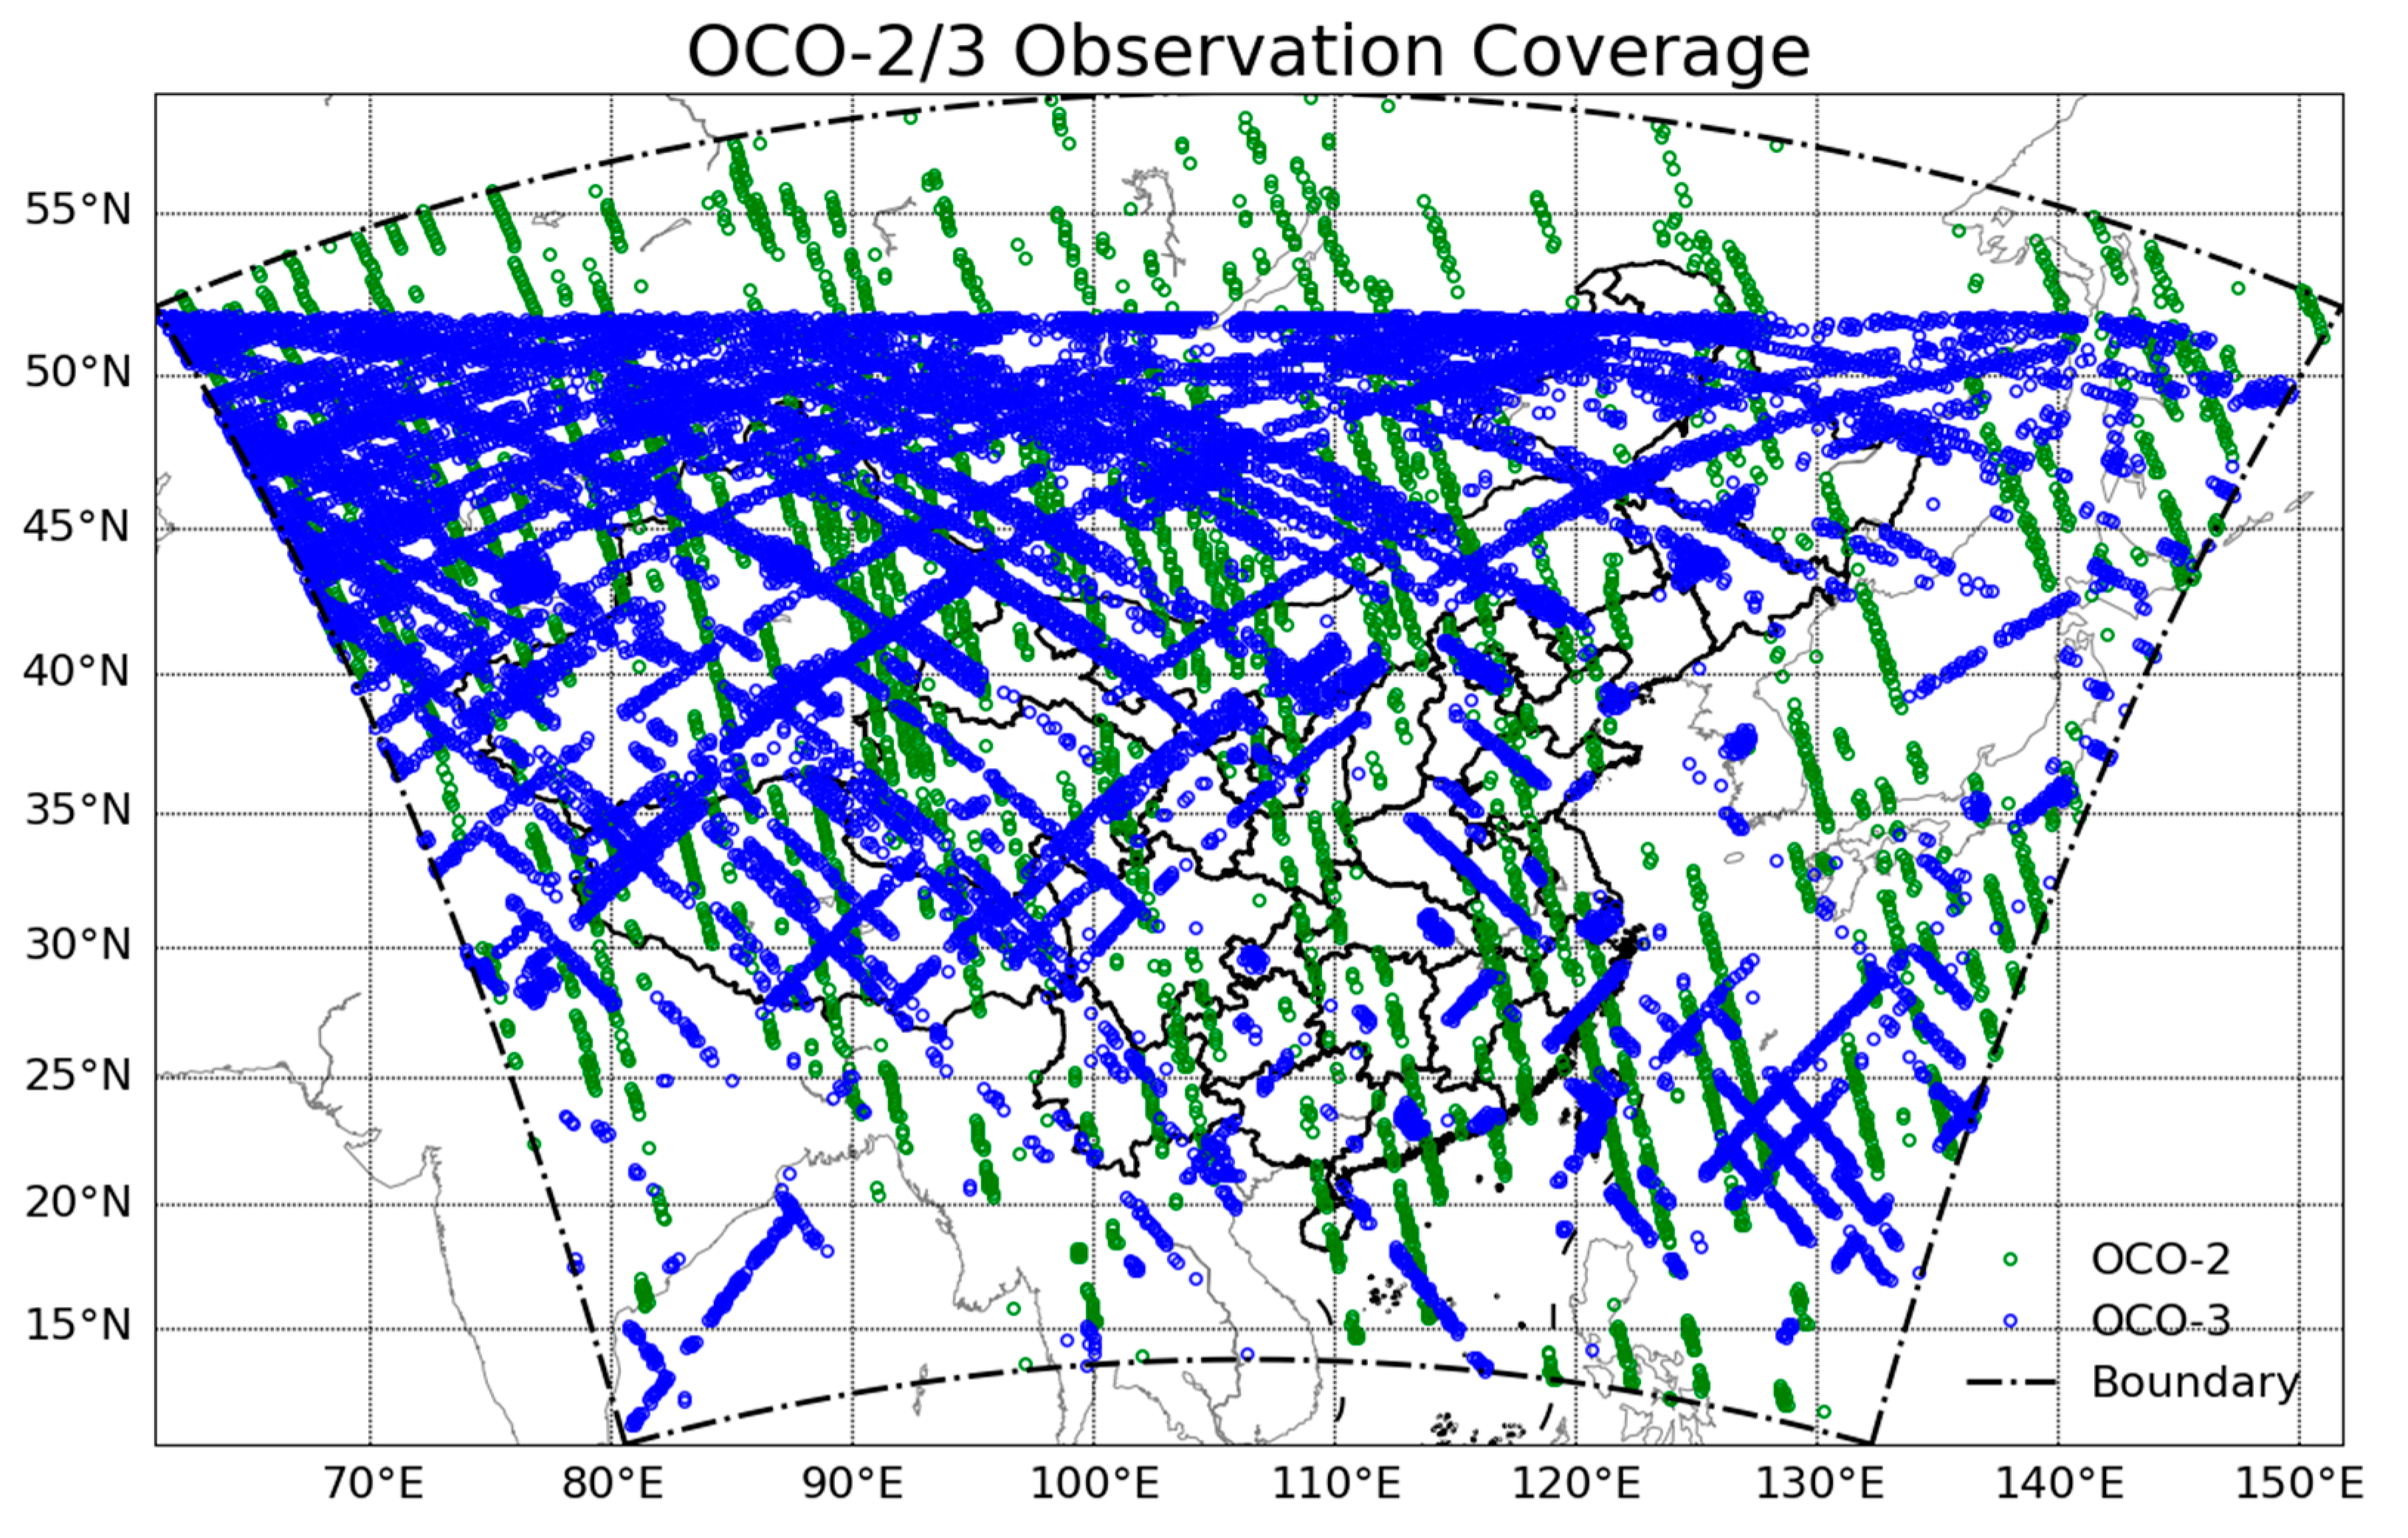
The former section demonstrates the GIIRS observation capability of correcting the CO2 concentration’s systematic error (mean bias) and random bias (standard deviation) in the first guess. However, the analysis field still needs further validation against observations, e.g., retrieval products generated from polar-orbiting platforms or in situ observations. However, the comparison against in situ observation is highly difficult to conduct due to the observation shortage in targeted area. In this section, we compare the mean bias and standard deviation from the experimental analysis and the GEOS-5 analysis, and the GEOS-5 48-hour lead-time forecasts are used to demonstrate the GIIRS observation’s impact on CO2 concentration correction and to calculate the mean bias and standard deviation of the differences with the level-2 CO2 retrieval products from OCO-2 [44] and OCO-3 [45] being treated as an unbiased observation (i.e., “Truth”). Before calculating the bias, the OCO-2/-3 products are mapped relative to the estimation (GIIRS DA analysis, GEOS-5 analysis, or the first guess) location where only the spatiotemporally nearest retrieval is used. Figure 10 shows the geographical locations of OCO-2/-3 retrievals used in this evaluation. As can be seen, the OCO-2 retrieval dataset provides observations over high-latitude regions (52°N and north), with more homogeneous spatial distribution than OCO-3, which covers the experiment domain’s northwest. This phenomenon could induce disagreement between evaluation results against OCO-2 and OCO-3 products.
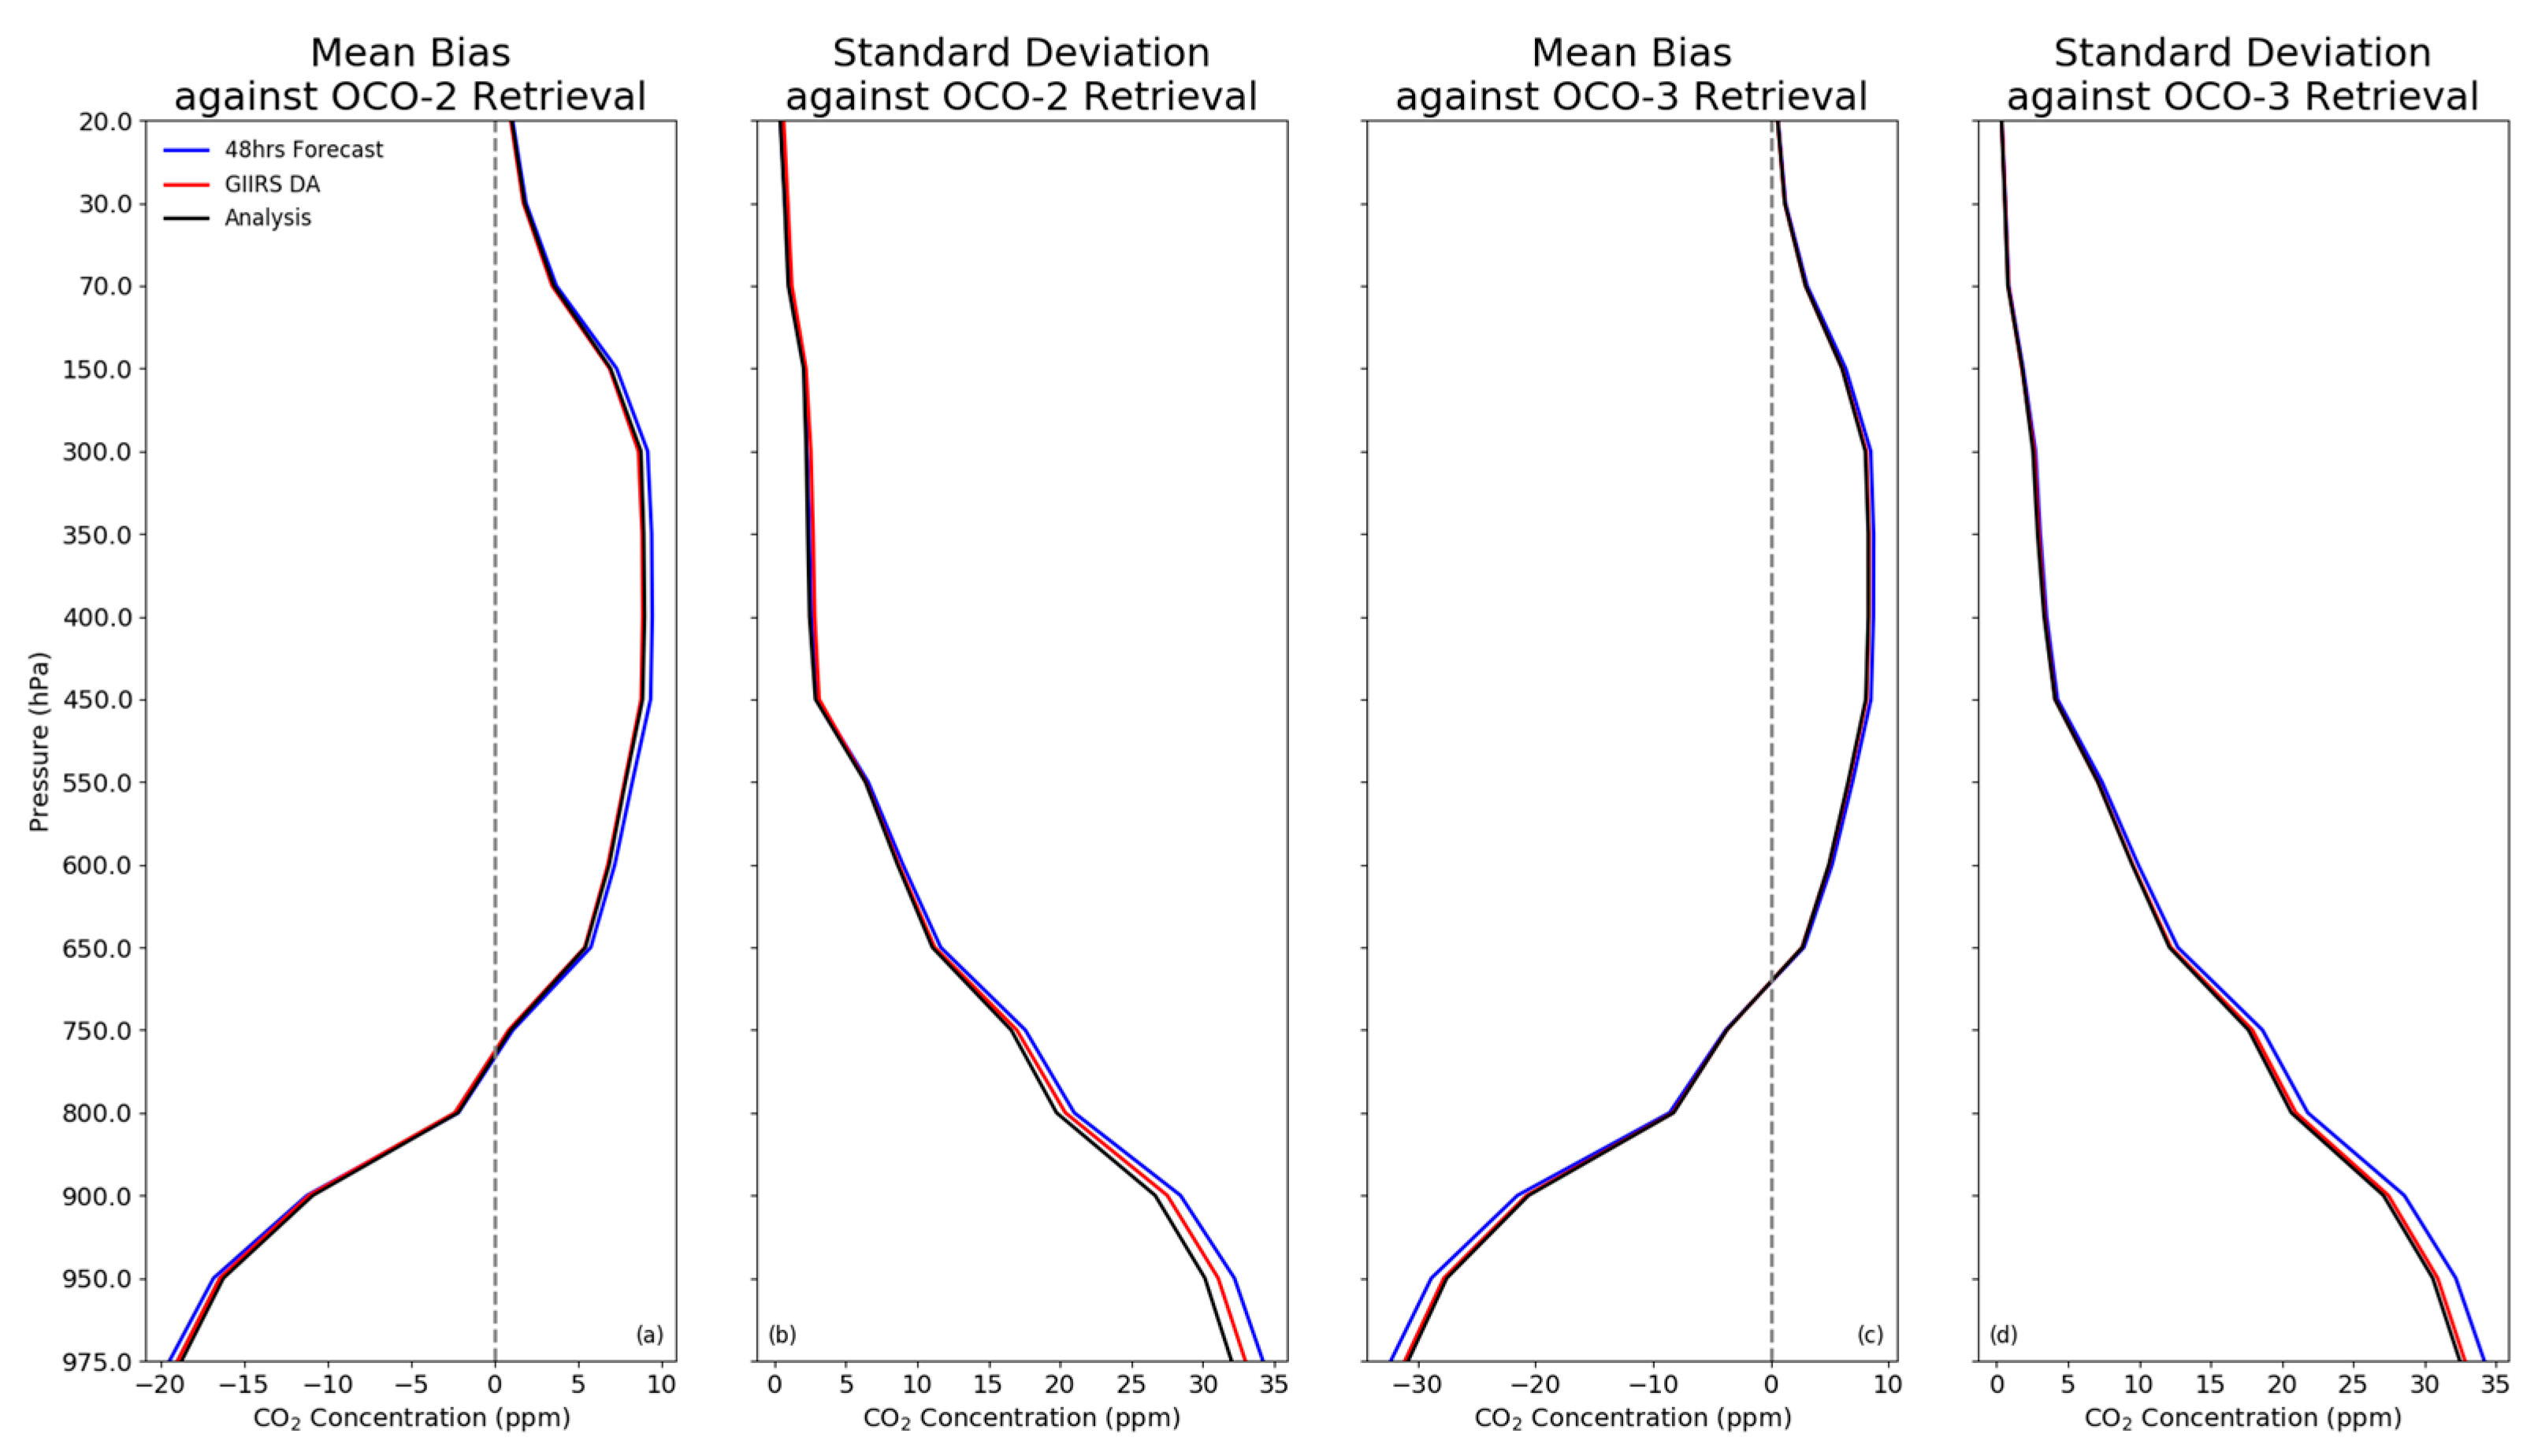
From the mean bias profile (Figure 11a,c), all three estimations (experimental analysis, GEOS-5 analysis, and the first guess) underestimate the low-troposphere CO2 concentration but produce overestimation over upper and mid-troposphere. Meanwhile, the magnitude of the mean bias is more extensive than that in the former section, which could be related to spatial difference: the OCO-2/-3 instruments have a 1.29 km × 2.25 km horizontal resolution, but a pixel in the GEOS-5 product/GIIRS observation is (25 km × 25 km)/(16 km × 16 km). Nevertheless, differences between the experimental analysis (red line), GEOS-5 analysis (black line), and the first guess (blue line) still reveals that the GIIRS analysis result has equivalent performance to the GEOS-5 analysis, while the first guess’s departure from the GEOS-5 analysis result is not neglectable (Figure 11a,c). The performance difference in random bias cancellation is more noticeable than the mean bias: in the OCO-2 comparison (Figure 11b,d), the GIIRS observation can cut down the CO2 concentration’s random error in the first guess over the low troposphere.

4. Discussion

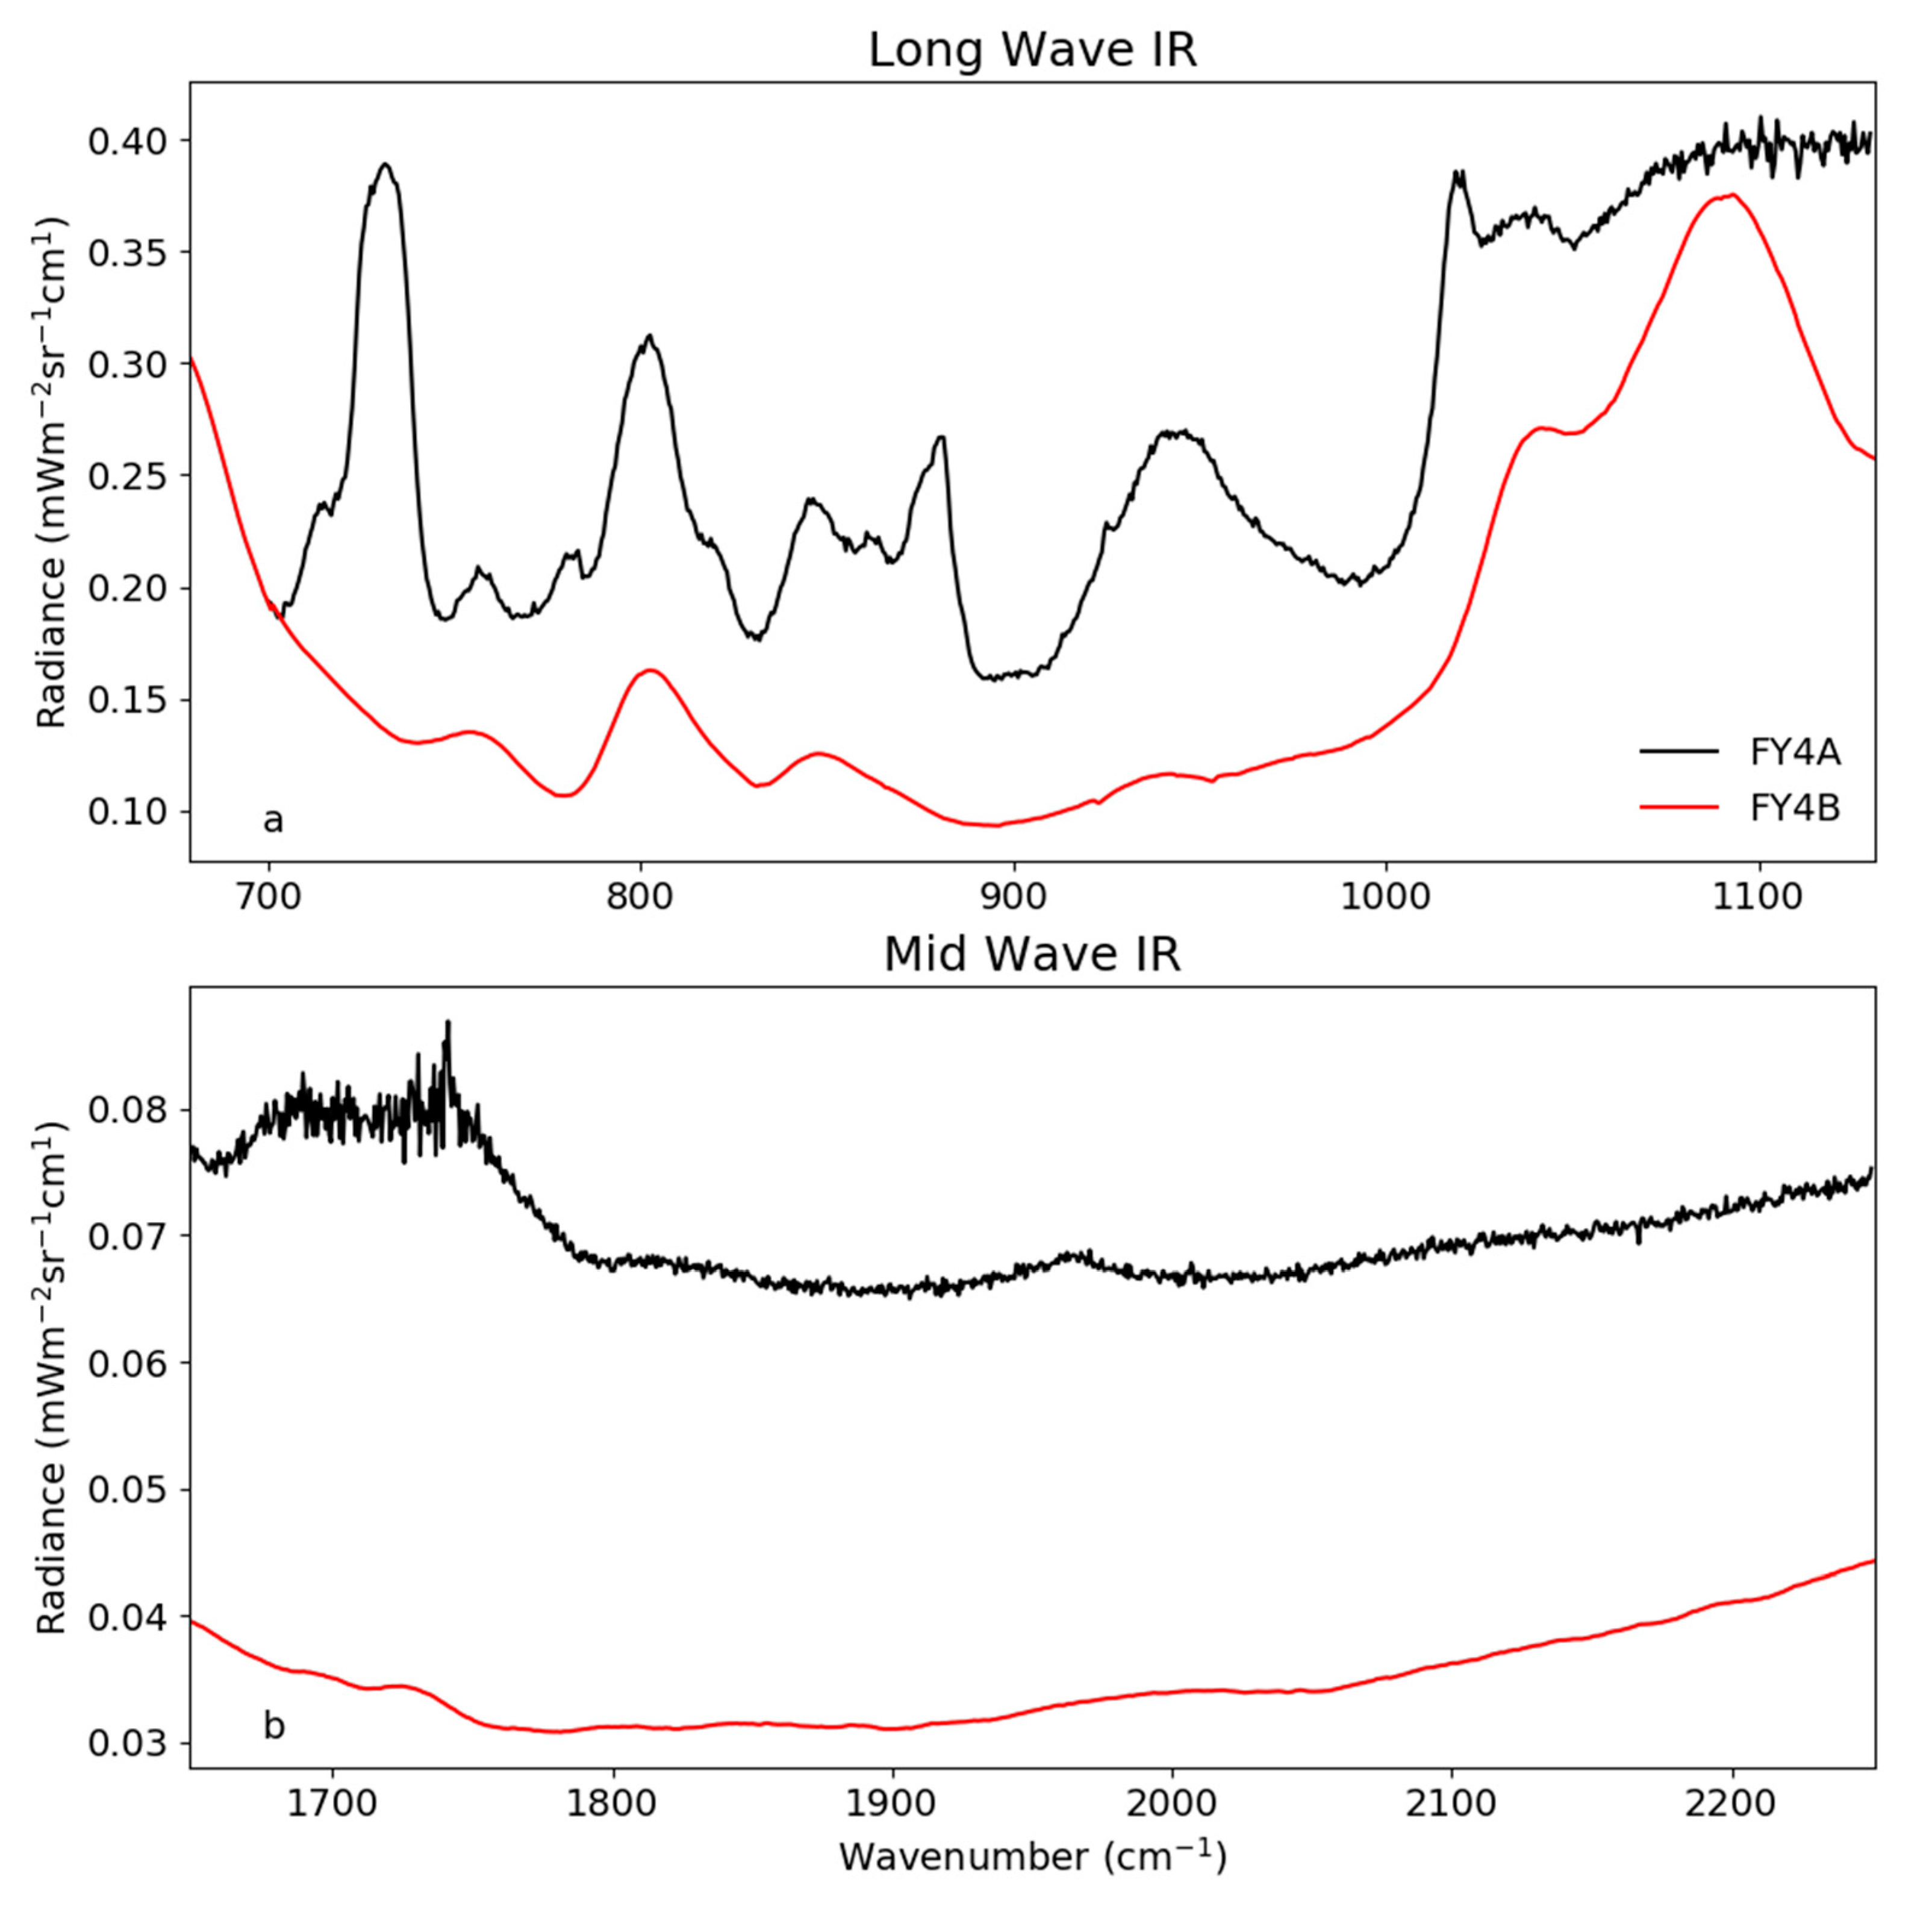
As mentioned in the beginning, geostationary instruments can diminish the revisiting time latency and provide observations at the same footprint within every spatial scan time; these attributes give geostationary hyperspectral infrared sounders multiple advantages over polar-orbiting instruments [46,47,48]. Meanwhile, the horizontal resolution of the GIIRS instrument impedes its contribution in increasing the horizontal resolution of CO2 monitoring: the instrument on FY-4A has a 16 km horizontal resolution at the nadir point, and its successor, GIIRS, on FY-4B’s nadir point horizontal resolution is 12 km, which is roughly equivalent to GOSAT but far behind the OCO-2/-3 instrument. However, this situation will change after Meteosat Third-Generation InfraRed Sounder (MTG-IRS) and Geostationary Extended Observation Sounder (GXS) become operational. In the future, the likelihood of creating a global-scale high-spatial–temporal-resolution CO2 monitoring network is probable with a global constellation of meteorological geostationary hyperspectral infrared sounder instruments. This satellite constellation can provide useful insights into global greenhouse gas emission reduction. For retrospective CO2 analysis datasets, meteorological geostationary hyperspectral infrared sounders can undoubtedly improve their temporal resolution by combining the new observation with the existing datasets from OCO-2 and GOSAT. Since the FY-4B GIIRS instrument’s N E Δ R is much smaller than that of FY-4A (Figure 12), the quality of this CO2 retrieval dataset can be improved by adding its observation into the system.

5. Conclusions

In this research, we conducted a prototypical study to demonstrate the geostationary hyperspectral infrared sounder’s potential for monitoring CO2 concentration using a one-month-long GIIRS observation. The results indicate that the meteorological geostationary infrared sounding observations can provide CO2 concentration information with reasonable accuracy. With high revisiting time frequency, GIIRS is capable of revealing the diurnal variation of CO2 emission. The additional spectrum, 751.250 cm−1, 758.750 cm−1, 791.250 cm−1, 791.875 cm−1 and 792.500 cm−1, can reduce the uncertainties embedded in the GEOS-5 product over the low troposphere. Despite the findings listed above, more research and investigations are needed to solve the issues such as the parallax correction for the geostationary hyperspectral infrared observations and how to combine the advantages from geostationary and low-earth-orbiting hyperspectral infrared sounding observation together.

Author Contributions

Conceptualization, Q.Z. and W.S.S.; methodology, Q.Z. and W.S.S.; software, Q.Z.; validation, Q.Z.; resources, Q.Z.; writing—original draft preparation, Q.Z.; writing—review and editing, W.S.S., M.S. All authors have read and agreed to the published version of the manuscript.

Funding

The research is funded by Special Science and Technology Innovation Program for Carbon Peak and Carbon Neutralization of Jiangsu Province (Grant Number BE2022612).

Institutional Review Board Statement

Not applicable.

Informed Consent Statement

Not applicable.

Data Availability Statement

The online access URLs are provided at the first location where the data are mentioned in the article.

Acknowledgments

We thank Filomena Romano and Elisabetta Ricciardelli for their voluntary academic editing services. We would also like to show our gratitude to all “anonymous” reviewers for their insights and comments on an earlier version of the manuscript, although any errors are our own and should not tarnish the reputations of these esteemed persons.

Conflicts of Interest

The authors declare no conflict of interest.

References

  1. World Data Centre for Greenhouse Gases. Available online: https://gaw.kishou.go.jp/ (accessed on 16 August 2022).
  2. Total Carbon Column Observing Network. Available online: http://www.tccon.caltech.edu/ (accessed on 16 August 2022).
  3. Friedlingstein, P.; Andrew, R.M.; Rogelj, J.; Peters, G.P.; Canadell, J.G.; Knutti, R.; Luderer, G.; Raupach, M.R.; Schaeffer, M.; van Vuuren, D.P.; et al. Persistent growth of CO2 emissions and implications for reaching climate targets. Nat. Geosci. 2014, 7, 709–715. [Google Scholar] [CrossRef]
  4. Arneth, A.; Sitch, S.; Pongratz, J. Historical carbon dioxide emissions caused by land-use changes are possibly larger than assumed. Nature Geosci. 2017, 10, 79–84. [Google Scholar] [CrossRef]
  5. Kuze, A.; Suto, H.; Shiomi, K.; Kawakami, S.; Tanaka, M.; Ueda, Y.; Deguchi, A.; Yoshida, J.; Yamamoto, Y.; Kataoka, F.; et al. Update on GOSAT TANSO-FTS performance, operations, and data products after more than 6 years in space. Atmos. Meas. Tech. 2016, 9, 2445–2461. [Google Scholar] [CrossRef]
  6. Crisp, D.; Pollock, H.R.; Rosenberg, R.; Chapsky, L.; Lee, R.A.M.; Oyafuso, F.A.; Frankenberg, C.; O’Dell, C.W.; Bruegge, C.J.; Doran, G.B.; et al. The on-orbit performance of the Orbiting Carbon Observatory-2 (OCO-2) instrument and its radiometrically calibrated products. Atmos. Meas. Tech. 2017, 10, 59–81. [Google Scholar] [CrossRef]
  7. Eldering, A.; Taylor, T.E.; O’Dell, C.W.; Pavlick, R. The OCO-3 mission: Measurement objectives and expected performance based on 1 year of simulated data. Atmos. Meas. Tech. 2019, 12, 2341–2370. [Google Scholar] [CrossRef]
  8. Crevoisier, C.; Chedin, A.; Scott, N.A. AIRS channel selection for CO2 and other trace-gas retrievals. Q. J. R. Meteorol. Soc. 2003, 129, 2719–2740. [Google Scholar] [CrossRef]
  9. Chevallier, F.; Engelen, R.J.; Peylin, P. The contribution of AIRS data to the estimation of CO2 sources and sinks. Geophys. Res. Lett. 2005, 32, L23801. [Google Scholar] [CrossRef]
  10. Maddy, E.S.; Barnet, C.D.; Goldberg, M.; Sweeney, C.; Liu, X. CO2 retrievals from the Atmospheric Infrared Sounder: Methodology and validation. J. Geophys. Res. 2008, 113, D11301. [Google Scholar] [CrossRef]
  11. Engelen, R.J.; Serrar, S.; Chevallier, F. Four-dimensional data assimilation of atmospheric CO2 using AIRS observations. J. Geophys. Res. 2009, 114, D03303. [Google Scholar] [CrossRef]
  12. Crevoisier, C.; Chédin, A.; Matsueda, H.; Machida, T.; Armante, R.; Scott, N.A. First year of upper tropospheric integrated content of CO2 from IASI hyperspectral infrared observations. Atmos. Chem. Phys. 2009, 9, 4797–4810. [Google Scholar] [CrossRef] [Green Version]
  13. Clerbaux, C.; Boynard, A.; Clarisse, L.; George, M.; Hadji-Lazaro, J.; Herbin, H.; Hurtmans, D.; Pommier, M.; Razavi, A.; Turquety, S.; et al. Monitoring of atmospheric composition using the thermal infrared IASI/MetOp sounder. Atmos. Chem. Phys. 2009, 9, 6041–6054. [Google Scholar] [CrossRef]
  14. García, O.E.; Sepúlveda, E.; Schneider, M.; Hase, F.; August, T.; Blumenstock, T.; Kühl, S.; Munro, R.; Gómez-Peláez, Á.J.; Hultberg, T.; et al. Consistency and quality assessment of the Metop-A/IASI and Metop-B/IASI operational trace gas products (O3, CO, N2O, CH4, and CO2) in the subtropical North Atlantic. Atmos. Meas. Tech. 2016, 9, 2315–2333. [Google Scholar] [CrossRef]
  15. Smith, N.; Smith, W.L., Sr.; Weisz, E.; Revercomb, H.E. AIRS, IASI, and CrIS Retrieval Records at Climate Scales: An Investigation into the Propagation of Systematic Uncertainty. J. Appl. Meteorol. Climatol. 2015, 54, 1465–1481. [Google Scholar] [CrossRef]
  16. Smith, N.; Barnet, C.D. CLIMCAPS observing capability for temperature, moisture, and trace gases from AIRS/AMSU and CrIS/ATMS. Atmos. Meas. Tech. 2020, 13, 4437–4459. [Google Scholar] [CrossRef]
  17. Nalli, N.R.; Tan, C.; Warner, J.; Divakarla, M.; Gambacorta, A.; Wilson, M.; Zhu, T.; Wang, T.; Wei, Z.; Pryor, K.; et al. Validation of Carbon Trace Gas Profile Retrievals from the NOAA-Unique Combined Atmospheric Processing System for the Cross-Track Infrared Sounder. Remote Sens. 2020, 12, 3245. [Google Scholar] [CrossRef]
  18. Golomolzin, V.V.; Rublev, A.N.; Kiseleva, Y.V. Retrieval of Total Column Carbon Dioxide over Russia from Meteor-M No. 2 Satellite Data. Russ. Meteorol. Hydrol. 2022, 47, 304–314. [Google Scholar] [CrossRef]
  19. Moore, B., III; Crowell, S.M.; Rayner, P.J.; Kumer, J.; O’Dell, C.W.; O’Brien, D.; Utembe, S.; Polonsky, I.; Schimel, D.; Lemen, J. The potential of the Geostationary Carbon Cycle Observatory (GeoCarb) to provide multi-scale constraints on the carbon cycle in the Americas. Front. Environ. Sci. 2018, 6, 109. [Google Scholar] [CrossRef]
  20. Yang, J.; Zhang, Z.; Wei, C.; Lu, F.; Guo, Q. Introducing the new generation of Chinese geostationary weather satellites, Fengyun-4. Bull. Amer. Meteor. 2017, 98, 1637–1658. [Google Scholar] [CrossRef]
  21. Gigli, S.; Fowler, G.; Stuhlmann, R.; Tjemkes, S.; Lamarre, D. IRS, the European Hyperspectral Infrared Sounder Mission from the Geostationary Orbit. Fourier Transform Spectroscopy 2016, 14, FTh4B-1. [Google Scholar] [CrossRef]
  22. Adkins, J.; Alsheimer, F.; Ardanuy, P.; Boukabara, S.; Casey, S.; Coakley, M.; Conran, J.; Cucurull, L.; Daniels, J.; Ditchek, S.D.; et al. Geostationary Extended Observations (GeoXO) Hyperspectral InfraRed Sounder Value Assessment Report. Available online: https://repository.library.noaa.gov/view/noaa/32921 (accessed on 31 December 2022).
  23. Clarisse, L.; Van Damme, M.; Hurtmans, D.; Franco, B.; Clerbaux, C.; Coheur, P.F. The diel cycle of NH3 observed from the FY-4A Geostationary Interferometric Infrared Sounder (GIIRS). Geophys. Res. Lett. 2021, 48, e2021GL093010. [Google Scholar] [CrossRef]
  24. Liu, P.; Ding, J.; Liu, L.; Xu, W.; Liu, X. Estimation of surface ammonia concentrations and emissions in China from the polar-orbiting Infrared Atmospheric Sounding Interferometer and the FY-4A Geostationary Interferometric Infrared Sounder. Atmos. Chem. Phys. 2022, 22, 9099–9110. [Google Scholar] [CrossRef]
  25. Engelen, R.J.; Andersson, E.; Chevallier, F.; Hollingsworth, A.; Matricardi, M.; McNally, A.P.; Thépaut, J.N.; Watts, P.D. Estimating atmospheric CO2 from advanced infrared satellite radiances within an operational 4D-Var data assimilation system: Methodology and first results. J. Geophys. Res. Atmos. 2004, 109, D19309. [Google Scholar] [CrossRef]
  26. GEOS-5 Forecast Product. Available online: https://www.nccs.nasa.gov/services/data-collections/coupled-products/geos5-forecast (accessed on 16 August 2022).
  27. Wang, X. Incorporating Ensemble Covariance in the Gridpoint Statistical Interpolation Variational Minimization: A Mathematical Framework. Mon. Weather Rev. 2010, 138, 2990–2995. [Google Scholar] [CrossRef]
  28. Byrd, R.H.; Lu, P.; Nocedal, J.; Zhu, C.A. limited memory algorithm for bound constrained optimization. SIAM J. Sci. Stat. Comput. 1995, 16, 1190–1208. [Google Scholar] [CrossRef]
  29. Saunders, R.; Hocking, J.; Turner, E.; Rayer, P.; Rundle, D.; Brunel, P.; Vidot, J.; Roquet, P.; Matricardi, M.; Geer, A.; et al. An update on the RTTOV fast radiative transfer model (currently at version 12). Geosci. Model Dev. 2018, 11, 2717–2737. [Google Scholar] [CrossRef]
  30. Parrish, D.F.; Derber, J.C. The National Meteorological Center’s Spectral Statistical-Interpolation Analysis System. Mon. Weather Rev. 1992, 120, 1747–1763. [Google Scholar] [CrossRef]
  31. Hamill, T.M.; Bates, G.T.; Whitaker, J.S.; Murray, D.R.; Fiorino, M.; Galarneau, T.J., Jr.; Zhu, Y.; Lapenta, W. NOAA’s Second-Generation Global Medium-Range Ensemble Reforecast Dataset. Bull. Amer. Meteor. 2013, 94, 1553–1565. [Google Scholar] [CrossRef]
  32. Lorenc, A.C. Recommended Nomenclature for EnVar Data Assimilation Methods. Research Activities in Atmospheric and Oceanic Modeling. Available online: https://www.wcrp-climate.org/WGNE/BlueBook/2013/individual-articles/01_Lorenc_Andrew_EnVar_nomenclature.pdf (accessed on 17 August 2022).
  33. Bannister, R.N. A review of operational methods of variational and ensemble-variational data assimilation. Q. J. R. Meteorol. Soc. 2017, 143, 607–633. [Google Scholar] [CrossRef]
  34. Hollingsworth, A.; LÖnnberg, P. The statistical structure of short-range forecast errors as determined from radiosonde data. Part I: The wind field. Tellus A Dyn. Meteorol. Oceanogr. 1986, 38, 111–136. [Google Scholar] [CrossRef]
  35. Descombes, G.; Auligné, T.; Vandenberghe, F.; Barker, D.M.; Barré, J. Generalized background error covariance matrix model (GEN_BE v2.0). Geosci. Model Dev. 2015, 8, 669–696. [Google Scholar] [CrossRef] [Green Version]
  36. Kumar, U.; De Ridder, K.; Lefebvre, W.; Janssen, S. Data assimilation of surface air pollutants (O3 and NO2) in the regional-scale air quality model AURORA. Atmos. Environ. 2012, 1, 99–108. [Google Scholar] [CrossRef]
  37. Robichaud, A.; Ménard, R. Multi-year objective analyses of warm season ground-level ozone and PM2.5 over North America using real-time observations and Canadian operational air quality models. Atmos. Chem. Phys. 2014, 14, 1769–1800. [Google Scholar] [CrossRef]
  38. Chai, T.; Kim, H.C.; Pan, L.; Lee, P.; Tong, D. Impact of Moderate Resolution Imaging Spectroradiometer Aerosol Optical Depth and AirNow PM2.5 assimilation on Community Multi-scale Air Quality aerosol predictions over the contiguous United States. J. Geophys. Res. Atmos. 2017, 122, 5399–5415. [Google Scholar] [CrossRef]
  39. Wang, L.; Yu, S.; Li, P.; Chen, X.; Li, Z.; Zhang, Y.; Li, M.; Mehmood, K.; Liu, W.; Chai, T.; et al. Significant wintertime PM2.5 mitigation in the Yangtze River Delta, China, from 2016 to 2019: Observational constraints on anthropogenic emission controls. Atmos. Chem. Phys. 2020, 20, 14787–14800. [Google Scholar] [CrossRef]
  40. Lee, S.; Song, C.H.; Han, K.M.; Henze, D.K.; Lee, K.; Yu, J.; Woo, J.H.; Jung, J.; Choi, Y.; Saide, P.E.; et al. Impacts of uncertainties in emissions on aerosol data assimilation and short-term PM2.5 predictions over Northeast Asia. Atmos. Environ. 2022, 27, 118921. [Google Scholar] [CrossRef]
  41. Wang, X.; Min, M.; Wang, F.; Guo, J.; Li, B.; Tang, S. Intercomparisons of Cloud Mask Products Among Fengyun-4A, Himawari-8, and MODIS. IEEE Trans. Geosci. Remote Sens. 2019, 57, 8827–8839. [Google Scholar] [CrossRef]
  42. Crippa, M.; Solazzo, E.; Huang, G. High resolution temporal profiles in the Emissions Database for Global Atmospheric Research. Sci. Data 2020, 7, 121. [Google Scholar] [CrossRef] [PubMed]
  43. Di, D.; Li, J.; Han, W.; Bai, W.; Wu, C.; Menzel, W.P. Enhancing the fast radiative transfer model for FengYun-4 GIIRS by using local training profiles. J. Geophys. Res. Atmos. 2018, 123, 583–596. [Google Scholar] [CrossRef]
  44. OCO-2 Science Team; Gunson, M.; Eldering, A. OCO-2 Level 2 Bias-Corrected XCO2 and Other Select Fields from the Full-Physics Retrieval Aggregated as Daily Files, Retrospective Processing V9r; Goddard Earth Sciences Data and Information Services Center (GES DISC): Greenbelt, MD, USA, 2022. [CrossRef]
  45. OCO-2/OCO-3 Science Team; Chatterjee, A.; Payne, V. OCO-3 Level 2 Bias-Corrected XCO2 and Other Select Fields from the Full-Physics Retrieval Aggregated as Daily Files, Retrospective Processing v10.4r; Goddard Earth Sciences Data and Information Services Center (GES DISC): Greenbelt, MD, USA, 2022. [CrossRef]
  46. Sieglaff, J.M.; Schmit, T.J.; Menzel, W.P.; Ackerman, S.A. Inferring Convective Weather Characteristics with Geostationary High Spectral Resolution IR Window Measurements: A Look into the Future. J. Atmos. Ocean. Technol. 2009, 26, 1527–1541. [Google Scholar] [CrossRef]
  47. Schmit, T.J.; Li, J.; Ackerman, S.A.; Gurka, J.J. High-Spectral- and High-Temporal-Resolution Infrared Measurements from Geostationary Orbit. J. Atmos. Ocean. Technol. 2009, 26, 2273–2292. [Google Scholar] [CrossRef]
  48. Di, D.; Xue, Y.; Li, J.; Bai, W.; Zhang, P. Effects of CO2 Changes on Hyperspectral Infrared Radiances and Its Implications on Atmospheric Temperature Profile Retrieval and Data Assimilation in NWP. Remote Sens. 2020, 12, 2401. [Google Scholar] [CrossRef]
Figure 1. Gaseous absorption coefficient for H2O (blue), CO2 (black), N2O (dark red), CH4 (green), NO (pink), SO2 (purple) and NO2 (yellow) over GIIRS long-wave (a) and mid-wave (b) IR channels. Absorption data come from HITRAN2020 Dataset (available at https://hitran.org/ (accessed on 31 December 2022)).
Remotesensing 15 00886 g001
Figure 2. CO2 Jacobian (weighting function) of the 22 selected GIIRS spectral channels.
Remotesensing 15 00886 g002
Figure 3. Channel selection scheme comparison between AIRS (green), IASI (blue) and GIIRS (red). The grey line is the mean radiance from simulated IASI observation.
Remotesensing 15 00886 g003
Figure 4. The spatial-averaged CO2 B Matrix (a), the R Matrix (b) of the selected 22 GIIRS spectrums, and the spectral correlation coefficient matrix (c).
Remotesensing 15 00886 g004
Figure 5. Domain spatial coverage and the grid-point GHG emission (data from EDGARv6.0, available at http://jeodpp.jrc.ec.europa.eu/ftp/jrc-opendata/EDGAR/datasets/v60_GHG/ (accessed on 31 December 2022)).
Remotesensing 15 00886 g005
Figure 6. Mean bias profile (a) and standard deviation profile (b) before (blue) and after (red) assimilating GIIRS sounding observation for the domain shown in Figure 4 and from 1 August 2022 to 1 September 2022. The reduction ratio of mean bias and standard deviation are shown in (c,d). Solid black lines in subplot (a,c) are the ideal mean bias profile.
Remotesensing 15 00886 g006
Figure 7. Diurnal cycle of mean bias (a) and standard deviation (b) before (blue) and after (red) GIIRS sounding assimilation, for the domain shown in Figure 4 and from 1 August 2022 to 1 September 2022.
Remotesensing 15 00886 g007
Figure 8. Spatial distribution of daytime and nighttime mean bias added value.
Remotesensing 15 00886 g008
Figure 9. Spatial distribution of daytime and nighttime standard deviation departure.
Remotesensing 15 00886 g009
Figure 10. OCO-2 (green) and OCO-3 (blue) retrieval profile location used in the evaluation.
Remotesensing 15 00886 g010
Figure 11. Mean bias profile of GIIRS assimilation (red), first guess (blue) and GEOS-5 analysis (or GEOS-5 initial condition) (black) with OCO-2 (a) or OCO-3 (c) as the truth; the standard deviation profiles using OCO-2 (OCO-3) as the truth are shown in (b,d). Dotted lines in subplot a and c are the ideal mean bias profile.
Remotesensing 15 00886 g011
Figure 12. GIIRS noise equivalent differential radiance from FY-4A (black) and FY-4B (red) in long-wave infrared (a) channel and mid-wave infrared channel (b).
Remotesensing 15 00886 g012
Disclaimer/Publisher’s Note: The statements, opinions and data contained in all publications are solely those of the individual author(s) and contributor(s) and not of MDPI and/or the editor(s). MDPI and/or the editor(s) disclaim responsibility for any injury to people or property resulting from any ideas, methods, instructions or products referred to in the content.