
Non-Destructive Diagnosis on the Masaccio Frescoes at the Brancacci Chapel, Church of Santa Maria del Carmine (Florence)

 ,
,  ,
,  , ,
, , 
Abstract
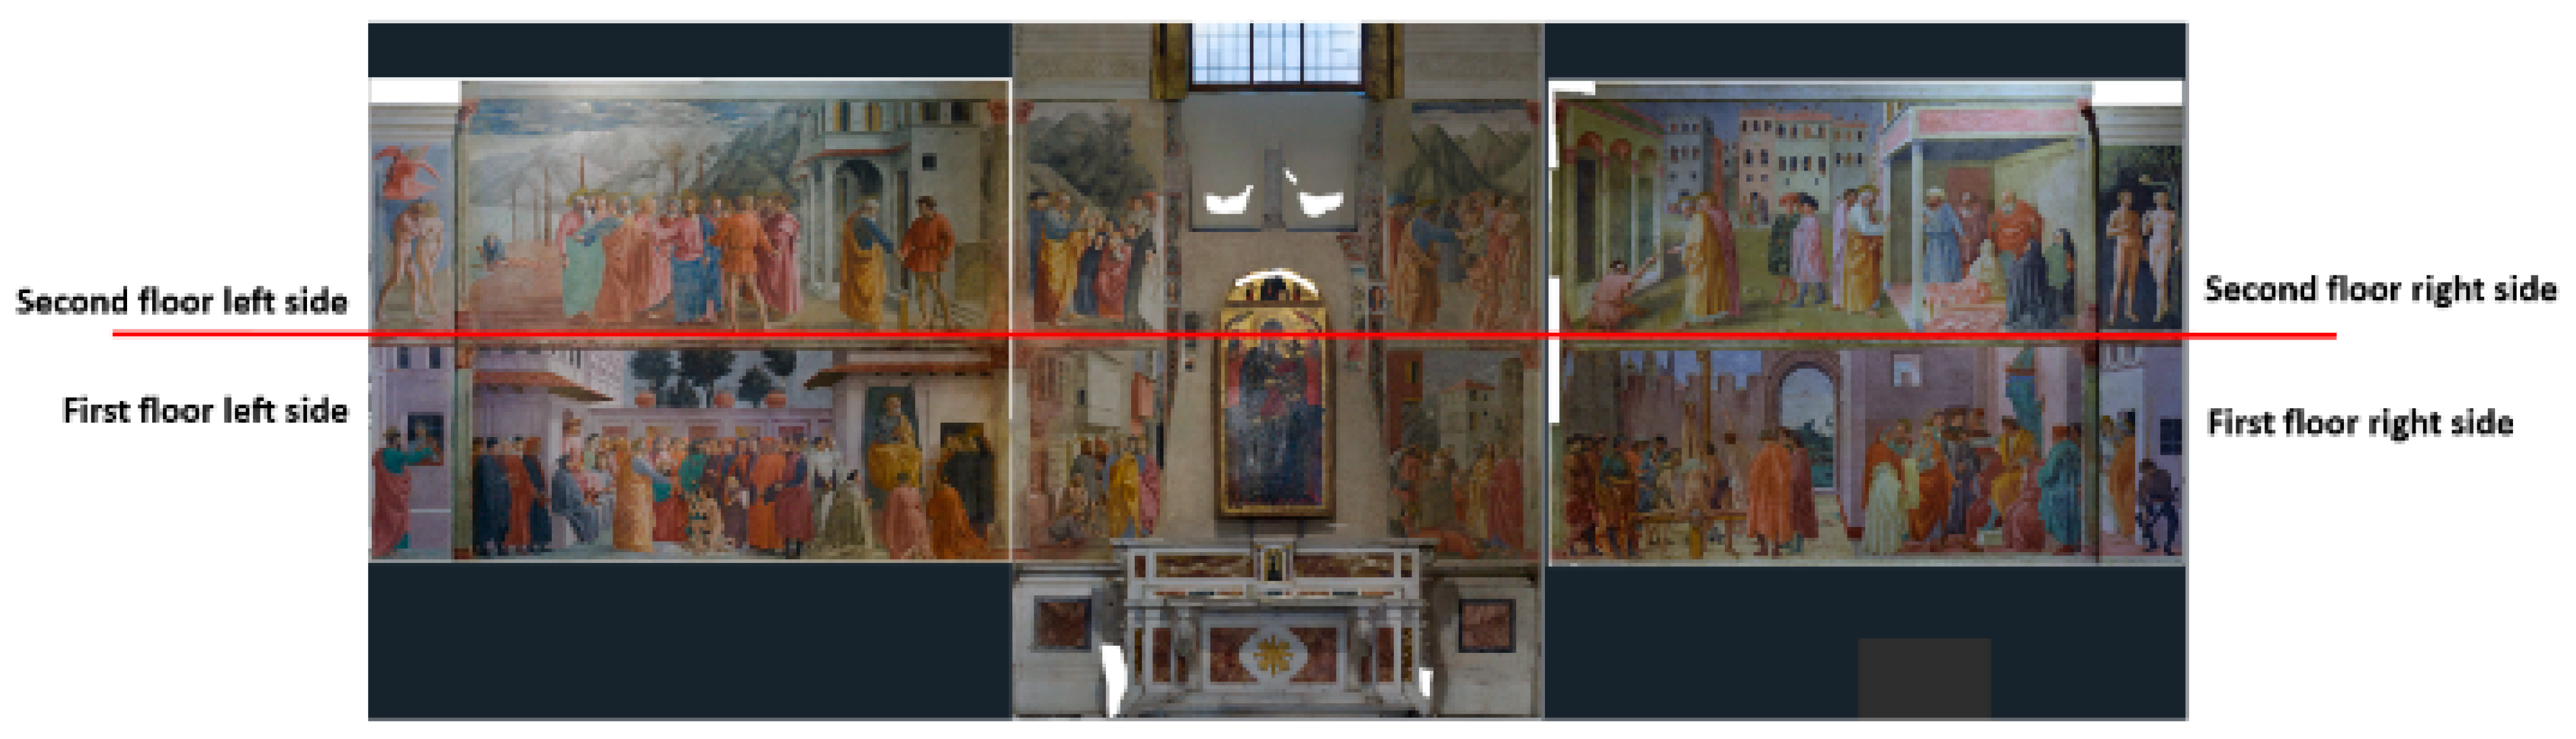
1. Introduction
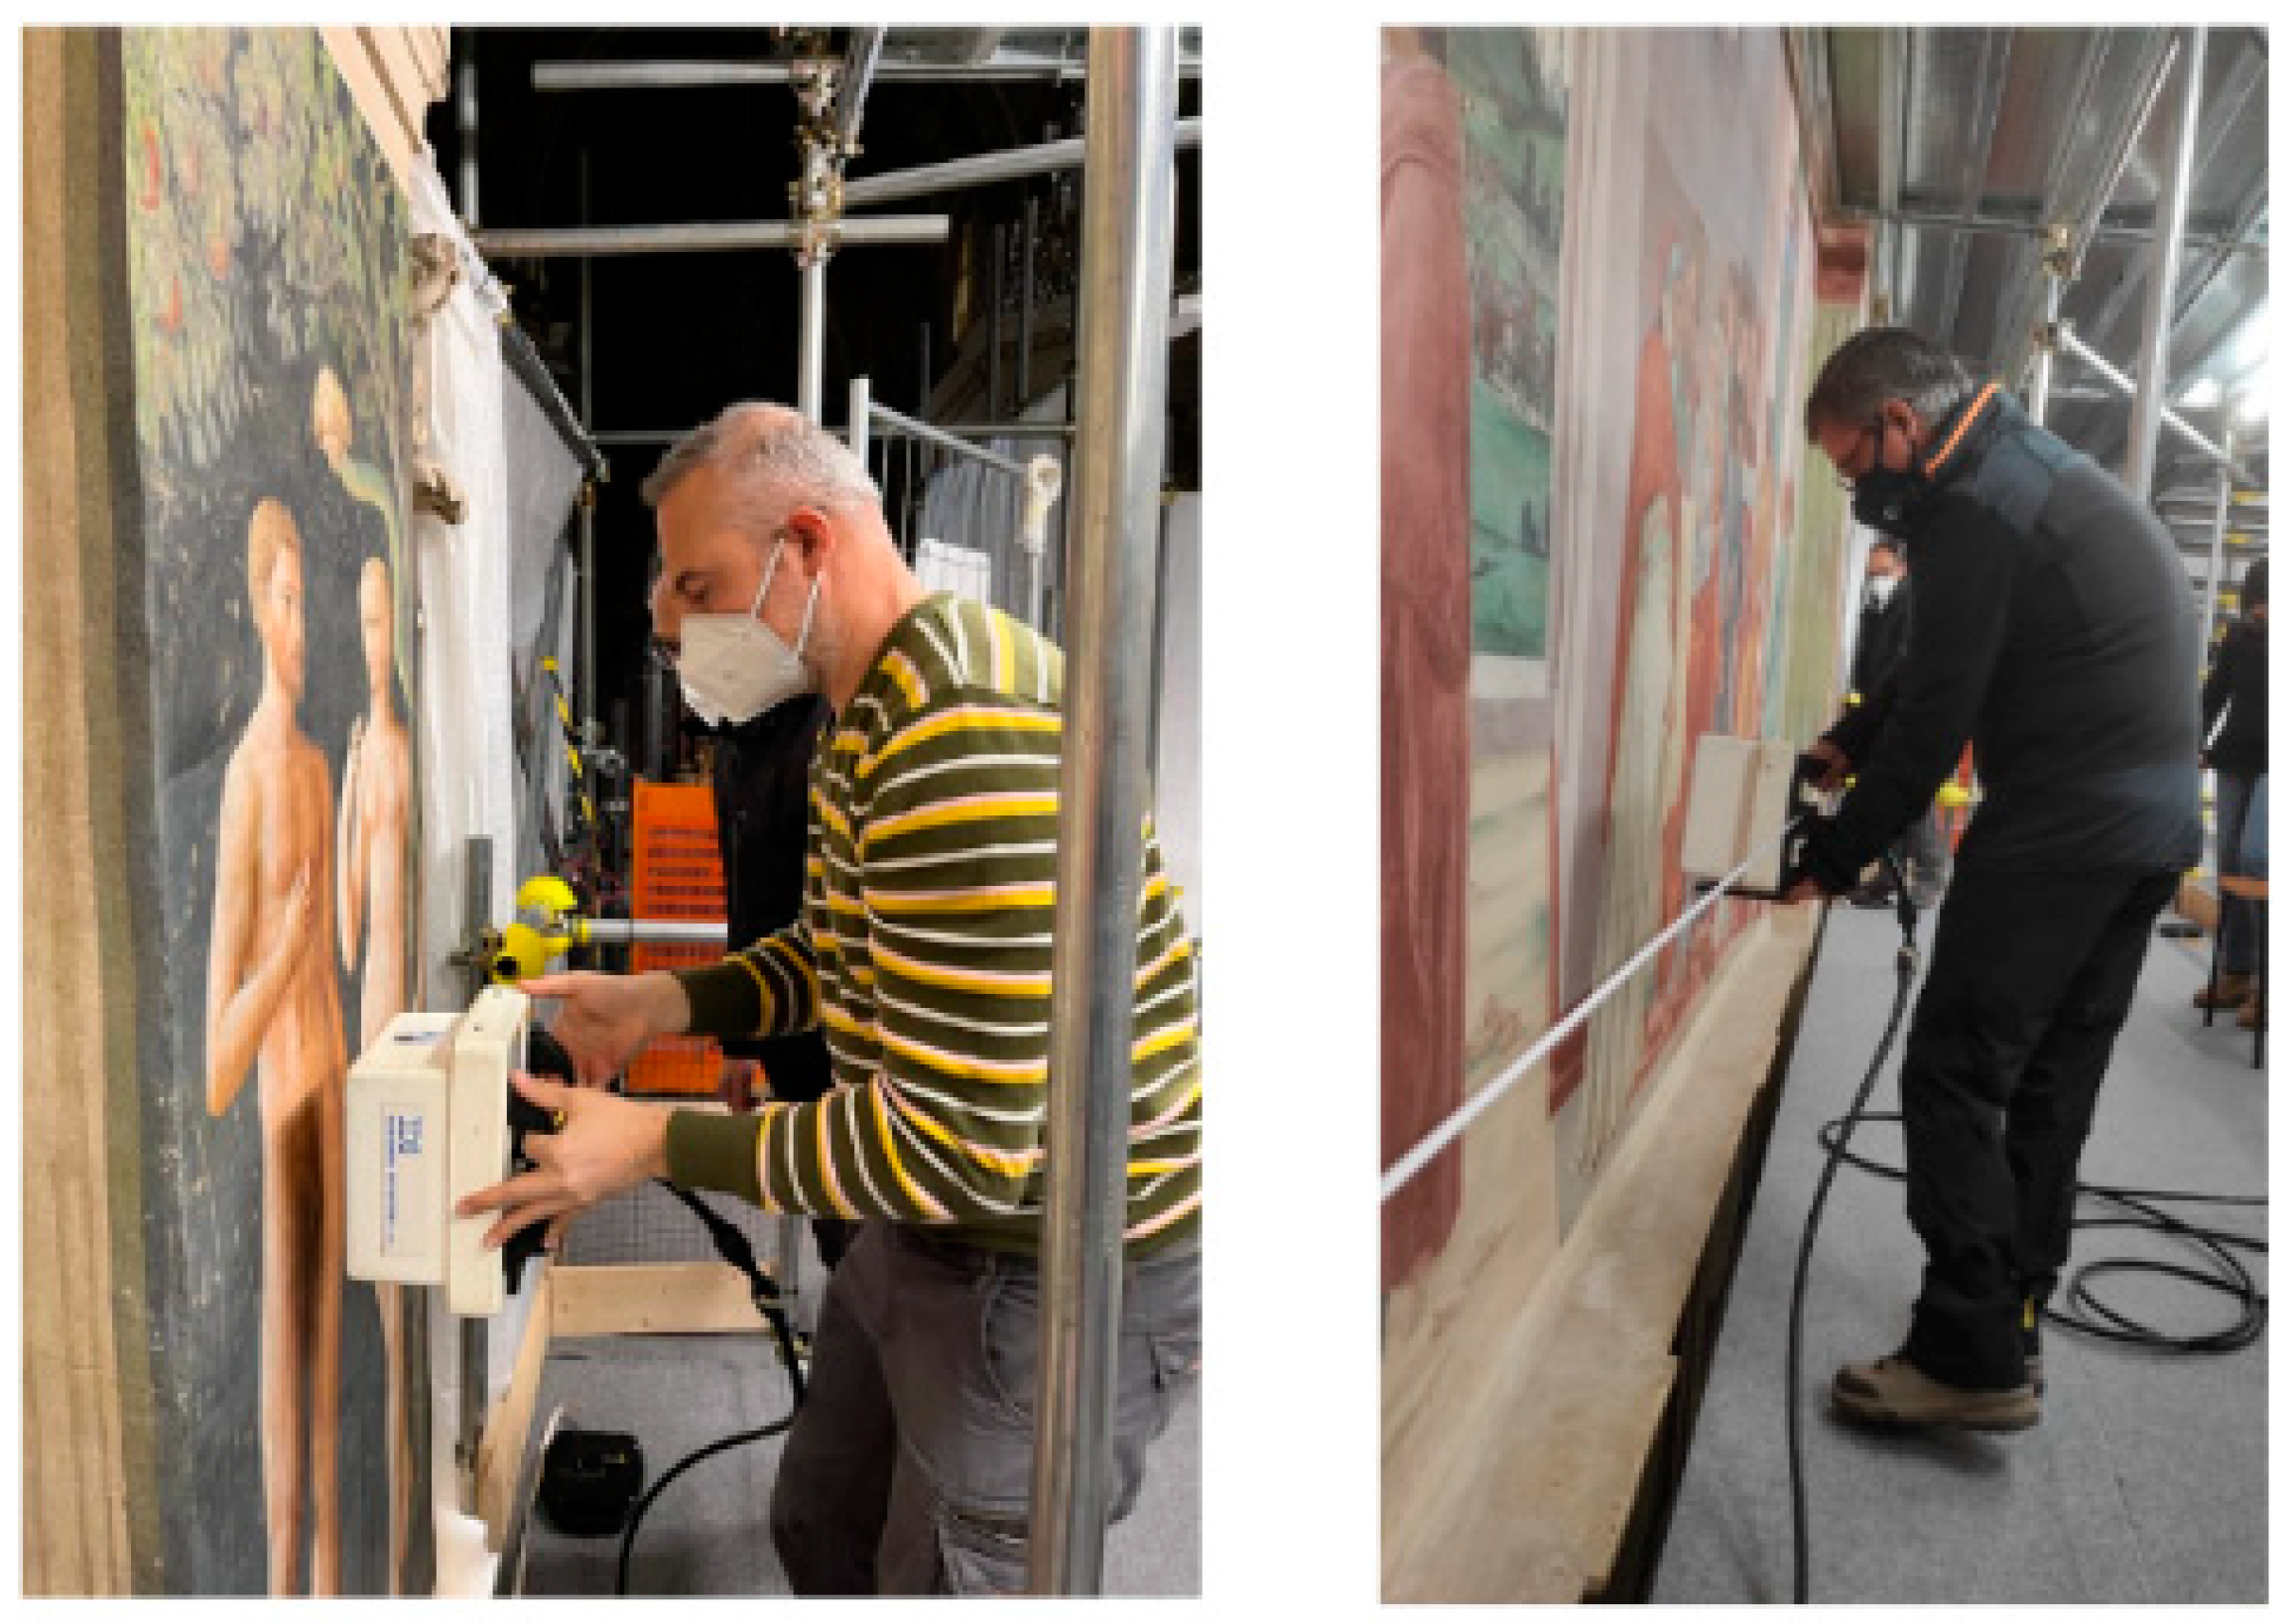
2. Materials and Methods
3. Results
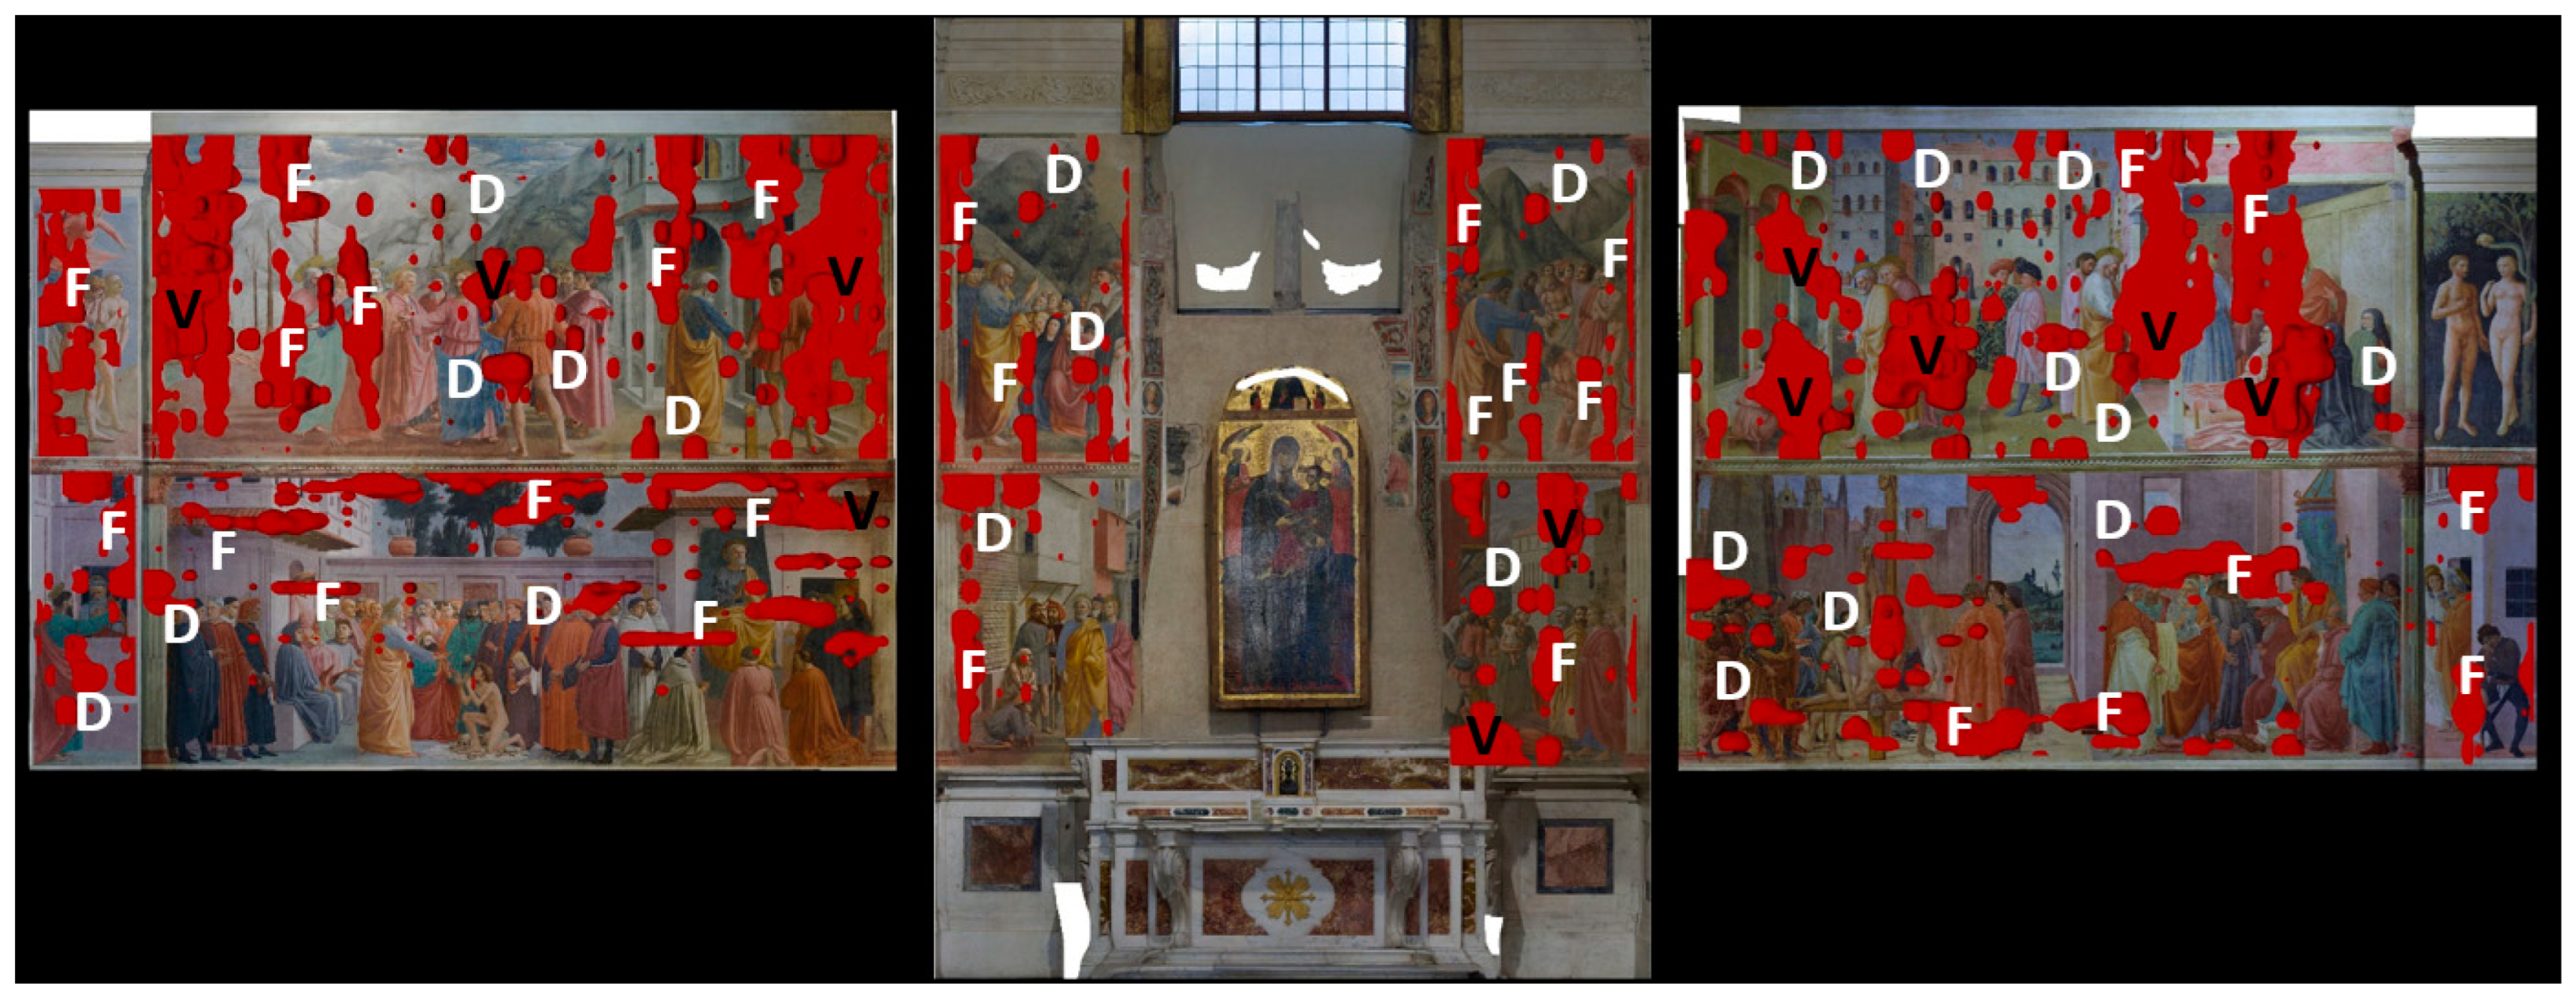
3.1. 900 MHz Antenna Data Analysis
- A good penetration of the signal, which allows delimiting of the thickness of the masonry (dashed yellow line); this thickness is estimated to be between about 0.55 m and 0.6 m (with an average velocity of propagation of the electromagnetic wave equal to 0.11 m/ns);
- A series of reflection events, indicated by the dotted red lines and denominated F, which can probably be interpreted as relating to the presence of fractures inside the masonry; in particular, in correspondence with the cracks, a probable event of settling of the masonry is highlighted. This could be linked to a series of water infiltrations in the foundations due to heavy rains;
3.2. 2000 MHz Antenna Data Analysis
- two horizontal reflected events, linked to the stratification in the first 10 cm of depth; a first layer is identified, with a thickness of about 3.6 cm from the surface, and a second layer with a thickness of about 4.2 cm;
- a series of reflex events, indicated with V, which can probably be interpreted as relating to the presence of small voids; these voids have thicknesses between about 0.3 cm and 0.6 cm.
4. Discussion
5. Conclusions
Author Contributions
Funding
Data Availability Statement
Acknowledgments
Conflicts of Interest
References
- Leucci, G. Nondestructive Testing for Archaeology and Cultural Heritage: A Practical Guide and New Perspective; Springer: Berlin/Heidelberg, Germany, 2019; p. 217. ISBN 978-3-030-01898-6. [Google Scholar]
- Giannino, F.; Leucci, G. Electromagnetic Methods in Geophysics: Applications in GeoRadar, FDEM, TDEM, and AEM; Wiley: Hoboken, NJ, USA, 2021; p. 352. ISBN 978-1-119-77098-5. [Google Scholar]
- Conyers, L.B. Interpreting Ground-Penetrating Radar for Archaeology; Left Coast Press: Walnut Creek, CA, USA, 2012. [Google Scholar]
- Cozzolino, M.; Di Giovanni, E.; Mauriello, P.; Piro, S.; Zamuner, D. Geophysical Methods for Cultural Heritage Management; Springer: Berlin/Heidelberg, Germany, 2018; p. 211. [Google Scholar]
- Ortega-Ramírez, J.; Bano, M.; Lelo de Larrea-López, L.; Robles-Camacho, J.; Ávi-la-Luna, P.; Villa-Alvarado, L.A. GPR measurements to identify cracks and textural arrangements in the altar Wall of the 16th-century Santa María Huiramangaro Church, Michoacán, Mexico. Near Surf. Geophys. 2019, 17, 247–261. [Google Scholar] [CrossRef]
- De Giorgi, L.; Lazzari, M.; Leucci, G.; Persico, R. Geomorphological and Non-Destructive GPR Survey for the Conservation of Frescos in the Rupestrian Churches of Matera (Basilicata, Southern Italy). Near Surf. Geophys. 2020. [Google Scholar] [CrossRef]
- Ortega-Ramirez, J.; Bano, M.; Villa-Alvarado, L.A. GPR for detecting cracks and voids in a historical mural, before restoration, on the altar Wall of a XVII century church. In Proceedings of the 18th International Conference on Ground Penetrating Radar, Golden, CO, USA, 14–19 June 2020; Society of Exploration Geophysicists: Mexico City, Mexico, 2020; pp. 22–25. [Google Scholar]
- Topp, G.C.; Davis, J.L.; Annan, A.P. Electromagnetic Determination of Soil Water Content: Measurements in Coaxial Transmission Lines. Water Resour. Res. 1980, 16, 574–582. [Google Scholar] [CrossRef]
- Sandmeier, K.J. Reflexw 9.0 Manual, Sandmeier Software; Sandmeier: Karlsruhe, Germany, 2022.
- Goodman, D. GPR Slice Version 7.0 Manual. 2013. Available online: https://www.gpr-survey.com (accessed on 4 June 2013).


Disclaimer/Publisher’s Note: The statements, opinions and data contained in all publications are solely those of the individual author(s) and contributor(s) and not of MDPI and/or the editor(s). MDPI and/or the editor(s) disclaim responsibility for any injury to people or property resulting from any ideas, methods, instructions or products referred to in the content. |
© 2023 by the authors. Licensee MDPI, Basel, Switzerland. This article is an open access article distributed under the terms and conditions of the Creative Commons Attribution (CC BY) license (https://creativecommons.org/licenses/by/4.0/).
Share and Cite
Leucci, G.; Giorgi, L.D.; Ferrari, I.; Giuri, F.; Longhitano, L.; Felici, A.; Riminesi, C. Non-Destructive Diagnosis on the Masaccio Frescoes at the Brancacci Chapel, Church of Santa Maria del Carmine (Florence). Remote Sens. 2023, 15, 1146. https://doi.org/10.3390/rs15041146
Leucci G, Giorgi LD, Ferrari I, Giuri F, Longhitano L, Felici A, Riminesi C. Non-Destructive Diagnosis on the Masaccio Frescoes at the Brancacci Chapel, Church of Santa Maria del Carmine (Florence). Remote Sensing. 2023; 15(4):1146. https://doi.org/10.3390/rs15041146
Chicago/Turabian StyleLeucci, Giovanni, Lara De Giorgi, Ivan Ferrari, Francesco Giuri, Lucrezia Longhitano, Alberto Felici, and Cristiano Riminesi. 2023. "Non-Destructive Diagnosis on the Masaccio Frescoes at the Brancacci Chapel, Church of Santa Maria del Carmine (Florence)" Remote Sensing 15, no. 4: 1146. https://doi.org/10.3390/rs15041146
APA StyleLeucci, G., Giorgi, L. D., Ferrari, I., Giuri, F., Longhitano, L., Felici, A., & Riminesi, C. (2023). Non-Destructive Diagnosis on the Masaccio Frescoes at the Brancacci Chapel, Church of Santa Maria del Carmine (Florence). Remote Sensing, 15(4), 1146. https://doi.org/10.3390/rs15041146