Multitemporal and Multiscale Applications of Geomatic Techniques to Medium-Sized Archaeological Sites—Case Study of Marroquíes Bajos (Jaén, Spain)
Abstract
1. Introduction
2. Methodology
- Stage 1 (S1): The purpose of this stage is the documentation of the initial state of the archaeological area (SL1) by obtaining cartographic products, in order to generate a base map to serve as a reference.
- Stage 2 (S2): This stage is related to the geometric documentation of the test excavations (SL2) prior to the archaeological intervention. The purpose is to document the initial status of these zones to be used as a reference for comparison with the situation during or after the excavations (e.g., volume of material removed).
- Stage 3 (S3): The third stage is focused on documentation of the test excavation (SL2) during the archaeological work and at an upper scale level (SL3) after the discovery of special elements found in the test excavation, such as burials. As described previously, these scenes cover several square meters. Therefore, this stage is implemented when the work developed in each test excavation is in progress.
- Stage 4 (S4): Finally, the fourth stage (T4 in Figure 1) is related to the documentation of the final situation of the excavation and includes two scale levels, the test excavation (SL2) (in situ) and the artifacts of interest (SL4) found during the archaeological intervention (in the office).
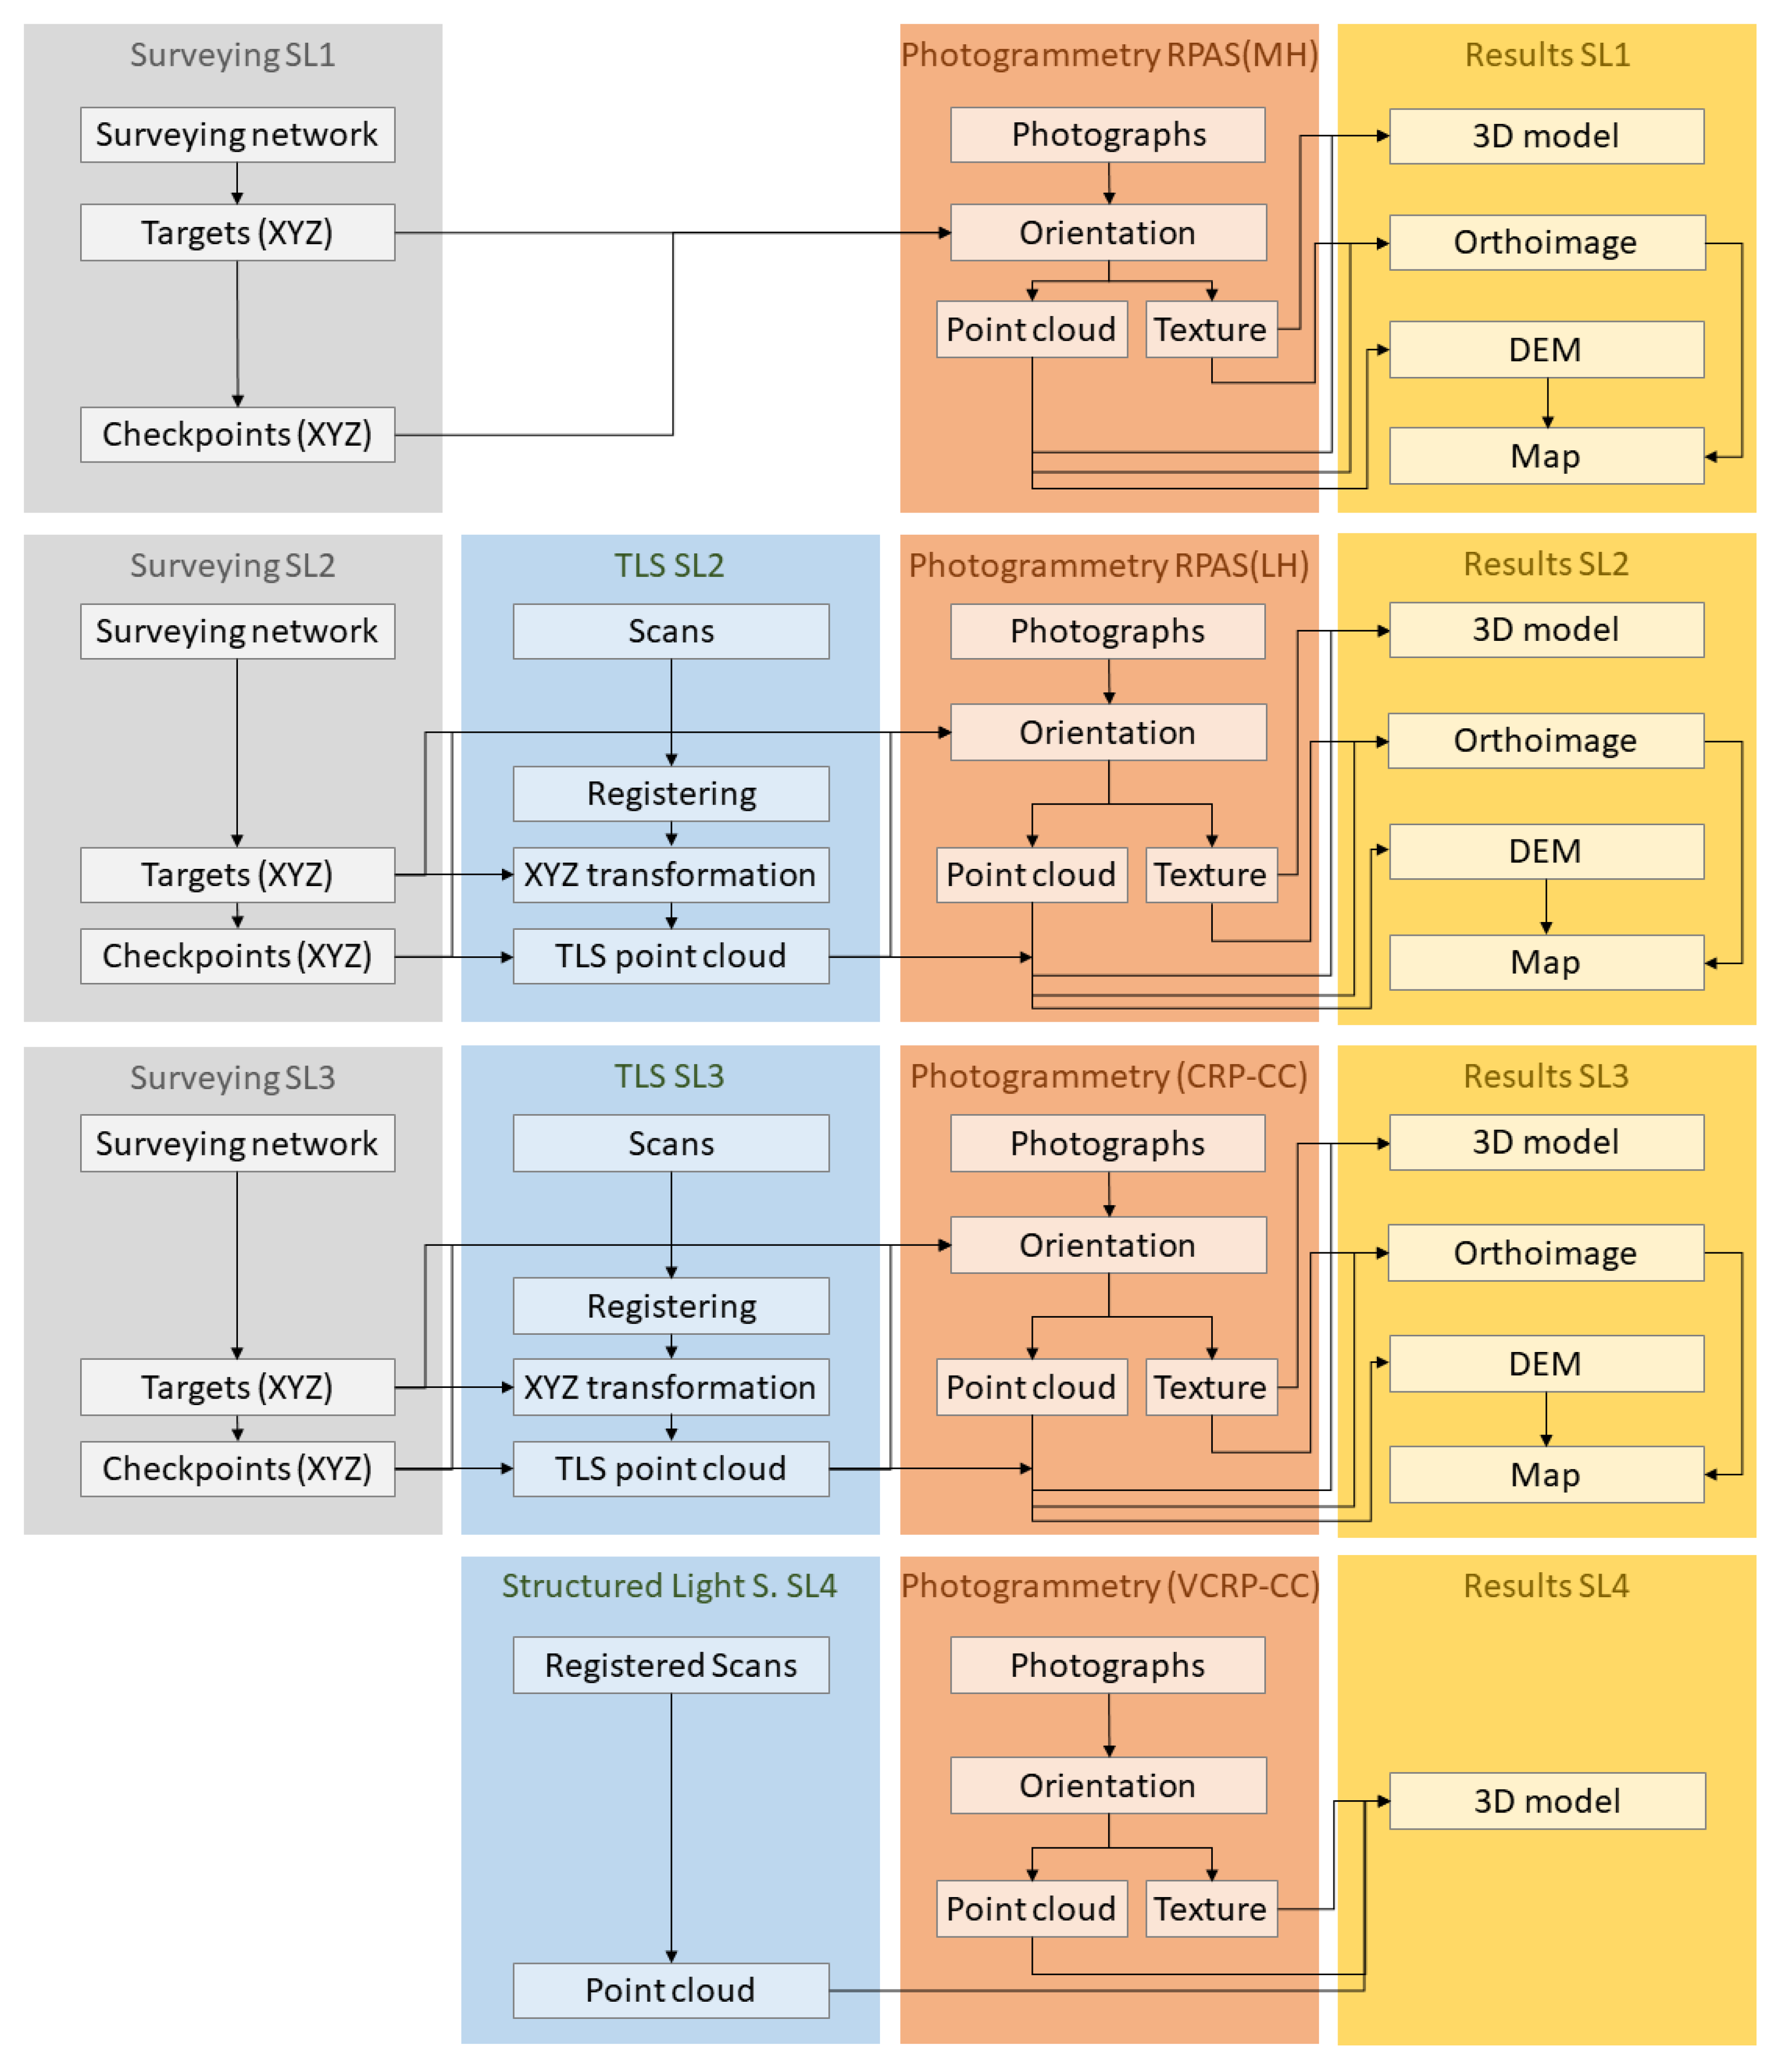
- SL1: First, we consider a general documentation of the site before the development of archaeological work, based on RPAS photogrammetry (Figure 2). In this case, we consider a medium flight height, to guarantee the acquisition of photographs and taking into account the GSD suggested in Table 1. A flight plan has to be defined considering all photogrammetric aspects (area, flight height, overlaps, focal length, GSD, etc.). We suggest the use of any software tool developed for this purpose, such as that described by Gómez-López et al. [64], to plan flights in complex scenarios. The processing includes the orientation of the photographs, and obtaining the point cloud and the texture. The results include various cartographic products to be used as a reference for the rest of the stages, such as the 3D models (including texture), orthoimages, DEMs, and maps.
- SL2: The scale level of test excavation is considered during several stages (S2–S4). In this case, we select TLS and photogrammetry using a RPAS to execute an aerial survey at a low flight height (Figure 2), to guarantee a complete coverture and the GSD requirement indicated in Table 1. The applications of TLS and photogrammetry are related, because the TLS products are complementary to the photogrammetric data, for obtaining complete documentation of the entire scene. The goal of TLS is to obtain the scene geometry and georeference the photogrammetric block, while the goal of photogrammetry is to obtain the geometry and texture for modelling. As a consequence, we suggest the use of TLS without RGB capture, in order to improve the acquisition efficiency. The location of the TLS stations must guarantee a complete coverage of the area, considering overlaps between adjacent point clouds, in order to ease the registering procedures. The point density should consider the requirements of the project and the need for high definition for the targets, in order to facilitate their identification in the point clouds. The TLS processing includes the registering of all point clouds to obtain a complete cloud and the XYZ transformation of this point cloud considering various points (targets). On the other hand, the photogrammetric process starts with the acquisition of photographs following a predetermined flight plan. Previous data (e.g., DEM) can be used to adjust the flight to the conditions and complexity of the scene [64]. The acquisition includes a complete set of normal-case vertical photographs and some oblique photographs, added to ensure complete scene coverage (e.g., to capture vertical elements). The orientation of the photographs and camera calibration are based on a set of well-distributed control points (targets), whose coordinates are extracted from the TLS point cloud (or occasionally from surveying) and also checked using some additional points. After orientation of the photographs, a dense point cloud can be obtained by photogrammetry and can be compared to that obtained with TLS, to check for the presence of gaps. In this case, the photogrammetric point cloud is updated by adding the points from the TLS related to the missing zones. It should be noted that all points must contain information about the normal vector. Subsequently, the texture is obtained from the oriented photographs. As a result, we obtain 3D models (including texture), orthoimages, DEMs, and maps of the excavation test.
- SL3: This scale level includes the geometric documentation of some interesting elements found during the development of the archaeological field work (stage S3), such as burials. At this scale level, we select TLS and photogrammetry (Figure 2). As above, TLS is used to geometrically complement the data obtained from photogrammetry and to georeference the photogrammetric block. The scanning stations must be distributed around the element to be documented, and the acquisition must consider a higher density of points than in the previous case. The TLS processing is similar to the previous case. On the other hand, the photogrammetry is based on photographs obtained with a conventional camera mounted with normal lens and occasionally with macro lens, to capture details. The survey should be developed following the recommendations of the International Committee of Architectural Photogrammetry (CIPA) for architectural photogrammetric projects using non-metric cameras (known as 3 × 3 rules) [65,66]. These rules include photographic all-around coverage, which involves taking a ring of images around the object, with these images overlapping each other by more than 50% [65,66]. The orientation of photographs and camera calibration procedures are based on various control points, with coordinates obtained from the TLS. We also verify these processes using checkpoints obtained from both sources. As in the previous case, the photogrammetric point cloud is obtained by updating possible gaps using points extracted from the TLS. All points contain information about the normal vector. After that, the texture is calculated using the oriented photographs. The products obtained at this scale level are also 3D models, orthoimages, DEMs, and maps.
- SL4: The last scale level is developed in the office (stage S4) under controlled conditions using a structured-light scanner and very close-range photogrammetry (V-CRP) (Figure 2). Artifact scanning is developed using a turntable with coded targets, which facilitates the point alignment for obtaining a high density point cloud of the artifact. In the case of photogrammetry, we use a conventional camera mounted with a macro lens. The artifacts found during the archaeological field work are placed on a remotely controlled turntable that is inside a light box, providing diffuse illumination. We must develop several rings of images (blocks) [65,66] by moving the artifact after the acquisition of each block, in order to achieve full coverage of the object. The orientation of each block of photographs and camera calibration are developed using a set of targets with known coordinates located at the base of where the artifact is situated. The orientation between blocks is developed using common keypoints. After these procedures, we obtain a point cloud including information of normal vectors and a texture referenced in the same CRS. Both point clouds (scanning and photogrammetry) can be used individually or combined after referencing them in the same CRS. As in the previous cases, the texture is always obtained from the photogrammetry. The product obtained at this scale level is a 3D model of the artifacts with real texture.
3. Application
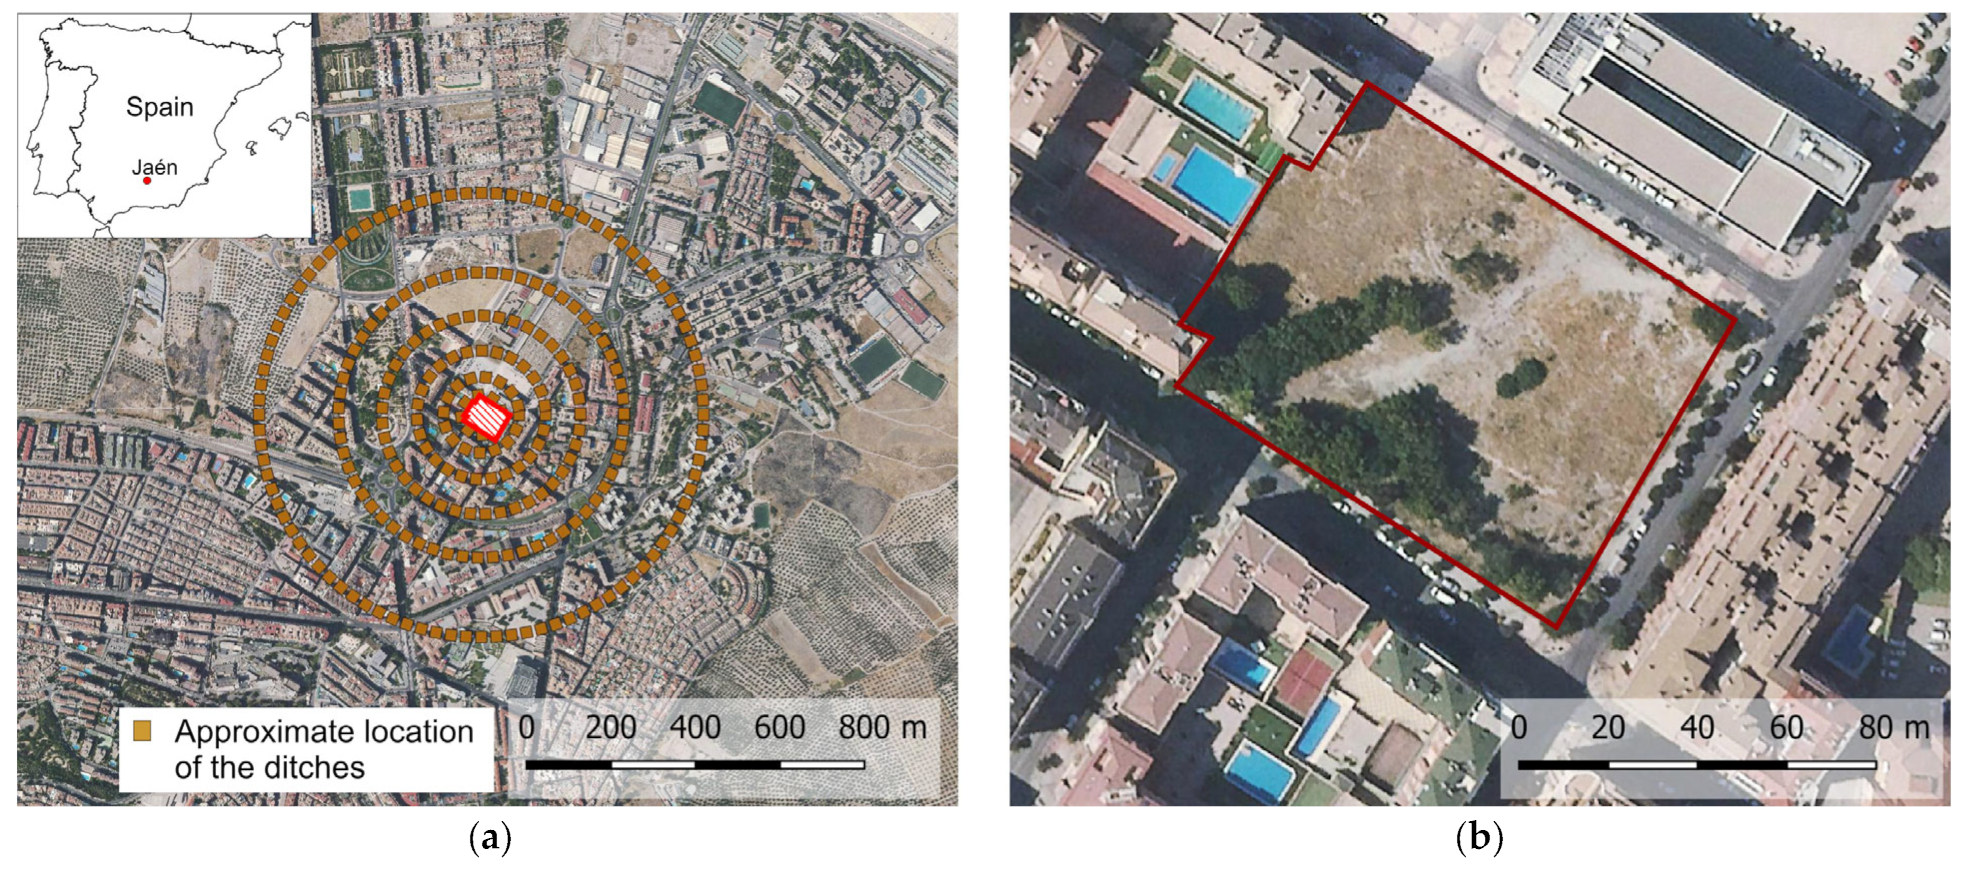
- SL1: At this scale level, we developed a preliminary photogrammetric survey (S1) using an RPAS (DJI Phantom 4 RTK). In this application, we followed a predefined flight plan calculated to cover the whole scene with a medium flight height and thus obtain a GSD of about 1 cm. After acquisition, all photographs were processed using Agisoft Metashape software. The orientation procedure was initially based on camera positions obtained from the GNSS-RTK sensor integrated into the RPAS, and subsequently this orientation was improved using several control points that were well-distributed throughout the area, as well as camera calibration, obtaining accuracies of about one centimeter based on the checkpoints. The coordinates of the control points and checkpoints were obtained from a GNSS RTK survey using a Topcon Hiper HR receiver. After orientation, we obtained a dense point cloud containing normal-vector information and a related texture. As a result, we obtained a 3D mesh, a 3D model (including texture), an orthoimage, a DEM, and a map of the archaeological area.
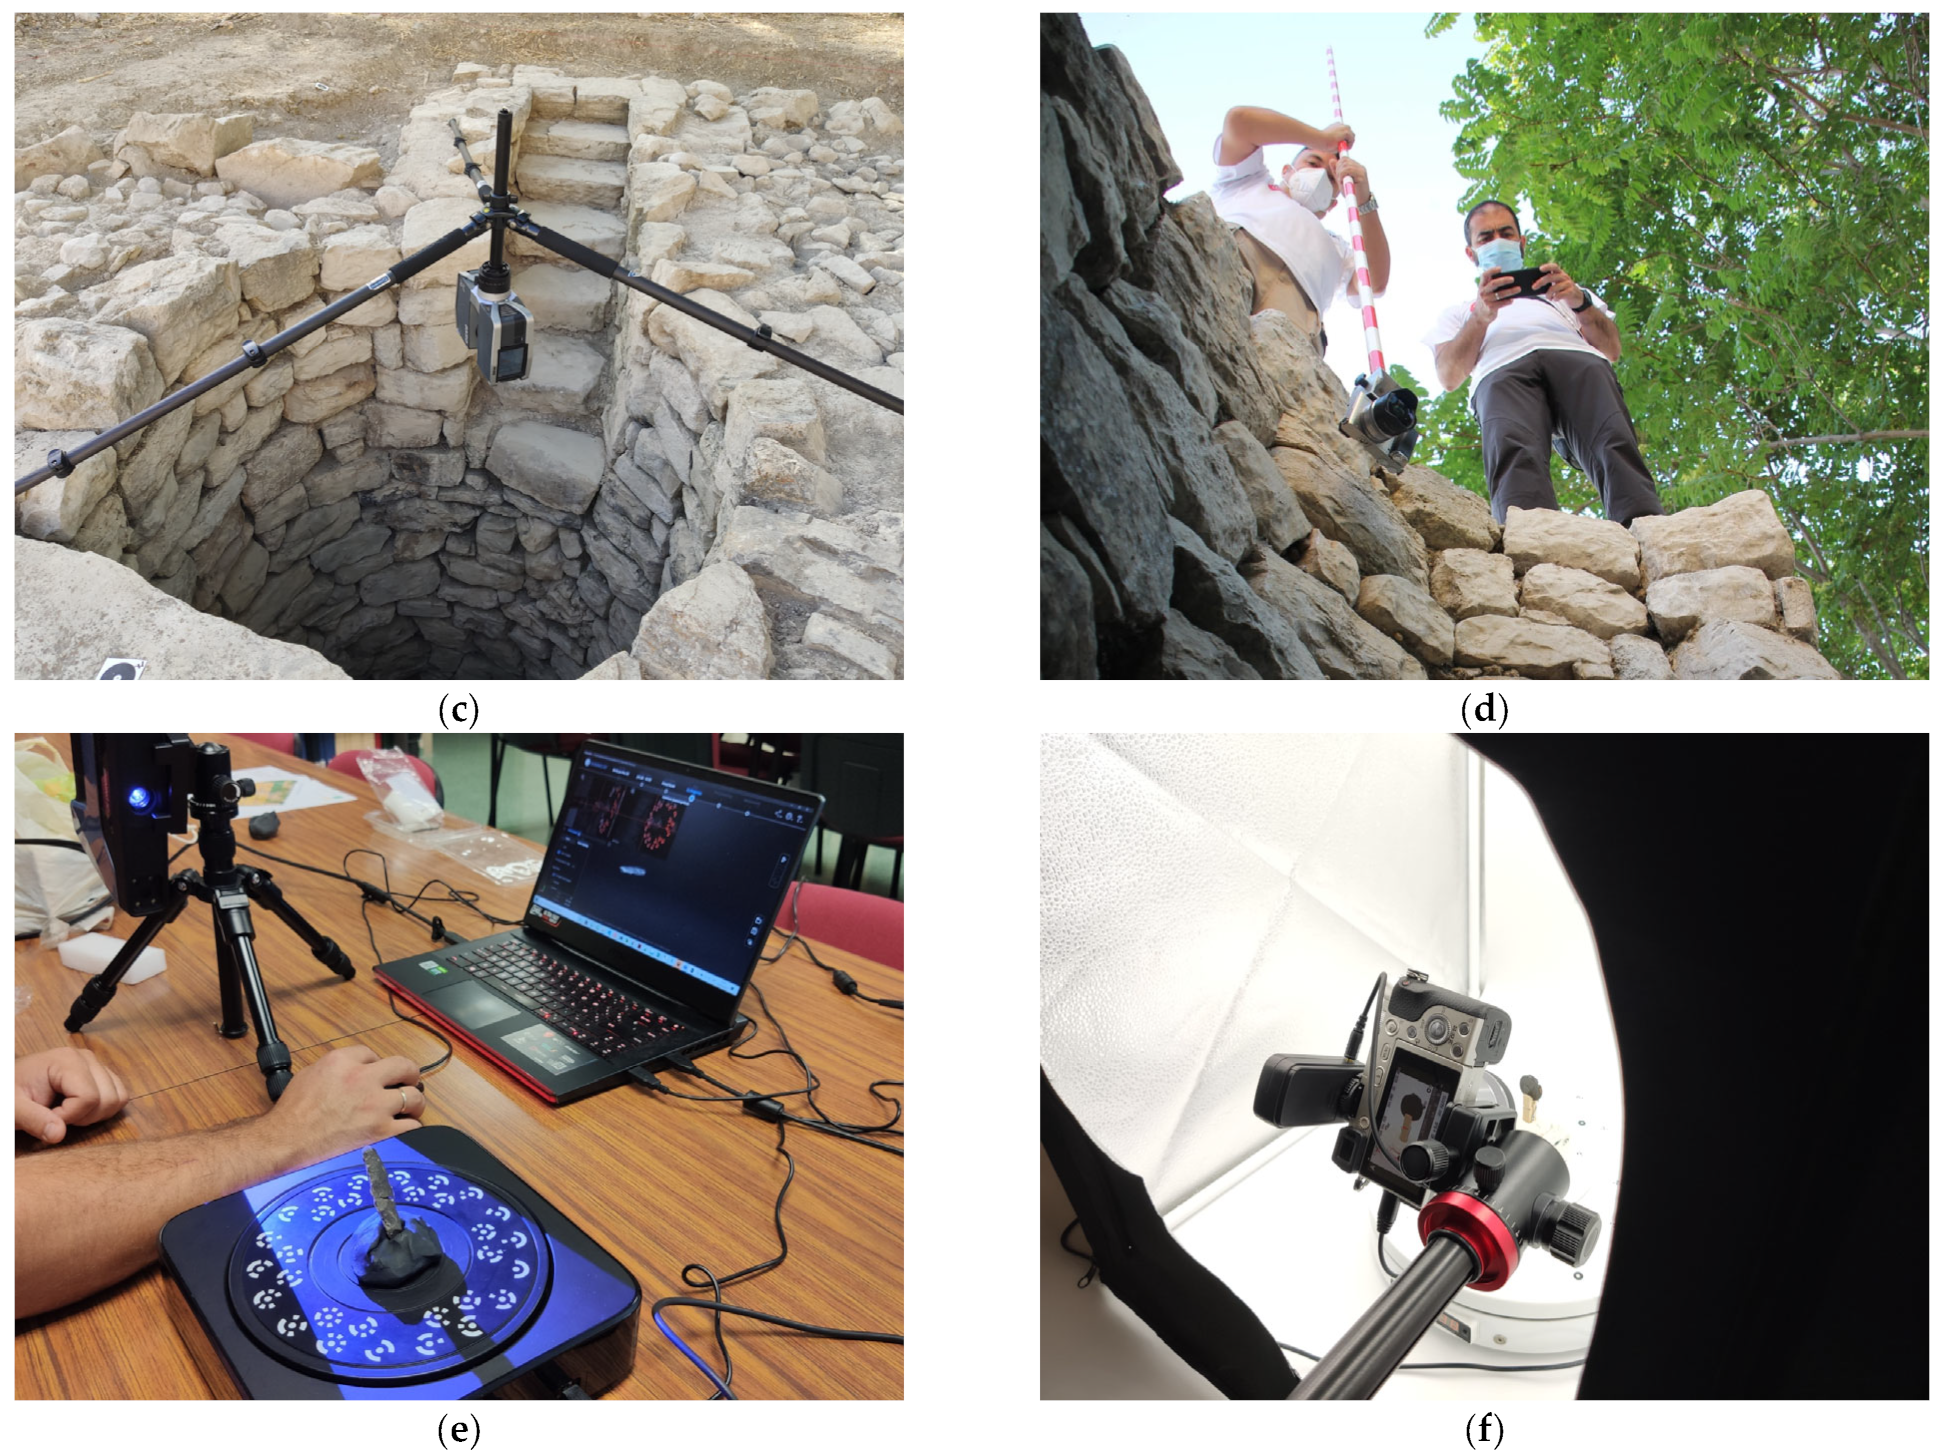
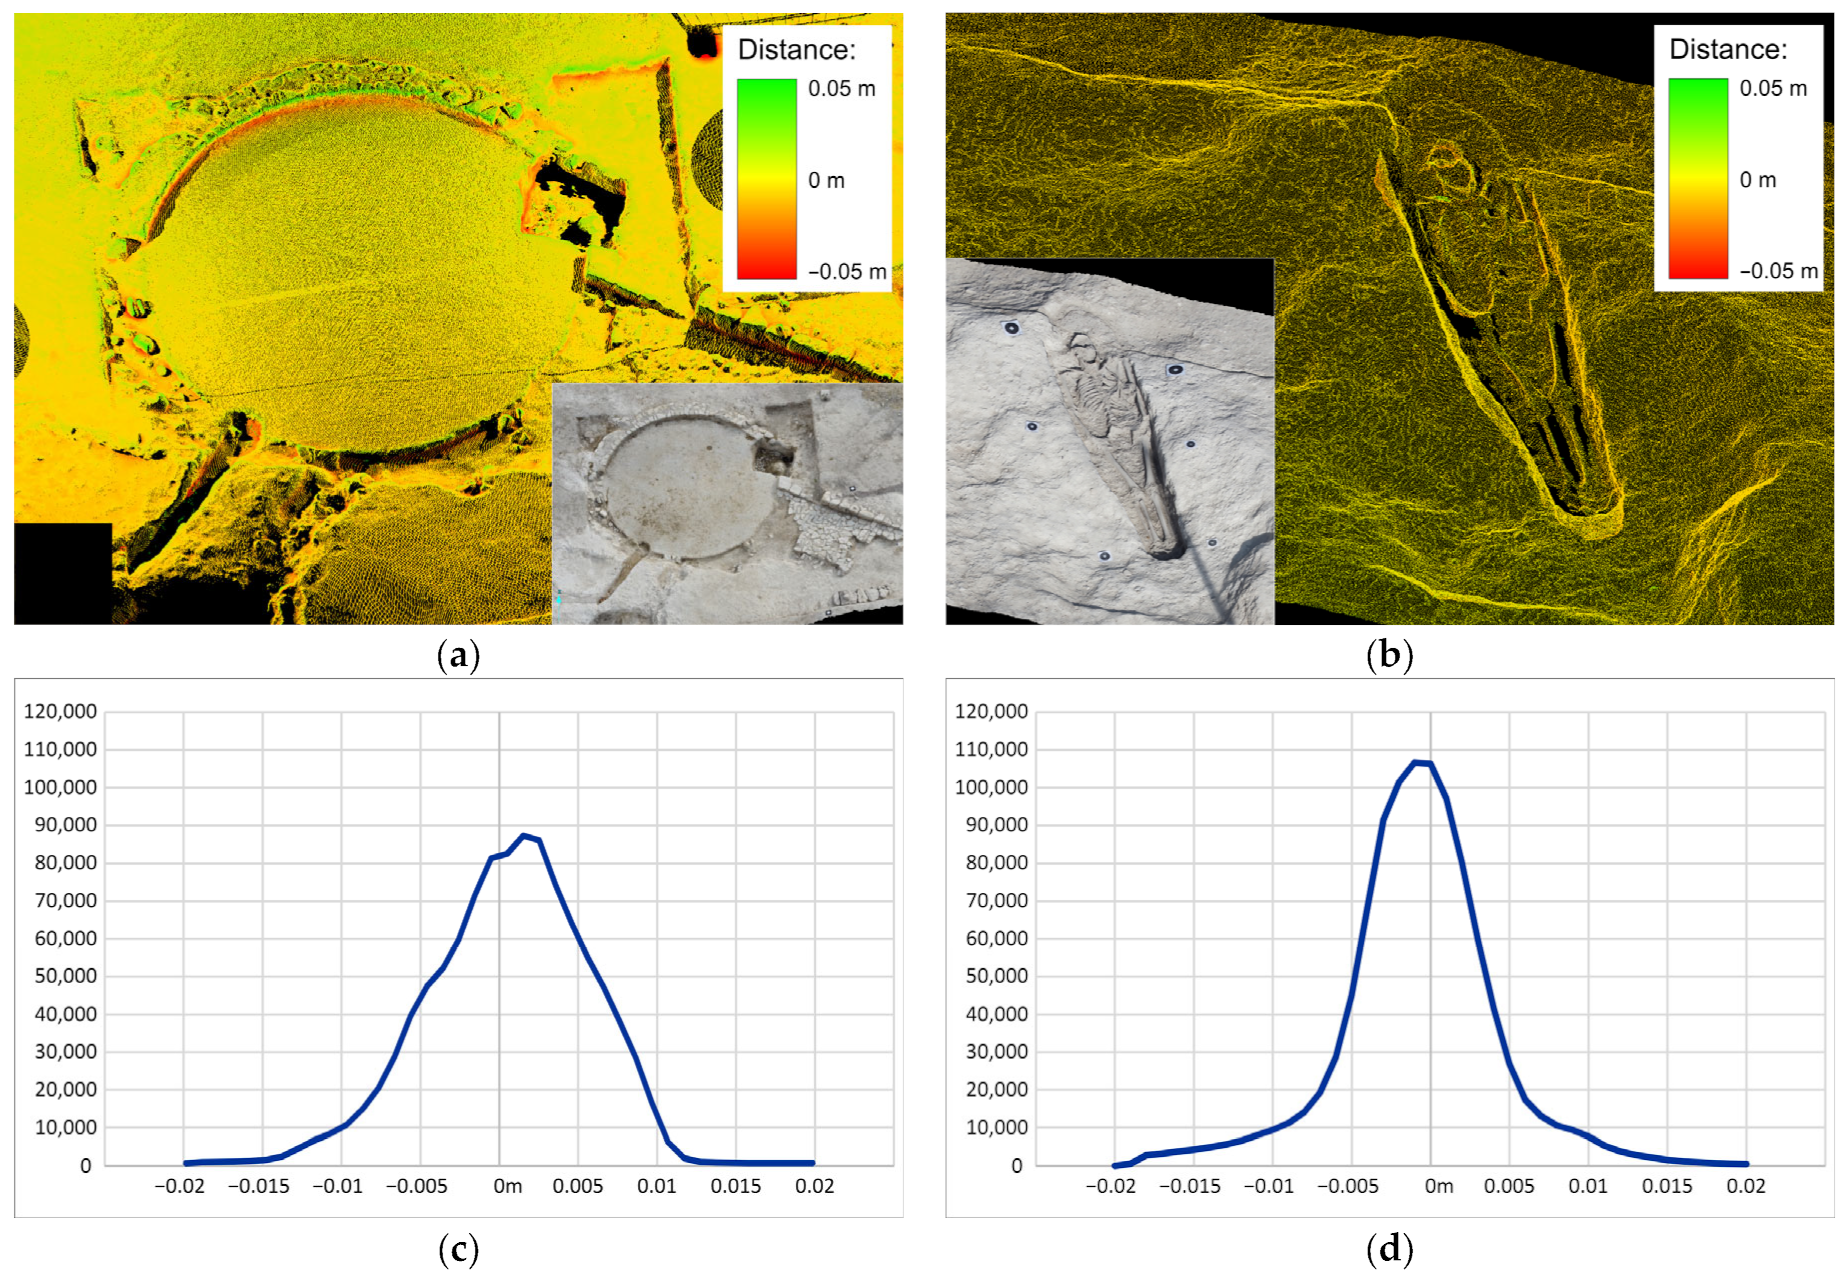
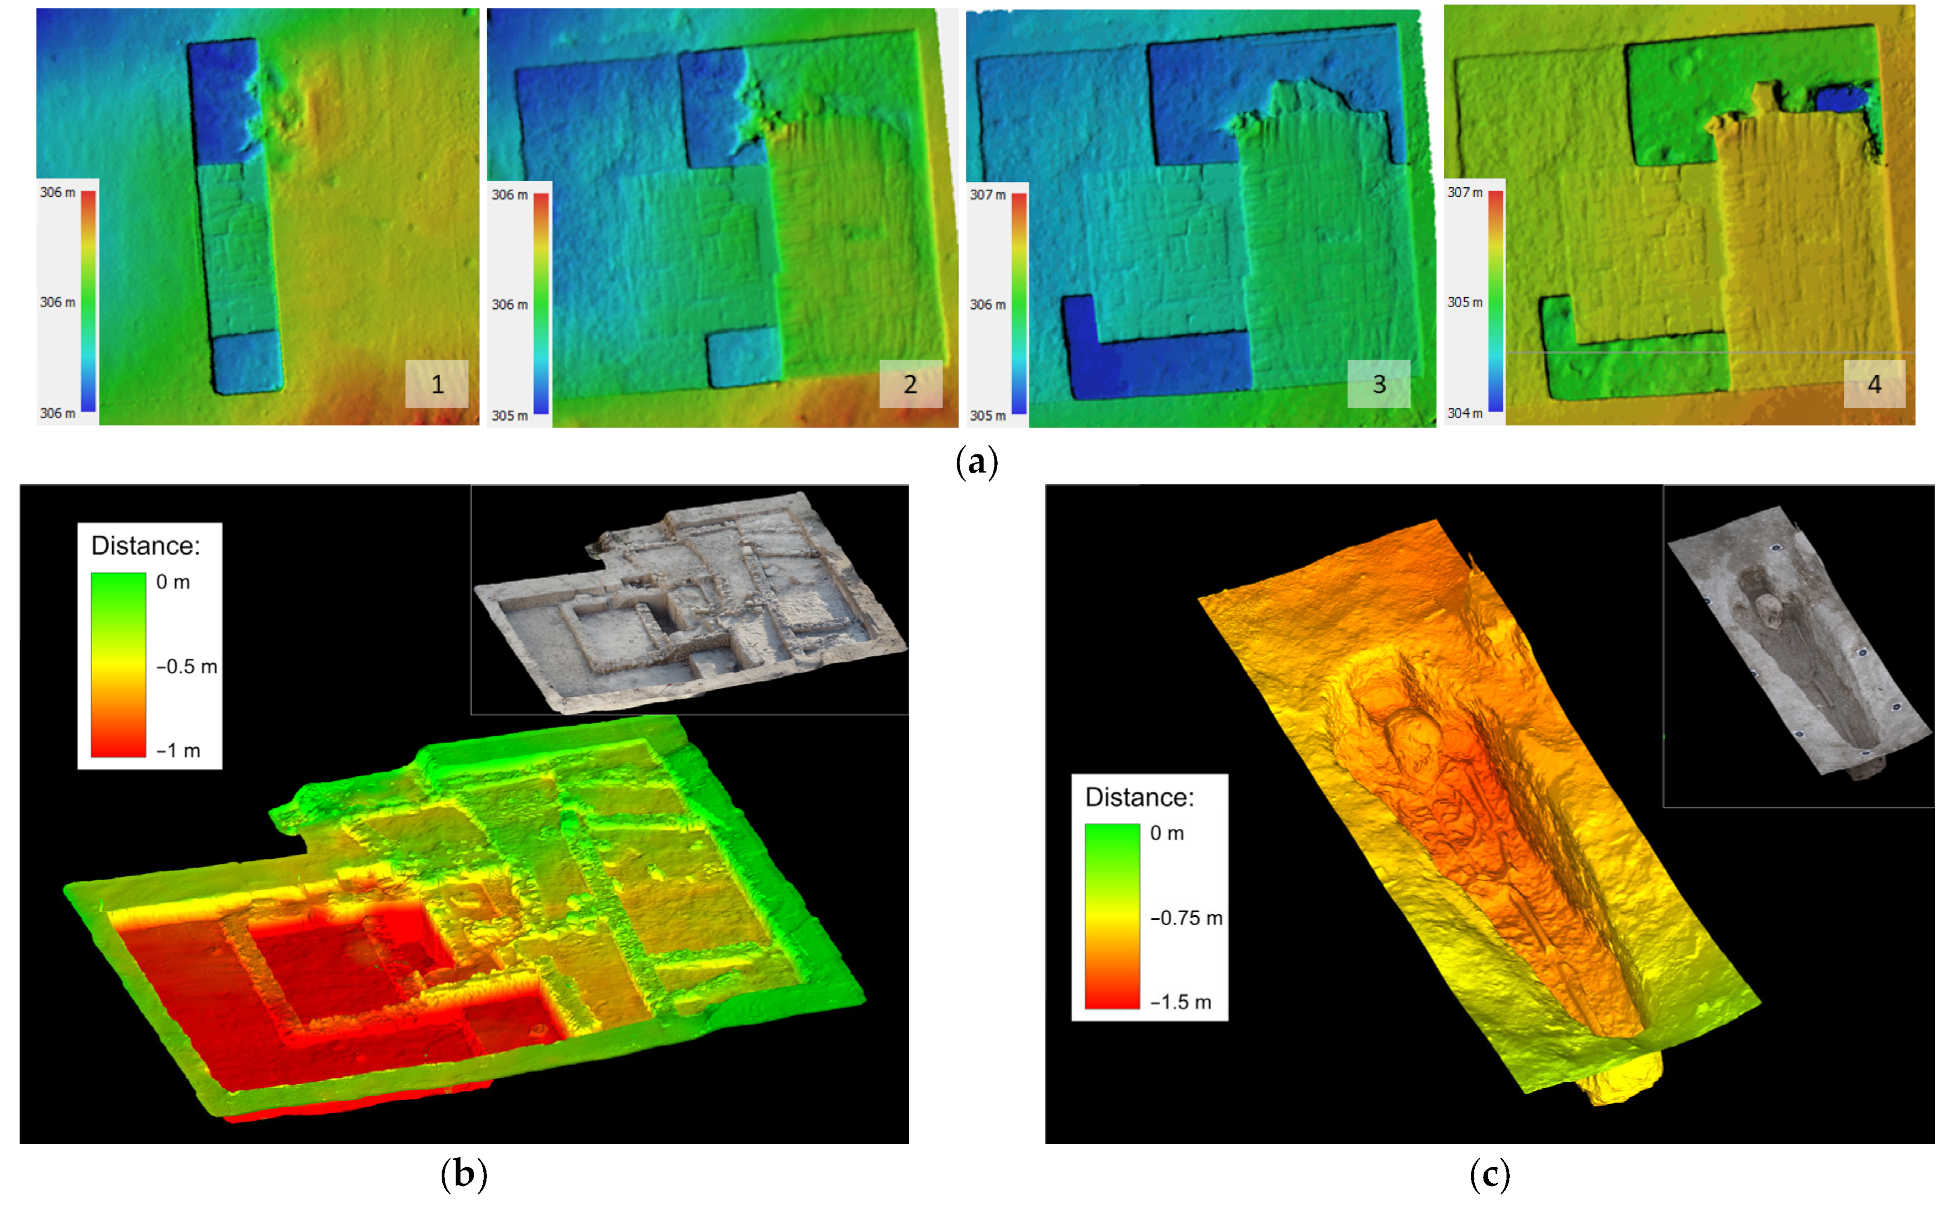
- SL2: This scale level included at least two stages of acquisition, before and after the archeological field work developed in each test excavation (S2 and S4), although in most cases (depending on the necessity for archaeological documentation) we also included surveys during the archaeological work (S3). The application related to SL2 included two geomatic techniques (Figure 4a): The TLS was based on a Faro Focus X130 scanner and the aerial photogrammetry was developed using an RPAS (DJI mini) to survey the scene at a low flight height (about 5 m). The use of this type of RPAS was justified considering the size at this scale level, the GSD demanded, the complexity of the scene, and the features of sensors usually mounted on these platforms. The point density selected for TLS acquisition (about 12 mm at 10 m) was related to the required final density (see Table 1) (considering overlaps between adjacent scans) and the need to capture targets with a certain level of detail, in order to obtain their coordinates properly. The TLS point cloud was obtained after the relative registering of all points clouds determined at all the scanning stations, which were well-distributed throughout the area, with the aim of covering it completely. After the relative registering of point clouds, a 3D transformation considering several targets (at least four) was developed, to obtain the final TLS point cloud that referred to the CRS of the project, obtaining accuracies of about 3 mm. The coordinates of the targets were obtained using a Leica TCRA1203 total station from the points of the local surveying network. These targets were permanently installed for use during the intervention (S2–S4), in order to reduce surveying tasks. On the other hand, the photogrammetric processing included the orientation of photographs and obtaining the point cloud and texture. These procedures were carried out using Agisoft Metashape software, obtaining accuracies of about 5 mm (based on a set of checkpoints). After the updating of the photogrammetric point cloud, we obtained several products (a complete 3D mesh, a 3D model (including texture), orthoimages, a DEM, and a map).
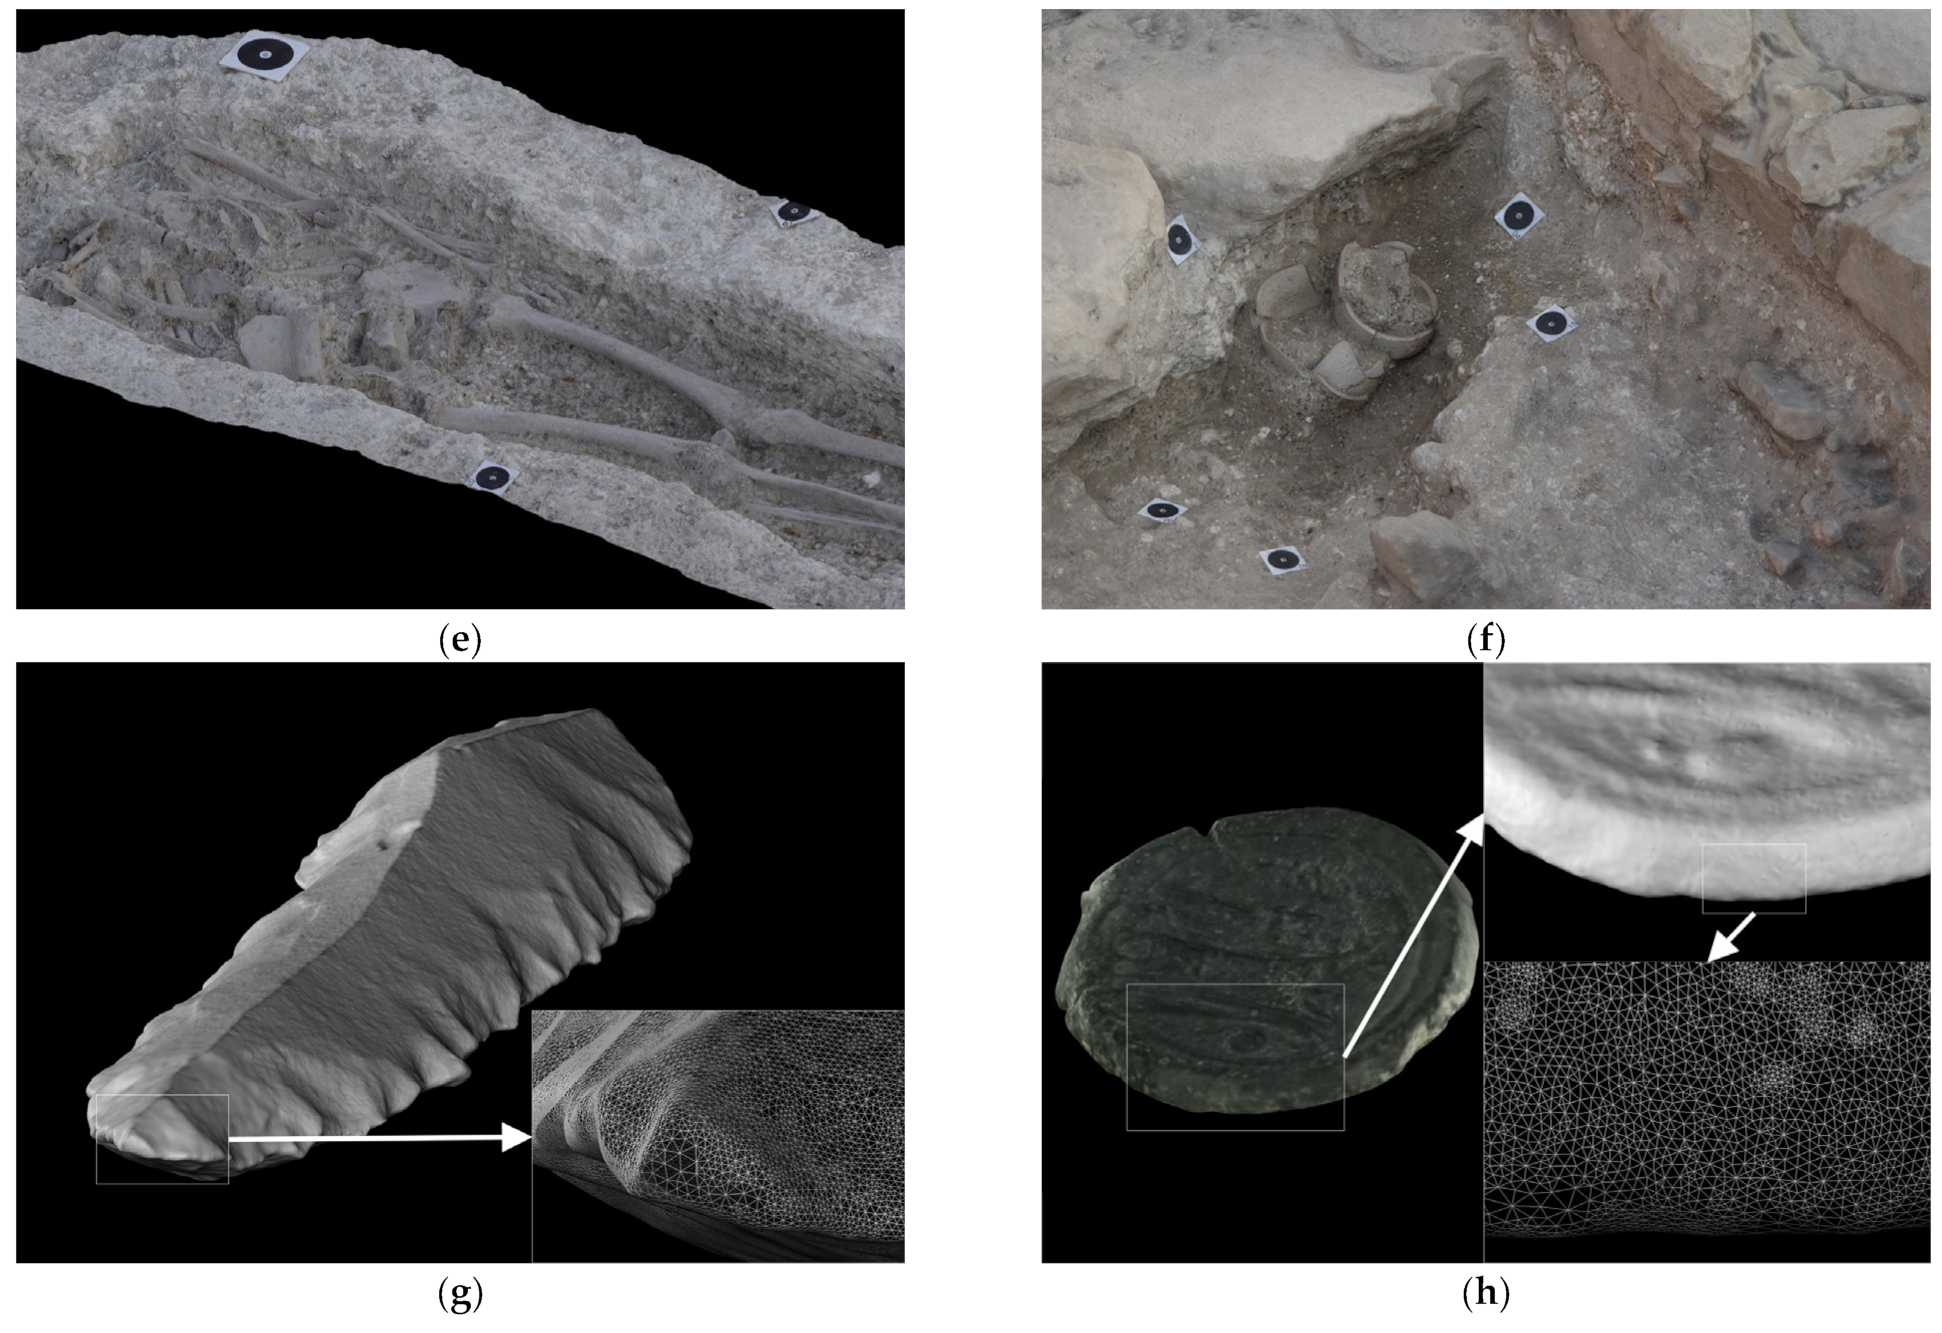
- SL3: This scale level included the geometric documentation of some interesting elements found during the development of the archaeological field work (stage S3), such as burials (Figure 4b). At this scale level (SL3), we used TLS and photogrammetry (Figure 4c,d). The TLS survey was based on a Faro Focus X130 scanner. The scanning stations were distributed around the element to be documented, obtaining high-density point clouds (density of 7 mm at 10 m). The registering was carried out relatively (cloud to cloud), obtaining a common point cloud. After that, we transformed this point cloud into the CRS of the project using a set of control points. On the other hand, the photogrammetry was based on photographs obtained with a conventional camera (Sony Alpha 6000) mounted with a normal lens (focal length of 30 mm) and occasionally with macro lens (focal length of 50 mm) to capture details. We included the acquisition of both normal-case and convergent photographs, covering the entire scene. In this sense, we used a mast to support the camera and a remote control to manage the framing and shooting of the camera. The orientation of photographs and camera calibration procedures were based on several control points with coordinates obtained from the TLS, and we verified these processes using other checkpoints. In this sense, the orientation procedure, carried out using Agisoft Metashape software, achieved accuracies of about 2 mm. Subsequently, a photogrammetric point cloud was obtained by updating possible gaps using points extracted from the TLS. The products obtained during this stage were also 3D models, orthoimages, DEMs, and maps.
- SL4: The application of the last scale level was developed in the office (stage S4) using a structured-light scanner (3D Einscan Pro) (Figure 4e) and very close-range photogrammetry (V-CRP) using a conventional camera (Sony Alpha 6000) mounted with a macro lens (focal length of 50 mm) (Figure 4f). We obtained a high density point cloud of each artifact using both techniques, and the texture was obtained from photogrammetry. The results included a 3D model of each artifact.
4. Results and Discussion
5. Conclusions
Author Contributions
Funding
Data Availability Statement
Conflicts of Interest
References
- Lambers, K.; Remondino, F. Optical 3D measurement techniques in archaeology: Recent developments and applications. In Proceedings of the 35th International Conference on Computer Applications and Quantitative Methods in Archaeology, Berlin, Germany, 2–6 April 2007. [Google Scholar]
- Chiabrando, F.; Di Lolli, A.; Patrucco, G.; Spanò, A.; Sammartano, G.; Teppati Losè, L. Multitemporal 3D modelling for cultural heritage emergency during seismic events: Damage assesment of S. Agostino Church in Amatrice (RI). Int. Arch. Photogramm. Remote Sens. Spat. Inf. Sci. 2017, 42, W1. [Google Scholar] [CrossRef]
- Martínez-Fernández, A.; Benito-Calvo, A.; Campaña, I.; Ortega, A.I.; Karampaglidis, T.; de Castro, J.M.B.; Carbonell, E. 3D monitoring of Paleolithic archaeological excavations using terrestrial laser scanner systems (Sierra de Atapuerca, Railway Trench sites, Burgos, N Spain). Digit. Appl. Archaeol. Cult. Herit. 2020, 19, e00156. [Google Scholar] [CrossRef]
- Pérez-García, J.L.; Mozas-Calvache, A.T.; Gómez-López, J.M.; Jiménez-Serrano, A. Modelling the Evolution of the Archaeological Works Developed in Qubbet El-Hawa (Aswan, Egypt). Int. Arch. Photogramm. Remote Sens. Spat. Inf. Sci. 2021, 43, 899–906. [Google Scholar] [CrossRef]
- Ogleby, C.L.; Papadaki, H.; Robson, S.; Shortis, M.R. Comparative camera calibrations of some “off the shelf” digital cameras suited to archaeological purposes. Int. Arch. Photogramm. Remote Sens. 1999, XXXII-5/W11, 69–75. [Google Scholar]
- Celikoyan, T.M.; Altan, M.O.; Kemper, G.; Toz, G. Calibrating and using an Olympus camera for balloon photogrammetry. In Proceedings of the XIXth International Symposium-CIPA 2003, Antalya, Turkey, 30 September–4 October 2003. [Google Scholar]
- Cardenal, J.; Mata, E.; Castro, P.; Delgado, J.; Hernandez, M.A.; Pérez, J.L.; Ramos, M.; Torres, M. Evaluation of a digital non metric camera (Canon D30) for the photogrammetric recording of historical buildings. Int. Arch. Photogramm. Remote Sens. Spat. Inf. Sci. 2004, XXXV-B5, 564–569. [Google Scholar]
- Chandler, J.H.; Fryer, J.G.; Jack, A. Metric capabilities of low-cost digital cameras for close range surface measurement. Photogramm. Rec. 2005, 20, 12–26. [Google Scholar] [CrossRef]
- Covas, J.; Ferreira, V.; Mateus, L. 3D reconstruction with fisheye images strategies to survey complex heritage buildings. In Proceedings of the Digital Heritage 2015, Granada, Spain, 28 September–2 October 2015. [Google Scholar]
- Fiorillo, F.; Limongiello, M.; Fernández-Palacios, B.J. Testing GoPro for 3D model reconstruction in narrow spaces. Acta IMEKO 2016, 5, 64–70. [Google Scholar] [CrossRef]
- Barazzetti, L.; Previtali, M.; Roncoroni, F. 3D Modelling with the Samsung Gear 360. Int. Arch. Photogramm. Remote Sens. Spat. Inf. Sci. 2017, XLII-2-W3, 85–90. [Google Scholar] [CrossRef]
- Barazzetti, L.; Previtali, M.; Roncoroni, F. Fisheye lenses for 3D modeling: Evaluations and considerations. Int. Arch. Photogramm. Remote Sens. Spat. Inf. Sci. 2017, XLII-2/W3, 79–84. [Google Scholar] [CrossRef]
- Barazzetti, L.; Previtali, M.; Roncoroni, F. 3D modeling with 5K 360° videos. Int. Arch. Photogramm. Remote Sens. Spat. Inf. Sci. 2022, XLVI-2/W1-2022, 65–71. [Google Scholar] [CrossRef]
- Perfetti, L.; Polari, C.; Fassi, F. Fisheye Photogrammetry: Tests and Methodologies for the Survey of Narrow Spaces. Int. Arch. Photogramm. Remote Sens. Spat. Inf. Sci. 2017, XLII-2/W3, 573–580. [Google Scholar] [CrossRef]
- Perfetti, L.; Fassi, F. Handheld fisheye multicamera system: Surveying meandering architectonic spaces in open-loop mode—Accuracy assessment. Int. Arch. Photogramm. Remote Sens. Spat. Inf. Sci. 2022, XLVI-2/W1-2022, 435–442. [Google Scholar] [CrossRef]
- Colomina, I.; Molina, P. Unmanned aerial systems for photogrammetry and remote sensing: A review. ISPRS J. Photogramm. Remote Sens. 2014, 92, 79–97. [Google Scholar] [CrossRef]
- Nex, F.; Remondino, F. UAV for 3D mapping applications: A review. Appl. Geomat. 2014, 6, 1–15. [Google Scholar] [CrossRef]
- Campana, S. Drones in Archaeology. State-of-the-art and Future Perspectives. Archaeol. Prospect. 2017, 24, 275–296. [Google Scholar] [CrossRef]
- Georgopoulos, A.; Karras, G.E.; Makris, G.N. The photogrammetric survey of a prehistoric site undergoing removal. Photogramm. Rec. 2003, 16, 443–456. [Google Scholar] [CrossRef]
- Mozas-Calvache, A.T.; Pérez-García, J.L.; Cardernal-Escarcena, F.J.; Delgado, J.; Mata de Castro, E. Comparison of Low Altitude Photogrammetric Methods for Obtaining Dems and Orthoimages of Archaeological Sites. Int. Arch. Photogramm. Remote Sens. Spat. Inf. Sci. 2012, XXXIX-B5, 577–581. [Google Scholar] [CrossRef]
- Martínez, S.; Ortiz, J.; Gil, M.L.; Rego, M.T. Recording complex structures using close range photogrammetry: The cathedral of Santiago de Compostela. Photogramm. Rec. 2013, 28, 375–395. [Google Scholar] [CrossRef]
- Ortiz, J.; Gil, M.L.; Martínez, S.; Rego, T.; Meijide, G. Three-dimensional Modelling of Archaeological Sites Using Close-range Automatic Correlation Photogrammetry and Low-altitude Imagery. Archaeol. Prospect. 2013, 20, 205–217. [Google Scholar] [CrossRef]
- Blockley, P.; Morandi, S. The recording of two late Roman towers, Archaeological Museum, Milan 3D documentation and study using image-based modelling. In Proceedings of the Digital Heritage 2015, Granada, Spain, 28 September–2 October 2015. [Google Scholar]
- Pérez-García, J.L.; Mozas-Calvache, A.T.; Gómez-López, J.M.; Jiménez-Serrano, A. Three-dimensional modelling of large archaeological sites using images obtained from masts. Application to Qubbet el-Hawa site (Aswan, Egypt). Archaeol. Prospect. 2018, 26, 121–135. [Google Scholar] [CrossRef]
- Gómez-Lahoz, J.G.; González-Aguilera, D. Recovering traditions in the digital era: The use of blimps for modelling the archaeological cultural heritage. J. Archaeol. Sci. 2009, 36, 100–109. [Google Scholar] [CrossRef]
- Mozas-Calvache, A.T.; Pérez-García, J.L.; Cardenal-Escarcena, F.J.; Mata-Castro, E.; Delgado-García, J. Method for photogrammetric surveying of archaeological sites with light aerial platforms. J. Archaeol. Sci. 2012, 39, 521–530. [Google Scholar] [CrossRef]
- Brutto, M.L.; Meli, P. Computer vision tools for 3D modelling in archaeology. Int. J. Herit. Digit. Era 2012, 1, 1–6. [Google Scholar] [CrossRef]
- McCarthy, J. Multi-image photogrammetry as a practical tool for cultural heritage survey and community engagement. J. Archaeol. Sci. 2014, 43, 175–185. [Google Scholar] [CrossRef]
- Ullman, S. The interpretation of structure from motion. Proc. R. Soc. B 1979, 203, 405–426. [Google Scholar]
- Koenderink, J.J.; Van Doorn, A.J. Affine structure from motion. J. Opt. Soc. Am. A 1991, 8, 377–385. [Google Scholar] [CrossRef]
- Lowe, D.G. Distinctive image features from scale-invariant keypoints. Int. J. Comput. Vis. 2004, 60, 91–110. [Google Scholar] [CrossRef]
- Szeliski, R. Computer Vision: Algorithms and Applications; Springer: London, UK, 2011. [Google Scholar]
- Scharstein, D.; Szeliski, R. A taxonomy and evaluation of dense two-frame stereo correspondence algorithms. Int. J. Comput. Vis. 2002, 47, 7–42. [Google Scholar] [CrossRef]
- Seitz, S.M.; Curless, B.; Diebel, J.; Scharstein, D.; Szeliski, R. A comparison and evaluation of multi-view stereo reconstruction algorithms. In Proceedings of the IEEE Computer Society Conference on Computer Vision and Pattern Recognition, New York, NY, USA, 17–22 June 2006. [Google Scholar]
- Furukawa, Y.; Hernández, C. Multi-view stereo: A tutorial. Found. Trends Comput. Graph. Vis. 2015, 9, 1–148. [Google Scholar] [CrossRef]
- Westoby, M.J.; Brasington, J.; Glasser, N.F.; Hambrey, M.J.; Reynolds, J.M. ‘Structure-from-Motion’ photogrammetry: A low-cost, effective tool for geoscience applications. Geomorphology 2012, 179, 300–314. [Google Scholar] [CrossRef]
- Risbøl, O.; Gustavsen, L. LiDAR from drones employed for mapping archaeology–Potential, benefits and challenges. Archaeol. Prospect. 2018, 25, 329–338. [Google Scholar] [CrossRef]
- Casana, J.; Laugier, E.J.; Hill, A.C.; Reese, K.M.; Ferwerda, C.; McCoy, M.D.; Ladefoged, T. Exploring archaeological landscapes using drone-acquired LiDAR: Case studies from Hawai’i, Colorado, and New Hampshire, USA. J. Archaeol. Sci. Rep. 2021, 39, 103133. [Google Scholar] [CrossRef]
- Coluzzi, R.; Lanorte, A.; Lasaponara, R. On the LiDAR contribution for landscape archaeology and palaeoenvironmental studies: The case study of Bosco dell’Incoronata (Southern Italy). Adv. Geosci. 2010, 24, 125–132. [Google Scholar] [CrossRef]
- Canuto, M.A.; Estrada-Belli, F.; Garrison, T.G.; Houston, S.D.; Acuña, M.J.; Kováč, M.; Marken, D.; Nondédéo, P.; Auld-Thomas, L.; Castanet, C.; et al. Ancient lowland Maya complexity as revealed by airborne laser scanning of northern Guatemala. Science 2018, 361, eaau0137. [Google Scholar] [CrossRef]
- Ahmon, J. The application of short-range 3D laser scanning for archaeological replica production: The Egyptian tomb of Seti I. Photogramm. Rec. 2004, 19, 111–127. [Google Scholar] [CrossRef]
- Fernández-Palacios, B.J.; Rizzi, A.; Remondino, F. Etruscans in 3D-Surveying and 3D modeling for a better access and understanding of heritage. Virtual Archaeol. Rev. 2013, 4, 85–89. [Google Scholar] [CrossRef]
- Nabil, M.; Betrò, M.; Metwallya, M.N. 3D reconstruction of ancient Egyptian rockcut tombs: The case of Midan 05. Int. Arch. Photogramm. Remote Sens. Spat. Inf. Sci. 2013, XL-5/W2, 443–447. [Google Scholar] [CrossRef]
- De Lima, R.; Vergauwen, M. From TLS recoding to VR environment for documentation of the Governor’s Tombs in Dayr al-Barsha, Egypt. In Proceedings of the 2018 IEEE International Symposium on Mixed and Augmented Reality Adjunct (ISMAR-Adjunct), Munich, Germany, 16–20 October 2018. [Google Scholar]
- Echeverría, E.; Celis, F.; Morales, A.; da Casa, F. The Tomb of Ipi: 3D Documentation in a Middle Kingdom Theban Necropolis (Egypt, 2000 BCE). Int. Arch. Photogramm. Remote Sens. Spat. Inf. Sci. 2019, XLII-2/W9, 319–324. [Google Scholar] [CrossRef]
- Colonnese, F.; Carpiceci, M.; Inglese, C. Conveying Cappadocia. A new representation model for rock-cave architecture by contour lines and chromatic codes. Virtual Archaeol. Rev. 2016, 7, 13–19. [Google Scholar] [CrossRef]
- Pérez-García, J.L.; Mozas-Calvache, A.T.; Barba-Colmenero, V.; Jiménez-Serrano, A. Photogrammetric studies of inaccessible sites in archaeology: Case study of burial chambers in Qubbet el-Hawa (Aswan, Egypt). J. Archaeol. Sci. 2019, 102, 1–10. [Google Scholar]
- Mozas-Calvache, A.T.; Pérez-García, J.L.; Gómez-López, J.M.; de Dios, J.M.; Jiménez-Serrano, A. 3D models of the QH31, QH32 and QH33 tombs in Qubbet el Hawa (Aswan, Egypt). Int. Arch. Photogramm. Remote Sens. Spat. Inf. Sci. 2020, XLIII-B2-2020, 1427–1434. [Google Scholar] [CrossRef]
- Zlot, R.; Bosse, M. Three-dimensional mobile mapping of caves. J. Cave Karst Stud. 2014, 76, 191–206. [Google Scholar] [CrossRef]
- Farella, E.M. 3D mapping of underground environments with a hand-held laser scanner. Boll. Soc. Ital. Fotogramm. Topogr. 2016, 2, 1–10. [Google Scholar]
- Di Stefano, F.; Torresani, A.; Farella, E.M.; Pierdicca, R.; Menna, F.; Remondino, F. 3D surveying of underground built heritage: Opportunities and challenges of mobile technologies. Sustainability 2021, 13, 13289. [Google Scholar] [CrossRef]
- Kadobayashi, R.; Kochi, N.; Otani, H.; Furukawa, R. Comparison and evaluation of laser scanning and photogrammetry and their combined use for digital recording of cultural heritage. Int. Arch. Photogramm. Remote Sens. Spat. Inf. Sci. 2004, 35, 401–406. [Google Scholar]
- Alshawabkeh, Y.; Haala, N. Integration of digital photogrammetry and laser scanning for heritage documentation. Int. Arch. Photogramm. Remote Sens. 2004, 35, 1–6. [Google Scholar]
- Guarnieri, A.; Remondino, F.; Vettore, A. Digital photogrammetry and TLS data fusion applied to Cultural Heritage 3D modeling. Int. Arch. Photogramm. Remote Sens. Spat. Inf. Sci. 2006, 36 Pt 5, 1–6. [Google Scholar]
- Grussenmeyer, P.; Landes, T.; Voegtle, T.; Ringle, K. Comparison methods of terrestrial laser scanning, photogrammetry and tacheometry data for recording of cultural heritage buildings. Int. Arch. Photogramm. Remote Sens. Spat. Inf. Sci. 2008, XXXVII/B5, 213–218. [Google Scholar]
- Gajski, D.; Solter, A.; Gašparović, M. Applications of macro photogrammetry in archaeology. Int. Arch. Photogramm. Remote Sens. Spat. Inf. Sci. 2016, XLI-B5, 263–266. [Google Scholar] [CrossRef]
- Marziali, S.; Dionisio, G. Photogrammetry and macro photography. The experience of the MUSINT II Project in the 3D digitizing process of small size archaeological artifacts. Stud. Digit. Herit. 2017, 1, 298–309. [Google Scholar] [CrossRef]
- Boehler, W.; Heinz, G.; Marbs, A. The potential of non-contact close range laser scanners for cultural heritage recording. Int. Arch. Photogramm. Remote Sens. Spat. Inf. Sci. 2002, 34, 430–436. [Google Scholar]
- Farjas, M.; García-Lázaro, F.J.; Jiménez, D.; Bondier, J.J.; Jimeno, J.Z.; Moreno, J.M. Geodesic Approach to an Artefact-3D Scanner Virtual Modeling versus Archaeological Tracings (First Part). In Proceedings of the 15th International Conference on Virtual Systems and Multimedia, Vienna, Austria, 9–12 September 2009. [Google Scholar]
- McPherron, S.P.; Gernat, T.; Hublin, J.J. Structured light scanning for high-resolution documentation of in situ archaeological finds. J. Archaeol. Sci. 2009, 36, 19–24. [Google Scholar] [CrossRef]
- Scafuri, M.P.; Rennison, B. Scanning the HL Hunley: Employing a structured-light scanning system in the archaeological documentation of a unique maritime artifact. J. Archaeol. Sci. Rep. 2016, 6, 302–309. [Google Scholar]
- Maté-González, M.Á.; Aramendi, J.; González-Aguilera, D.; Yravedra, J. Statistical comparison between low-cost methods for 3D characterization of cut-marks on bones. Remote Sens. 2017, 9, 873. [Google Scholar] [CrossRef]
- The American Society for Photogrammetry and Remote Sensing (ASPRS). ASPRS Positional Accuracy Standards for Digital Geospatial Data. Photogramm. Eng. Remote Sens. 2015, 81, A1–A26. [Google Scholar] [CrossRef]
- Gómez-López, J.M.; Pérez-García, J.L.; Mozas-Calvache, A.T.; Delgado-García, J. Mission Flight Planning of RPAS for Photogrammetric Studies in Complex Scenes. ISPRS Int. J. Geo-Inf. 2020, 9, 392. [Google Scholar] [CrossRef]
- Waldhäusl, P.; Ogleby, C.L. 3 × 3 rules for simple photogrammetric documentation of architecture. Int. Arch. Photogramm. Remote Sens. 1994, 30, 426–429. [Google Scholar]
- CIPA Heritage Documentation. The Photogrammetric Capture. The ‘3×3’ Rules. Available online: https://www.cipaheritagedocumentation.org/ (accessed on 16 February 2023).
- ArcGIS API Developers. Zoom Levels and Scale. Available online: https://developers.arcgis.com/documentation/mapping-apis-and-services/reference/zoom-levels-and-scale/ (accessed on 16 February 2023).
- Open Street Map. Zoom levels. Available online: https://wiki.openstreetmap.org/wiki/Zoom_levels (accessed on 16 February 2023).
- Leaflet JavaScript Library. Available online: https://leafletjs.com/ (accessed on 16 February 2023).
- Potenziani, M.; Callieri, M.; Dellepiane, M.; Corsini, M.; Ponchio, F.; Scopigno, R. 3DHOP: 3D heritage online presenter. Comput. Graph. 2015, 52, 129–141. [Google Scholar] [CrossRef]
- 3D Heritage Online Presenter (3DHOP). Available online: https://www.3dhop.net/ (accessed on 16 February 2023).
- Dellepiane, M.; Dell’Unto, N.; Callieri, M.; Lindgren, S.; Scopigno, R. Archeological excavation monitoring using dense stereo matching techniques. J. Cult. Herit. 2013, 14, 201–210. [Google Scholar] [CrossRef]



| Scale Level | Description | Area/ Dimensions | GSD | Point Density |
|---|---|---|---|---|
| SL1 | Full zone | >100 m2 | >10 mm | >5–10 cm |
| SL2 | Test excavations covering tens of square meters. | 10–100 m2 | 1–10 mm | 1–5 cm |
| SL3 | Specific elements uncovered in test excavations of a few square meters. | <10 m2 | 0.1–1 mm | <1 cm |
| SL4 | Artifacts of a few centimeters | <10 cm | <0.1 mm | <0.1 mm |
| Scale Level | Description | Minimum Zoom Level | Maximum Zoom Level |
|---|---|---|---|
| SL1 | Full zone | 16 | 22 |
| SL2 | Test excavations | 20 | 27 |
| SL3 | Specific elements | 22 | 27 |
Disclaimer/Publisher’s Note: The statements, opinions and data contained in all publications are solely those of the individual author(s) and contributor(s) and not of MDPI and/or the editor(s). MDPI and/or the editor(s) disclaim responsibility for any injury to people or property resulting from any ideas, methods, instructions or products referred to in the content. |
© 2023 by the authors. Licensee MDPI, Basel, Switzerland. This article is an open access article distributed under the terms and conditions of the Creative Commons Attribution (CC BY) license (https://creativecommons.org/licenses/by/4.0/).
Share and Cite
Mozas-Calvache, A.T.; Gómez-López, J.M.; Pérez-García, J.L. Multitemporal and Multiscale Applications of Geomatic Techniques to Medium-Sized Archaeological Sites—Case Study of Marroquíes Bajos (Jaén, Spain). Remote Sens. 2023, 15, 1416. https://doi.org/10.3390/rs15051416
Mozas-Calvache AT, Gómez-López JM, Pérez-García JL. Multitemporal and Multiscale Applications of Geomatic Techniques to Medium-Sized Archaeological Sites—Case Study of Marroquíes Bajos (Jaén, Spain). Remote Sensing. 2023; 15(5):1416. https://doi.org/10.3390/rs15051416
Chicago/Turabian StyleMozas-Calvache, Antonio Tomás, José Miguel Gómez-López, and José Luis Pérez-García. 2023. "Multitemporal and Multiscale Applications of Geomatic Techniques to Medium-Sized Archaeological Sites—Case Study of Marroquíes Bajos (Jaén, Spain)" Remote Sensing 15, no. 5: 1416. https://doi.org/10.3390/rs15051416
APA StyleMozas-Calvache, A. T., Gómez-López, J. M., & Pérez-García, J. L. (2023). Multitemporal and Multiscale Applications of Geomatic Techniques to Medium-Sized Archaeological Sites—Case Study of Marroquíes Bajos (Jaén, Spain). Remote Sensing, 15(5), 1416. https://doi.org/10.3390/rs15051416


