Article

Evaluating the Sand-Trapping Efficiency of Sand Fences Using a Combination of Wind-Blown Sand Measurements and UAV Photogrammetry at Tottori Sand Dunes, Japan

1
Arid Land Research Center, Tottori University, Tottori 680-0001, Japan
2
Meteorological Research Institute, Tsukuba 305-0052, Japan
3
Graduate School of Agricultural and Life Sciences, The University of Tokyo, Tokyo 113-8657, Japan
*
Author to whom correspondence should be addressed.
Remote Sens. 2023, 15(4), 1098; https://doi.org/10.3390/rs15041098
Submission received: 23 November 2022 / Revised: 14 February 2023 / Accepted: 15 February 2023 / Published: 17 February 2023

Abstract

:
Fences are commonly used in coastal regions to control wind-blown sand. Sand-trapping fences and sand-stabilizing fences have been installed at the Tottori Sand Dunes, Tottori Prefecture, Japan, to prevent damage by wind-blown sand; however, the effectiveness of these fences has not previously been quantitatively evaluated. This study analyzed the effects of sand fences on sand trapping using field observations of blown-sand flux and unmanned aerial vehicle (UAV) photogrammetry. The estimated total blown-sand flux in the near-ground surface observed inside and outside the sand fences indicated that wind-blown sand was effectively trapped by the sand fences at wind speeds lower than 17 m s−1, reducing sand flux by more than 80%. The UAV photogrammetry results demonstrated that large amounts of sand were transported from the dune to the fenced area during March and April, and sand initially accumulated on the lee side of the sand-trapping fences, forming a new foredune. Sand accumulated on the existing foredune during April and May, and the vertical accretion around the foredune was two to four times the sand deposition within the sand-stabilizing fences. This indicated the effectiveness of sand-trapping fences for controlling wind-blown sand; however, their efficiency was reduced as they were gradually buried, with sand being trapped by the sand-stabilizing fences.

1. Introduction

Coastal sand dunes are formed along coasts as a result of aeolian processes and sometimes by marine activity. They play several important roles in many aspects, for example, protecting the coast against flooding, forming habitats for a variety of species, and providing areas for recreation and tourism. However, coastal dunes also act as sources of sand, and wind-blown sand from coastal sand dunes can affect human health and economic activities (e.g., [1]).
Sand fences are widely used to control wind-blown sand in coastal regions. The aerodynamics of sand fences have been mainly investigated by means of wind-tunnel experiments. Some studies have developed and applied numerical models to analyze the sand-trapping effects of sand fences [2,3]. The functions of sand fences depend on their geometrical design (including height, length, width, and porosity, as well as the size, geometry, and distribution of openings) and their geometric shape [4]. Of these factors, porosity has been suggested to be the most important structural characteristic controlling the sand-trapping efficiency of sand fences on the basis of both wind-tunnel experiments and numerical simulations [5,6]. Fences with a porosity of around 40−50% have been found to be the most effective at sand trapping in many field and wind-tunnel studies (e.g., [7,8,9,10]). Fence height may be relatively unimportant for the formation of a new dune (e.g., [11]), although it can affect the life span of fences [12]. Hotta et al. [13] documented that the height of sand fences is usually between 0.6 and 1.3 m in field applications. The size, geometry, and distribution of openings in fences also affect the fence’s sand-trapping efficiency through their impact on wind turbulence, but these influences are not comparable with the effect of porosity. For a constant porosity, the sand-trapping efficiency decreases as the opening size increases. Fences with angular openings (e.g., vertical or horizontal slits) exhibit a higher sand-trapping efficiency than those with round edges (e.g., circular holes) [4], and fences in which the porosity increases upward have a higher sand-trapping efficiency than those with decreasing upward porosity [14]. Straight fences have the advantage that they are faster to install and cost less, whereas zig-zag fences exhibit a high sand-trapping efficiency [15]. In addition, the arrangement (e.g., orientation relative to the wind) of a fence also influences the sand-trapping efficiency [4]. Fences perpendicular to the main wind direction are the most effective in trapping wind-blown sand, with their efficiency gradually decreasing as their orientation approaches parallel to the wind direction [16].
Because sand fences are an important conservation structure, the effectiveness of their construction for preventing wind-blown sand needs to be evaluated. Measurements of sand movement around sand fences have been used to assess their effects and to understand the characteristics of blown-sand flux, which is necessary to control wind-blown sand. However, unsteady wind conditions cause difficulties with observations of sand movement in the field. There has been a tendency to measure real-time blown-sand flux at fine temporal and spatial scales [17] using recently developed sand saltation sensors. Commonly used sand saltation sensors for field observations include piezoelectric mass flux sensors [18,19] and microphonic flux sensors [20]. Recently, the ceramic piezoelectric sand flux sensor UD-101 (Chuo Kosoku), which was developed by Hotta and Harikai [21], has been shown to perform well in measuring blown-sand flux in both wind tunnels and on a flat backshore in Japan [22,23]. Sand saltation sensors provide consecutive data; however, inconsistent sensitivities and low saturation limits are common issues for most of these sensors [24]. Moreover, sand saltation sensors are set at fixed point(s) for observation, meaning that sand movement can only be assessed in a single direction.
The monitoring of sand movement (i.e., erosion and deposition) in coastal dunes is another possible method for evaluating the sand-trapping efficiency of sand fences (e.g., [25]). However, coastal monitoring with high accuracy is still difficult owing to the complexity of the changes in coastal landforms over a range of spatial and temporal scales. Early studies used field techniques to monitor and measure sand dune movements; for example, human-made field markers (e.g., rods or stakes) and natural markers (e.g., trees) have been used as indications of dune movements (e.g., [26]). Geodetic techniques, most commonly total station, optical or laser theodolites, and GPS, have been applied to collect data to produce topographic profiles or maps (e.g., [27,28,29]). Although changes in dune movement can be identified at the time intervals of data acquisition by using field techniques, such methods are commonly performed on a small scale and target dunes with limited spatial extents. In addition, field techniques are both labor-intensive and time-consuming.
The development of remote sensing technology has allowed improved coastal dune monitoring with wide spatial coverage. Remote sensing techniques can be applied to measure the movement rates of dunes by comparison of two or more aerial photographs or satellite images acquired at different times [30]. Recently, unmanned aerial vehicle (UAV) photogrammetry has provided an effective approach for monitoring coastal sand dunes (e.g., [31,32]). Bañón et al. [33] validated the data quality obtained from UAV photogrammetry with traditional topographic methods in the Spanish Mediterranean coast and suggested that UAV technology permits the acquisition of topographic data by means of surveys that take little time and can be conducted at a high temporal frequency. Laporte-Fauret et al. [34] proposed the use of a low-cost UAV for coastal monitoring at Truc Vert beach, SW France. They suggested that the photogrammetry approach combined with a ground control point (GCP) set-up is well adapted to monitor the morphological changes of the beach–dune system at a high resolution (<0.1 m) on large spatial scales (4 km along the shore). Amodio et al. [35] used digital elevation models (DEMs) based on UAV-derived images and the structure-from-motion (SfM) processing tool to detect morphological changes and sediment volume loss between 2019 and 2020 along the Molise coast, Italy. They confirmed the use of UAV as an effective instrument for quick spatial data analysis. Liu et al. [36] also explored the use of UAV photogrammetry and GIS techniques to detect sand deposition and erosion at the Tottori Sand Dunes, Japan. They investigated the volumetric changes of sand in two areas containing sand fences by means of UAV photogrammetry with a total station survey. They suggested that it is feasible to monitor sand transport with high accuracy and resolution by using UAV photogrammetry. UAV-based coastal monitoring and in situ observation of sand movement are two effective approaches to understand the aerodynamics and morphodynamics of sand fences, thus evaluating their efficiency; however, few attempts have been made to explore combinations of the two methods.
The objective of this study was to quantitatively evaluate the effectiveness of sand fences on preventing wind-blown sand at the Tottori Sand Dunes based on an integrated use of UAV photogrammetry and sand saltation sensors. We conducted field observations to measure blown-sand flux on the seaward side and the landward side of the sand fences by using UD-101 piezoelectric sand flux meters from January to May 2021, and to estimate the sand-trapping efficiency of sand fences. In addition, we conducted four separate field surveys in the Tottori Sand Dunes from March to May 2021, using a combination of UAV and a total station. We monitored the temporal changes of sand erosion and deposition in the study area by means of digital elevation modeling. In addition, we used terrain profiles to investigate changes in sand accumulation around the sand-trapping fences.

2. Materials and Methods
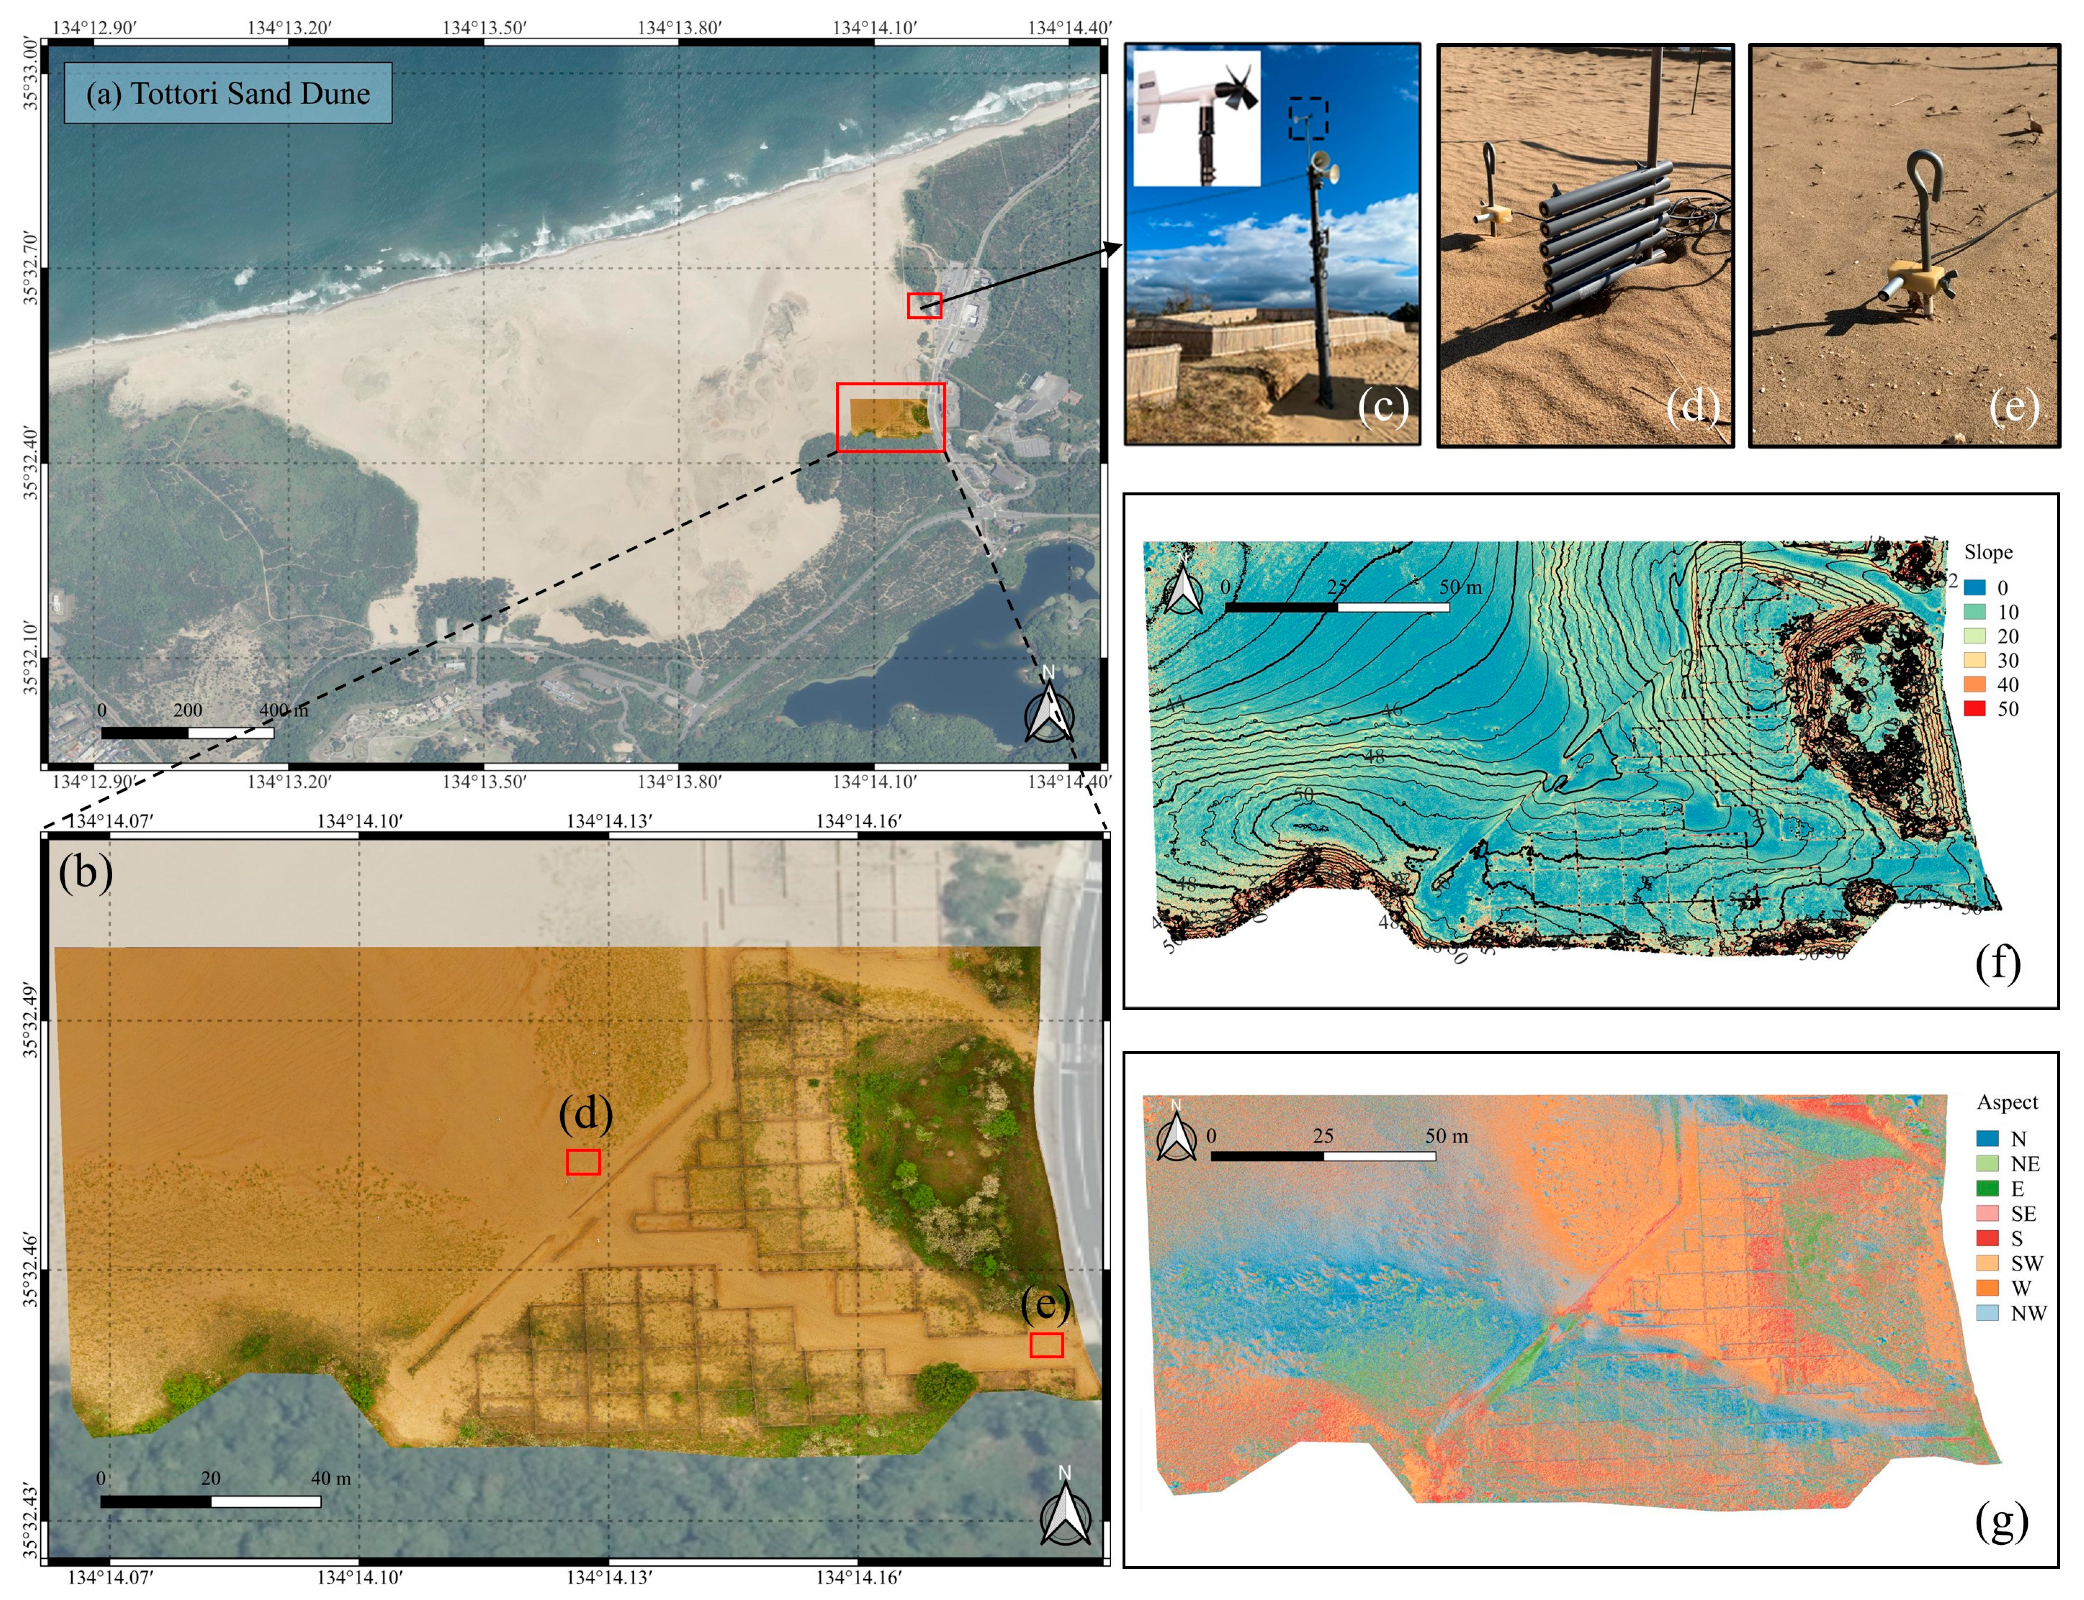
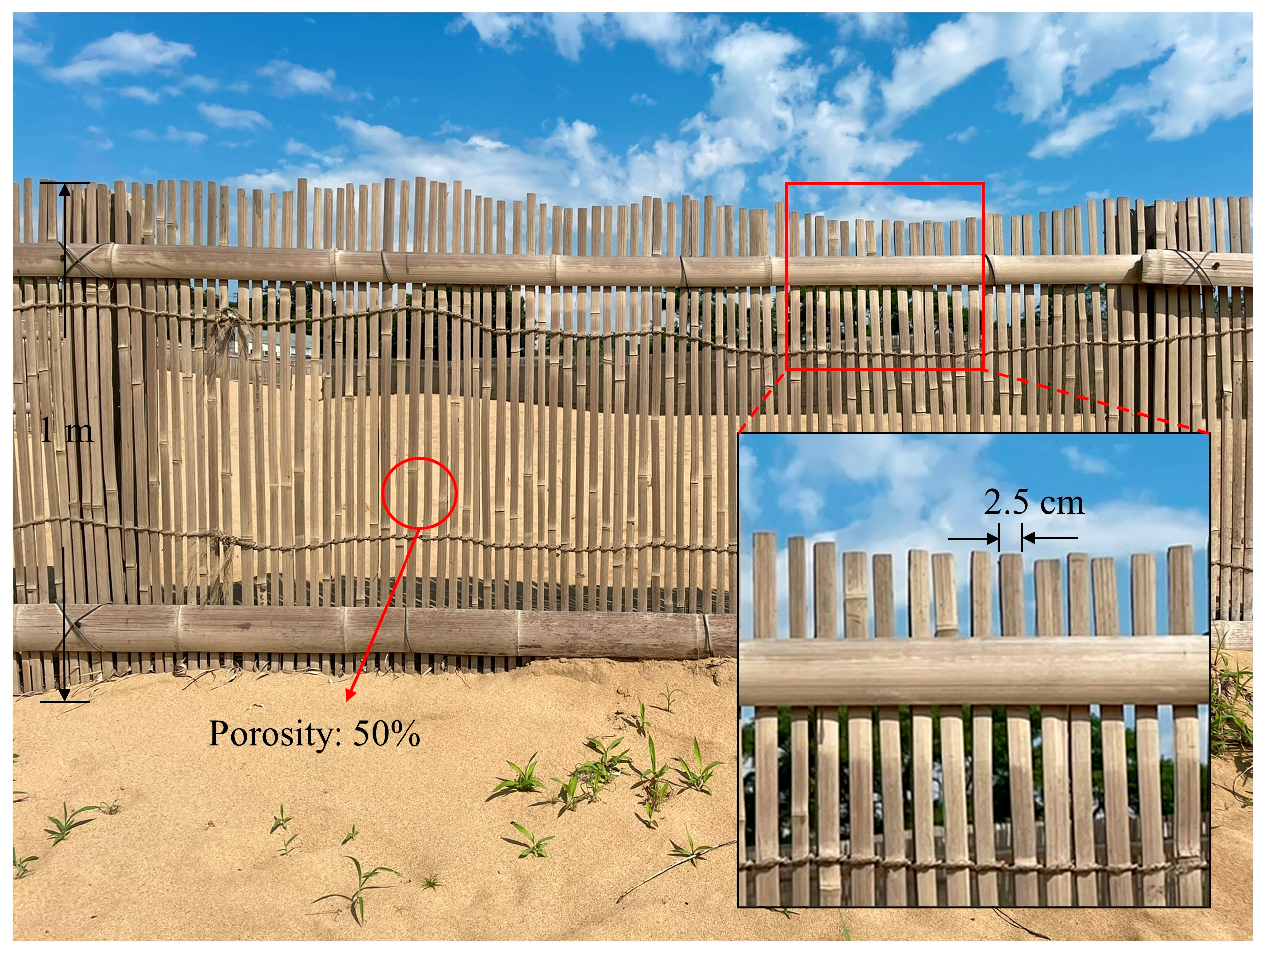
2.1. Study Area

The study area is located in the tourist zone of the Tottori Sand Dunes of Tottori Prefecture, Japan, which have been designated as a special protection zone of Sanin Kaigan National Park and a UNESCO Global Geopark (Figure 1a). The climate and weather in the Tottori Sand Dunes are characterized by the winter monsoon from the Asian continent and the Chugoku Mountains, the foehn phenomenon originating from the Chugoku Mountain in spring, the rainy season and sea breeze in summer, and low-pressure systems or typhoons in autumn [37]. The annual average temperature is about 15 °C and the annual rainfall is about 1900 mm. Generally, the summer and autumn season from June to October is comparatively wet, while the winter and spring season from November to May is dry. The annual average wind speed is 5 m s−1 and most winds are from the south, followed by the north, west, and east. The high frequency of southerly winds occurs because of the land breezes that blow at night. Most winds over 5 m s−1 are from the northwest direction, while some is from the south. The most common plant species growing in the Tottori Sand Dunes is Carex Kobomugi. Ischaemum anthephoroides, which is as numerous as Carex Kobomugi, grows mainly distributed in places where the sand is more stable [38]. Plant communities develop in a mosaic pattern owing to subtle topographic changes and sand movement. The vegetation cover ratio in areas of sand dunes has fluctuated within the range of 0.01–0.13 since 2000 (Takayama et al., 2020). The sand surface of the Tottori Sand Dunes is mainly composed of fine particles of silt and clay, and the diameter of sand particles ranges between 250 and 300 μm [39]. The study area measured approximately 180 m × 110 m and included sand fences installed in the first stage of a construction project (Figure 1b). Sand fences installed parallel to the seashore were defined as sand-trapping fences to construct an artificial foredune, with the aim of reducing to some extent the amount of blown sand; those installed by joining 10 m squares on the leeward side of the foredune with sand-trapping fences were defined as sand-stabilizing fences, which protect seedlings planted inside the sand-stabilizing fences [40]. Both sand-trapping and sand-stabilizing fences were constructed of bamboo piles 1.2 m long and 2.5 cm wide, arranged upright at 1 cm intervals. The fence height was about 1 m above the ground surface and the porosity was approximately 50% (Figure 2). Our study area covered sand-trapping fences with a total length of 115 m and two sets of sand-stabilizing fences enclosing areas of 1970 m2 and 1727 m2. The elevation with respect to mean sea level of the sand fence areas ranges from 47 m to 56 m. The maximum gradient of the slope is about 30 degrees (Figure 1d) and most of the area is west-facing or southwest-facing (Figure 1e). Of the sand dune area in the southwest, the elevation varies between 43 and 47 m, with a relatively flat landscape. The UAV surveys covered the whole study area, and sand saltation sensors for blown-sand flux measurement were installed both on the seaward side and the landward side of the sand fence (Figure 1b).

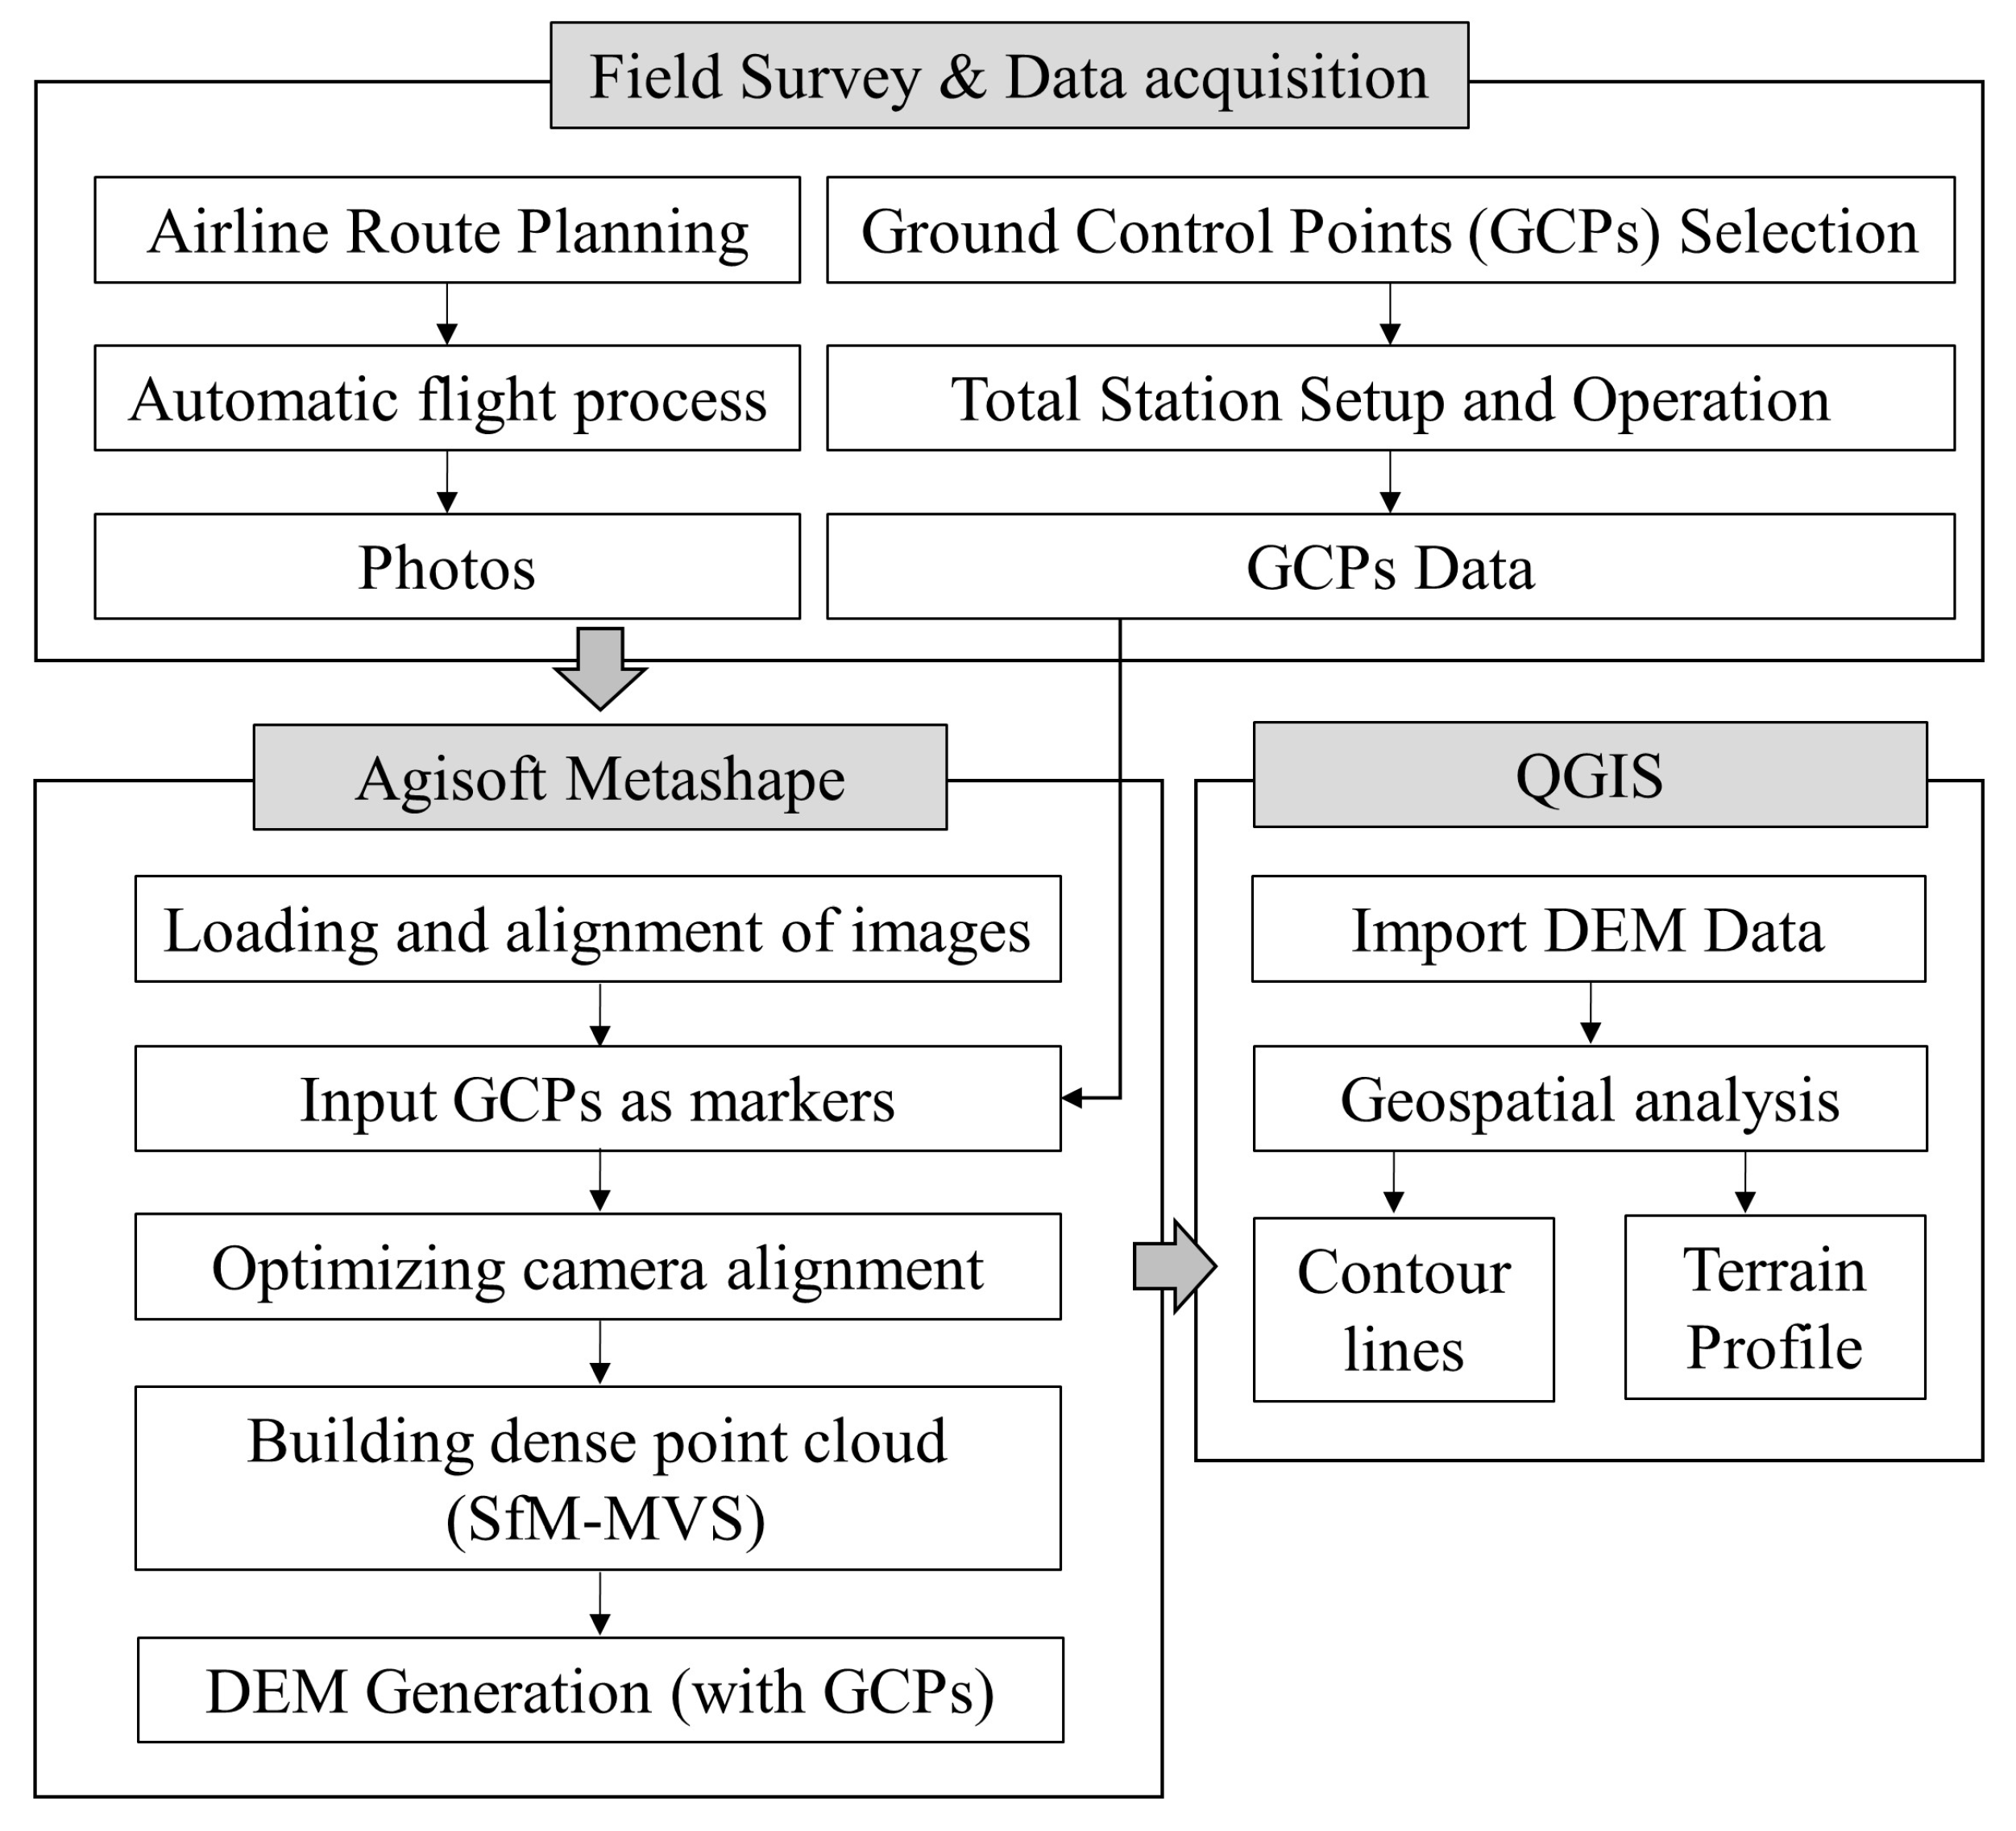
2.2. UAV Photogrammetric Workflow

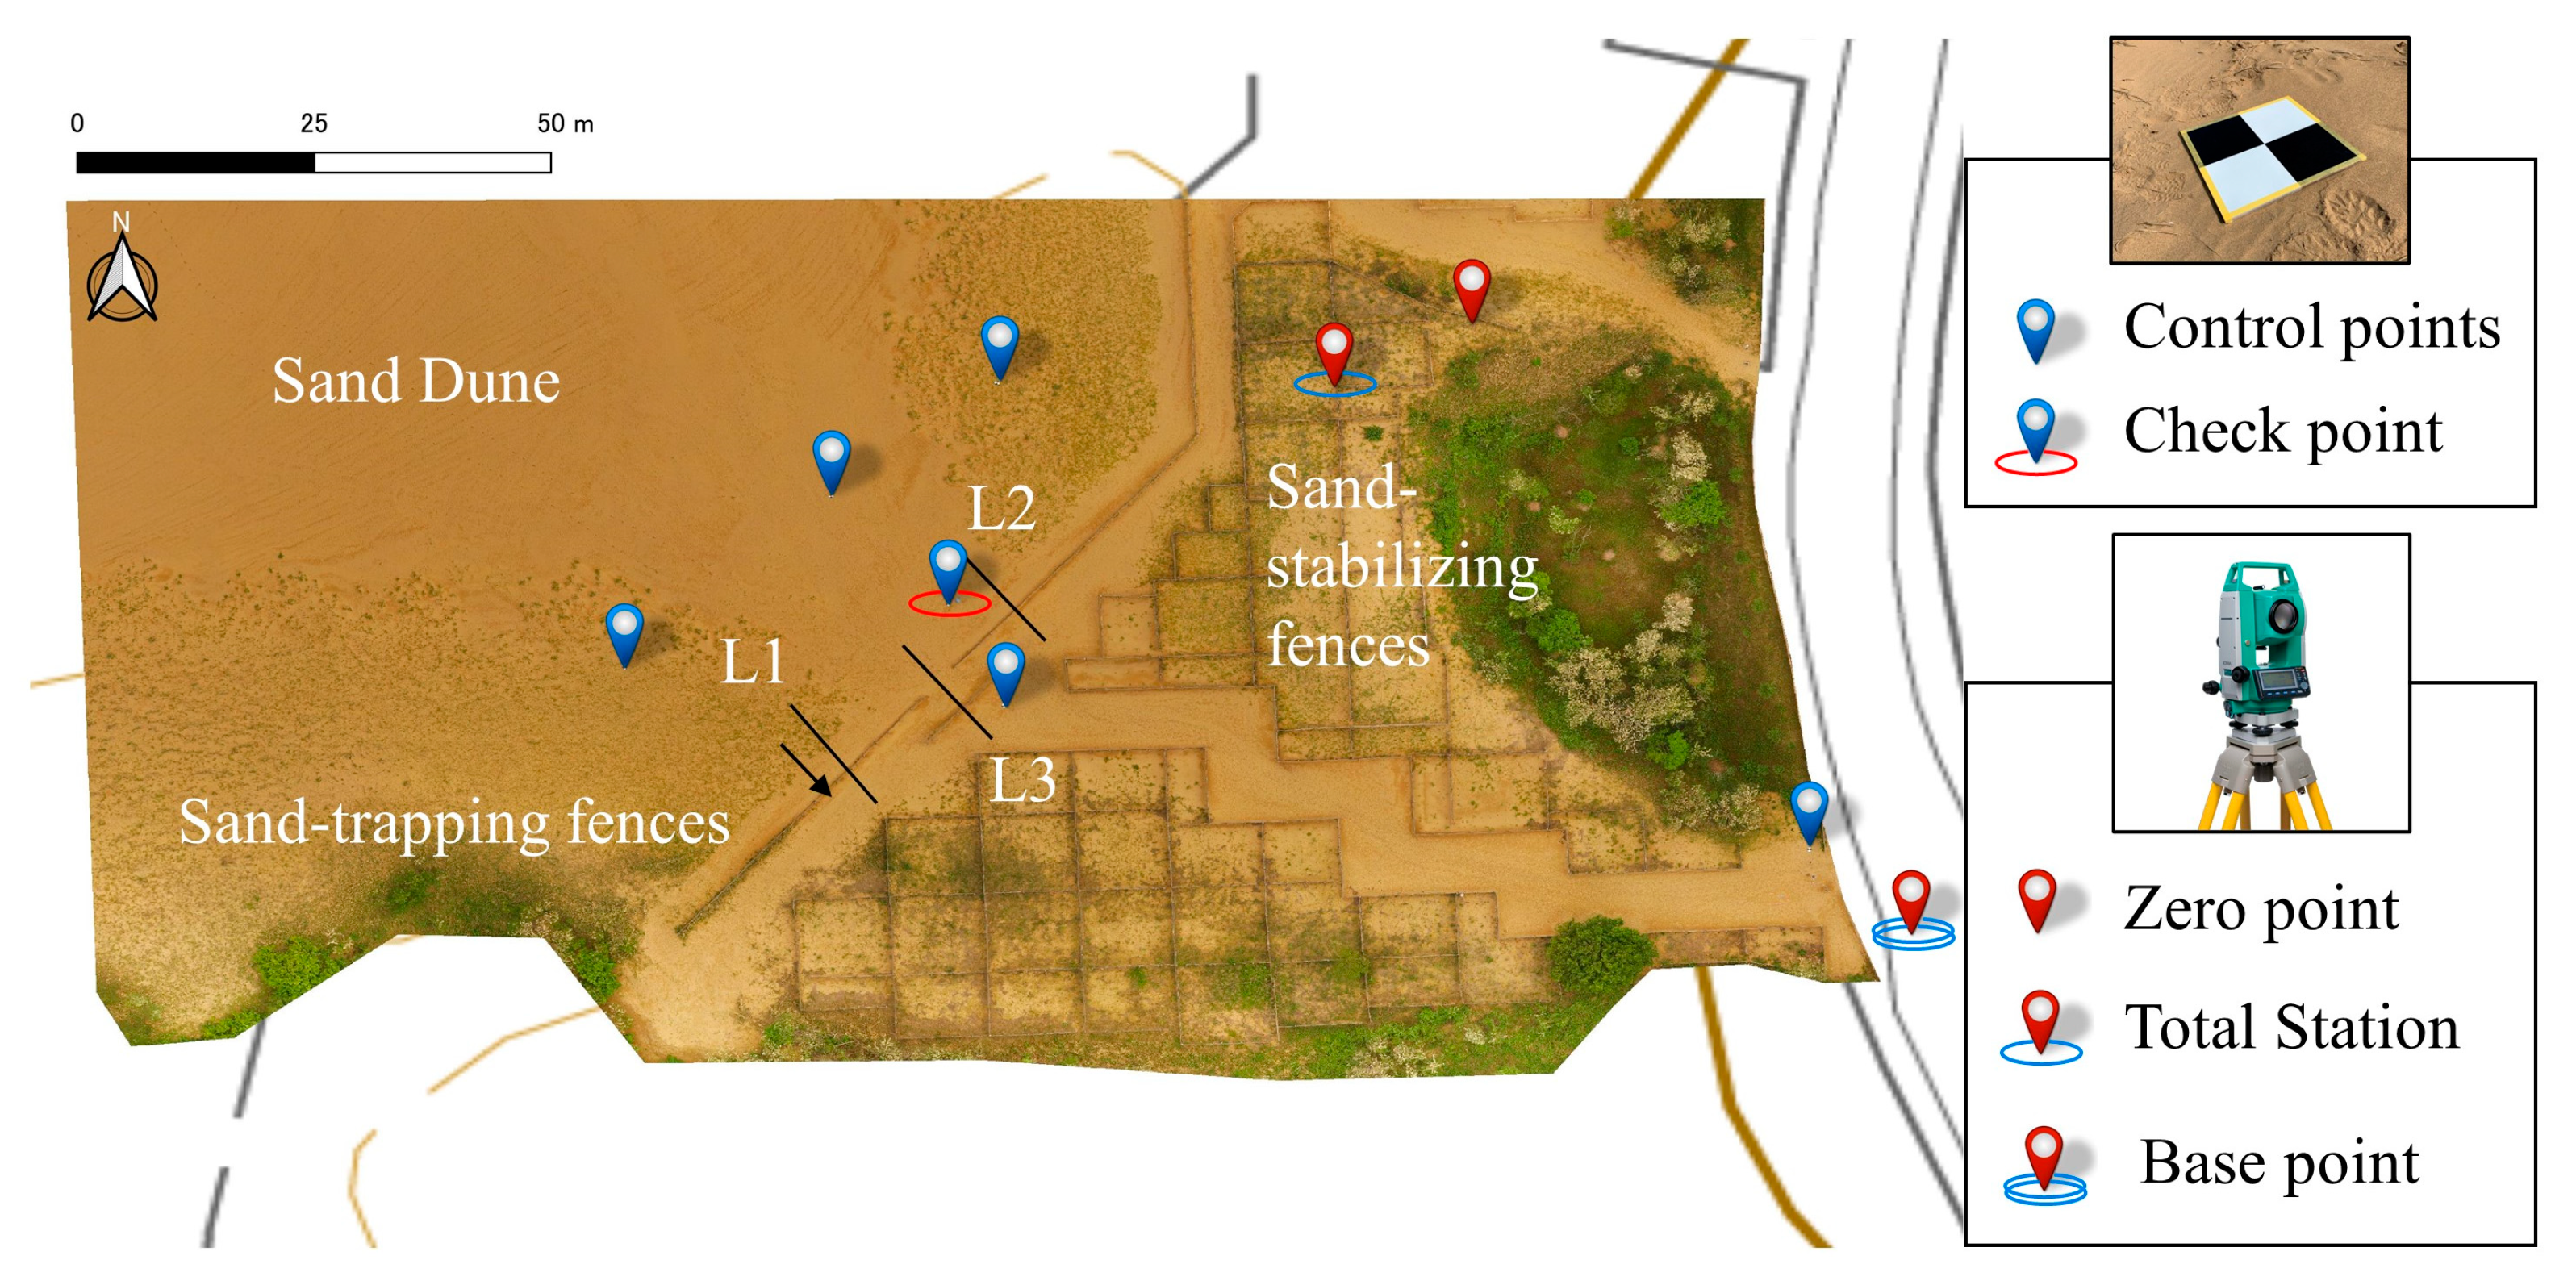
2.2.1. Image and Data Acquisition

We conducted UAV surveys on March 11, April 14, and May 13 and 28, 2021. Figure 3 shows the workflow and methods used to obtain field data and to conduct our analysis using UAV photogrammetry and GIS techniques. Before conducting the flight mission, we set up a total station (SOKKIA SET530RS) and a zero point in the sand-stabilizing fence to determine the precise coordinates of the ground control points (GCPs). A total of 6 GCPs, which were flat squares with 54 cm sides, were positioned inside and outside the sand fences on the slope and depressions of the sand dunes. One of the GCPs served as a check point to validate the accuracy of model reconstruction. An additional base point, with stable geoinformation provided by the Geospatial Information Authority of Japan, was used as an independent control point to correct the measured geoinformation of the GCPs and obtain precision absolute coordinates. Then, after setting a flight height of 30 m, a flight speed of 3 m s−1, and front and side overlaps of 80% on the Maps Made Easy Map Pilot application, about 280 aerial images were acquired autonomously for each survey using a DJI Phantom 3 Professional UAV. The UAV’s built-in camera had a 1 inch × 2.3 inch CMOS sensor with 12.4 megapixel resolution and a lens with a f/2.8 focus at infinity.

2.2.2. Data Processing

All the collected aerial images were processed using Agisoft Metashape Professional 1.7.1 software [41]. The photogrammetric processing was based on SfM and multi-view stereo algorithms [42,43] to generate DEMs. The loading aerial images were first aligned to detect the actual camera position for each image and refine camera calibration parameters. Then, the GCPs were imported as control points and check points to optimize camera alignment at a “high-accuracy” setting. After obtaining accurate estimates of camera position, the dense-point clouds were reconstructed at “high-quality” setting and incorrect points were removed manually. The density of the dense-point cloud resulted in 1240 point/m2. Finally, orthophotos and DEMs were generated with a spatial resolution of 2.8 cm/pixel. The coordinate system of the DEMs was transformed from WGS 84 to JGD2000-EPSG:2447. For accuracy assessment of the DEM, the root-mean-square error (RMSE) was calculated for the GCPs in the horizontal and vertical directions. The mean RMSE of the generated DEMs was 2.5 ± 0.4 m in the absence of GCPs. After calibration with GCPs, the RMSEs by use of the control points improved to 0.018 ± 0.005 m in horizontal resolution and 0.018 ± 0.007 m in vertical resolution. The mean allowable limit of accuracy for UAV photogrammetry was proposed to be 0.05 m by the Geospatial Information Authority of Japan [44].
The generated DEMs were imported into QGIS 3.18 software [45] for the geospatial analysis. We subtracted pairs of DEMs from the four observation periods and created contour lines and DEMs of the differences to detect topographic changes in the study area. In addition, we focused on monitoring the morphodynamics of the foredunes around the sand-trapping fences, thus evaluating the fences’ effects on wind-blown-sand prevention. We selected three cross-sections by defining three transect lines perpendicular to each part of the sand-trapping fences (Figure 4). It has been reported that sand deposition will occur within a distance of ten times the fence height on both sides of a fence when the fence porosity is 50% [46]. Therefore, the transects were measured over a distance of 10 m on the sand dune side of the fence, but only 4 m in the other direction due to the short distance between the sand-stabilizing fences. We then derived and compared the elevations of the three cross-sections for each observation period by using the terrain profile tool of QGIS.

2.3. Observation of Wind Speed, Wind Direction, and Blown-Sand Flux

We measured wind conditions and blown-sand flux from 15 January to 31 May 2021. Wind speed and direction were observed by an anemometer (CYG-5108) set up by the Tottori government at a height of 7 m (Figure 1). The data were recorded at 10-min intervals.
Sand saltation was measured by UD-101 sensors installed 4 cm above the ground inside and outside the sand fence. We also installed a piezoelectric blown-sand meter equipped with 6 UD-101 sensors mounted at 0.2 cm, and at 2 cm intervals from 2 cm to 10 cm, inside the sand fence. The measured number of blown-sand particles n at each sensor was converted to the measured blown-sand flux q S e n s o r (kg m−2 s−1) according to the following equations of Udo [23]:
q S e n s o r = 4 3 π d 2 3 ρ s π d P S 2 2 t 0 n = 2 ρ s d 3 n 3 d P S 3 t 0 ,
where d is the median sand particle size, ρs is the density of sand, dPS is the diameter of the sensor (12 mm), and t0 is the measurement time (1 s). Udo [23] estimated the relationship between n and q S e n s o r based on the observation data in wind-tunnel experiments using sand of d = 350 µm and ρs = 2.65 × 10³ kg m−3 by Kubota et al. [47]. The blown-sand flux q T r a p was also measured by the vertical-distribution-type sand trap in the wind-tunnel experiments for calibration of q S e n s o r . A proportional relationship was found between q S e n s o r and q T r a p , as expressed by:
q T r a p = 10.571 q S e n s o r ,
The logger can record a maximum of 10,000 counts. The sensor would be incapable of detecting sand particles if wet sand sticks to its surface due to rainfall; however, it works if heavy rainfall subsequently removes the sand. During our observation period, we regularly checked the operating conditions of all sensors. The blown-sand flux was the average of 20 s measurements over 10 min to correspond to the wind observation data. We evaluated the relative blown-sand flux following the method of Liu et al. [48] by using the following equation:
q r z = q T r a p z Q ,
where qr(z) is the relative blown-sand flux, representing the proportion of the flux at height z divided by the total flux, qTrap(z) is the measured blown-sand flux at height z (cm), and Q (kg m−2 s−1) is the total blown-sand flux, which is the sum of the measured flux within 10 cm of the ground surface.
Approximately 80% of sand particles are transported within 10 cm of the ground layer [49], and the total blown-sand flux in the near-ground surface can be simply estimated based on measurements at just one height of 4 cm [48,50]. We then derived the total blown-sand flux from the estimated values on the seaward and landward sides of the sand fence. To evaluate the effectiveness of sand fences on preventing blown-sand flux, we calculated the reduction efficiency of blown-sand flux q r e as q l q s / q s , where q l and q s are the total blown-sand fluxes observed on the landward and seaward sides of the sand fence, respectively.

2.4. Threshold Wind Speed for Sand Saltation

The threshold wind speed ( u t ) is the minimum wind speed to initiate sand saltation; the value of u t was obtained following the instantaneous threshold method [51,52]. The wind speeds that began or ended a period of sand saltation were extracted as threshold values. Wind speeds at the beginning and end times of a single sand saltation during a time interval were also counted as threshold values. The definition of u t was extracted based on the following rules:
u t i = u i   if   n i > 0   and   n i 1   >   0   and   n i + 1   =   0 u t i = u i   if   n i > 0   and   n i 1 = 0   and   n i + 1   >   0 u t i = u i   if   n i > 0   and   n i 1 = 0   and   n i + 1   =   0 u t i = N / A   all other cases ,
where u t i is the instantaneous threshold at time i, ui is the wind speed at time i, ni is the sand particle count number at time i, ni + 1 is the sand particle count number at time i + 1, and ni 1 is the sand particle count number at time i − 1. Here, we only reported the mean of all u t i values for each measurement interval.
The UD-101 sensor and the piezoelectric blown-sand meter were fixed at the northwest direction (i.e., 315°), which was the main wind direction for strong wind when wind speeds exceeded 10 m s−1 [53]. Here, we only extracted thresholds for sand saltation for wind directions of 285° to 345°. In addition, to minimize errors, we excluded observations for which the measured number of blown sand particles over 10 min was fewer than 10 saltations.

3. Results

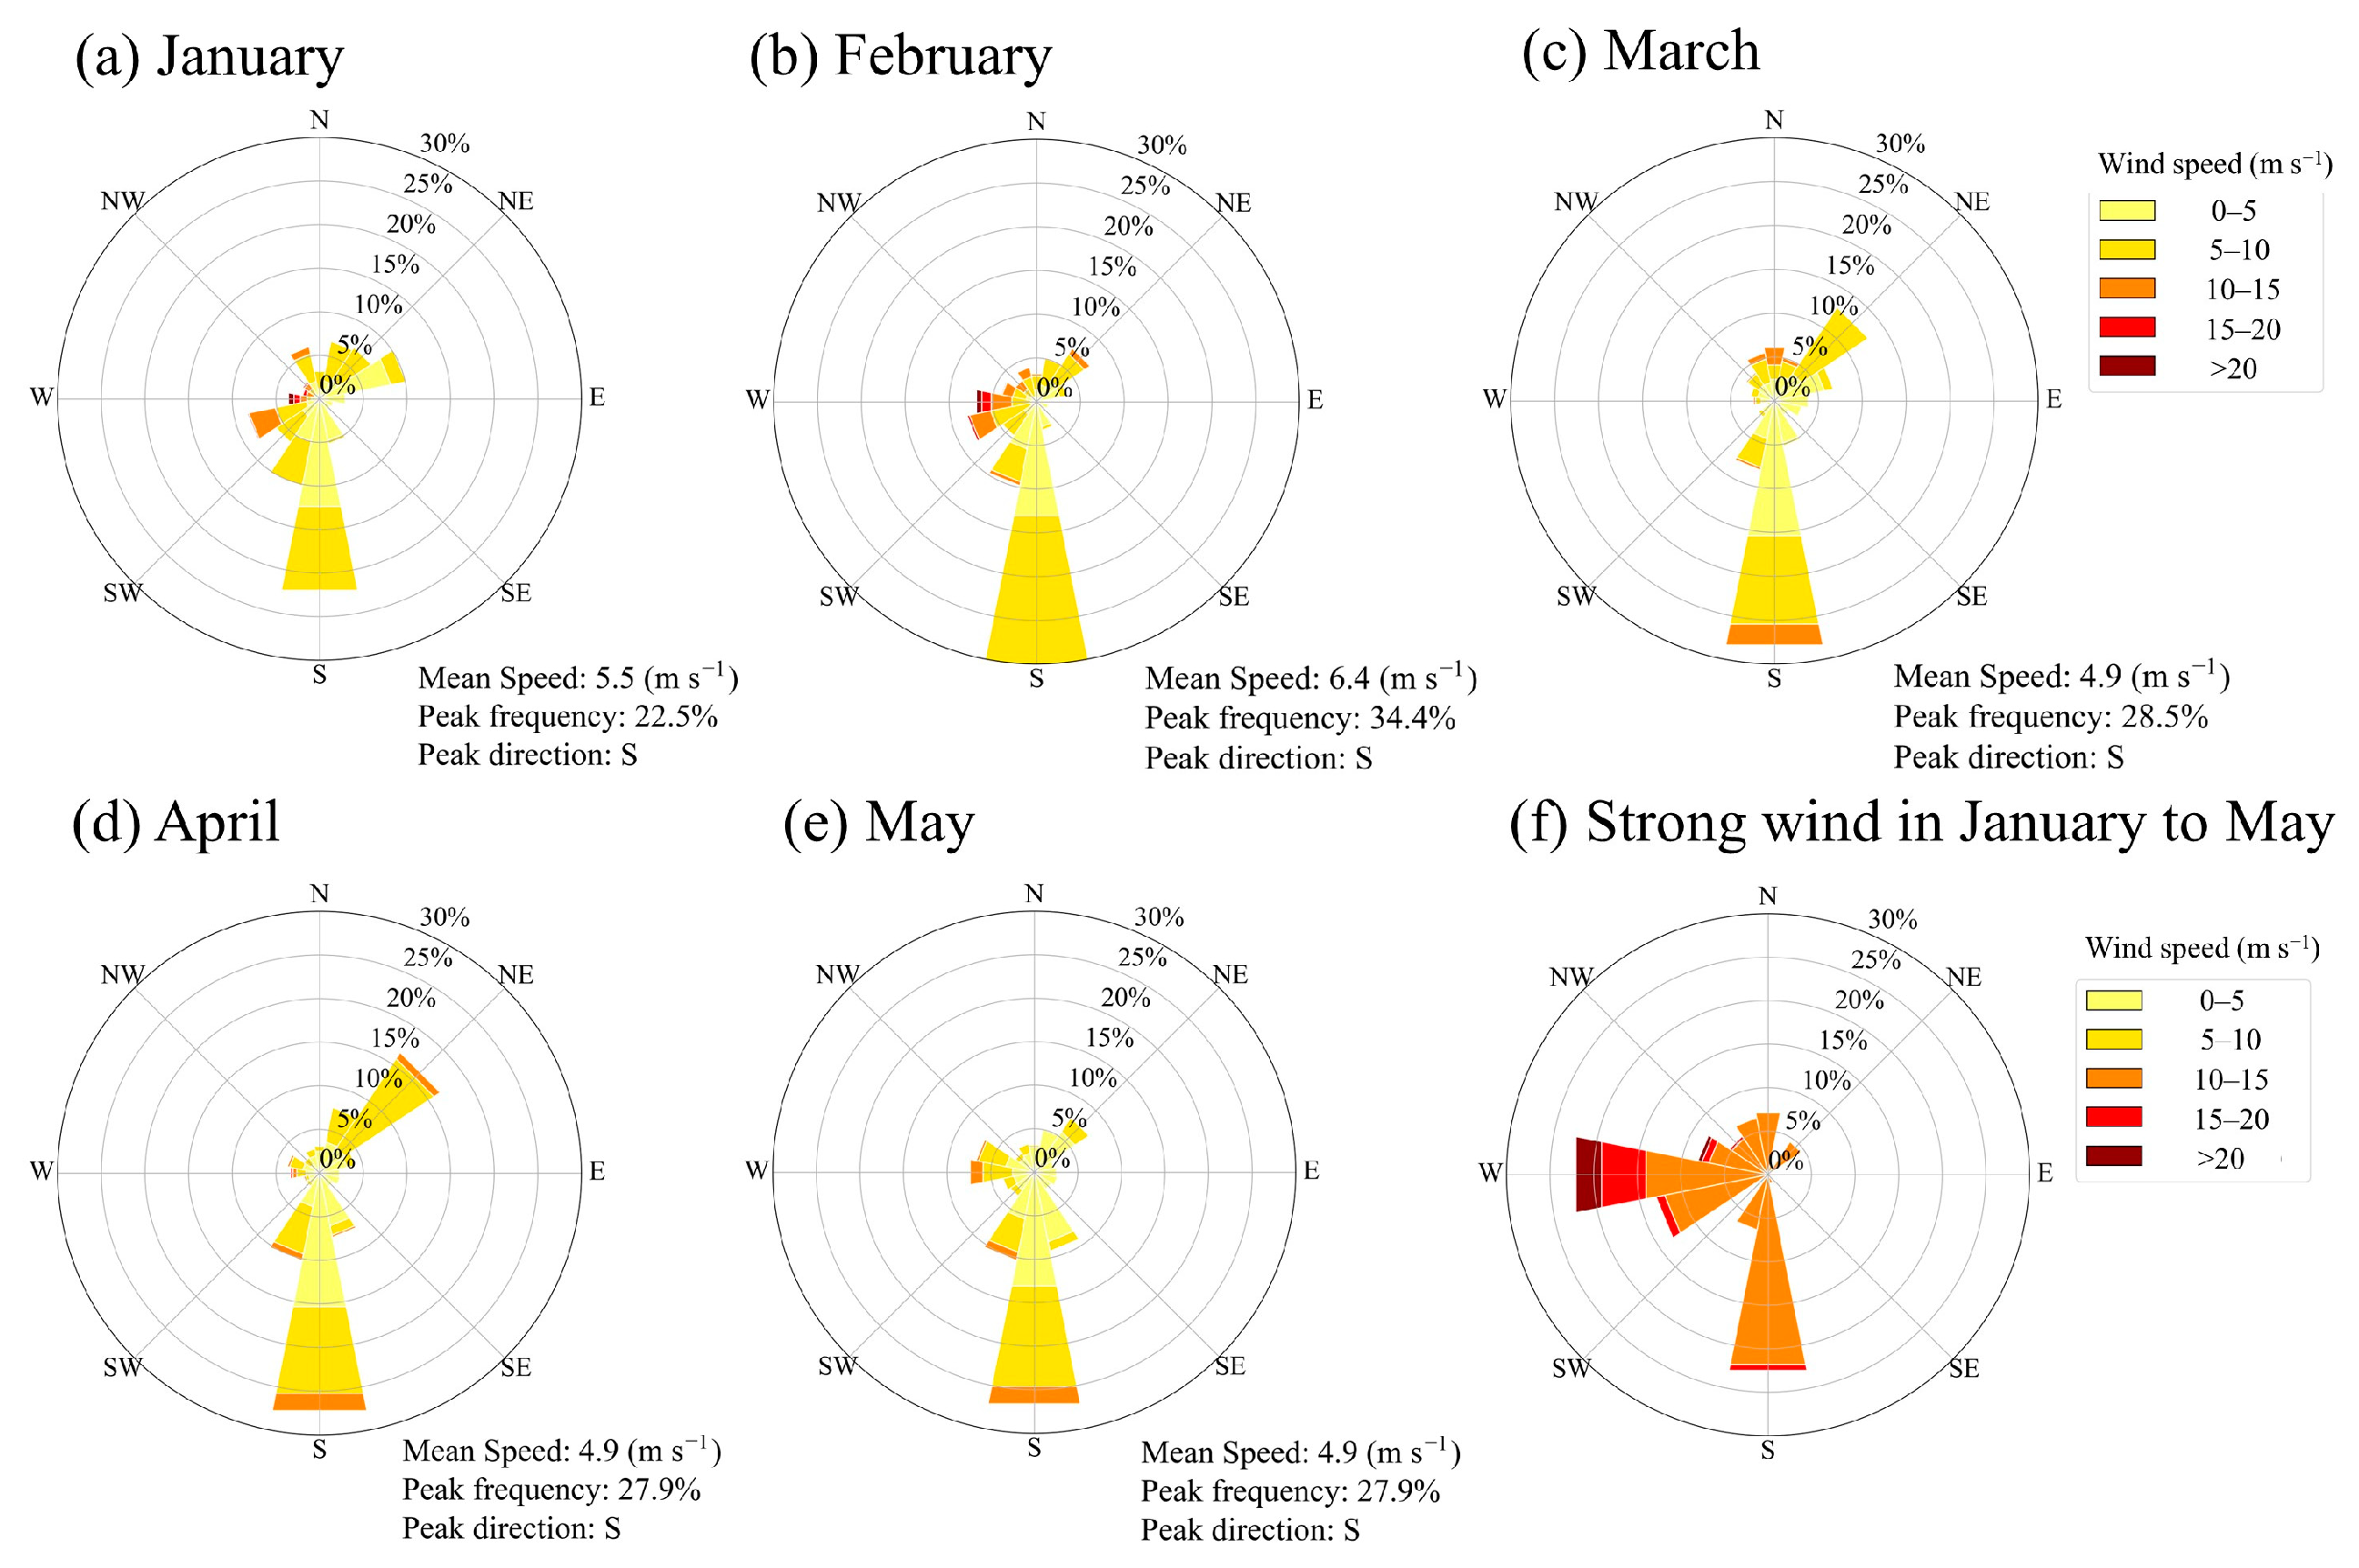
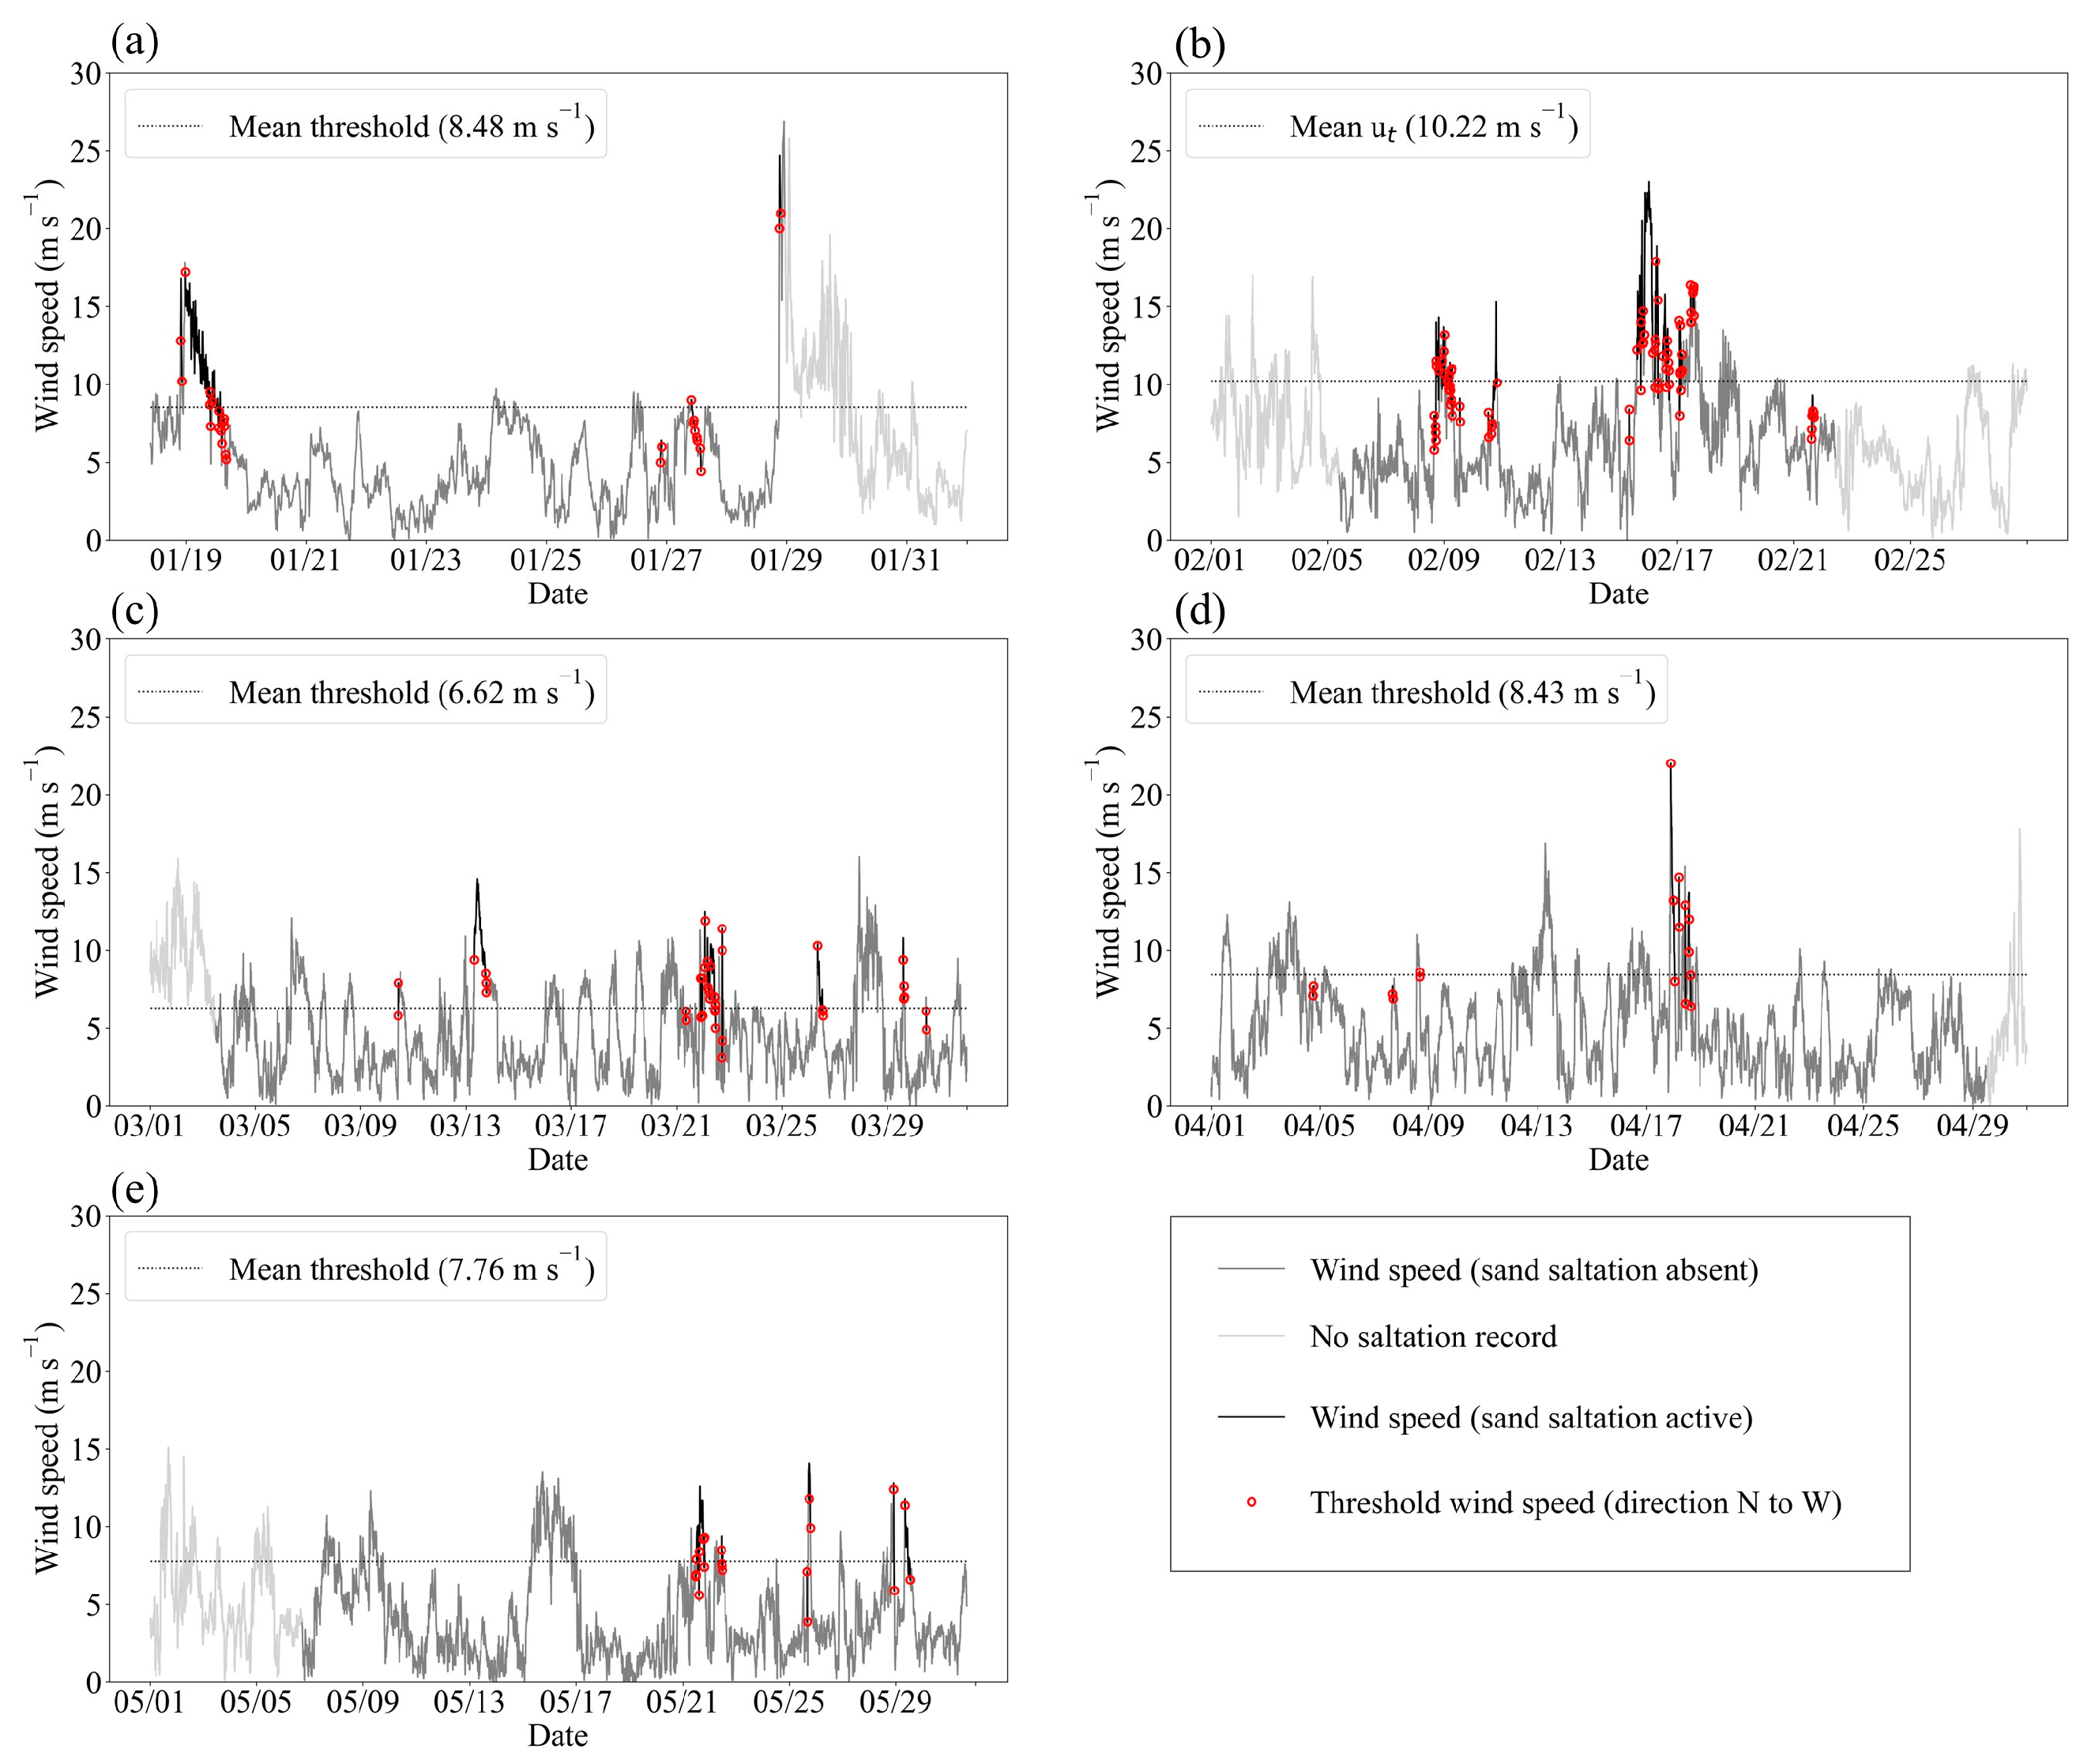
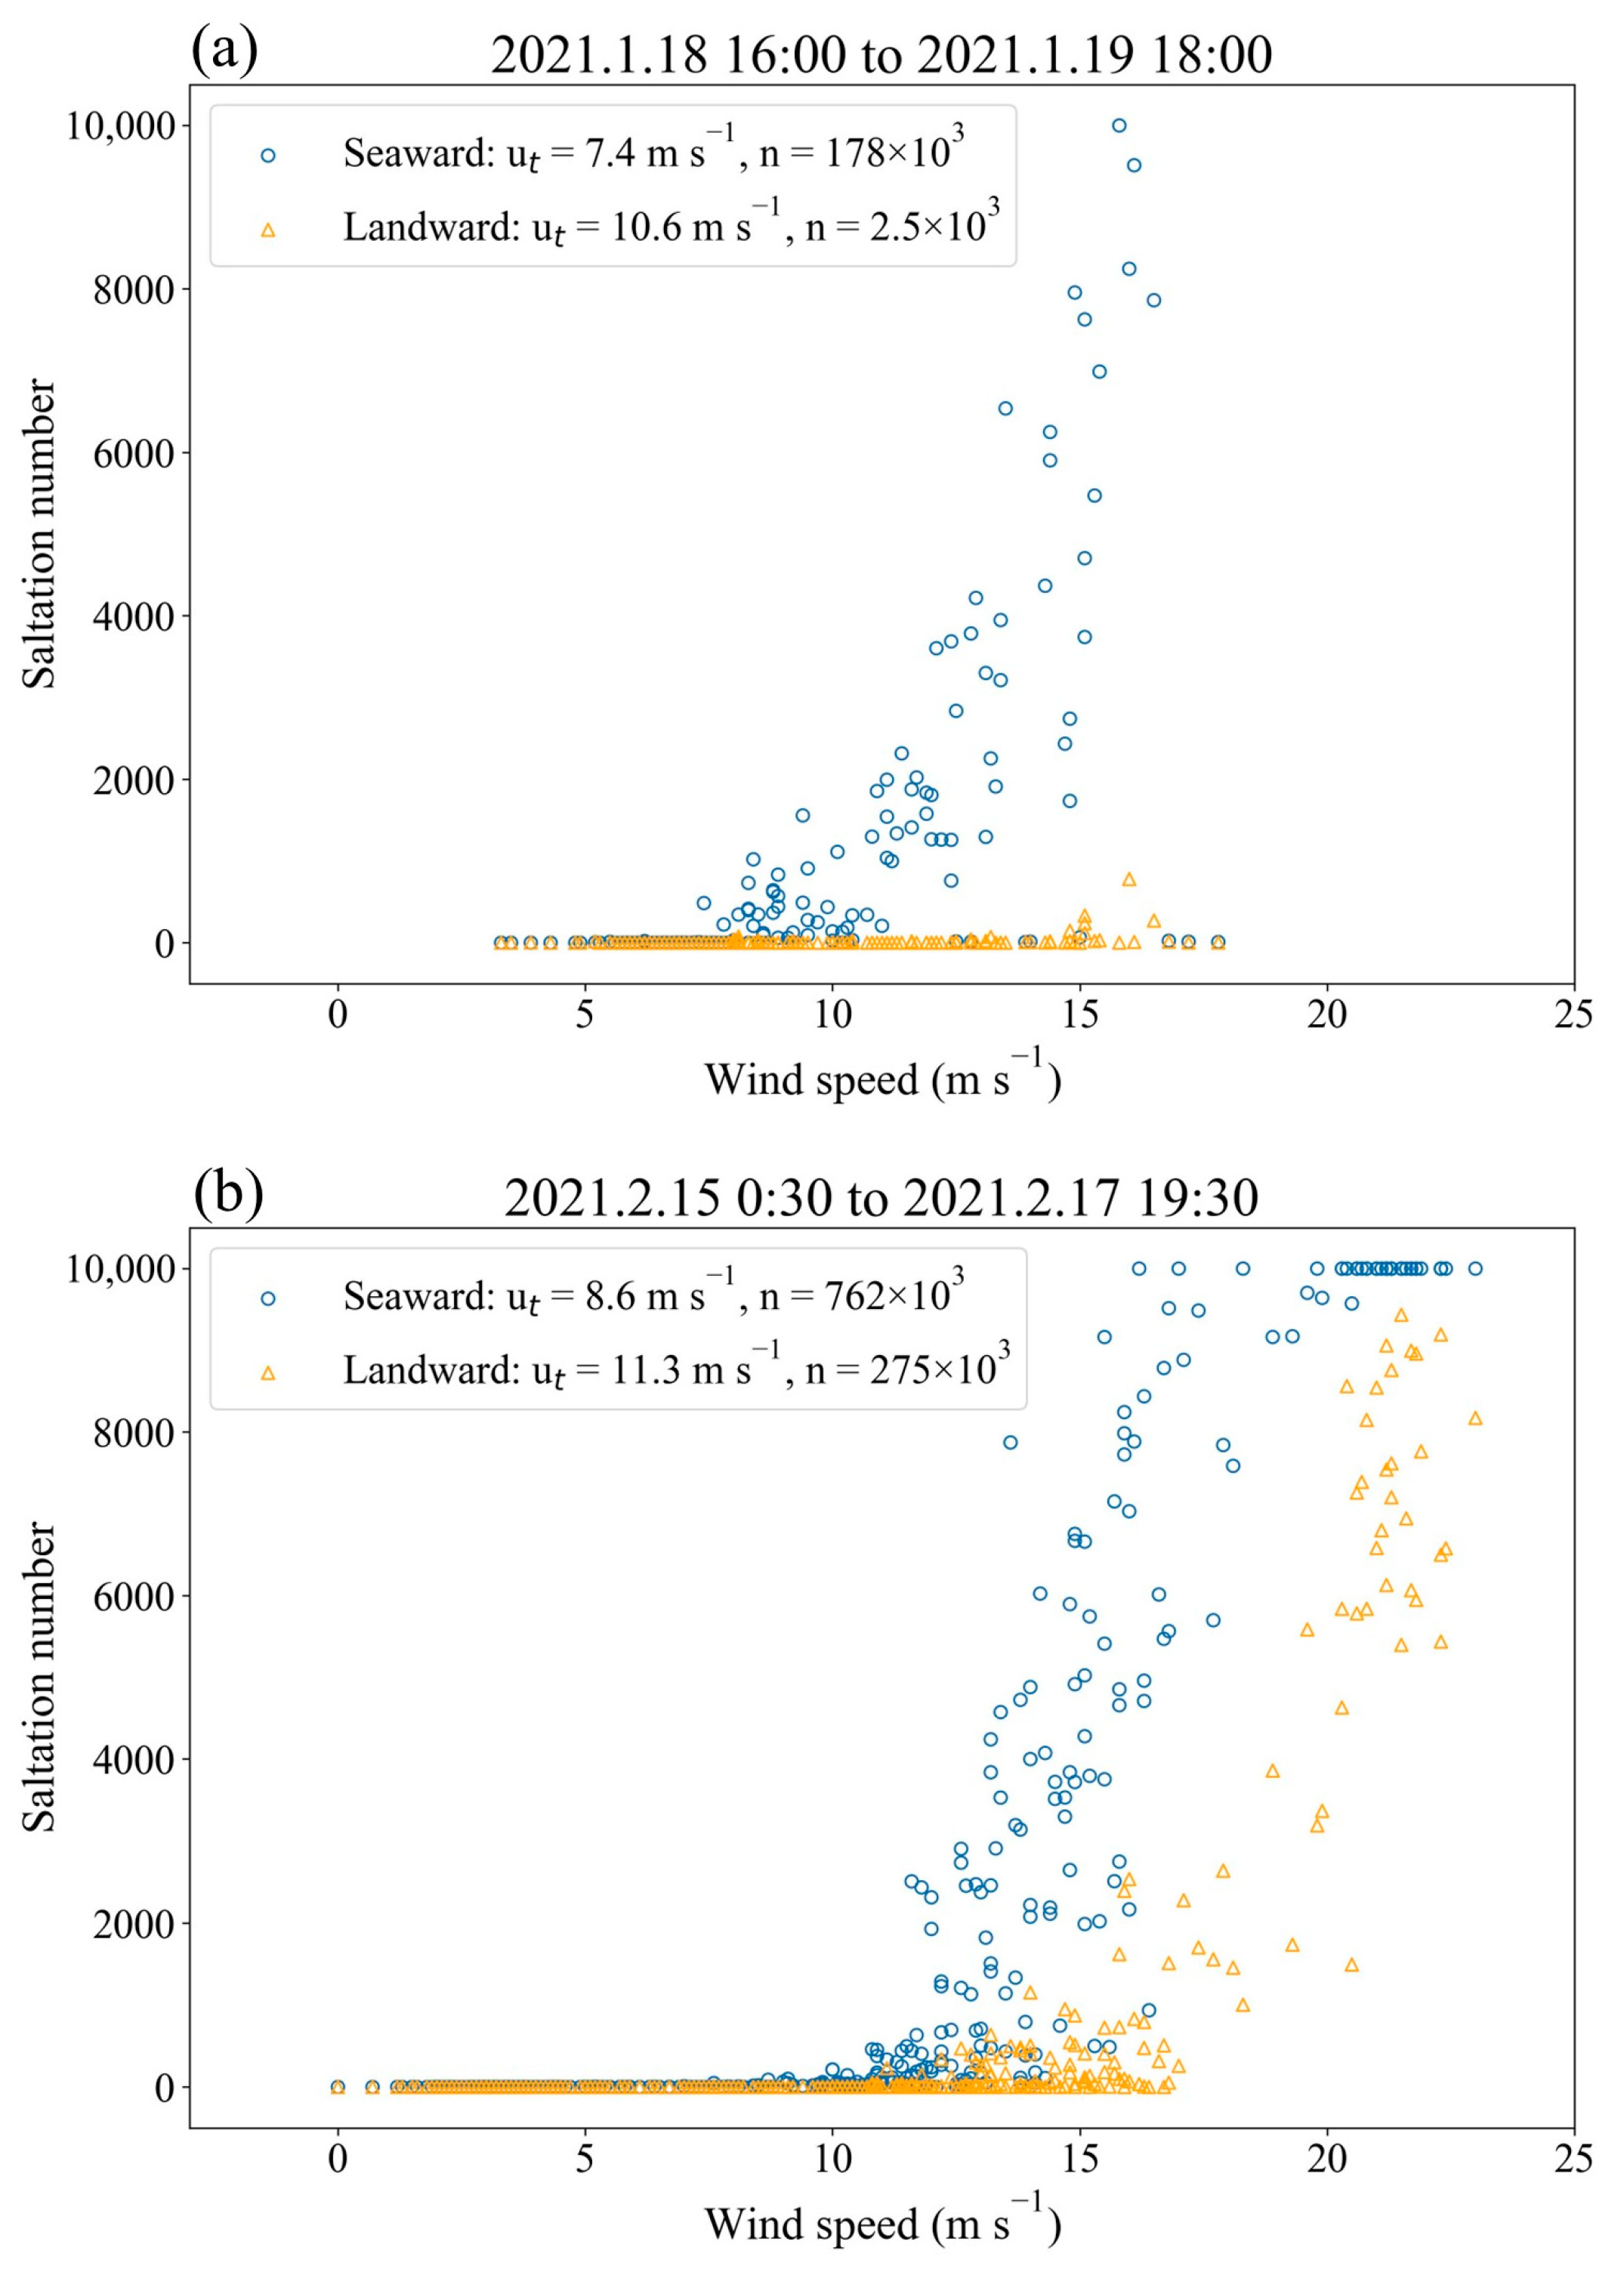
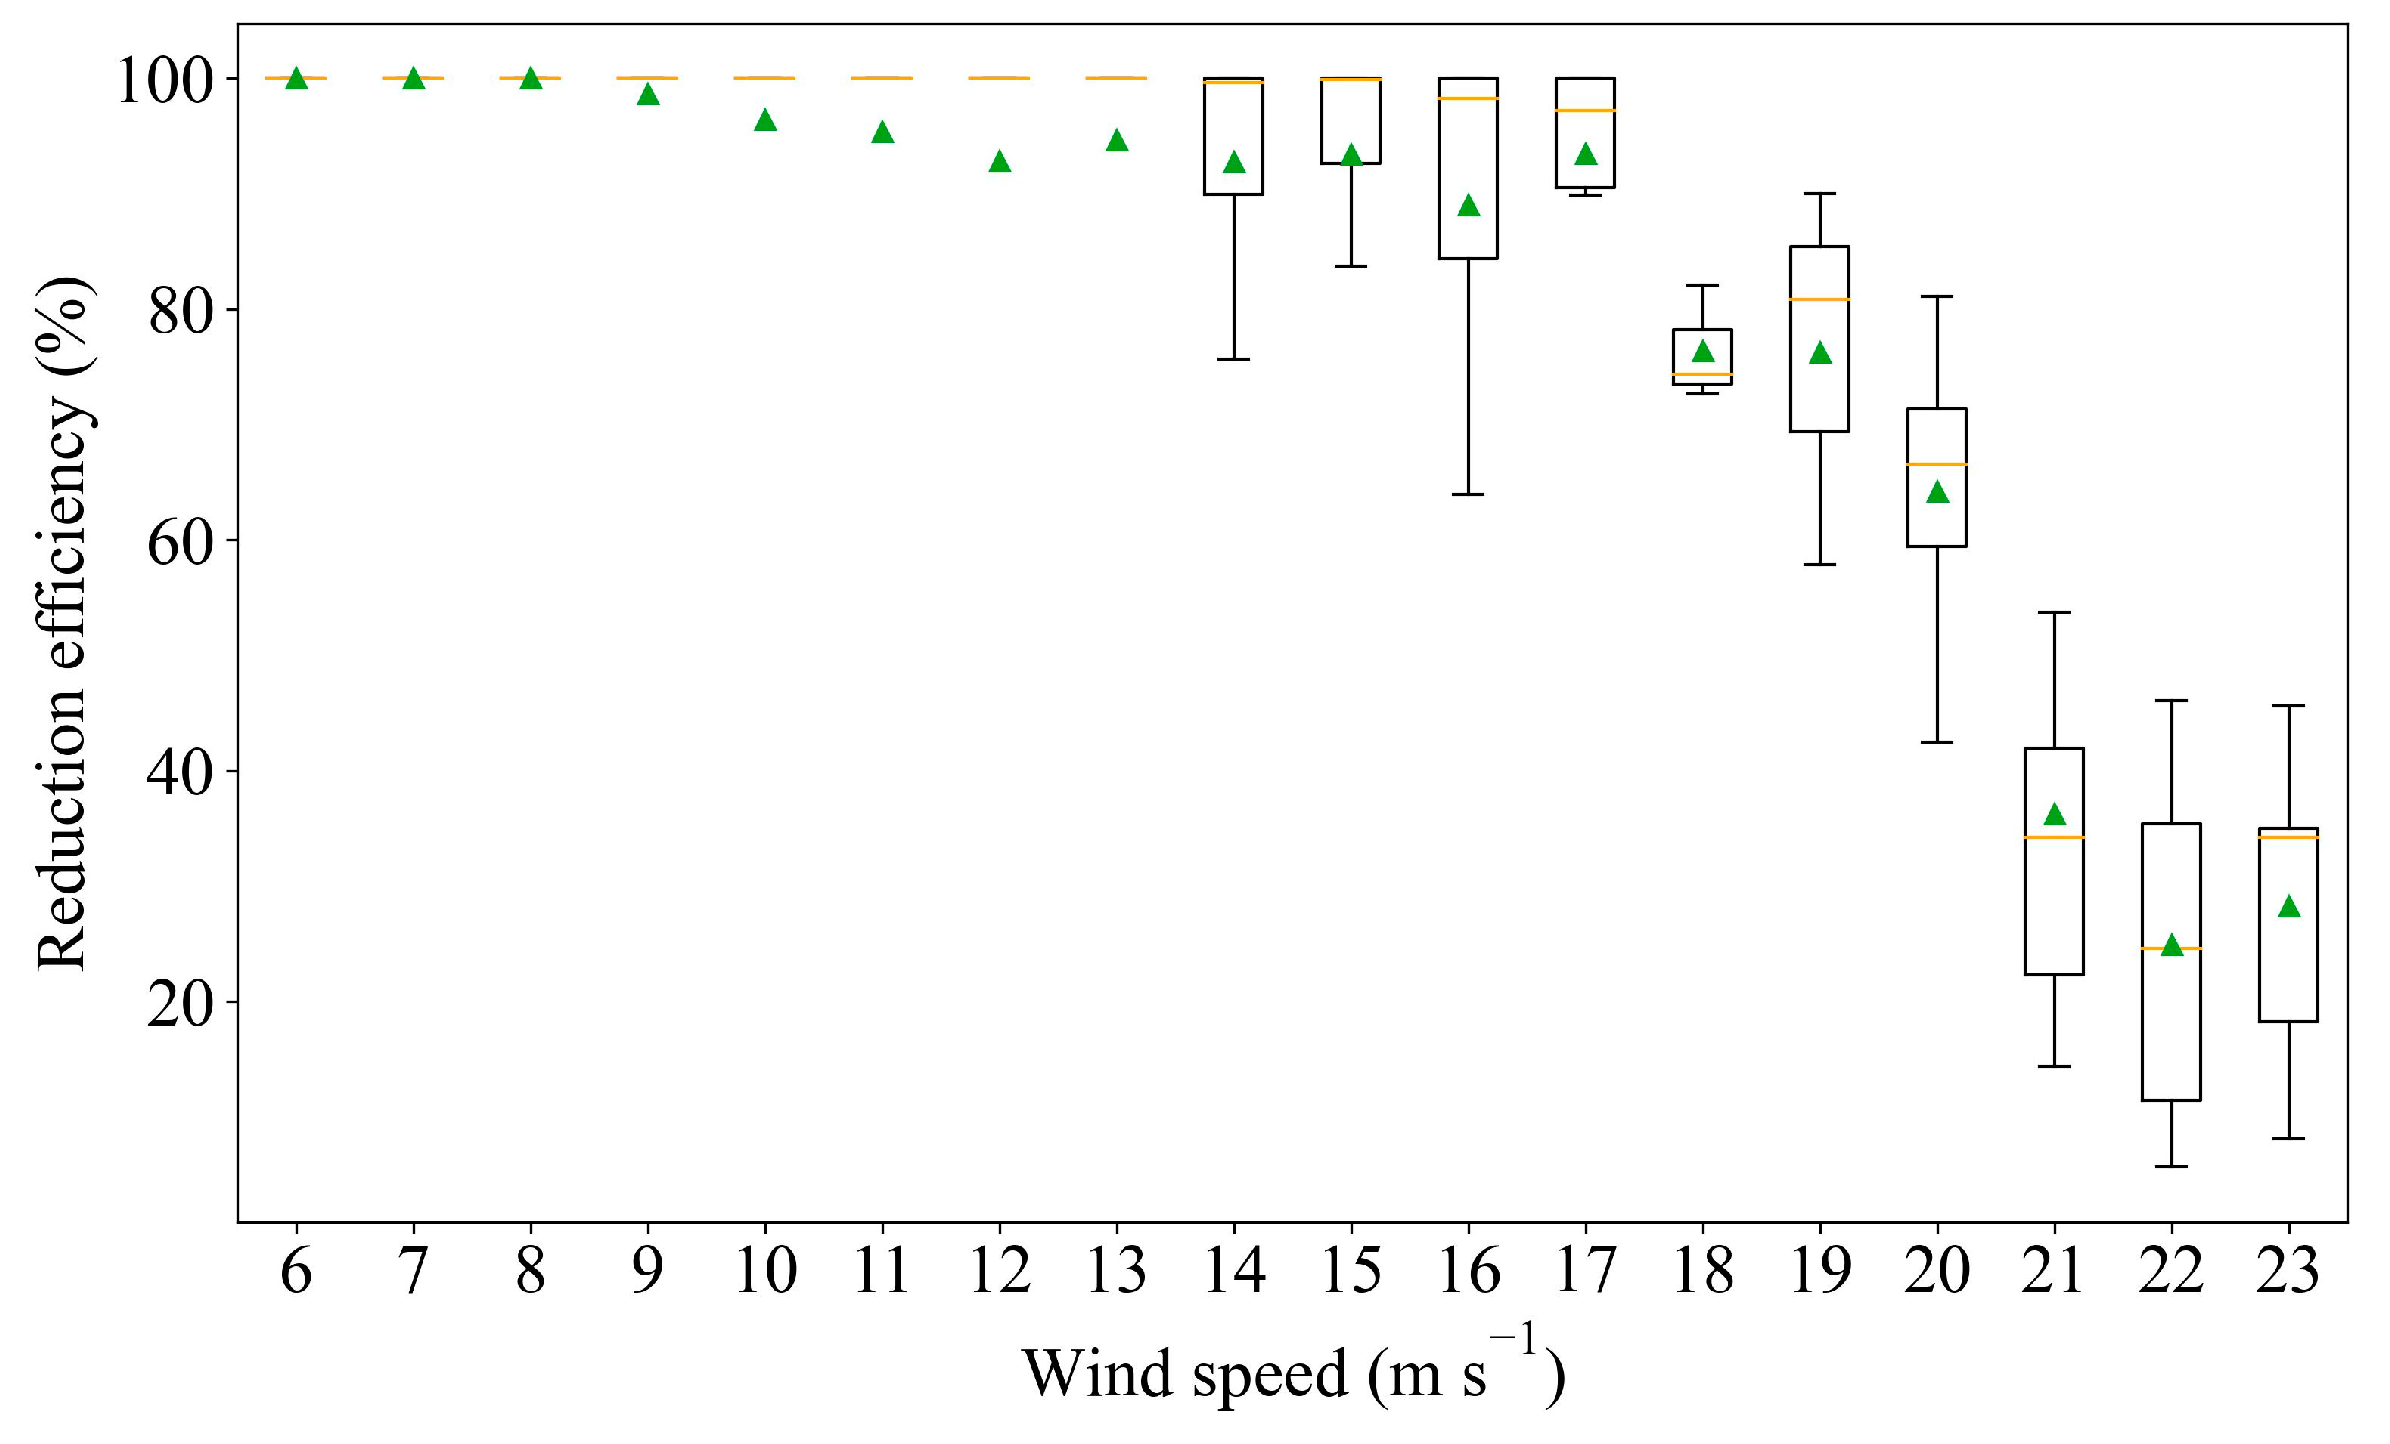
3.1. Wind Condition and Threshold Wind Speed for Sand Saltation

To understand the driving mechanisms for sand transport through the sand fence, we measured the monthly mean wind speed and direction from January to May 2021 (Figure 5). The mean wind speed varied from 4.4 to 6.4 m s−1. The highest mean wind speeds occurred in January and February, with values greater than 5.5 m s−1. The predominant wind direction during the measurement period was from the south, with a frequency of 22.5–34.4%. The wind with a maximum speed (26.9 m s−1) blew from the west. Winds with speeds greater than 10 m s−1 blew most often from the west and the south, and those with speeds greater than 15 m s−1 were most often from the west (Figure 5f).
During the observation period (January to May 2021), the threshold wind speed was higher in January and February, with values of 8.5 and 10.2 m s−1, respectively (Figure 6). The threshold wind speed decreased from March to May and fell within the range of 6.6 to 8.4 m s−1. The lower-threshold wind speeds in spring (March to May) compared with those in winter (January and February) indicated that sand particles are more readily picked up by strong wind during this period.

3.2. Sand-Trapping Efficiency of Sand Fences

During the observation period, significant sand saltation activity was observed during only two intervals, and saltation activity was large enough to reliably compare the threshold wind speed observed on the seaward and landward sides of the sand fence only during those intervals. The sand particle count on the seaward side n s was much higher than that on the landward side n l , particularly on January 18 and 19, when n s was approximately seventy times greater than n l (Figure 7). The blown sand was trapped by the sand fence; therefore, fewer sand saltation events were observed on the landward side of the fence. The mean threshold wind speeds on the seaward and landward sides during these two saltation activities were 7.4 m s−1 and 10.6 m s−1 in January (Figure 7a), and 8.6 m s−1 and 11.3 m s−1 in February (Figure 7b), respectively. Thus, the threshold wind speed on the seaward side of the sand fence was greater than that on the landward side, indicating effective sand trapping by the sand fences.
In the vertical profile of the relative blown-sand flux with a height that was measured inside the sand fence during the significant saltation activity in January, the relative blown-sand flux decayed exponentially with increasing height, and the relative blown-sand flux at 4 cm height accounted for approximately 20% of the total flux (Figure 8). We used the measured sand flux at 4 cm height to estimate the total sand flux in the near-ground surface layer and examined the mean reduction efficiency of the sand flux q r e (Figure 9). The value of q r e was 100% for wind speeds of 6–8 m s−1, indicating that all blown sand was trapped by the sand fence. The q r e values slightly decreased and fluctuated between 88% and 98% as the wind speed increased to 17 m s−1, decreased to about 60% with a further wind speed increase to 20 m s−1, and fell sharply to less than 40% for wind speeds exceeding 20 m s−1. The median values of reduction efficiency were 100% for wind speeds of 6–13 m s−1, although there were some outliers for wind speeds of 8–13 m s−1 (not shown in Figure 9). The median maintained high values greater than 95% as wind speeds increased to 17 m s−1. These results indicate that sand fences effectively trap wind-blown sand at wind speeds lower than 17 m s−1.

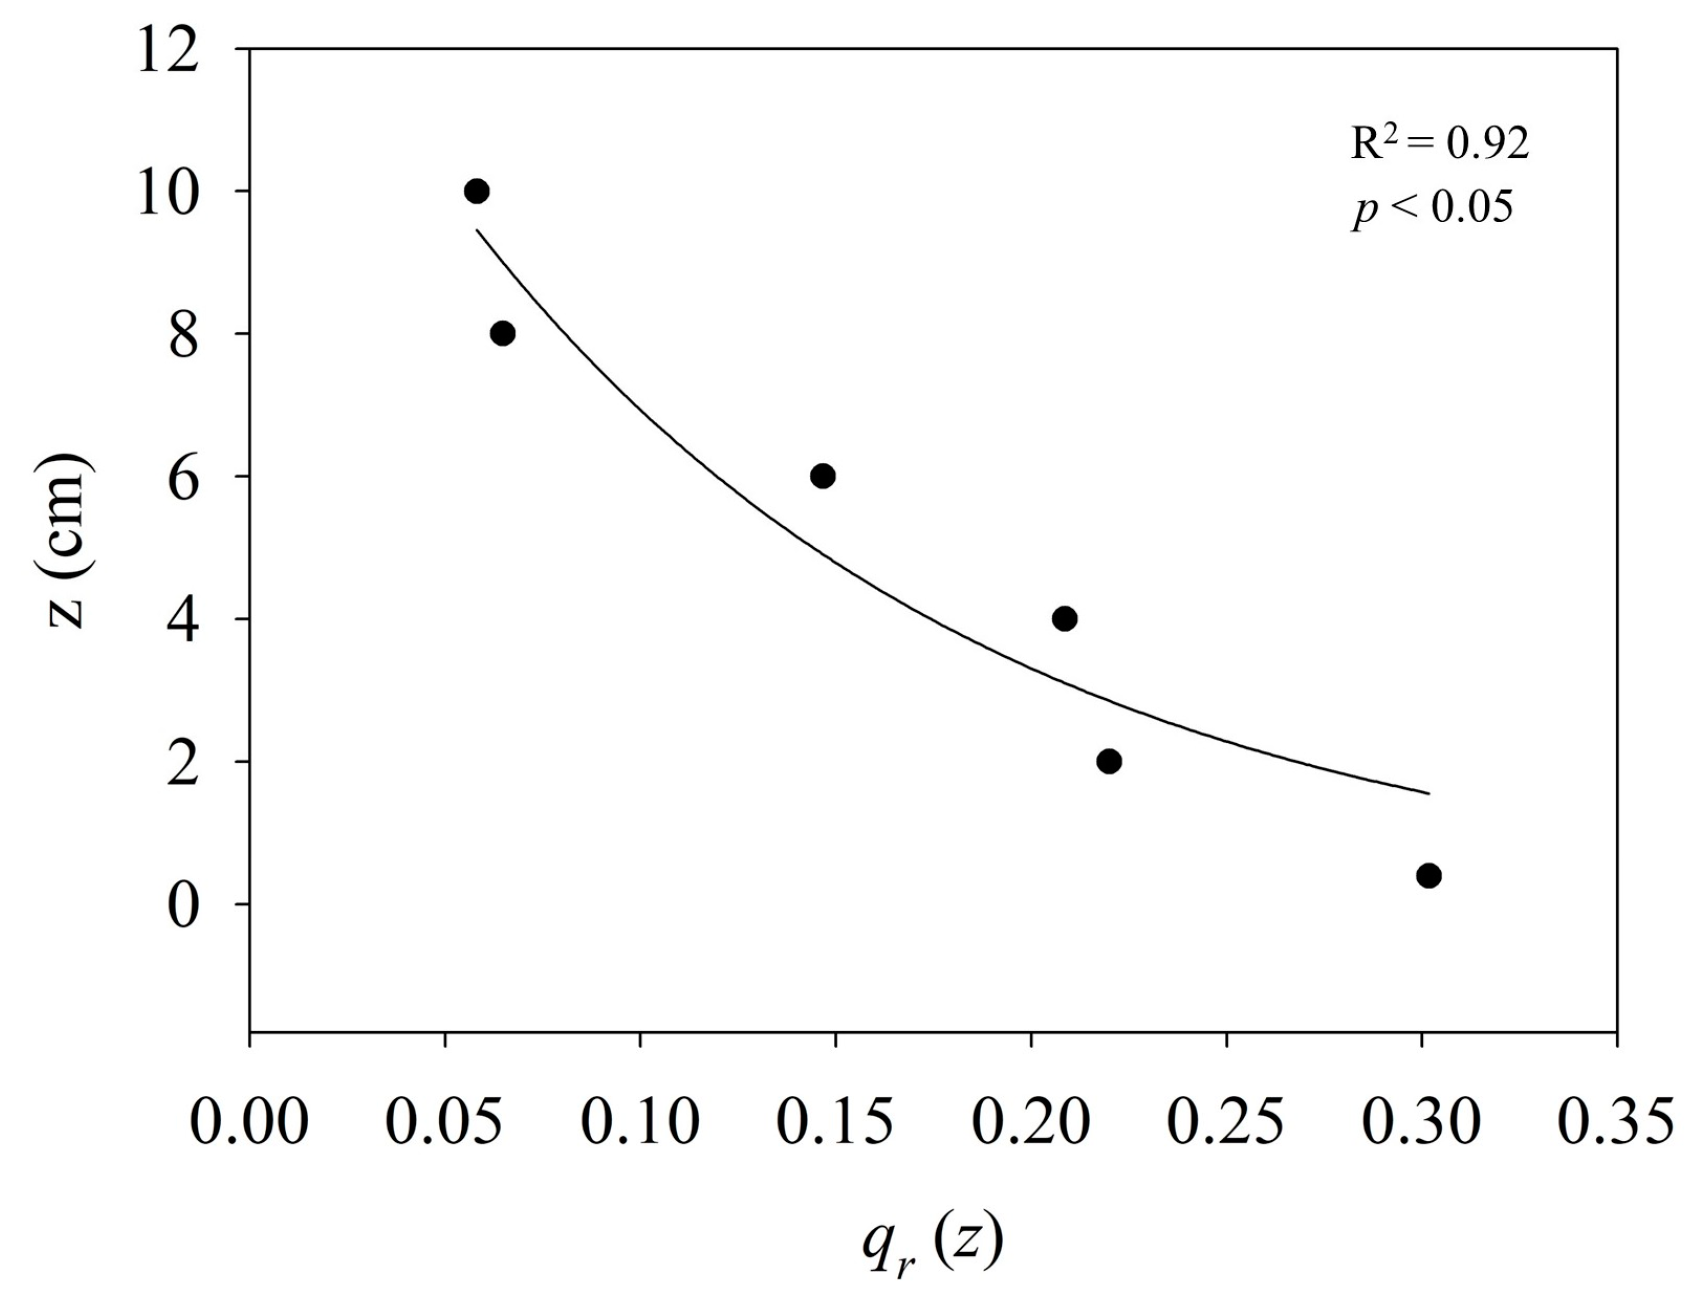
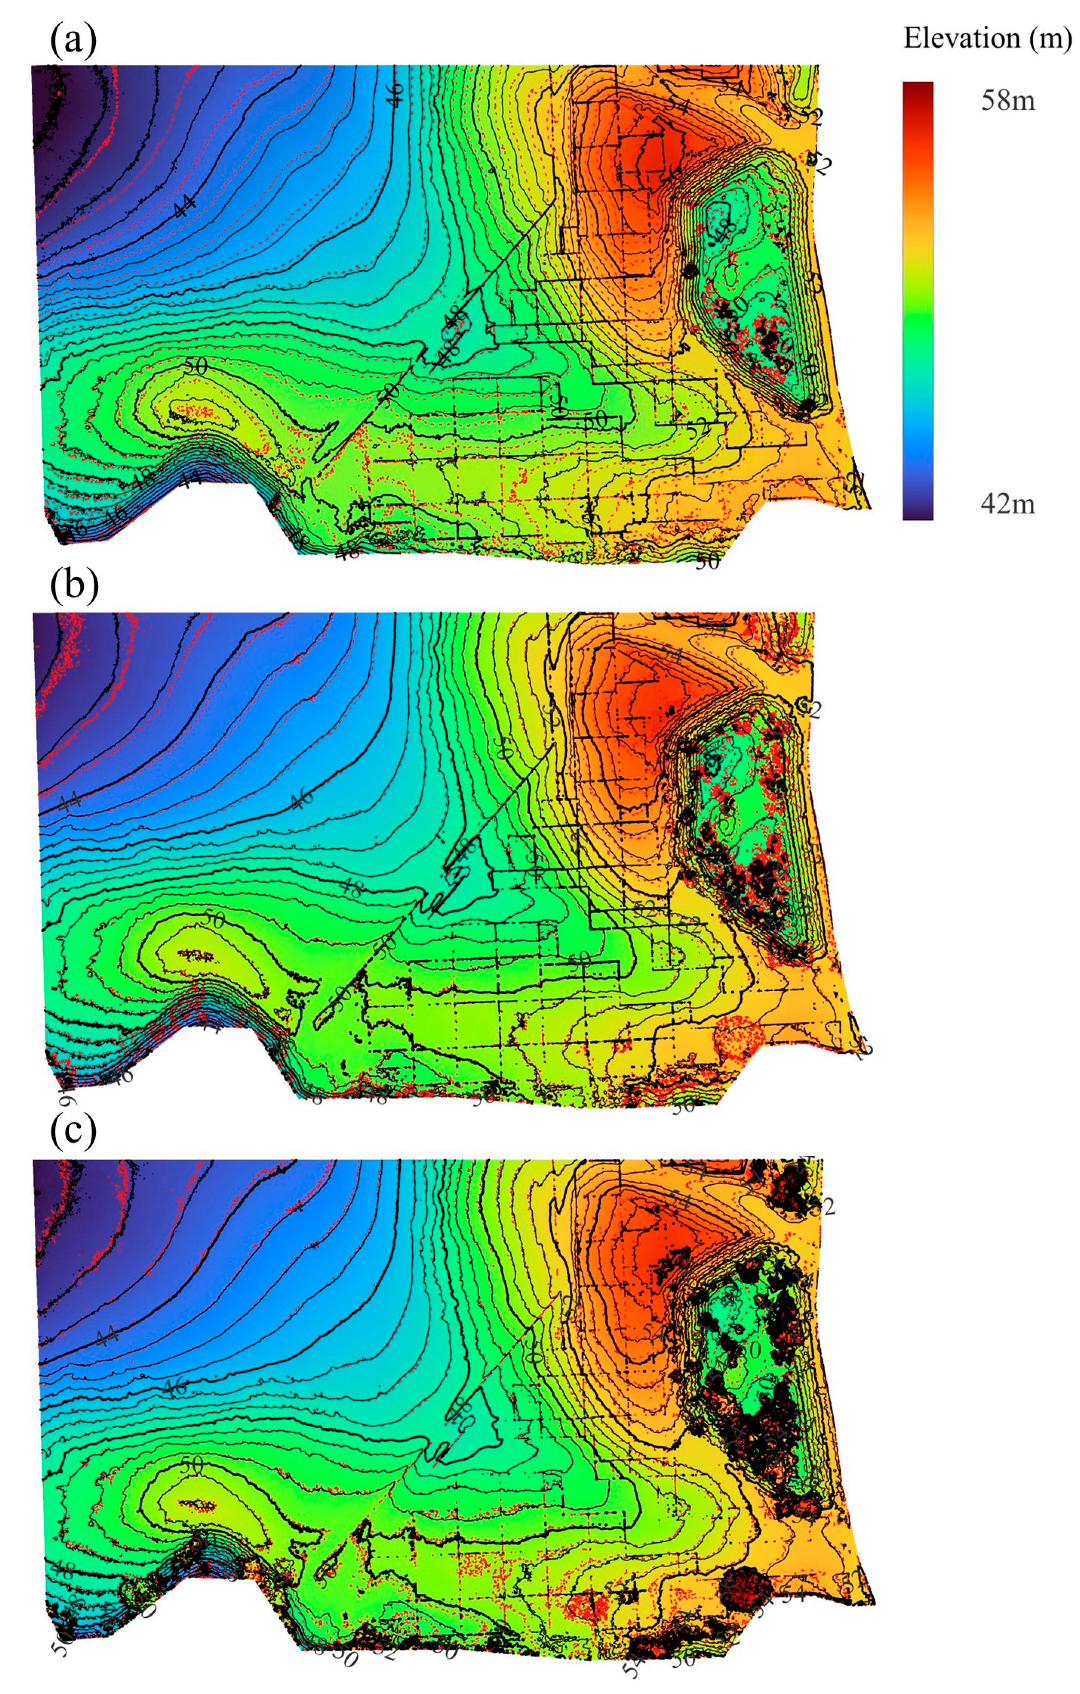
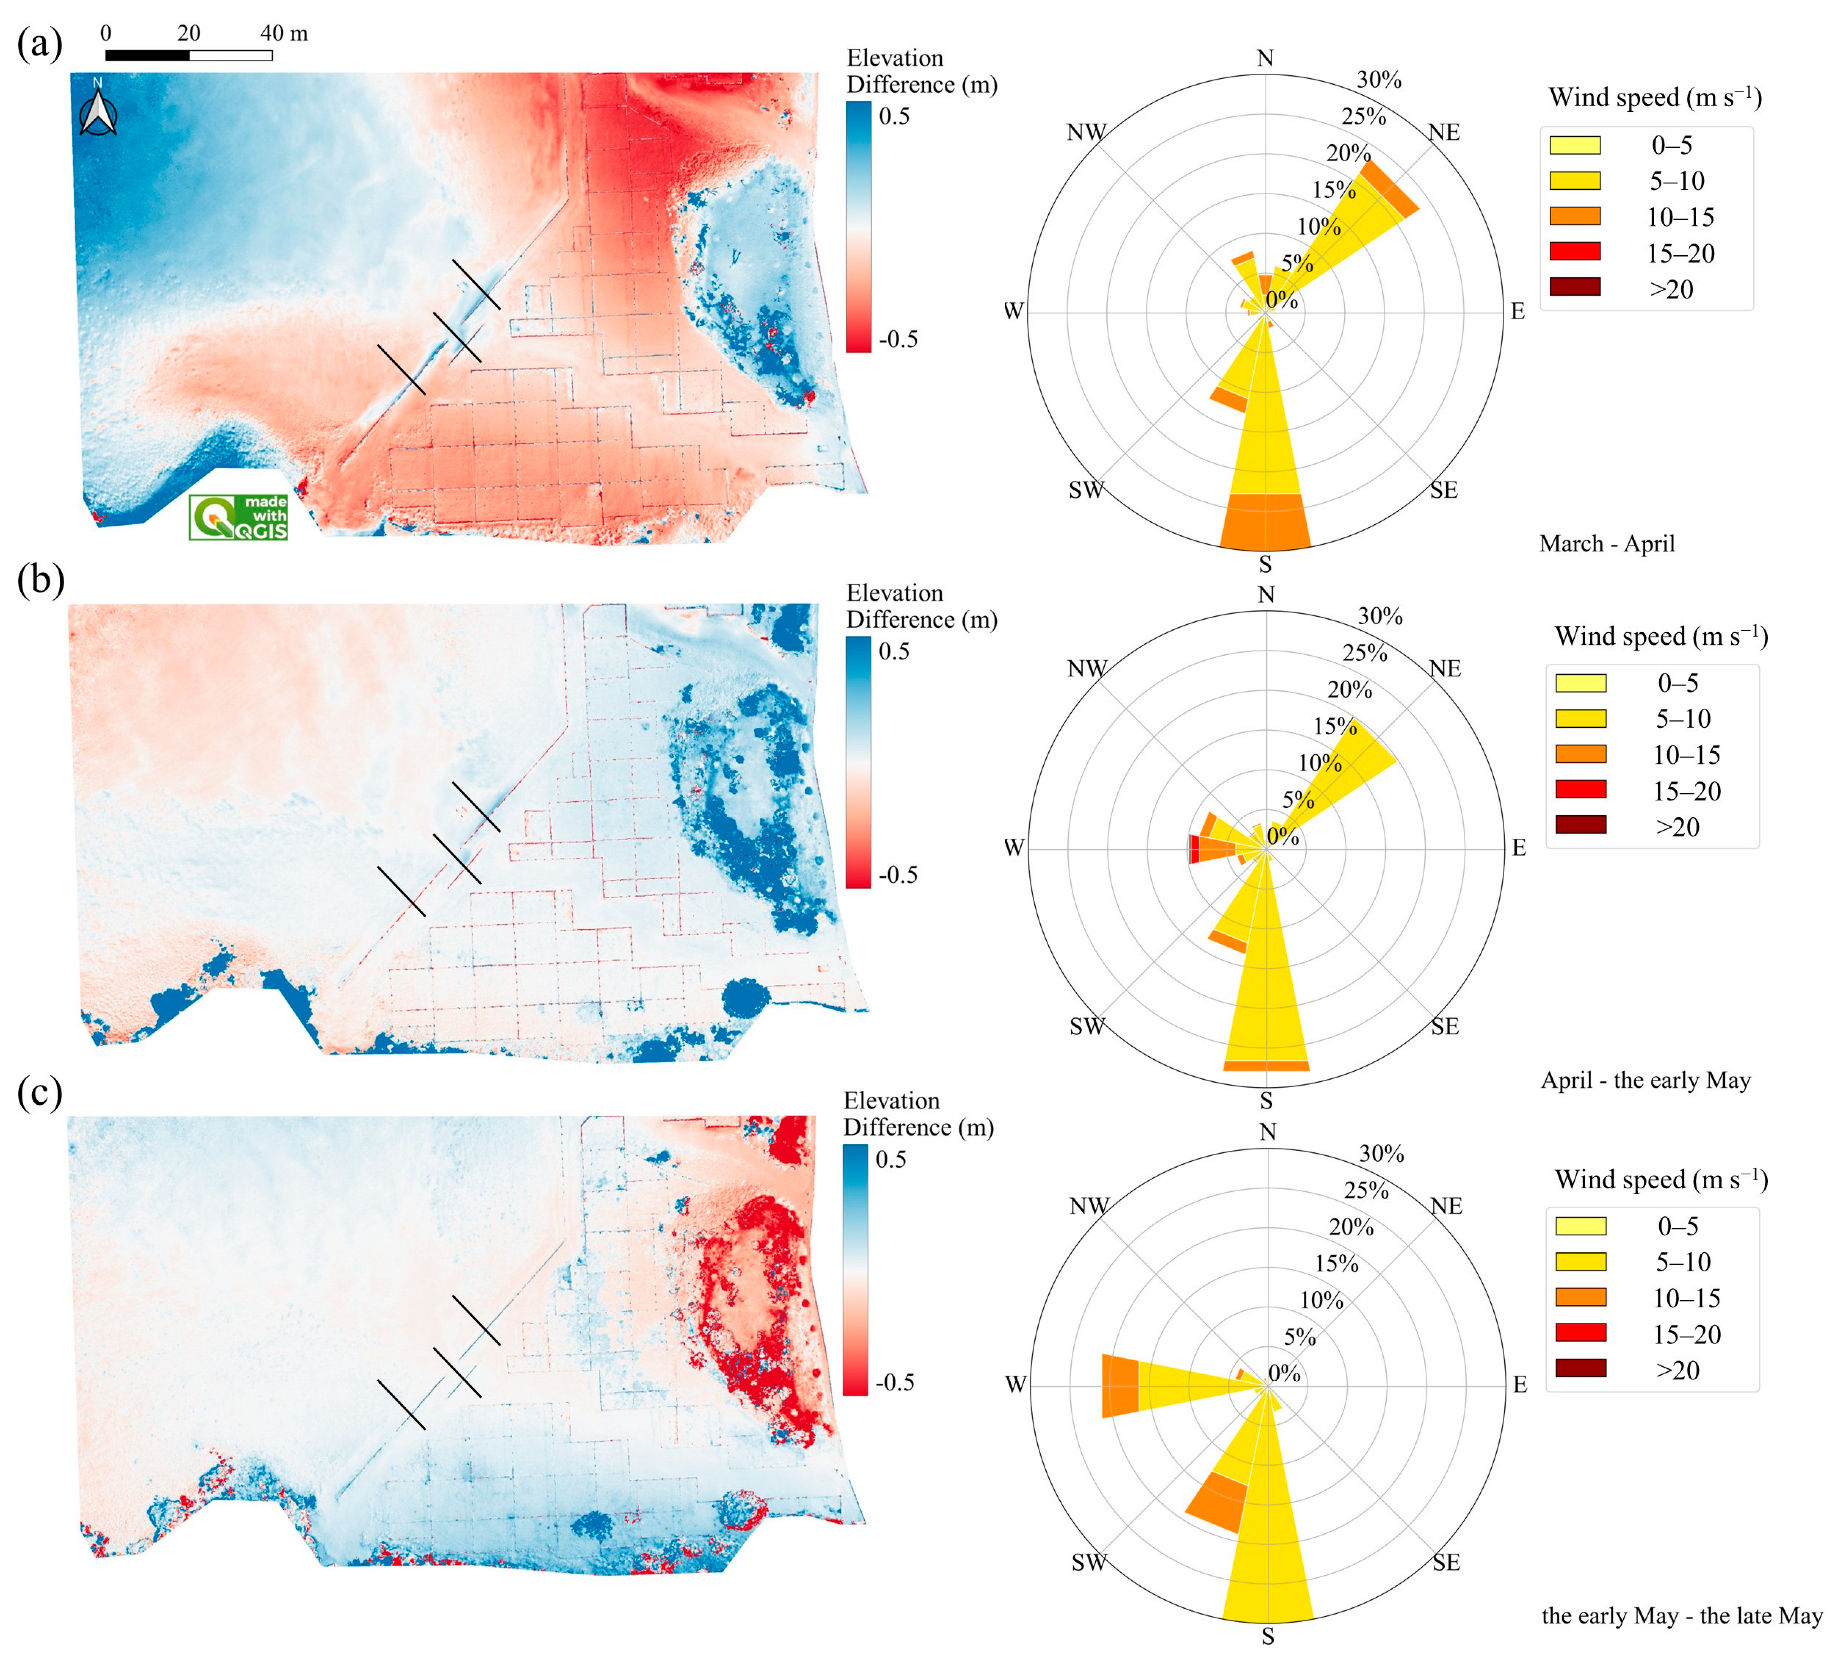
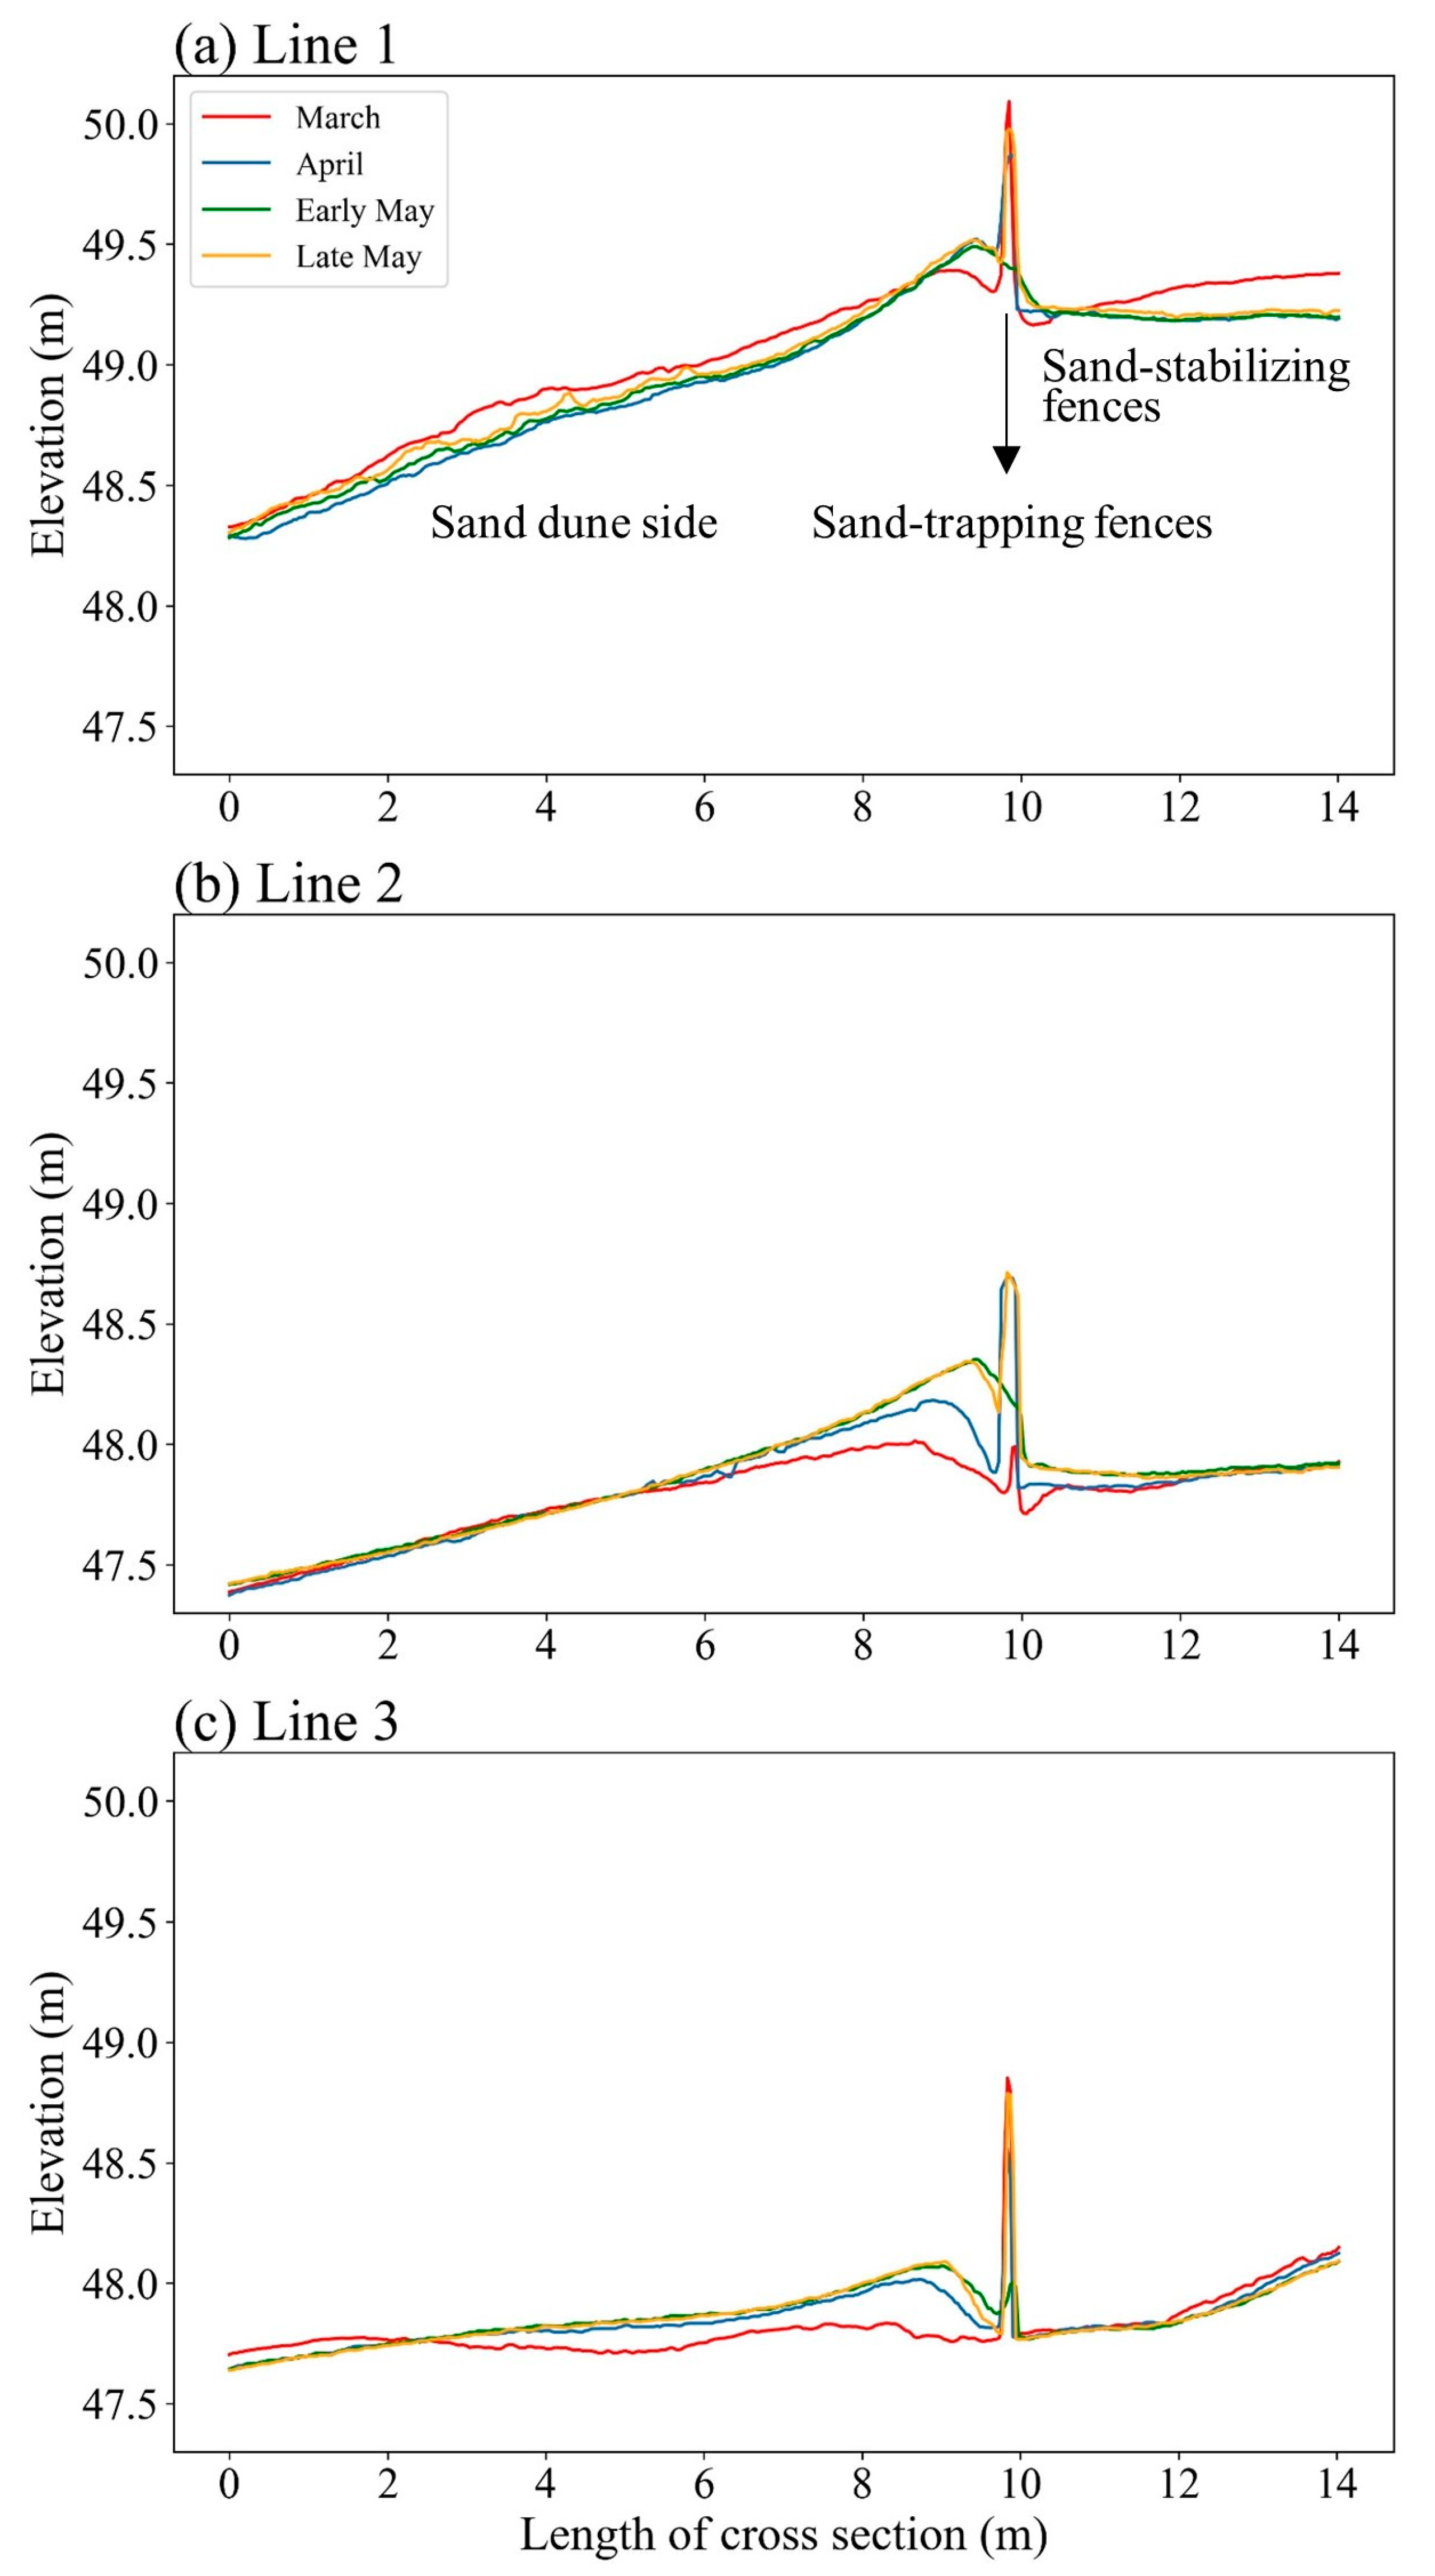
3.3. Influence of Sand-Trapping Fences on Sand Deposition

DEM differencing of the study areas revealed that elevation changes had occurred. During March and April, the slope areas of the sand-stabilizing fences moved westward or northward by approximately 0.5–3.5 m in the northern areas and 2–18 m in the southern areas, whereas the sand dune areas moved northeastward by about 1.5–8 m (Figure 10a). The elevation changes indicated that severe erosion had occurred in the sand fence areas and that deposition had taken place in the sand dune areas (Figure 11a). The spatial patterns of erosion and deposition suggest that sand particles were transported from the sand fence to sand dune areas by wind blowing from the south and northeast. However, a large amount of sand accumulated on the leeward side of the sand-trapping fences, especially around the middle part of the area (L3). This sand formed a foredune approximately 50 m long and ca. 0.8–4 m wide. From April to early May, obvious movement was not detected in the sand-stabilizing fence areas, whereas the sand dune areas moved slightly toward the fences (Figure 10b). Sand was transported from the sand dunes toward the sand fence areas by strong wind from the west (Figure 11b). Sand continued to build up on the foredune, with vertical accretion ranging from 0.08 to 0.4 m in front of the sand-trapping fences. Some sand accumulated at the sand-stabilizing fences, resulting in the deposition of 0.03–0.1 m of sand. During early and late May, the whole study area tended to be stable (Figure 10c). The amount of sand that had accumulated along the sand-trapping fences became smaller, with ~0.05 m vertical accretion, and more sand transported by the west wind was trapped by the sand-stabilizing fences, resulting in about 0.1–0.2 m of vertical accretion (Figure 11c). However, vegetation growth inside the sand-stabilizing fences could have masked some of the elevation changes; this effect is difficult to exclude when using UAV photogrammetry.
To clearly visualize the development of sand accumulation around the sand-trapping fences, we drew cross-section profiles perpendicular to those fences (Figure 12). Abrupt spikes less than 1 m high (equal to the height of the sand fence) are visible in each cross-section profile; we infer that they reflect the presence of the sand-trapping fence. However, the sand fence heights detected in each profile show some differences, because the sand fences cannot be appropriately visualized in the generated DEMs due to a lack of side textures from the ground objects captured from UAV photogrammetry [36]. The elevation changes in the three profiles indicate that most of the sand that accumulated during our observation period was on the sand dune side of the fences, whereas there was little change on the other sides of the fences. During March and April, a foredune developed on the sand dune side (i.e., leeward). The top of the dune was furthest from the fence in the L3 profile (Figure 12c), and closest in the L1 profile (Figure 12a). Sand continuously accumulated on the existing foredunes during April and May, even though strong westerly winds were observed. The most obvious increase in the elevation of the foredune occurred in the L2 profile (Figure 12b), indicating that the L2 sand-trapping fence trapped the largest amount of sand during this period. In addition, the foredunes gradually moved toward the sand-trapping fence during the observation period, and the sand-trapping function of these fences was gradually weakened as they became buried by the dunes.

4. Discussion

4.1. Effects of Sand Fences on Wind-Blown Sand and Sand Transport

The threshold wind speed is one of the most important parameters for describing the wind-blown-sand process. Spring is the season for frequent wind-blown sand due to low-threshold wind speeds, as was previously reported by Abulaiti and Kimura [39]. However, the threshold wind speed in January (winter) was comparable to that in April. The lack of sand saltation data for the strong sand saltation activity on January 29 and 30 has possibly resulted in an underestimation of the threshold wind speed for that month. Such strong sand saltation activities in winter might only occur when the surface is free of snow cover, or when the wind is extremely strong. In general, sand saltation is more likely to occur in spring.
The vertical structure of the wind-blown sand, as shown in Figure 7, followed the exponential decrease of wind-blown-sand flux with its increasing height, which has been stated as the best description for sand flux profile on the sand surface observed in wind tunnels (e.g., [54,55]) and in coastal areas (e.g., [56,57]). This result and the 20% proportion of the total sand flux at 4 cm height were in accordance with the structural characteristics of wind-blown sand over the sand surface in a wind tunnel using sand from the Tottori Sand Dune measured by Liu, Kimura, and Wu [49]. This simplified estimation of total sand flux in the near-ground surface was initially verified in the field and was then applied to evaluate the sand-trapping efficiency of the sand fences. Based on the estimated total sand flux, the sand fences trapped more than 80% of the wind-blown sand at wind speeds lower than 17 m s−1. The primary way of sand movement is sand saltation under the force of wind. Generally, 90% of sand saltation particles are transported from the first 20 cm above the dune surface ([37]), which is lower than the height of sand fences. The sand fences, therefore, would be effective in inhibiting sand saltation in the near-ground surface layer. However, sand particles could be suspended to a higher layer under strong wind conditions, resulting in the decreased sand reduction efficiency of sand fences with increasing wind speeds (Figure 9). It has been observed that sand saltation particles reached from 0.8 to 7 m above the surface at wind speeds of 15 m s−1 [16]. During our observation, the loss of the sand-trapping efficiency of the fences at wind speeds greater than 17 m s−1 may be because almost all of the sand particles are blown to a height that enables them to bypass the fences under strong wind conditions (>17 m s−1). The in situ observation of wind-blown sand allowed us to investigate changes in the amount of aeolian sand transportation at timescales ranging from hours to days [15,56].
The use of SfM techniques with UAV photogrammetry contributes to accurately resolving the morphologic features of the coastal dune on scales ranging from centimeters to kilometers [58]. The UAV-based SfM photogrammetry integrated with a total station survey in the present study generated DEMs with sufficient accuracy for monitoring the sand dune. In the early spring (March and early April), changes in morphology and sand deposition and erosion were the most obvious when the prevailing wind was from the south. From April to early May, wind-blown sand occurred due to an increasing frequency of west or northwest wind. The sand movement from the sand dune to the fence areas slowed down upon approaching the sand fences. The height of sand deposition was about two to four times the sand deposition in the sand-stabilizing fences during these months. Building foredunes by installing sand fences is a common human adjustment that influences sand sediment transport in coastal dunes (e.g., [59,60]). Therefore, the newly developed foredune in front of the sand-trapping fences may contribute to the better effect of the sand-trapping fences on reducing wind-blown sand. Between early and late May, although the frequency of the westerly wind increased, the occurrence of strong winds decreased. Therefore, both the fence and the dune areas presented rare morphological changes. The changes in elevation gradually decreased over time, indicating that the foredune growth was approaching an equilibrium. The magnitude of sand deposition became less around the sand-trapping fences but greater at the sand-stabilizing fences. Hotta and Horikawa [61] demonstrated that sand fences lose their sand-trapping function if they become buried up to 80% of their height. Although the development of the foredunes may not be fully detected in the current study, our results suggest that the efficiency of the sand-trapping fences diminished to some extent in the late spring. A longer-duration field survey is needed for further studies of the functions of sand-trapping fences.

4.2. Limitations of the Current Study

Our evaluation of the sand-trapping effect of sand fences based on the measured sand flux has the limitation that the UD-101 sensors were fixed in one direction, so we could not assess sand saltation activities originating from other directions. The sand-trapping efficiency of the sand fences discussed herein is only applicable to wind-blown sand derived from the northeast. A newly developed omnidirectional sensor that can catch sand particles as well as measure wind direction shows promise for future studies. Studies of the effects of sand fences often focus on wind reduction and flow fields (e.g., [5,62]); however, real-time observations of wind speed and direction were not available for the present study. These aspects should be considered in future work.
The complexity of coastal landforms means that coastal monitoring with high accuracy is difficult. UAV photogrammetry has become an important and affordable solution for coastal monitoring, although some errors such as doming effects still affect the accuracy of DEMs. Previous studies have indicated that increasing the numbers of GCPs could be a way to correct the doming effect (e.g., [63,64]); however, the number of GCPs in our study area was limited due to the topography of the dunes and the measurement by the total station. The problem can also be solved by using a GNSS RTK (real time kinematic)-equipped platform, which we have incorporated into our on-going and future work.
The present study utilized two approaches to evaluate the effects of sand fences: an assessment of aeolian sediment transport on the basis of wind-blown-sand flux observations, and a geospatial analysis of UAV-derived DEMs. The former method enables us to examine wind-blown sand in relation to wind conditions and other meteorological parameters. The latter method measures morphological changes, such as erosion and deposition on a local and wide spatial scale, as well as the timescale of the intervals between field surveys.

5. Conclusions

Sand fences installed in the coastal dunes are used to prevent damage caused by wind-blown sand. The present study aims to quantitatively evaluate the effectiveness of sand fences at the Tottori Sand Dunes based on an integrated use of UAV photogrammetry and sand saltation sensors. We conducted field observations from January to May 2021 to investigate sand movements and the effect of sand fences on sand trapping at the Tottori Sand Dunes. Sand saltation activities (for wind directions of north to west) were more intense in January and February, mainly because of strong westerly winds. Sand saltation also occurred from March to May, when the threshold wind speed was lower. Wind-blown sand was effectively trapped by the sand fences at wind speeds lower than 17 m s−1, reducing the sand flux by more than 80%. Sand particles accumulated behind (leeward of) the sand-trapping fence with 50% porosity during March and April; during this time, sand was transported from the fenced area to the sand dunes. During April and May, sand accumulated on the existing foredune, which was located windward of the sand-trapping fence. Although a rise in the topography around the sand-stabilizing fences was also observed, the vertical accretion in front of the sand-trapping fences was two to four times the sand deposition within the sand-stabilizing fences, indicating the important role of the sand-trapping fences. There was little change in either the sand deposition around the sand-trapping fences or the cross-section profiles across the sand-trapping fences during May. However, sand deposition was found at the sand-stabilizing fences. The results indicated that the sand-stabilizing fences may trap more sand than the sand-trapping fences if the latter become buried. Although a longer-duration field survey is needed for further studies of the function of sand-trapping fences, the findings of this study are expected to enhance the aerodynamics and morphodynamics of sand fence design applications in coastal dunes.

Author Contributions

Conceptualization, J.L.; methodology, J.L. and J.W.; software, J.L.; formal analysis, J.L. and R.K.; investigation, J.L. and J.W.; writing—original draft preparation, J.L. and J.W.; writing—review and editing, R.K.; visualization, J.L.; funding acquisition, J.L., J.W. and R.K. All authors have read and agreed to the published version of the manuscript.

Funding

This research was funded by the Japan Society for the Promotion of Science KAKENHI grant numbers 19H04239, 21K17880, and 22K18025.

Institutional Review Board Statement

Not applicable.

Informed Consent Statement

Not applicable.

Data Availability Statement

Not applicable.

Acknowledgments

We thank the Department of the Environment and Consumers Affairs, Tottori Prefecture, for supporting our field surveys at the Tottori Sand Dunes. We appreciate invaluable comments by four reviewers and editors on this paper.

Conflicts of Interest

The authors declare no conflict of interest.

References

  1. Takayama, N.; Kimura, R.; Liu, J.Q.; Moriyama, M. Long-term spatial distribution of vegetation and sand movement following the commencement of landscape conservation activities to curb grassland encroachment at the Tottori Sand Dunes natural monument (Vegetation and sand movement in the Tottori Sand Dunes). Int. J. Remote Sens. 2020, 41, 3070–3094. [Google Scholar] [CrossRef]
  2. Wang, H.; Takle, E.S. On shelter efficiency of shelterbelts in oblique wind. Agric. For. Meteorol. 1996, 81, 95–117. [Google Scholar] [CrossRef]
  3. Xin, G.W.; Huang, N.; Zhang, J.; Dun, H.C. Investigations into the design of sand control fence for Gobi buildings. Aeolian Res. 2021, 49. [Google Scholar] [CrossRef]
  4. Li, B.L.; Sherman, D.J. Aerodynamics and morphodynamics of sand fences: A review. Aeolian Res. 2015, 17, 33–48. [Google Scholar] [CrossRef]
  5. Dong, Z.; Luo, W.; Qian, G.; Wang, H. A wind tunnel simulation of the mean velocity fields behind upright porous fences. Agric. For. Meteorol. 2007, 146, 82–93. [Google Scholar] [CrossRef]
  6. Dong, Z.; Qian, G.; Luo, W.; Wang, H. Threshold velocity for wind erosion: The effects of porous fences. Environ. Geol. 2006, 51, 471–475. [Google Scholar] [CrossRef]
  7. Bofah, K.; Al-Hinai, K. Field tests of porous fences in the regime of sand-laden wind. J. Wind Eng. Ind. Aerod. 1986, 23, 309–319. [Google Scholar] [CrossRef]
  8. Gage, B.O. Experimental Dunes of the Texas Coast; US Coastal Engineering Research Center: Washington, DC, USA, 1970. [Google Scholar]
  9. Manohar, M.; Bruun, P. Mechanics of dune growth by sand fences. Dock Harb. Auth. 1970, 51, 243. [Google Scholar]
  10. Zhang, K.; Zu, R.; Fang, H. Simulation on abrated effect of nylon net with different porosities on wind-blown sand in wind tunnel. J. Soil Water Conserv. 2004, 18, 4–7. [Google Scholar]
  11. Phillips, C.J.; Willetts, B.B. Predicting sand deposition at porous fences. J. Waterw. Port Coast. Ocean Div. 1979, 105, 15–31. [Google Scholar] [CrossRef]
  12. Trossel, C. Eolian sand control in Saudi Arabia as experienced by ARAMCO. In Proceedings of the a Symposium on Geotechnical Problems in Saudi Arabia, Riyadh, Saudi Arabia, 11–13 May 1981; pp. 329–360. [Google Scholar]
  13. Hotta, S.; Kraus, N.C.; Horikawa, K. Function of Sand Fences in Controlling Wind-Blown Sand. Coast. Sediments 1987, 772–787. [Google Scholar]
  14. Li, B.L.; Ning, Q.Q. Effect of opening geometry of sand fences on dune formation. Geophys. Res. Abstr. 2019, 21, EGU2019-9909-2011. [Google Scholar]
  15. Eichmanns, C.; Lechthaler, S.; Zander, W.; Pérez, M.V.; Blum, H.; Thorenz, F.; Schüttrumpf, H. Sand Trapping Fences as a Nature-Based Solution for Coastal Protection: An International Review with a Focus on Installations in Germany. Environments 2021, 8, 135. [Google Scholar] [CrossRef]
  16. Wu, Z. Aeolian Geomorphology; Science Press: Beijing, China, 1987. [Google Scholar]
  17. Sherman, D.J. Understanding wind-blown sand: Six vexations. Geomorphology 2020, 366, 107193. [Google Scholar] [CrossRef]
  18. Hosaka, K.; Ugal, M.; Kubota, S.; Oguri, Y. Experiment for wind blown sand using a ceramics piezo-electric sensor. Proc. Civ. Eng. Ocean. 2004, 20, 1091–1096. [Google Scholar] [CrossRef]
  19. Liu, J.; Kimura, R. Wind speed characteristics and blown sand flux over a gravel surface in a compact wind tunnel. Aeolian Res. 2018, 35, 39–46. [Google Scholar] [CrossRef]
  20. Ellis, J.T.; Morrison, R.F.; Priest, B.H. Detecting impacts of sand grains with a microphone system in field conditions. Geomorphology 2009, 105, 87–94. [Google Scholar] [CrossRef]
  21. Hotta, S.; Harikai, S. State-of-the-art in Japan on controlling wind-blown sand on beaches. Coast. Eng. Proc. 2011, 32, 110. [Google Scholar] [CrossRef]
  22. Udo, K. Field Observations of Aeolian Sand Transport Rate Using a Piezoelectric Ceramic Sensor. Proc. Coast. Eng. 2008, 55, 551–555. [Google Scholar] [CrossRef]
  23. Udo, K. New method for estimation of aeolian sand transport rate using ceramic sand flux sensor (UD-101). Sensors 2009, 9, 9058–9072. [Google Scholar] [CrossRef] [PubMed] [Green Version]
  24. Li, B.; Ning, Q.; Yu, Y.; Ma, J.; Meldau, L.F.; Liu, J.; He, Y. A laser sheet sensor (LASS) for wind-blown sand flux measurement. Aeolian Res. 2021, 50, 100681. [Google Scholar] [CrossRef]
  25. Itzkin, M.; Moore, L.J.; Ruggiero, P.; Hacker, S.D. The effect of sand fencing on the morphology of natural dune systems. Geomorphology 2020, 352, 106995. [Google Scholar] [CrossRef]
  26. Calkin, P.E.; Rutford, R.H. The sand dunes of Victoria Valley, Antarctica. Geogr. Rev. 1974, 64, 189–216. [Google Scholar] [CrossRef]
  27. Anfuso, G.; Dominguez, L.; Gracia, F. Short and medium-term evolution of a coastal sector in Cadiz, SW Spain. Catena 2007, 70, 229–242. [Google Scholar] [CrossRef]
  28. Bogle, R.; Redsteer, M.H.; Vogel, J. Field measurement and analysis of climatic factors affecting dune mobility near Grand Falls on the Navajo Nation, southwestern United States. Geomorphology 2015, 228, 41–51. [Google Scholar] [CrossRef]
  29. Mohammed, R.K. Enlargement the Sighting Distance of Sokkia Digital Level SDL30. In Proceedings of the 6th FIG Regional Conference 2007: Strategic Integration of Surveying Services, Hong Kong, China, 13–17 May 2007; Volume 7, pp. 11–13. [Google Scholar]
  30. Hermas, E.; Gaber, A.; Alqurashi, A.F. Advances in Measurement Techniques for Estimating Sand Dune Movements. Sand Dunes North. Hemisph. Distrib. Form. Migr. Manag. 2023, 1, 12. [Google Scholar]
  31. Chapapría, V.E.; Peris, J.S.; González-Escrivá, J.A. Coastal Monitoring Using Unmanned Aerial Vehicles (UAVs) for the Management of the Spanish Mediterranean Coast: The Case of Almenara-Sagunto. Int. J. Environ. Res. Public Health 2022, 19, 5457. [Google Scholar] [CrossRef]
  32. Vecchi, E.; Tavasci, L.; De Nigris, N.; Gandolfi, S. GNSS and Photogrammetric UAV Derived Data for Coastal Monitoring: A Case of Study in Emilia-Romagna, Italy. J. Mar. Sci. Eng. 2021, 9, 1194. [Google Scholar] [CrossRef]
  33. Bañón, L.; Pagán, J.I.; López, I.; Banon, C.; Aragonés, L. Validating UAS-Based Photogrammetry with Traditional Topographic Methods for Surveying Dune Ecosystems in the Spanish Mediterranean Coast. J. Mar. Sci. Eng. 2019, 7, 297. [Google Scholar] [CrossRef] [Green Version]
  34. Laporte-Fauret, Q.; Marieu, V.; Castelle, B.; Michalet, R.; Bujan, S.; Rosebery, D. Low-cost UAV for high-resolution and large-scale coastal dune change monitoring using photogrammetry. J. Mar. Sci. Eng. 2019, 7, 63. [Google Scholar] [CrossRef] [Green Version]
  35. Minervino Amodio, A.; Di Paola, G.; Rosskopf, C.M. Monitoring coastal vulnerability by using DEMs based on UAV spatial data. ISPRS Int. J. Geo-Inf. 2022, 11, 155. [Google Scholar] [CrossRef]
  36. Liu, J.; Kimura, R.; Wu, J.; Kawai, T. Use of UAV Photogrammetry for Monitoring Topographic Changes in the Tottori Sand Dunes, Japan. Sand Dune Res. 2022, 69, 1–9. [Google Scholar]
  37. Kimura, R. Natural Environment of Sand Dunes. In Tottori Sand Dunes -Nature and History of Japan’s Most Famous Coastal Dunes; Nagamatsu, D., Ed.; Imai Print Co., Ltd.: Yonago, Japan, 2022; pp. 30–33. [Google Scholar]
  38. Nagamatsu, D. Vegetation of the Dunes. In Tottori Sand Dunes -Nature and History of Japan’s Most Famous Coastal Dunes; Nagamatsu, D., Ed.; Imai Print Co., Ltd.: Yonago, Japan, 2022; pp. 40–42. [Google Scholar]
  39. Abulitipu, A.; Kimura, R. Characteristics of the sand drifting of Tottori sand dune in springtime. Sand Dune Res. 2011, 58, 31–39. [Google Scholar]
  40. Yamanaka, N. From Agricultural Development in the Tottori Sand Dunes to Dryland Development in the World; Tottori University: Tottori, Japan, 2020; p. 48. [Google Scholar]
  41. Agisoft, L. Metashape python reference. Release 2020, 1, 1–199. [Google Scholar]
  42. Smith, M.W.; Carrivick, J.L.; Quincey, D.J. Structure from motion photogrammetry in physical geography. Prog. Phys. Geog. 2016, 40, 247–275. [Google Scholar] [CrossRef] [Green Version]
  43. Snavely, K.N. Scene Reconstruction and Visualization from Internet Photo Collections; University of Washington: Washington, DC, USA, 2008; Available online: https://www.cs.cornell.edu/~snavely/publications/thesis/thesis.pdf (accessed on 21 October 2022).
  44. Geospatial Information Authority of Japan. The Manual for Public Survey Using UAV (Proposed) March 2017 Version. Available online: https://www.gsi.go.jp/common/000186712.pdf (accessed on 5 October 2022).
  45. Team, Q.D. QGIS Geographic Information System. Available online: http://qgis.osgeo.org (accessed on 15 October 2022).
  46. Hotta, S. A Review of Two-Dimensional Accumulation Forms around Single-RowSand Fences. Trans. Jpn. Geomophol. Union 2014, 35, 1–23. [Google Scholar]
  47. Kubota, S.; Hosaka, K.; Tamura, T. Development of wind blown sand measuring device used a ceramic piezo-electric sensor: Part 2. Verification by a visual analysis using a high-speed camera. Rep. Res. Inst. Sci. Technol. Nihon Univ. 2007, 115, 141–149. [Google Scholar]
  48. Liu, J.; Kimura, R.; Wu, J. Vertical Profiles of Wind-Blown Sand Flux over Fine Gravel Surfaces and Their Implications for Field Observation in Arid Regions. Atmosphere 2020, 11, 1029. [Google Scholar] [CrossRef]
  49. Wu, Z. Geomorphology of Wind-Drift Sands and Their Controlled Engineering; Science Press: Beijing, China, 2003. [Google Scholar]
  50. Liu, J.; Kimura, R.; Wu, J. Aerodynamic characteristics over fine-grained gravel surfaces in a wind tunnel. Front. Earth Sci. 2021, 9, 1125. [Google Scholar] [CrossRef]
  51. Barchyn, T.E.; Hugenholtz, C.H. Comparison of four methods to calculate aeolian sediment transport threshold from field data: Implications for transport prediction and discussion of method evolution. Geomorphology 2011, 129, 190–203. [Google Scholar] [CrossRef]
  52. Wu, J.; Kurosaki, Y.; Gantsetseg, B.; Ishizuka, M.; Sekiyama, T.T.; Buyantogtokh, B.; Liu, J. Estimation of dry vegetation cover and mass from MODIS data: Verification by roughness length and sand saltation threshold. Int. J. Appl. Earth Obs. Geoinf. 2021, 102, 102417. [Google Scholar] [CrossRef]
  53. Kimura, R.; Abulaiti, A. Wind direction and speed in Tottori sand dune from 2012 to 2014. Sand Dune Res. 2016, 63, 49–56. [Google Scholar]
  54. Liu, X.P.; Dong, Z.B. Experimental investigation of the concentration profile of a blowing sand cloud. Geomorphology 2004, 60, 371–381. [Google Scholar] [CrossRef]
  55. Zhang, K.C.; Qu, J.J.; Zu, R.P.; Ta, W.Q. Characteristics of wind-blown sand on Gobi/mobile sand surface. Environ. Geol. 2008, 54, 411–416. [Google Scholar] [CrossRef]
  56. Martin, R.L.; Kok, J.F. Wind-invariant saltation heights imply linear scaling of aeolian saltation flux with shear stress. Sci. Adv. 2017, 3, e1602569. [Google Scholar] [CrossRef] [Green Version]
  57. Rotnicka, J. Aeolian vertical mass flux profiles above dry and moist sandy beach surfaces. Geomorphology 2013, 187, 27–37. [Google Scholar] [CrossRef]
  58. Conlin, M.; Cohn, N.; Ruggiero, P. A quantitative comparison of low-cost structure from motion (SfM) data collection platforms on beaches and dunes. J. Coast. Res. 2018, 34, 1341–1357. [Google Scholar] [CrossRef]
  59. Jackson, N.L.; Nordstrom, K.F. Aeolian sediment transport and morphologic change on a managed and an unmanaged foredune. Earth Surf. Process. Landf. 2013, 38, 413–420. [Google Scholar] [CrossRef]
  60. Miller, D.L.; Thetford, M.; Yager, L. Evaluation of sand fence and vegetation for dune building following overwash by Hurricane Opal on Santa Rosa Island, Florida. J. Coast. Res. 2001, 17, 936–948. [Google Scholar]
  61. Hotta, S.; Horikawa, K. Function of sand fence placed in front of embankment. In Proceedings of the 22nd International Conference on Coastal Engineering, Delft, The Netherlands, 2–6 July 1990; pp. 2754–2767. [Google Scholar]
  62. Cheng, J.-J.; Lei, J.-Q.; Li, S.-Y.; Wang, H.-F. Disturbance of the inclined inserting-type sand fence to wind–sand flow fields and its sand control characteristics. Aeolian Res. 2016, 21, 139–150. [Google Scholar] [CrossRef]
  63. Casella, E.; Drechsel, J.; Winter, C.; Benninghoff, M.; Rovere, A. Accuracy of sand beach topography surveying by drones and photogrammetry. Geo-Mar. Lett. 2020, 40, 255–268. [Google Scholar] [CrossRef] [Green Version]
  64. Tonkin, T.N.; Midgley, N.G. Ground-control networks for image based surface reconstruction: An investigation of optimum survey designs using UAV derived imagery and structure-from-motion photogrammetry. Remote Sens. 2016, 8, 786. [Google Scholar] [CrossRef] [Green Version]
Figure 1. Location maps of (a) the Tottori Sand Dunes, (b) the area of the UAV survey and piezoelectric blown-sand meters on (d) the seaward side and (e) the landward side of the sand fences, and (c) the anemometer. The (f) slope and (g) aspect of the study area is based on the UAV survey conducted on 11 March 2021.
Remotesensing 15 01098 g001
Figure 2. Sand fences designed to have a height of 1 m above the ground surface and 50% porosity, and formed of bamboo piles 1.2 m long and 2.5 cm wide.
Remotesensing 15 01098 g002
Figure 3. Workflow diagram for this study showing the field survey and data acquisition, UAV photogrammetry processing, and data analysis using geospatial GIS techniques.
Remotesensing 15 01098 g003
Figure 4. Orthophoto of the sand-trapping fences and sand-stabilizing fences in the study area based on images obtained on 13 May 2021. Lines L1, L2, and L3 are the transects used to measure elevation profiles; the arrow direction indicates the direction of distance measurements.
Remotesensing 15 01098 g004
Figure 5. Monthly average wind speeds and wind directions in (a) January, (b) February, (c) March, (d) April, and (e) May, and (f) strong winds with speeds exceeding 10 m s−1 for the study period.
Remotesensing 15 01098 g005
Figure 6. Wind speed in the absence of sand saltation, wind speed with active sand saltation, wind speed without data on sand saltation, instantaneous threshold wind speed, and mean threshold wind speed during (a) 18−31 January, (b) February, (c) March, (d) April, and (e) May 2021.
Remotesensing 15 01098 g006
Figure 7. Saltation number with wind speed on the seaward side and the landward side of the fence for significant sand saltation activities during (a) 18−19 January and (b) 15−17 February 2021.
Remotesensing 15 01098 g007
Figure 8. Vertical profiles of relative blown-sand flux qr(z) from Equation (3) measured inside the sand fence during two significant sand saltation episodes on 18−19 January and 15−17 February 2021.
Remotesensing 15 01098 g008
Figure 9. Reduction efficiency of blown-sand flux by the sand fences at different wind speeds. Mean and median values are shown in green triangles and orange lines, respectively.
Remotesensing 15 01098 g009
Figure 10. Contour lines in the study area for (a) March to April, (b) April to early May, and (c) early to late May. Black solid lines indicate the contour lines for the preceding period; red dots indicate the contour lines for the following period.
Remotesensing 15 01098 g010
Figure 11. Elevation changes in the study area and wind distribution for (a) March to April, (b) April to early May, and (c) early to late May. Positive values indicate deposition of sand; negative values indicate erosion. Black lines are the corresponding L1, L2, and L3 transects given in Figure 3.
Remotesensing 15 01098 g011
Figure 12. Elevation changes on (a) transect line 1 (L1), (b) transect line 2 (L2), and (c) transect line 3 (L3) in March, April, early May, and late May.
Remotesensing 15 01098 g012
Disclaimer/Publisher’s Note: The statements, opinions and data contained in all publications are solely those of the individual author(s) and contributor(s) and not of MDPI and/or the editor(s). MDPI and/or the editor(s) disclaim responsibility for any injury to people or property resulting from any ideas, methods, instructions or products referred to in the content.

