Abstract
As the waters of marine primary production, the euphotic zone is the primary living environment for aquatic organisms. Eddies account for 90% of the ocean’s kinetic energy and they affect marine organisms’ habitats by the excitation of vertical velocities and the horizontal advection of nutrients and ecosystems. Satellite observations indicate that anticyclones mainly deepen the euphotic zone depth, while cyclones do the opposite. The anomalies reach 5 m on average in the region of high eddy amplitude and frequent eddy occurrence. In addition, we found that the anomalies have an extreme value in each of the 5°–23° and 23°–55° and reach a maximum at around 38 degrees with the increase in latitude. In the eddy-center coordinate system, the minus gradient direction of the negative anomaly is consistent with the background flow field and the direction of the eddy movement. Meanwhile, the anomaly increases along the radial direction to about 0.2r and then decreases. Finally, there is a significant linear correlation between the anomaly magnitude and the eddy amplitude. The conclusion of this research and related mechanism explanation contributes to marine biology research and conservation, the estimates of marine primary productivity, and the understanding of the biogeochemical properties of eddy modulation in the upper water column.
1. Introduction
The euphotic zone, the foundation of the marine ecosystem, is the uppermost body of water that receives sunlight, enabling phytoplankton to perform photosynthesis. Ninety percent of marine life lives in the euphotic zone, and ninety-five percent of photosynthesis in the ocean occurs in the euphotic zone [1]. As a quantification of the euphotic zone, the bottom depth of the euphotic zone (hereafter referred to as “ZEU”) is a crucial input parameter for many models to estimate the basin-scale primary production [2,3]. Furthermore, because the ZEU reflects the biogeochemical properties of the upper water column, climate-related changes in the marine environment will respond to the ZEU [4]. The process of diel vertical migration (DVM) to avoid visual predators is affected by the depth of the euphotic zone [5]. The light conditions were favorable for the growth of phytoplanktonic when the ratio of the ZEU to the mixed-layer depth was 0.3413 [6].
The ZEU is one of the parameters describing the optical properties of seawater. In physics, the ZEU is defined as PAR (Photosynthetic Available Radiation) down to the depth of the surface value of 1% [1]. In biology, it is also called compensation depth, which represents the depth at which the net primary productivity (NPP) of the phytoplankton equals zero [2,7]. As shown in recent research, compensation depth in biology is not equal to the ZEU (depth at 1% of the surface PAR value) [8]. Currently, the calculation of the large area of the ZEU mainly comes from remote sensing inversion. One is an empirical algorithm based on chlorophyll (CHL) concentration [9], and the other is a semi-analytical algorithm based on radiative transfer theory that uses the relationship between the ZEU and the diffused attenuation coefficient K to calculate [10,11,12]. The ZEU is mainly determined by the water’s dissolved, suspended organic matter and inorganic matter concentrations. Usually, the ZEU is shallower in offshore water due to terrigenous substances, while the ZEU can reach up to 180 m in the open ocean [9].
Mesoscale eddies are rotating bodies of water that persist for weeks to years and can reach horizontal scales of hundreds of kilometers and penetrate thousands of meters into the ocean interior. These coherent features can modulate primary productivity by changing biophysical–chemical properties such as the nutrition and heat flux of the internal water mass [13,14].
The research results are abundant in the eddy-induced concentration of chlorophyll, the mixed layer, and marine organisms. In terms of the eddy-induced chlorophyll, studies have shown that half of the chlorophyll in the ocean is trapped by the eddy [15]. Anticyclones have higher near-surface CHL than cyclones in subtropical regions [16,17,18], which is contrary to the general characteristics in middle latitudes [19,20,21]. For Deep Chlorophyll Maxima (DCM), cyclonic eddies increase the occurrence of DCMs characterized by the deep biomass maxima of phytoplankton by providing nutrient conditions and optimal light. Conversely, DCMs in anticyclonic eddies are considered to be driven by photosynthesis [22]. For the mixed layer, anticyclones deepen the mixed-layer depth, whereas cyclones thin it, and the magnitude of the eddy-induced mixed-layer depth anomalies is most significant in winter [23]. In addition, other studies have found that the interaction of wind-driven currents with mesoscale eddies could suppress the upwelling in cyclonic eddies and generate upwelling in anticyclonic eddies [24,25]. Therefore, anticyclonic eddies could upwell nutrients below the euphotic zone by generating cyclonic surface stress curl and upward Ekman pumping velocities [16]. Research on eddy ecology has developed rapidly in the last decade, for example, it was found that the pelagic predator catches increased in anticyclonic eddies compared to cyclones and non-eddy [26]. However, the ZEUs characteristics in mesoscale eddies remain unknown. Variations in the ZEU are essential for the magnitude of primary and secondary productivity and assessment of the environment for the reproduction and development of photosensitive organisms. This study uses a more accurate matching method to quantify the characteristics of the eddy-induced the ZEU anomaly and analyze the mechanisms involved.
2. Materials and Methods
2.1. ZEU Datasets
The daily ZEU datasets from January 1998 to December 2020 with a spatial resolution of 1/4° × 1/4° are produced by fusing four satellite water color sensor products [27,28]. Single-sensor and merged products from SeaWiFS, MERIS, MODIS, VIIRS NPP, OLCI-A, VIIRS JPSS-1, and OLCI-B. The data are calculated by using the empirical algorithm based on CHL concentration. The fused data can improve the spatio-temporal coverage of water color data and reduce the impact of single-sensor data noise. The daily ZEU datasets are a product provided by GlobColour and the best polynomial fit as function of X (), expresses as
2.2. Eddy Datasets
The daily 1/4° × 1/4° mesoscale eddy identification and tracking dataset distributed by AVISO was used in this study from January 1998 to December 2020 [29,30,31,32]. Anticyclonic (AE) and cyclonic eddies (CE) were detected from the multi-mission altimetry datasets, with their location, contours, amplitude, radius speed, and associated metadata. The eddy identification method expands from each SLA extreme value to form the eddy. The eddy generated by this method has a low computational cost and is easy to extend to three dimensions.
2.3. ZEU Data Preprocessing
We limit the minimum lifetime of the eddy to 4 weeks to eliminate the effect of transient eddies and eddies resulting from the interpolation procedure of the eddy tracking.
The ZEU data use a 7-day interpolation time to filter out small-scale ZEU changes caused by a short period and increase the amount of data matching the eddy. Table 1 shows the comparison of the coverage of single-sensor and multi-sensor fusion data before and after time interpolation (Table 1). For the time interpolation method, the weight distribution of 7 days was consistent with the Gaussian distribution, and the ZEU data of masked grid were calculated using the data of 3 days before and after. Only data deeper than 2000 m are used to reduce the disadvantages of the empirical algorithm, and the vertical depth of mesoscale eddies can reach kilometers, so the propagation and lifetime of which are less restricted and more stable. The bathymetric data were obtained from ETOPO1 Bedrock published by the National Geophysical Data Center [33].

Table 1.
On 1 January 2005, the total number of grids with valid data was divided by the total number deeper than 2000 m above the geoid.
2.4. Effective Eddy Matching Using the ZEU Data
The distance (D) of the grid center from the eddy center was normalized by the distance of eddy effective contour from the eddy center (R). Each eddy was matched with the valid ZEU data on the same date, and the center of the gird coordinates, ZEU value, azimuth angle (θ), and relative radius (r) were recorded within 2.5r (Figure 1). The eddy effective contour is defined as the largest contour of the detected eddy. Compared with the matching method of fitting contours with a circle, an effective contour is more advantageous for analyzing the eddy 3D structure and submesoscale eddies. Meanwhile, this can preserve the anisotropy of eddy. We divide the eddy from inside to outside into eddy core (0–0.5r), eddy inside (0–1r), eddy disturbance (0–1.5r), and eddy periphery (1.5–2.5r, the filled area in Figure 1).
r = D/R
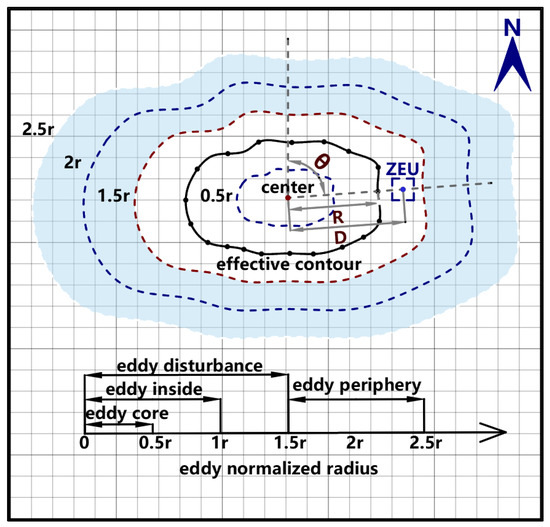
Figure 1.
Schematic diagram of normalized radius calculation. Each grid represents a ZEU grid data, the grid center is approximately the geographic coordinate of the grid data, and the irregular circle is the effective boundary of the eddy with different radius. The distance between the eddy center and ZEU data point is D, and the distance between the eddy center and the eddy effective contour is R, and the azimuth angle between the eddy center and the data point is θ.
2.5. Anomalies of ZEU
Anomalies of the ZEU (ZEU′) at a given location of the grid center (x, y) and time t are defined as
where is the mean of ZEU in every eddy periphery. Each eddy has a unique for each day. The method of calculation not only preserves the seasonal variation about eddy-induced ZEU′ and regional characteristics as much as possible, but it also more accurately calculates the effective eddy-induced ZEU′ by subtracting climatological ZEU with a more significant geographic correlation.
Mesoscale eddies have a velocity of 2–10 km/day, and 7-day time interpolation can ensure the accuracy of ZEU′ calculated for 1/4° × 1/4° data, because the moving distance of the eddy in three days will not affect the matched ZEU data. In addition, when the amount of data for calculated is less than 10, we can skip the eddy to ensure the robustness of the ZEU′.
All processing of the data in this paper is completed through python.
3. Results
3.1. Global Distribution of the ZEU′
The selected regions represent areas of boundary currents and are opposite to the main polarity of the ZEU′ (Figure 2). From the worldwide distribution map of the ZEU′ in eddy inside, AE mainly deepens the ZEU, generating a positive ZEU′ (Figure 2a), while CE mainly shoals the ZEU, resulting in a negative ZEU′ (Figure 2b). The ZEU′ caused by eddies with different polarities shows a similar pattern. However, the ZEU′ of some regions is opposite to the main ZEU′ polarity and is mainly distributed in the southern Indian Ocean and the South Pacific. The eddy-induced ZEU varies by more than 5 m in the boundary currents, and the ZEU′s in most areas are less than 2 m. The ZEU′s in the subtropical gyres are relatively small, with an average range of approximately 1 m.
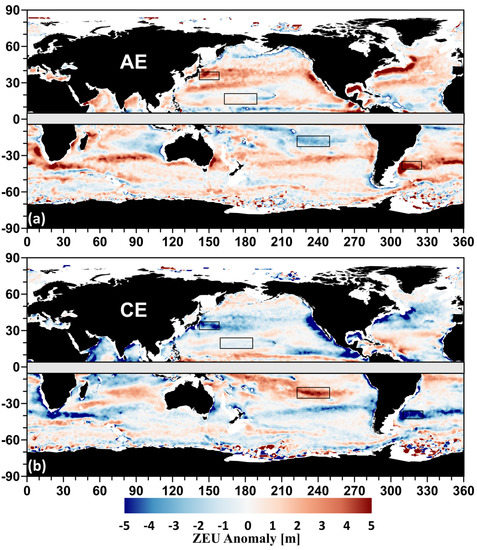
Figure 2.
Eddy−induced ZEU′ in eddy inside mapped to a global 1° grid. The white color means no ZEU anomaly, no eddy, or no ZEU. The regional scopes of the detailed analysis are as follows: Kuroshio Extension (34°N–40°N,144°E–160°E, KE), North Pacific Ocean (15°N–23°N,160°E–172°W, NPO), South Pacific Ocean (15°S–23°S,110°W–138°W, NPO), and Southwest Atlantic Ocean (34°S–40°S,34°W–50°W, SAO).
3.2. Zonal Variation of ZEU′
The minimum latitudes selected are because the Coriolis force is close to zero, the geostrophic effect fails, and there is almost no mesoscale eddy lasting more than four weeks. In addition, due to the influence of illumination, water color sensor data are insufficient at high latitudes, especially in the Southern Hemisphere winter and the Northern Hemisphere summer. According to the changing curve in Figure 3, to further explore the characteristics of ZEU′, it was divided into four latitudes: the middle latitudes in the Northern Hemisphere (23°N–52°N, NM), the lower latitudes in the Northern Hemisphere (5°N–23°N, NL), the lower latitudes in the Southern Hemisphere (5°S–23°S, SL,) and the middle latitudes in the Southern Hemisphere (23°S–52°S, SM).
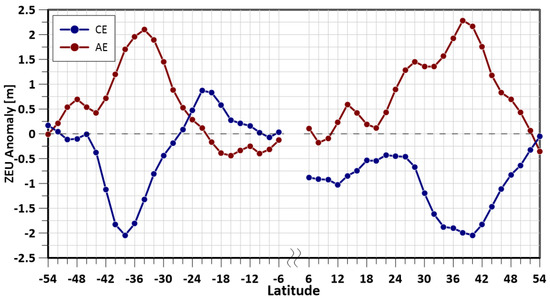
Figure 3.
The variation of ZEU′ in the eddy inside with latitude. The ZEU′ of each 2° latitude band was averaged from 5°~55°.
Globally, the ZEU′ induced by AE and CE is symmetrically distributed in the Northern and Southern Hemispheres with latitude. In the lower latitudes, the ZEU′ is small, and in the middle and high latitudes, the ZEU′ is relatively larger. Moreover, AE (CE) induces the positive (negative) ZEU′, which increases first, then decreases with latitude, and then reaches the maximum at approximately 38°. In the Northern Hemisphere, AE (CE) always induces a positive (negative) ZEU′. At lower latitudes, the mean value of AE (CE)-caused ZEU′ was +0.20 m (−0.76 m), and the maximum value was +0.59 m (−1.03 m). In the middle–high latitudes, the mean value of the ZEU′ caused by AE (CE) was +1.18 m (−1.15 m), and the maximum value was +2.29 m (−2.05 m). In the Southern Hemisphere, AE (CE) caused a negative (positive) ZEU′ at low latitudes with a mean value of −0.26 m (+0.32 m) and a maximum value of −0.44 m (+0.87 m). With the increase in latitude, the ZEU′ caused by the AE (CE) shift becomes positive (negative) at 22 degrees (26 degrees). Finally, the mean the ZEU′ caused by AE (CE) at middle latitudes is +0.94 m (−0.59 m), and the maximum ZEU′ is +2.10 m (−2.04 m). Compared with the Southern and Northern Hemisphere, the mean value of the ZEU′ caused by AE (CE) in the Northern Hemisphere is +0.83 m (−1.01 m), and that in the Southern Hemisphere is +0.51 m (−0.26 m) (Table 2).

Table 2.
ZEU′ statistics table.
3.3. Seasonal Variation of the ZEU’
As shown in Figure 4, in the lower latitudes of the Northern (Southern) Hemisphere, the ZEU′ in AE is negative (positive) in December–March (January–April), positive (negative) in other months, and reaches the maximum (minimum) in October (September), which is 0.62 m (−0.88 m), respectively; the ZEU′ in CE is negative (positive) and reached the minimum (maximum) in October (August), which is −1.41 m (0.69 m), respectively. In the middle latitudes, AE (CE) always causes a positive (negative) ZEU′ regardless of the Northern and Southern Hemispheres. The ZEU′ is more significant in summer and minor in winter. The maximum ZEU′ induced by AE in the Northern (Southern) Hemisphere was +2.1 m (+1.54 m). The maximum ZEU′ induced by CE in the Northern (Southern) Hemisphere was −1.80 m (−0.90 m).
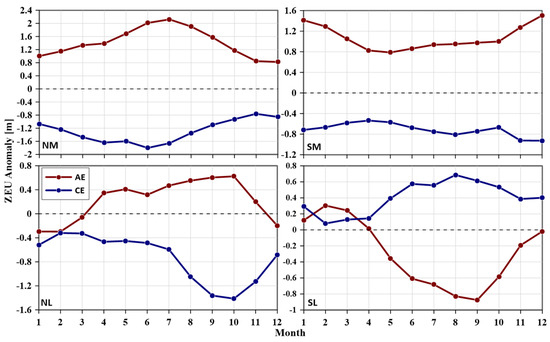
Figure 4.
Seasonal variation of ZEU′ in eddy inside. The matched daily ZEU′ in AE/CE was divided into 4 latitude zones (NM, SM, NL, and SL) and then each month mean values were calculated over the 23 years.
3.4. Variation of ZEU′ with Normalized Radius in a Two-Dimensional Eddy Coordinate System
In Figure 5, the ZEU′ caused by the eddy is not a single positive or negative within 1.5r of the eddy, and the AE (CE) causes the opposite positive (negative) ZEU′ within 1r, except in the South Pacific globally. The ZEU′ in the two regions of the middle latitudes is more prominent than those in the low latitudes. The eddy has a dipole phenomenon in the low-latitude region. The coupling direction is consistent with the rotation direction of different polar eddies in the Northern and Southern Hemispheres. CE rotates clockwise in the Northern Hemisphere, AE rotates counterclockwise, and the Southern Hemisphere is opposite.
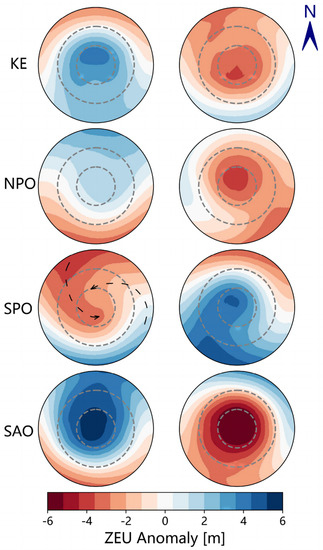
Figure 5.
Two−dimensional distributed graph of ZEU′ with normalized radius in eddy disturbance with the left column in AE and the right column in CE. ZEU′s are linearly interpolated into a 150*360 grid and drawn in polar coordinates. From top to bottom, there are four regions: KE, NPO, SPO, and SAO. The inner-dashed circle is 0.5r, the middle-dashed circle is 1r, and the outermost circle is 1.5r. The direction of the black dashed line is the coupling direction of the two polar anomalies.
3.5. Variation of ZEU′ with Normalized Radius in Eddy Coordinate System
As shown in Figure 6, the ZEU′ intensity decreases along with the relative radius on the whole. In NL, the positive (negative) ZEU′ caused by AE (CE) increases first and then decreases from the center, reaching approximately zero at around 1r (1.5r). In SL, the positive (negative) ZEU′ caused by CE (AE) first decreased, then increased, and then reduced from the center. The ZEU′ induced by AE approaches zero near 1.5r and then becomes positive, which in CE is still a negative ZEU′. In the middle latitudes, the intensity of the ZEU′ caused by eddies increases first, then decreases along the normalized radius from the center, and then approaches zero at approximately 1.6r. All the position of zero point and maximum is in Table 3.
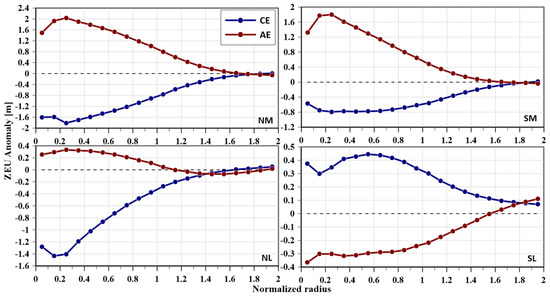
Figure 6.
The graph of ZEU′ with normalized radius at different latitudes. The radius interval is 0.1.

Table 3.
Normalized radius position of the ZEU′ maximum and zero point.
3.6. ZEU′ Quantization in Eddy
In the lower latitudes, eddy pumping is not always the dominant mechanism [34], and the correlation coefficient between the anomaly and the amplitude is relatively low. Therefore, the relationship between the ZEU′ and the amplitude in lower latitudes is not shown. In the middle latitudes, the anomaly in the eddy core is relatively significant and only unipolar. As shown in Figure 7, the ZEU′ caused by the eddy positively correlates with the eddy amplitude. At the same amplitude, AE had a more significant effect on the ZEU′ than CE. In comparison between the Northern and Southern Hemispheres, the Northern Hemisphere eddy with the same amplitude causes a larger ZEU′ than the Southern Hemisphere eddy. The correlation is also better than the other latitudes.
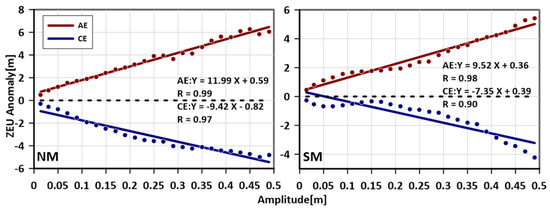
Figure 7.
ZEU′ as a function of eddy amplitude. Mean amplitude and ZEU′ were calculated at 2 cm intervals in the eddy core. Solid lines result from a linear fit (p < 0.01).
4. Discussion
The ZEU of the global open ocean is mainly negatively correlated with CHL [9]. The ZEU′ caused by the eddy is consistent with the eddy-induced CHL. Therefore, the geographical distribution of the two anomalies has a consistent pattern and an opposite polarity. The intensity of the anomaly is closely related to the eddy-prone area and the distribution of eddy kinetic energy, which is caused by the instability of seawater properties in the boundary current. In addition, larger eddy kinetic energy has a stronger trapping ability, which can maintain large anomalies for a longer time. The primary mechanism of eddy modulation on the ZEU is that the upwelling flows caused by CE increase the nutrient supply from the subsurface layer to the surface layer, promote the growth of phytoplankton, and increase the CHL. For AE, the downwelling flows decrease the nutrient supply to the surface layer, inhibit the growth of phytoplankton, and decrease the CHL [3,35,36]. The exceptional cases, in regions such as the southern Indian Ocean and the South Pacific, may be due to the upwelling (downwelling) flows of CE (AE) that make the mixed layer shallower (deeper) and make fewer (more) nutrients available to phytoplankton in the upper mixed layer, thus reducing (increasing) the concentration of phytoplankton [37]. An alternative explanation is that plant photoacclimation is caused by deepened mixing, and that faster light attenuation leads to higher CHL in AE and the opposite in CE. The phytoplankton changes the cellular pigmented concentration by physiological adjustments in the subtropical gyres [18]. In nutrient-limited conditions, eddy-induced Ekman pumping would yield a positive CHL anomaly in AE and a negative CHL anomaly in CE [38,39]. Multiple mechanisms have generated the observed global ZEU′ pattern based on the above.
When the two polar eddies act on the euphotic zone, the latitudinal variation of ZEU′ is related to the variation of the latitudinal amplitude of the eddy. The anomaly is minor in lower latitudes, more significant in middle latitudes, and reaches a maximum of approximately 38 degrees. Regardless of AE and CE, the average effect on the ZEU in the Northern Hemisphere is more significant than in the Southern Hemisphere.
The ZEU′ caused by the eddy has prominent seasonal characteristics. In the lower latitudes, the anomalies are larger in near-summer in the Northern Hemisphere and larger in near-winter in the Southern Hemisphere. In the middle latitudes, the ZEU′ caused by eddies is the largest in summer and the smallest in winter. A change in the ZEU′ polarity will occur in March and April in lower latitudes. The upwelling/downwelling flow pumping caused by CE/AE was the primary mechanism in the Northern Hemisphere. With the stronger stratification from July to November, the nutrient supply from the subsurface layer to the near-surface layer was inhibited, while eddy pumping on chlorophyll was relatively dominant. In the Southern Hemisphere, the eddy kinetic energy is weak and eddy pumping is no longer the dominant mechanism. The stirring mechanism of the eddy can also break stratification and change the ZEU. When the background mixed layer deepens from May to November, the mixed layer anomaly caused by eddies is the largest [40], resulting in the strongest ZEU′.
The ZEU′ is not the strongest in the eddy center and has an extremum at approximately 0.2r, which influences the range by 1.6r in middle latitudes and ranges from 1r–2r in lower latitudes. In the eddy coordinate system, the vertical velocity of water masses caused by the eddy pump, eddy-wind interaction, and other dynamic processes decreases from the center to the outside, so the eddy-induced anomalies are consistent with the variation. However, in SL, the opposite ZEU′ caused by other mechanisms is partially counterbalanced until approximately 0.2r. The influence of eddies on the euphotic zone is not limited to 1r but extends to approximately 1.6r in the middle latitudes. In the lower latitudes, the range of eddy perturbations is extended due to the relatively enhanced stirring and trapping mechanism, and the submesoscale processes in the eddy peripheries [41,42]. Due to environmental differences between lower and middle latitudes, the stratification is stronger in lower latitudes and the eddy kinetic energy is weaker, while the opposite is true in high latitudes. Eddy boundaries of different polarity are coupled together by Coriolis forces. The eddy has a dipole phenomenon at lower latitudes, and the coupling direction is consistent with the rotation direction of different polar eddies in the Northern and Southern Hemispheres. The ZEU′ is more concentrated in the middle latitudes and is not easily disturbed by the Coriolis force. Nevertheless, the negative gradient direction of the negative anomaly is consistent with the background flow field and the direction of eddy movement.
There is a significant linear relationship between the eddy amplitude and the ZEU′. The eddy with the same amplitude has a more excellent correlation and a more considerable magnitude in the NM. Eddy amplitude positively correlates with eddy kinetic energy [43]. The consistency between the ZEU anomaly geographic distribution and eddy kinetic energy intensity distribution indicates that the ZEU anomaly and eddy amplitude are correlated. The Southern Hemisphere is more nutrient-deficient than the Northern Hemisphere. The vertical material transport of eddies with the same amplitude will be more significant in the Northern Hemisphere, resulting in a greater ZEU′.
The ZEU anomalies caused by eddies in this paper are largely in the range of 0~2 m. This may have something to do with errors in the ZEU data. In fact, a large number of ZEU′s are larger than 5 m before being averaged. In terms of the calculation method, we have eliminated most systematic errors by subtracting the mean value of the ZEU in the same time and space to calculate the ZEU′. In addition, about 140 billion ZEU′s data involved in the whole calculation were analyzed, which reduces the random error.
Diel vertical migration (DVM) animals may dive deeper to avoid visual predators during the deepening of ZEU induced by anticyclones [5]. Better visual conditions also seem to be one reason why there are more pelagic predator in anticyclones [26]. With the ENSO indices increases and global warming, there has been a statistically significant increase in the ocean eddy activity [44]. The variation of eddy kinetic energy must affect the modulation of ZEU.
5. Conclusions
Anticyclones mainly deepen the ZEU and cyclones mainly shallower the ZEU. In a subtropical gyre region, the polarity of eddy-induced ZEU′s is opposite to the other region. The anomalies can reach 5 m on average in the boundary current. In addition, there are two extreme values in lower latitudes and middle latitudes. The mean of the latitudinal ZEU′ reaches its extremum of about 2.2 m at around 38 degrees with the increase in latitude. In the eddy-center coordinate system, the background flow field and the direction of the eddy movement is consistent with the minus gradient direction of the negative anomaly. In lower latitude, the coupling direction of dipole is consistent with the rotation direction of different polar eddies in the Northern and Southern Hemispheres. As the normalized radius increases, the anomaly increases to about 0.2r and then decreases. In middle latitudes, there is a significant linear correlation between the ZEU′ magnitude and eddy amplitude.
Eddies may modulate ZEUs by changing the water constitute (e.g., CHL), which could affect the light transmittance. However, this process is related to both the physical forcing and biological forcing. It is important to quantify the effects of different factors, especially in the South Pacific subtropical gyre region. In the future, we will also consider using the semi-analysis method with the IOP-based model to inverse the ZEU data for a comparison of the results. It can be expected that the results of ZEU′s are universal and robust. The results of this study will contribute to primary productivity estimation, numerical simulation of ZEU, and understanding of animals’ activity and the ocean carbon cycle.
Author Contributions
Conceptualization, J.Y. and Y.W.; methodology, Y.W.; validation, Y.W.; formal analysis, Y.W.; writing—original draft preparation, Y.W.; writing—review and editing, Y.W. and G.C.; visualization, Y.W.; supervision, J.Y. and G.C.; project administration, J.Y. and G.C.; funding acquisition, J.Y and G.C. All authors have read and agreed to the published version of the manuscript.
Funding
This research was jointly supported by the International Research Center of Big Data for Sustainable Development Goals (No. CBAS2022GSP01), the National Natural Science Foundation of China (Grant No. 42030406 and No. 42276203), and the Ocean University of China (Grant No. 202251004).
Data Availability Statement
GlobColour data “http://globcolour.info (accessed on 2 June 2022)” used in this study have been developed, validated, and distributed by ACRI-ST, France. The Altimetric Mesoscale Eddy Trajectories Atlas (META3.2 DT) was produced by SSALTO/DUACS and distributed by AVISO+ (https://aviso.altimetry.fr (accessed on 31 January 2023)) with support from CNES in collaboration with IMEDEA (DOI: 10.24400/527896/a01-2022.005.220209 for the META3.2 DT allsat version). The ETOPO1 Global Relief Model is used to calculate the sea depth above the geoid (https://www.ngdc.noaa.gov/mgg/global/global.html (accessed on 31 January 2023)) (DOI: 10.7289/V5C8276M).
Conflicts of Interest
The authors declare no conflict of interest.
References
- Kirk, J.T.O. Light and Photosynthesis in Aquatic Ecosystems; 2019/10/09 ed.; Cambridge University Press: Cambridge, UK, 1994; Volume 74, p. 987. [Google Scholar]
- Behrenfeld, M.J.; Falkowski, P.G. A consumer’s guide to phytoplankton primary productivity models. Limnol. Oceanogr. 1997, 42, 1479–1491. [Google Scholar] [CrossRef]
- Behrenfeld, M.J.; Falkowski, P.G. Photosynthetic rates derived from satellite-based chlorophyll concentration. Limnol. Oceanogr. 1997, 42, 1–20. [Google Scholar] [CrossRef]
- Shang, S.L.; Lee, Z.P.; Wei, G.M. Characterization of MODIS-derived euphotic zone depth: Results for the China Sea. Remote Sens. Environ. 2011, 115, 180–186. [Google Scholar] [CrossRef]
- Behrenfeld, M.J.; Gaube, P.; Della Penna, A.; O’Malley, R.T.; Burt, W.J.; Hu, Y.; Bontempi, P.S.; Steinberg, D.K.; Boss, E.S.; Siegel, D.A.; et al. Global satellite-observed daily vertical migrations of ocean animals. Nature 2019, 576, 257–261. [Google Scholar] [CrossRef] [PubMed]
- Khanna, D.R.; Bhutiani, R.; Chandra, K.S. Effect of the Euphotic Depth and Mixing Depth on Phytoplanktonic Growth Mechanism. Int. J. Environ. Res. 2009, 3, 223–228. [Google Scholar]
- Falkowski, P.G. The role of phytoplankton photosynthesis in global biogeochemical cycles. Photosynth. Res. 1994, 39, 235–258. [Google Scholar] [CrossRef]
- Wu, J.; Lee, Z.; Xie, Y.; Goes, J.; Shang, S.; Marra, J.F.; Lin, G.; Yang, L.; Huang, B. Reconciling Between Optical and Biological Determinants of the Euphotic Zone Depth. J. Geophys. Res. Ocean. 2021, 126, e2020JC016874. [Google Scholar] [CrossRef]
- Morel, A.; Huot, Y.; Gentili, B.; Werdell, P.J.; Hooker, S.B.; Franz, B.A. Examining the consistency of products derived from various ocean color sensors in open ocean (Case 1) waters in the perspective of a multi-sensor approach. Remote Sens. Environ. 2007, 111, 69–88. [Google Scholar] [CrossRef]
- Mueller, J.L.; Lange, R.E. Bio-optical provinces of the Northeast Pacific Ocean: A provisional analysis. Limnol. Oceanogr. 2003, 34, 1572–1586. [Google Scholar] [CrossRef]
- Lee, Z.; Weidemann, A.; Kindle, J.; Arnone, R.; Carder, K.L.; Davis, C. Euphotic zone depth: Its derivation and implication to ocean-color remote sensing. J. Geophys. Res.-Ocean. 2007, 112, C03009. [Google Scholar] [CrossRef]
- Kratzer, S.; Hakansson, B.; Sahlin, C. Assessing Secchi and photic zone depth in the Baltic Sea from satellite data. Ambio 2003, 32, 577–585. [Google Scholar] [CrossRef]
- Zhang, Z.; Tian, J.; Qiu, B.; Zhao, W.; Chang, P.; Wu, D.; Wan, X. Observed 3D Structure, Generation, and Dissipation of Oceanic Mesoscale Eddies in the South China Sea. Sci. Rep. 2016, 6, 24349. [Google Scholar] [CrossRef]
- Danabasoglu, G.; McWilliams, J.C.; Gent, P.R. The role of mesoscale tracer transports in the global ocean circulation. Science 1994, 264, 1123–1126. [Google Scholar] [CrossRef] [PubMed]
- Zhao, D.D.; Xu, Y.S.; Zhang, X.G.; Huang, C. Global chlorophyll distribution induced by mesoscale eddies. Remote Sens. Environ. 2021, 254, 112245. [Google Scholar] [CrossRef]
- Gaube, P.; Chelton, D.B.; Strutton, P.G.; Behrenfeld, M.J. Satellite observations of chlorophyll, phytoplankton biomass, and Ekman pumping in nonlinear mesoscale eddies. J. Geophys. Res. -Ocean. 2013, 118, 6349–6370. [Google Scholar] [CrossRef]
- Dufois, F.; Hardman-Mountford, N.J.; Greenwood, J.; Richardson, A.J.; Feng, M.; Matear, R.J. Anticyclonic eddies are more productive than cyclonic eddies in subtropical gyres because of winter mixing. Sci. Adv. 2016, 2, e1600282. [Google Scholar] [CrossRef]
- He, Q.Y.; Zhan, H.G.; Cai, S.Q.; Zhan, W.K. Eddy-Induced Near-Surface Chlorophyll Anomalies in the Subtropical Gyres: Biomass or Physiology? Geophys. Res. Lett. 2021, 48, e2020GL091975. [Google Scholar] [CrossRef]
- Benitez-Nelson, C.R.; Bidigare, R.R.; Dickey, T.D.; Landry, M.R.; Leonard, C.L.; Brown, S.L.; Nencioli, F.; Rii, Y.M.; Maiti, K.; Becker, J.W.; et al. Mesoscale eddies drive increased silica export in the subtropical Pacific Ocean. Science 2007, 316, 1017–1021. [Google Scholar] [CrossRef]
- Dawson, H.R.S.; Strutton, P.G.; Gaube, P. The Unusual Surface Chlorophyll Signatures of Southern Ocean Eddies. J. Geophys. Res.-Ocean. 2018, 123, 6053–6069. [Google Scholar] [CrossRef]
- Frenger, I.; Munnich, M.; Gruber, N. Imprint of Southern Ocean mesoscale eddies on chlorophyll. Biogeosciences 2018, 15, 4781–4798. [Google Scholar] [CrossRef]
- Cornec, M.; Laxenaire, R.; Speich, S.; Claustre, H. Impact of Mesoscale Eddies on Deep Chlorophyll Maxima. Geophys. Res. Lett. 2021, 48, e2021GL093470. [Google Scholar] [CrossRef]
- Gaube, P.; Braun, C.D.; Lawson, G.L.; McGillicuddy, D.J., Jr.; Penna, A.D.; Skomal, G.B.; Fischer, C.; Thorrold, S.R. Mesoscale eddies influence the movements of mature female white sharks in the Gulf Stream and Sargasso Sea. Sci. Rep. 2018, 8, 7363. [Google Scholar] [CrossRef]
- McGillicuddy, D.J., Jr.; Anderson, L.A.; Bates, N.R.; Bibby, T.; Buesseler, K.O.; Carlson, C.A.; Davis, C.S.; Ewart, C.; Falkowski, P.G.; Goldthwait, S.A.; et al. Eddy/wind interactions stimulate extraordinary mid-ocean plankton blooms. Science 2007, 316, 1021–1026. [Google Scholar] [CrossRef]
- Chow, C.H.; Shih, Y.Y.; Chien, Y.T.; Chen, J.Y.; Fan, N.; Wu, W.C.; Hung, C.C. The Wind Effect on Biogeochemistry in Eddy Cores in the Northern South China Sea. Front. Mar. Sci. 2021, 8, 717576. [Google Scholar] [CrossRef]
- Arostegui, M.C.; Gaube, P.; Woodworth-Jefcoats, P.A.; Kobayashi, D.R.; Braun, C.D. Anticyclonic eddies aggregate pelagic predators in a subtropical gyre. Nature 2022, 609, 535–540. [Google Scholar] [CrossRef] [PubMed]
- Fanton, O.; Mangin, A.; Lavender, S.; Antoine, D.; Maritorena, S.; Morel, A.; Barrot, G.; Demaria, J.; Pinnock, S. GlobColour-the European Service for Ocean Colour. In Proceedings of the 2009 IEEE International Geoscience & Remote Sensing Symposium (IGARSS), Cape Town, South Africa, 12–17 July 2009. [Google Scholar]
- Maritorena, S.; d’Andon, O.H.F.; Mangin, A.; Siegel, D.A. Merged satellite ocean color data products using a bio-optical model: Characteristics, benefits and issues. Remote Sens. Environ. 2010, 114, 1791–1804. [Google Scholar] [CrossRef]
- Schlax, M.G.; Chelton, D.B. The “Growing Method” of Eddy Identification and Tracking in Two and Three Dimensions; College of Earth, Ocean and Atmospheric Sciences, Oregon State University: Corvallis, OR, USA, 2016; Volume 8. [Google Scholar]
- Pujol, M.I.; Faugere, Y.; Taburet, G.; Dupuy, S.; Pelloquin, C.; Ablain, M.; Picot, N. DUACS DT2014: The new multi-mission altimeter data set reprocessed over 20 years. Ocean Sci. 2016, 12, 1067–1090. [Google Scholar] [CrossRef]
- Mason, E.; Pascual, A.; McWilliams, J.C. A New Sea Surface Height-Based Code for Oceanic Mesoscale Eddy Tracking. J. Atmos. Ocean. Tech. 2014, 31, 1181–1188. [Google Scholar] [CrossRef]
- Pegliasco, C.; Delepoulle, A.; Mason, E.; Morrow, R.; Faugere, Y.; Dibarboure, G. META3.1exp: A new global mesoscale eddy trajectory atlas derived from altimetry. Earth Syst. Sci. Data 2022, 14, 1087–1107. [Google Scholar] [CrossRef]
- Amante, C.; Eakins, B.W. ETOPO1 1 Arc-Minute Global Relief Model: Procedures, Data Sources and Analysis. In NOAA Technical Memorandum NESDIS NGDC-24; National Geophysical Data Center, NOAA: Boulder, CO, USA, 2009. [Google Scholar]
- McGillicuddy, D.J., Jr. Mechanisms of Physical-Biological-Biogeochemical Interaction at the Oceanic Mesoscale. Ann. Rev. Mar. Sci. 2016, 8, 125–159. [Google Scholar] [CrossRef]
- McGillicuddy, D.J.; Robinson, A.R. Eddy-induced nutrient supply and new production in the Sargasso Sea. Deep-Sea Res. Part I 1997, 44, 1427–1450. [Google Scholar] [CrossRef]
- Chelton, D.B.; Gaube, P.; Schlax, M.G.; Early, J.J.; Samelson, R.M. The influence of nonlinear mesoscale eddies on near-surface oceanic chlorophyll. Science 2011, 334, 328–332. [Google Scholar] [CrossRef] [PubMed]
- Dufois, F.; Hardman-Mountford, N.J.; Greenwood, J.; Richardson, A.J.; Feng, M.; Herbette, S.; Matear, R. Impact of eddies on surface chlorophyll in the South Indian Ocean. J. Geophys. Res.-Ocean. 2014, 119, 8061–8077. [Google Scholar] [CrossRef]
- Dewar, W.K.; Flierl, G.R. Some Effects of the Wind on Rings. J. Phys. Oceanogr. 1987, 17, 1653–1667. [Google Scholar] [CrossRef]
- Travis, S.; Qiu, B. Seasonal Reversal of the Near-Surface Chlorophyll Response to the Presence of Mesoscale Eddies in the South Pacific Subtropical Countercurrent. J. Geophys. Res.-Ocean. 2020, 125, e2019JC015752. [Google Scholar] [CrossRef]
- Gaube, P.; McGillicuddy, D.J.; Moulin, A.J. Mesoscale Eddies Modulate Mixed Layer Depth Globally. Geophys. Res. Lett. 2019, 46, 1505–1512. [Google Scholar] [CrossRef]
- Gaube, P.; McGillicuddy, D.J.; Chelton, D.B.; Behrenfeld, M.J.; Strutton, P.G. Regional variations in the influence of mesoscale eddies on near-surface chlorophyll. J. Geophys. Res.-Ocean. 2014, 119, 8195–8220. [Google Scholar] [CrossRef]
- Guo, M.X.; Xiu, P.; Chai, F.; Xue, H.J. Mesoscale and Submesoscale Contributions to High Sea Surface Chlorophyll in Subtropical Gyres. Geophys. Res. Lett. 2019, 46, 13217–13226. [Google Scholar] [CrossRef]
- Chelton, D.B.; Schlax, M.G.; Samelson, R.M.; de Szoeke, R.A. Global observations of large oceanic eddies. Geophys. Res. Lett. 2007, 34, L15606. [Google Scholar] [CrossRef]
- Martínez-Moreno, J.; Hogg, A.M.; England, M.H.; Constantinou, N.C.; Kiss, A.E.; Morrison, A.K. Global changes in oceanic mesoscale currents over the satellite altimetry record. Nat. Clim. Chang. 2021, 11, 397–403. [Google Scholar] [CrossRef]
Disclaimer/Publisher’s Note: The statements, opinions and data contained in all publications are solely those of the individual author(s) and contributor(s) and not of MDPI and/or the editor(s). MDPI and/or the editor(s) disclaim responsibility for any injury to people or property resulting from any ideas, methods, instructions or products referred to in the content. |
© 2023 by the authors. Licensee MDPI, Basel, Switzerland. This article is an open access article distributed under the terms and conditions of the Creative Commons Attribution (CC BY) license (https://creativecommons.org/licenses/by/4.0/).