
Drought Vulnerability Curves Based on Remote Sensing and Historical Disaster Dataset


Abstract
:1. Introduction
2. Materials and Methods
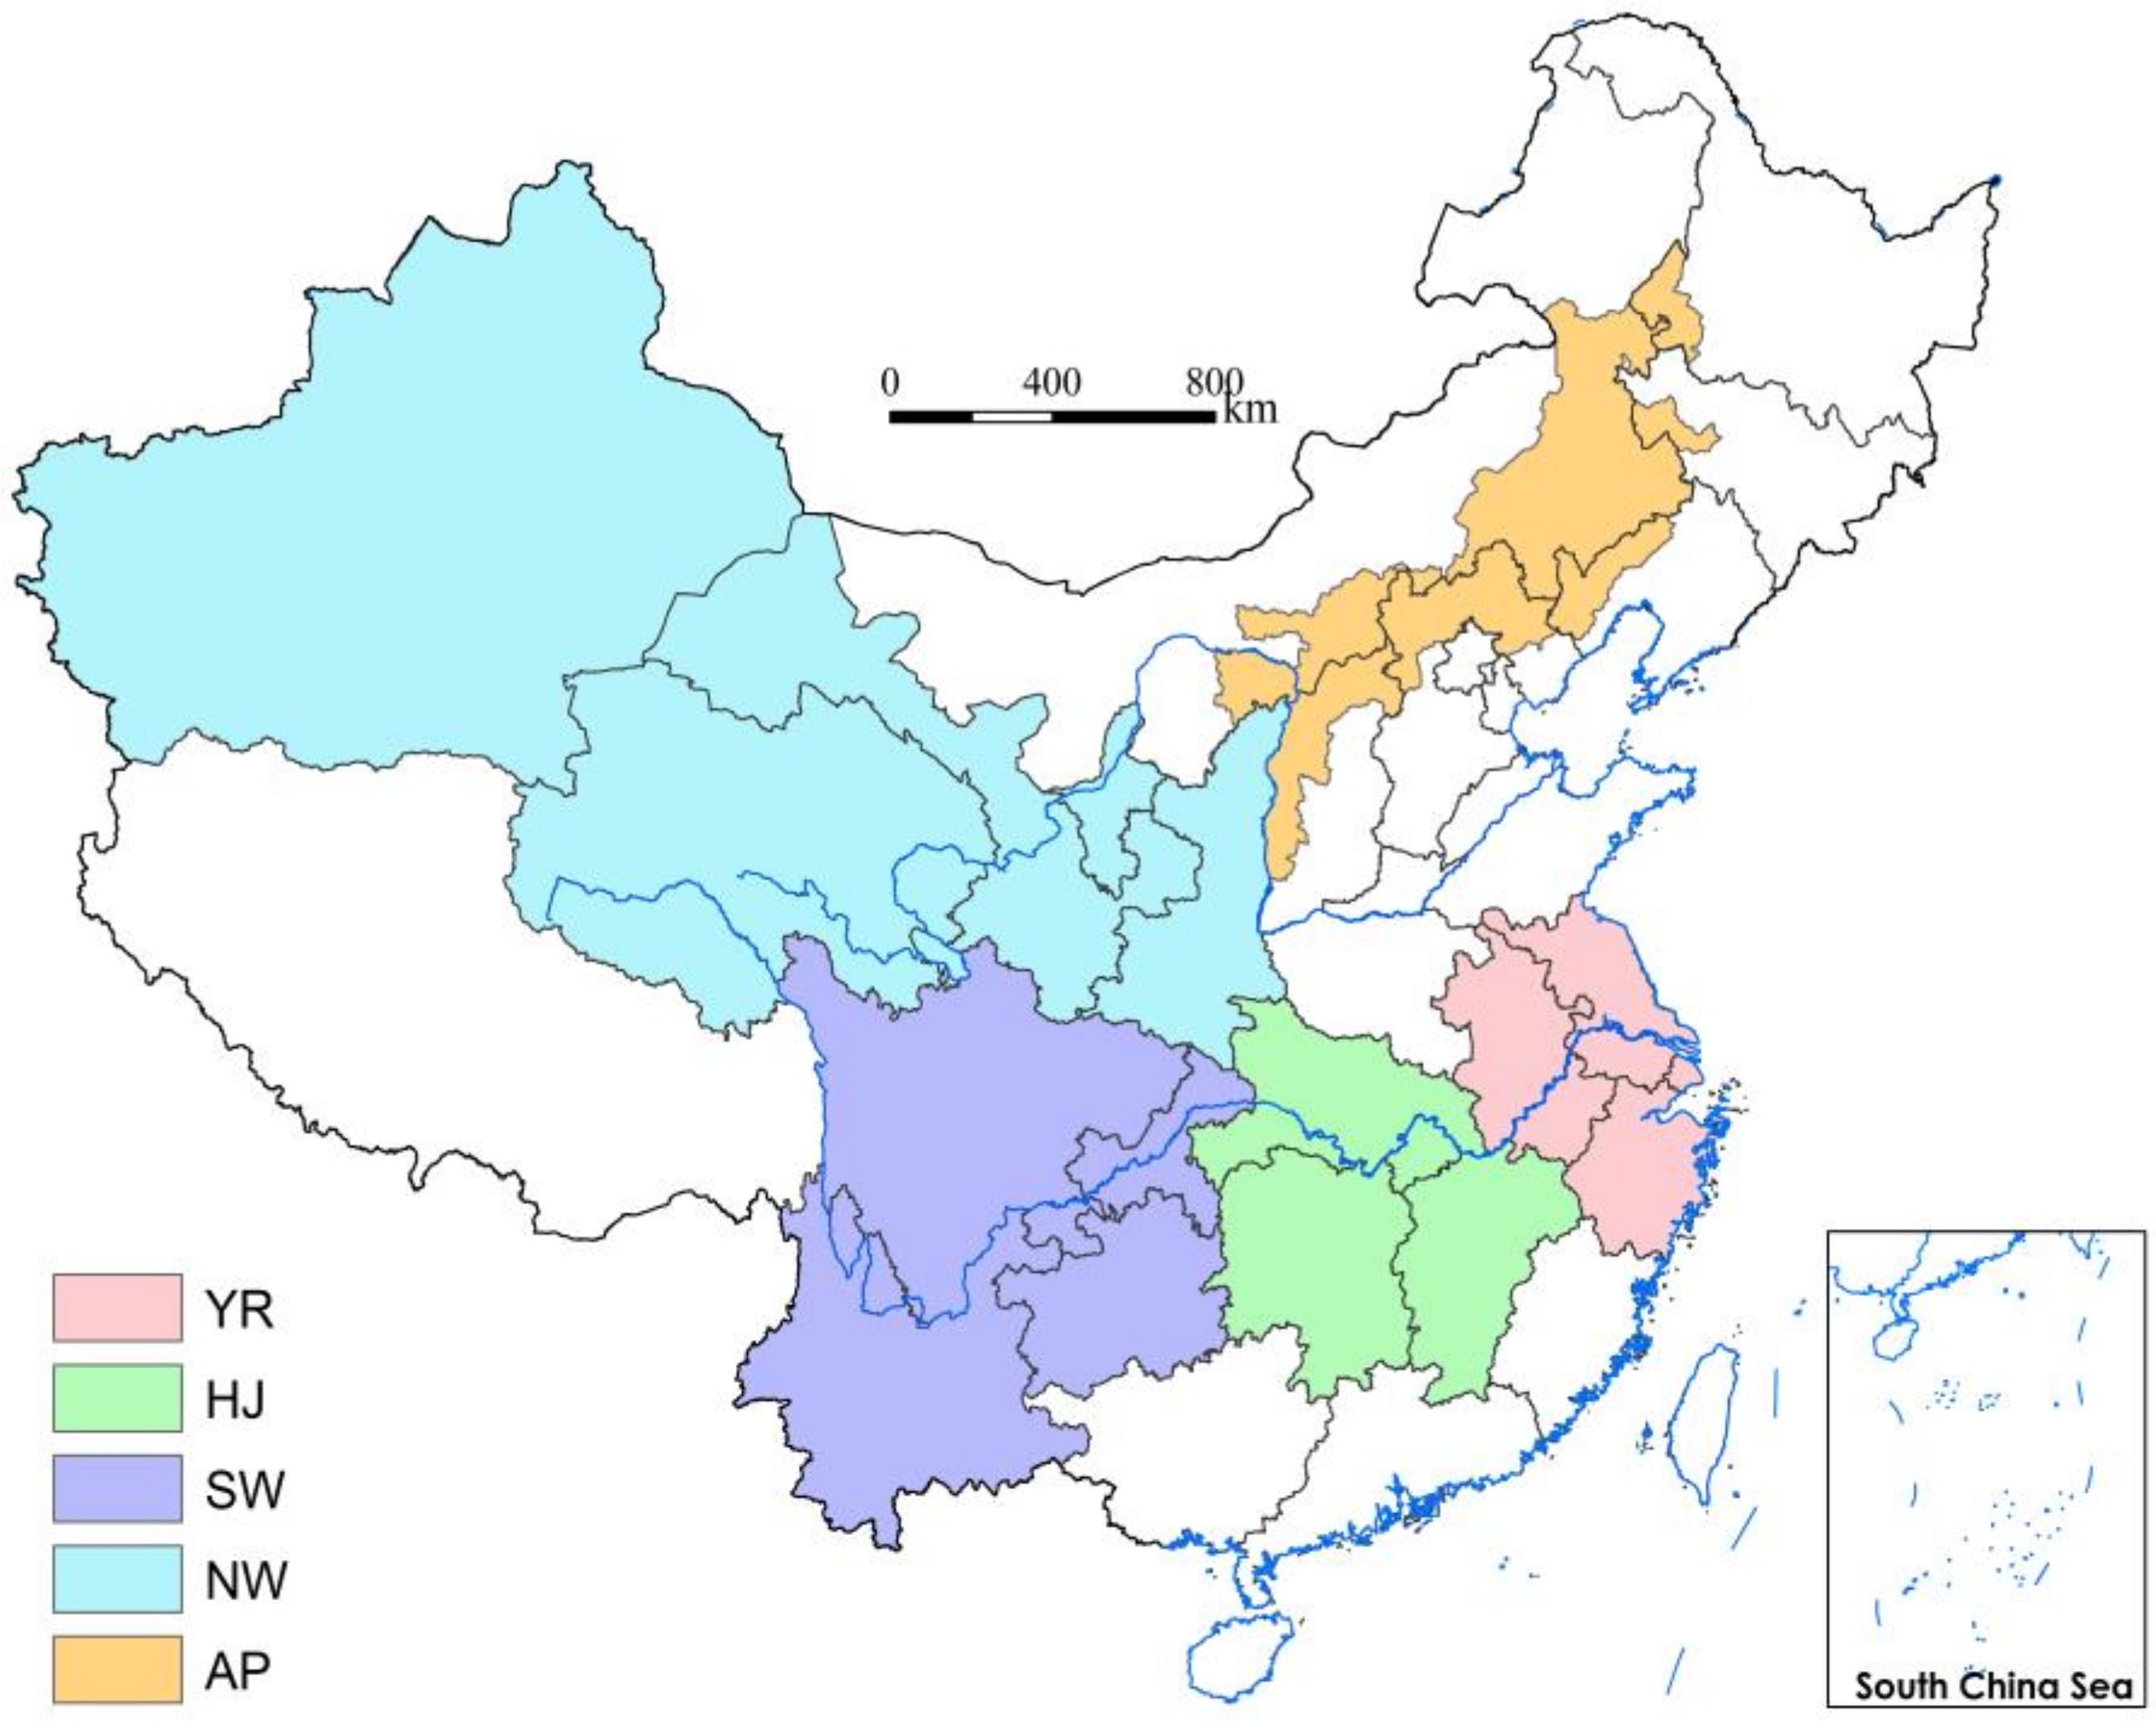
2.1. Study Area
- The northwest inland perennial arid area (NW): the climatic characteristics are mainly characterized by scarce precipitation, sparse vegetation, large surface evaporation, severe agricultural water deficit, and frequent drought disasters [32].
- The arid and ecologically fragile area in farming pastoral ecotone (AP): With the rapid decline of annual rainfall in western China, the climate type has changed from semi-humid and semi-arid to an arid climate zone, and the natural landscape has changed from forest grassland and dry grassland to semi-desert grassland, thus forming the farming pastoral transition zone [33]. The basic factor promoting the transition of agriculture and animal husbandry is drought and water shortage.
- High-temperature and summer drought area in the middle and lower reaches of the Yangtze River (YR): With developed agriculture and a dense population, this region is one of the most economically developed regions in China, and also a representative region of socially dependent water shortage [34]. It is dominated by continuous drought in summer and autumn, especially in midsummer. High temperature and little rain have a serious impact on grain production and even crop failure.
- The southwest mountainous area with successive years of drought (SW): Due to the intensification of El Niño and the thermal impact of the Qinghai Tibet Plateau, extreme precipitation events in southwest China are increasing, which aggravates the drought risk there [35]. In recent years, drought in Southwest China has become more serious. For example, five provinces (districts and cities) in Southwest China suffered from a historically rare drought from September 2009 to May 2010. It led to the destruction of regional agriculture, society and ecology [36].
- The Hunan Hubei Jiangxi area with sudden change from drought to waterlogging (HJ): Affected by monsoon precipitation and the change of the subtropical high pressure in the western Pacific Ocean, this region is a typical area with frequent drought and flood disasters [37]. During the occurrence and development of drought and flood, not only will each have an impact on people’s production, life, and natural ecosystems, but also the rapid change of drought and flood will cause the superimposed loss of both factors, which is more serious than a single drought or flood disaster.
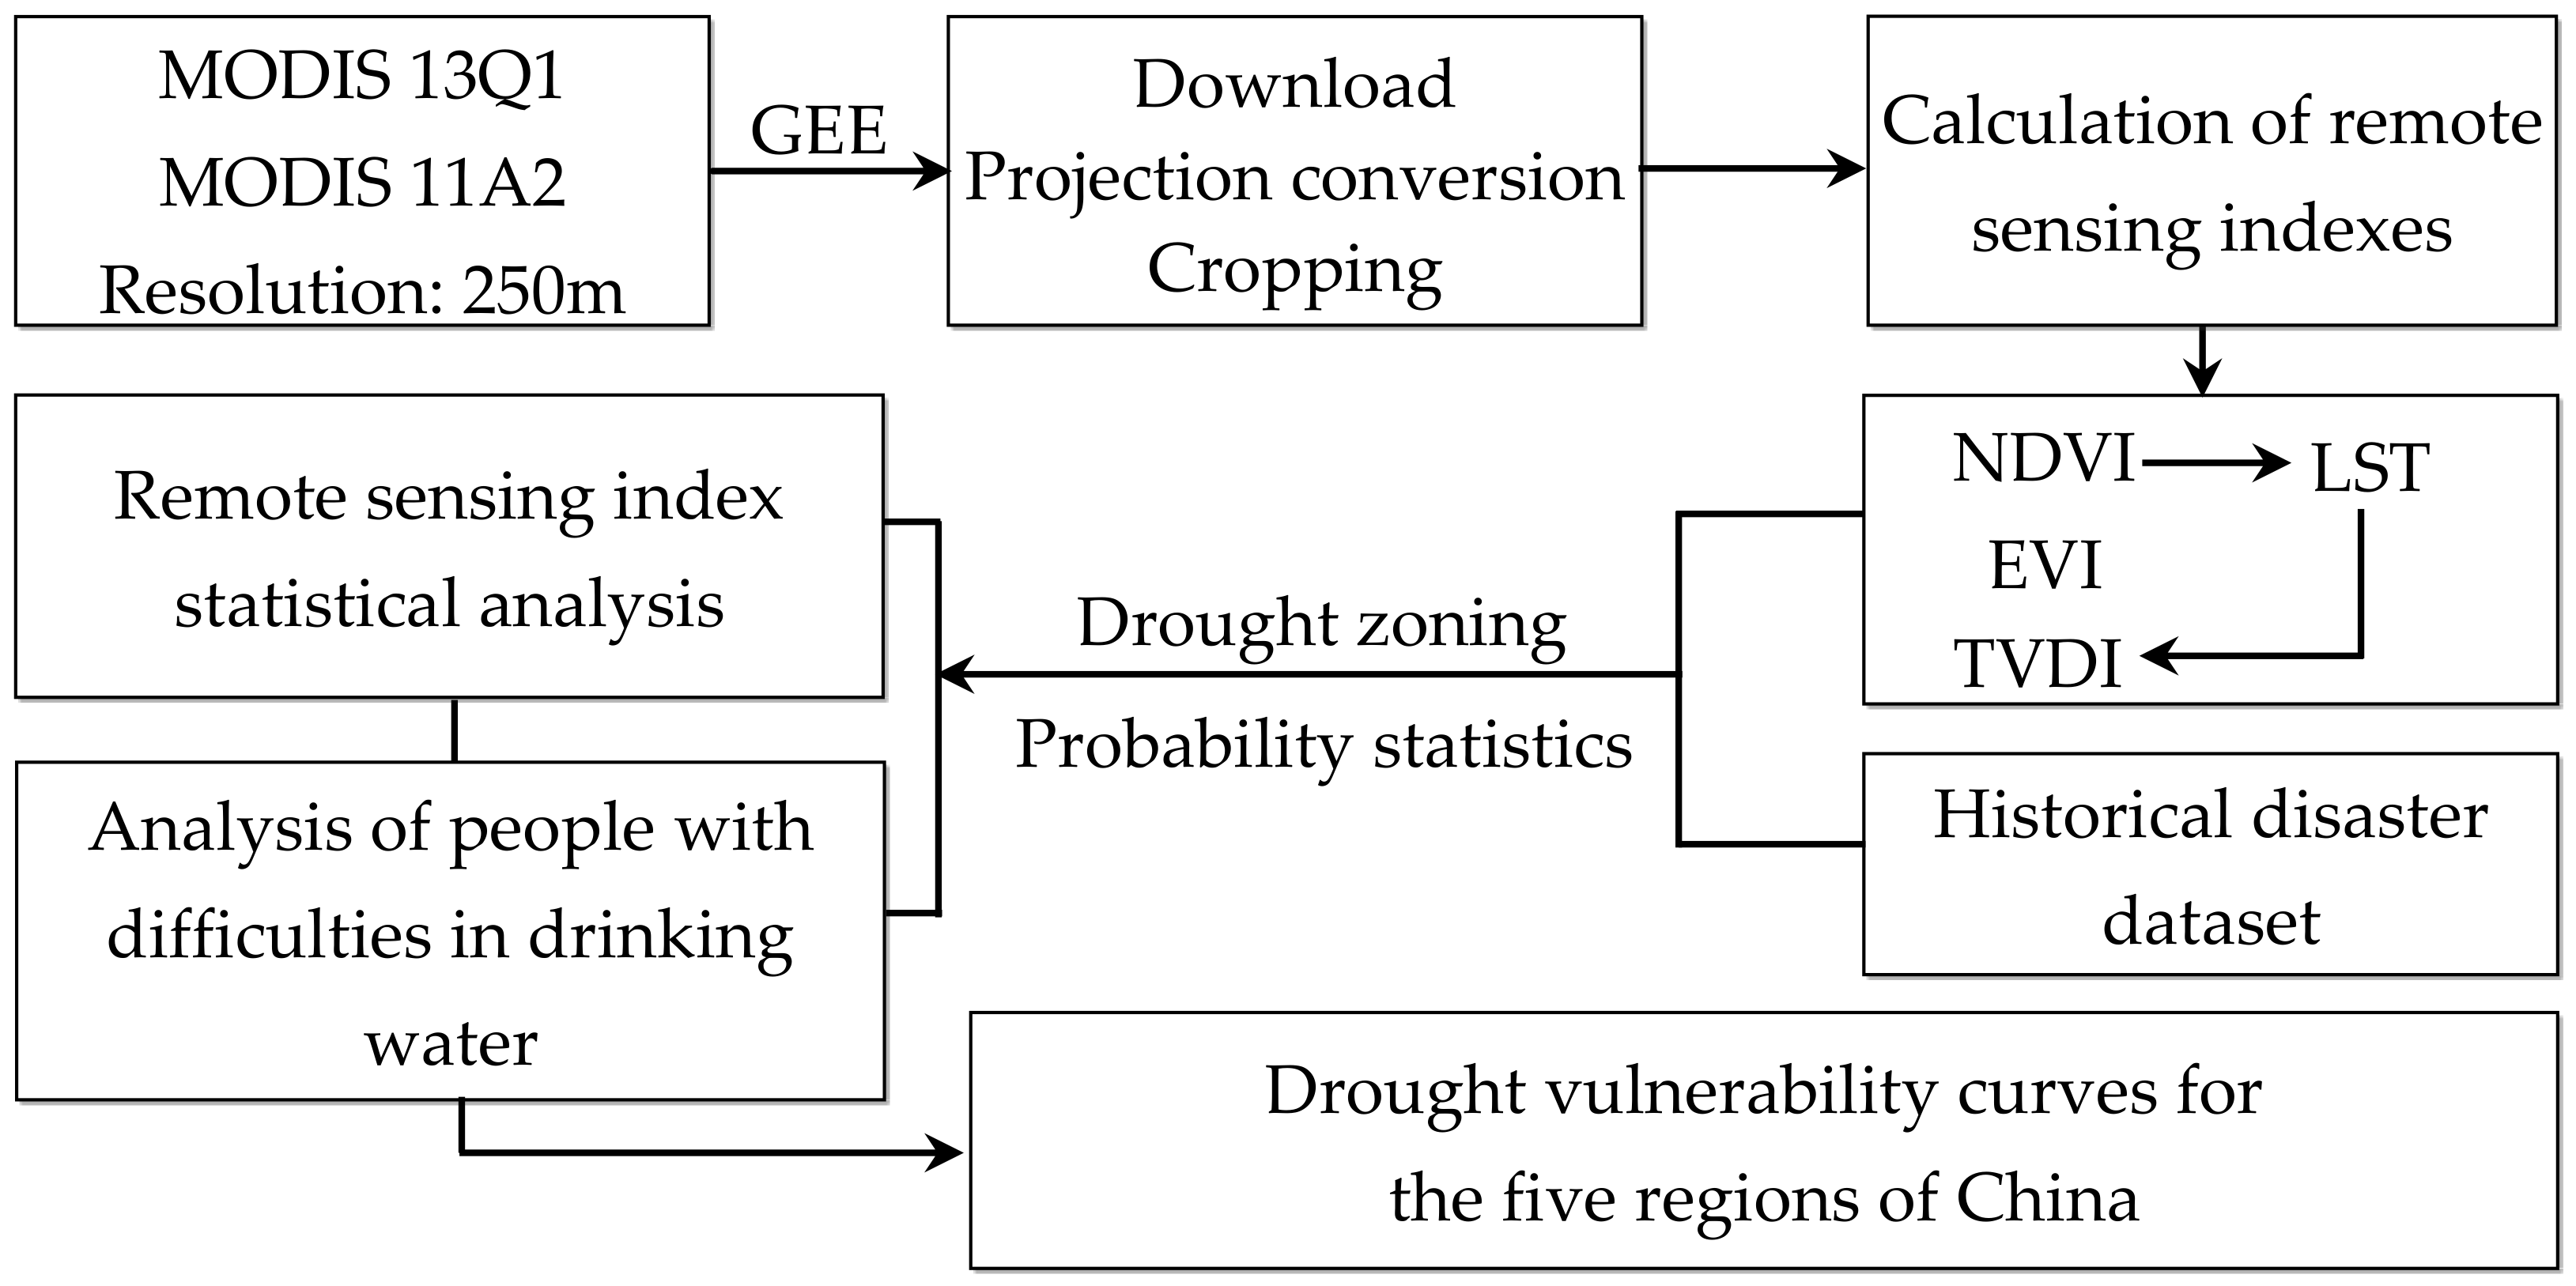
2.2. Materials
2.3. Methods
3. Results
3.1. Monitoring Drought by Remote Sensing Index
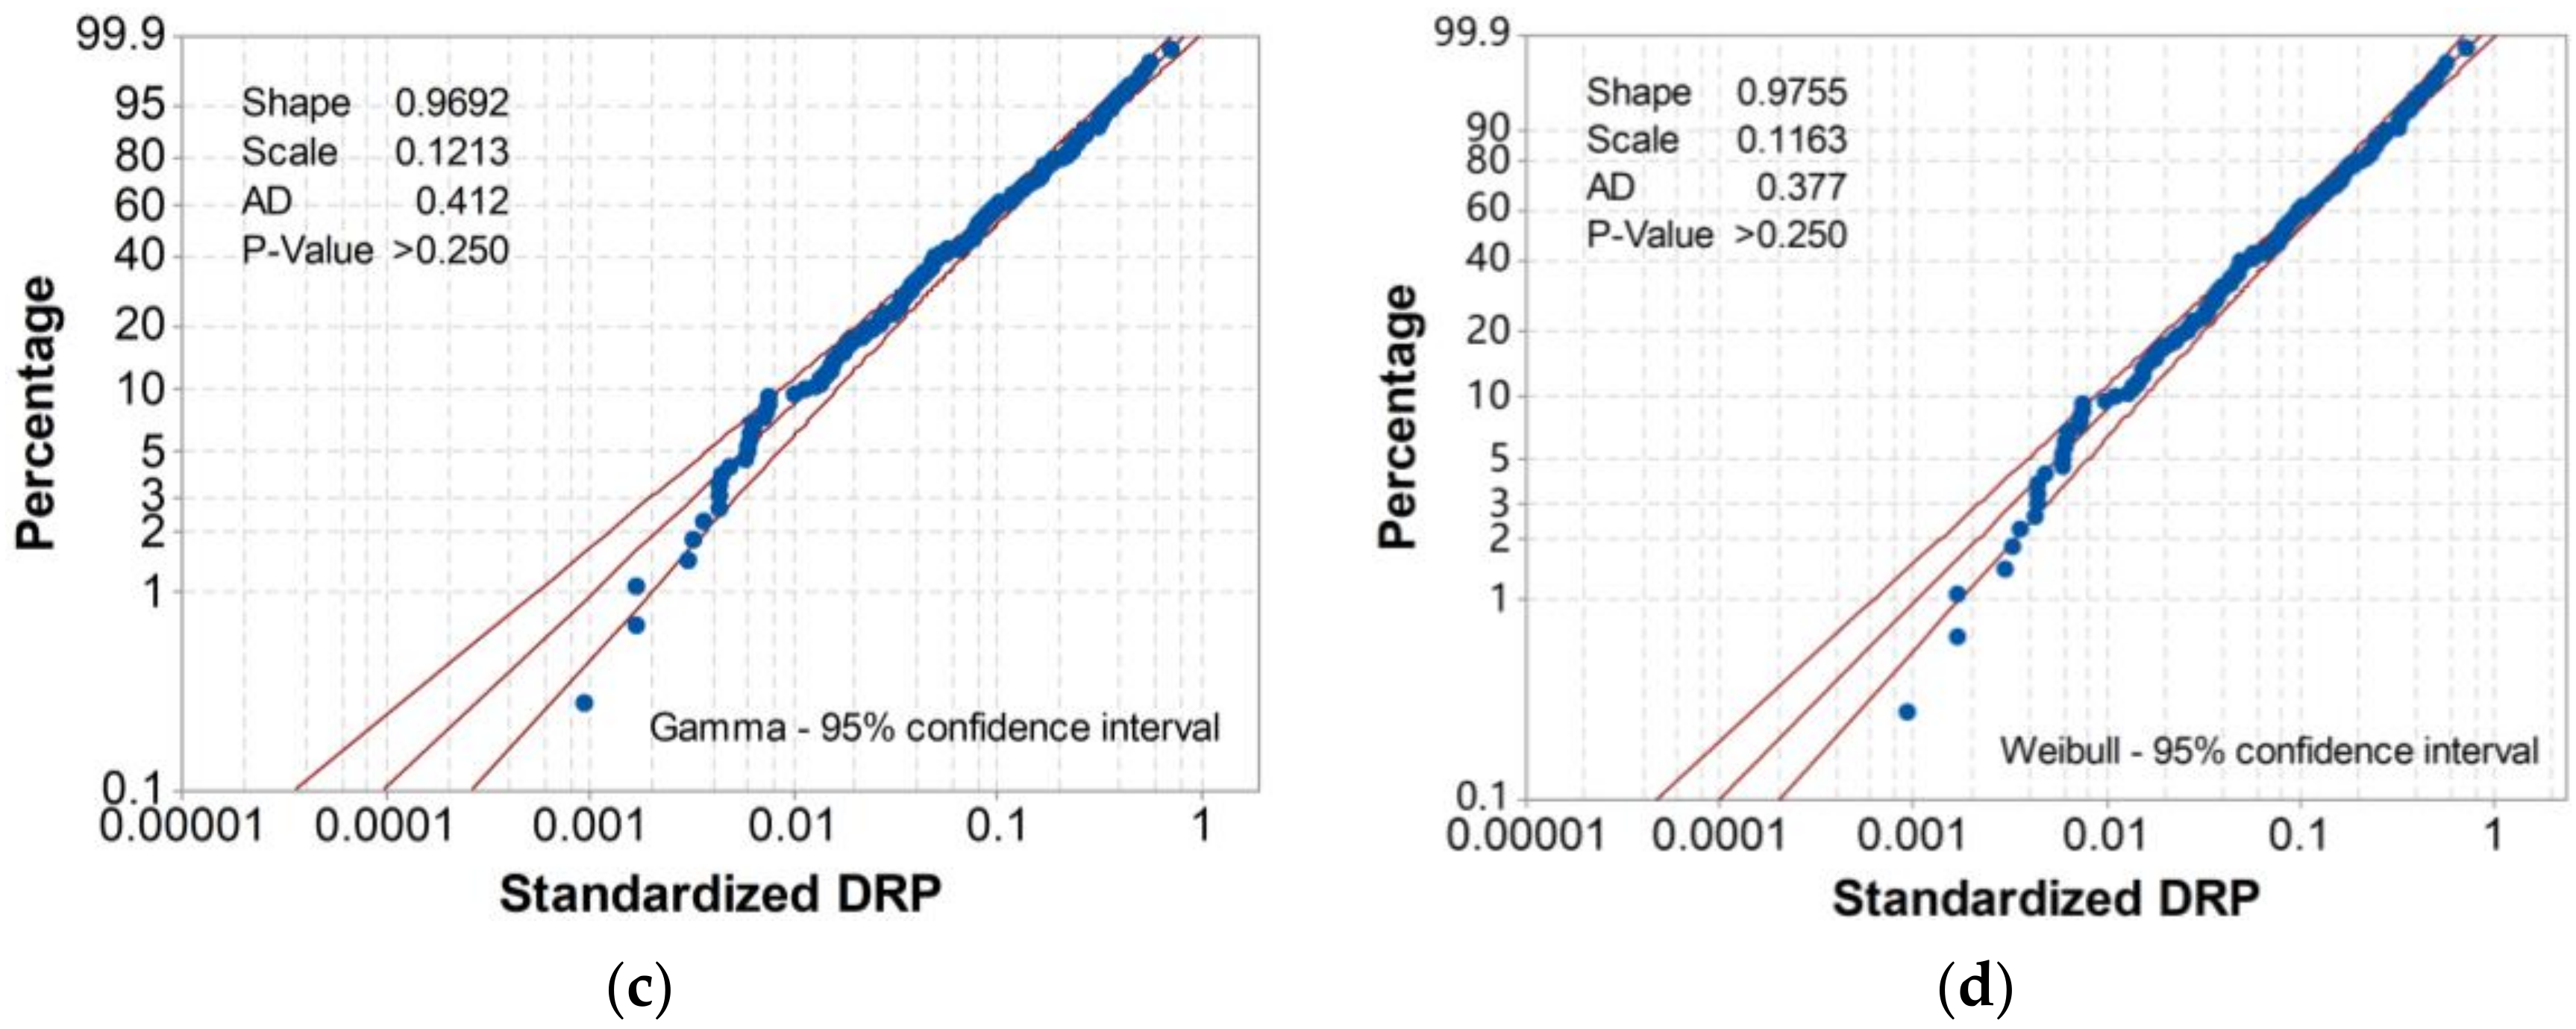
3.2. DRP Analysis
3.3. Vulnerability Analysis
4. Discussion
4.1. Regional Applicability of Remote-Sensed Drought Index
4.2. Vulnerability Curves Analysis
5. Conclusions
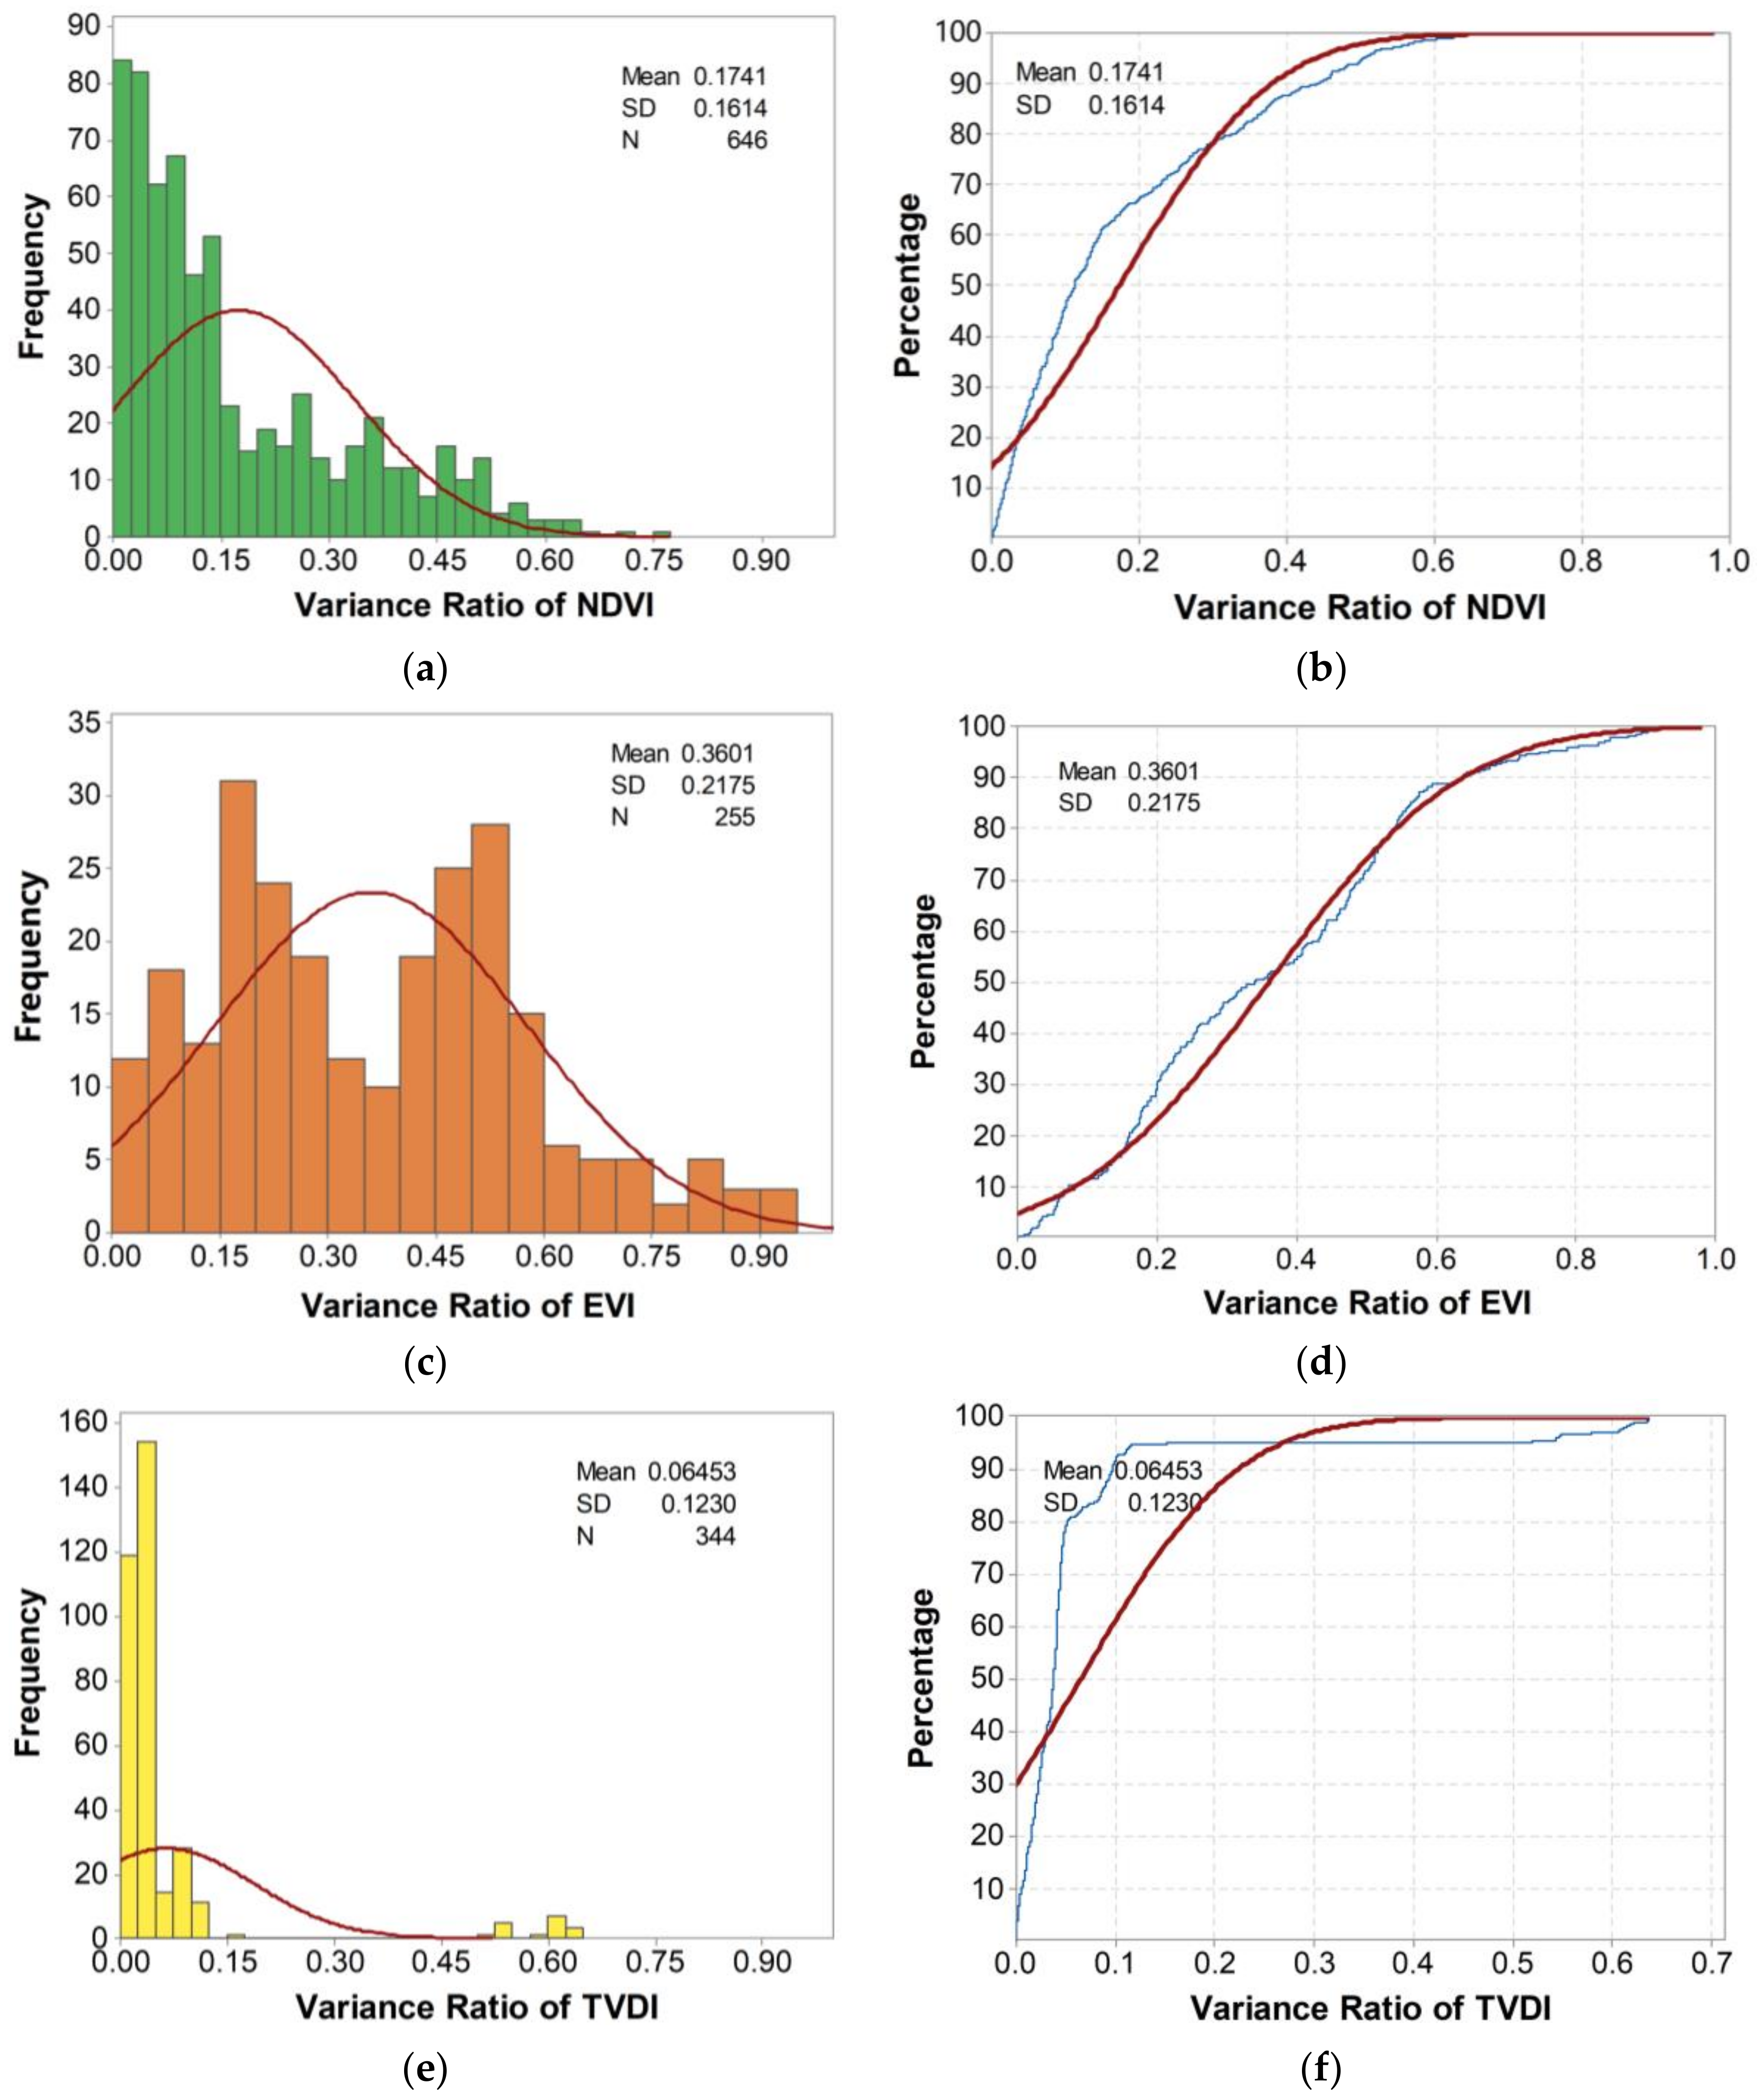
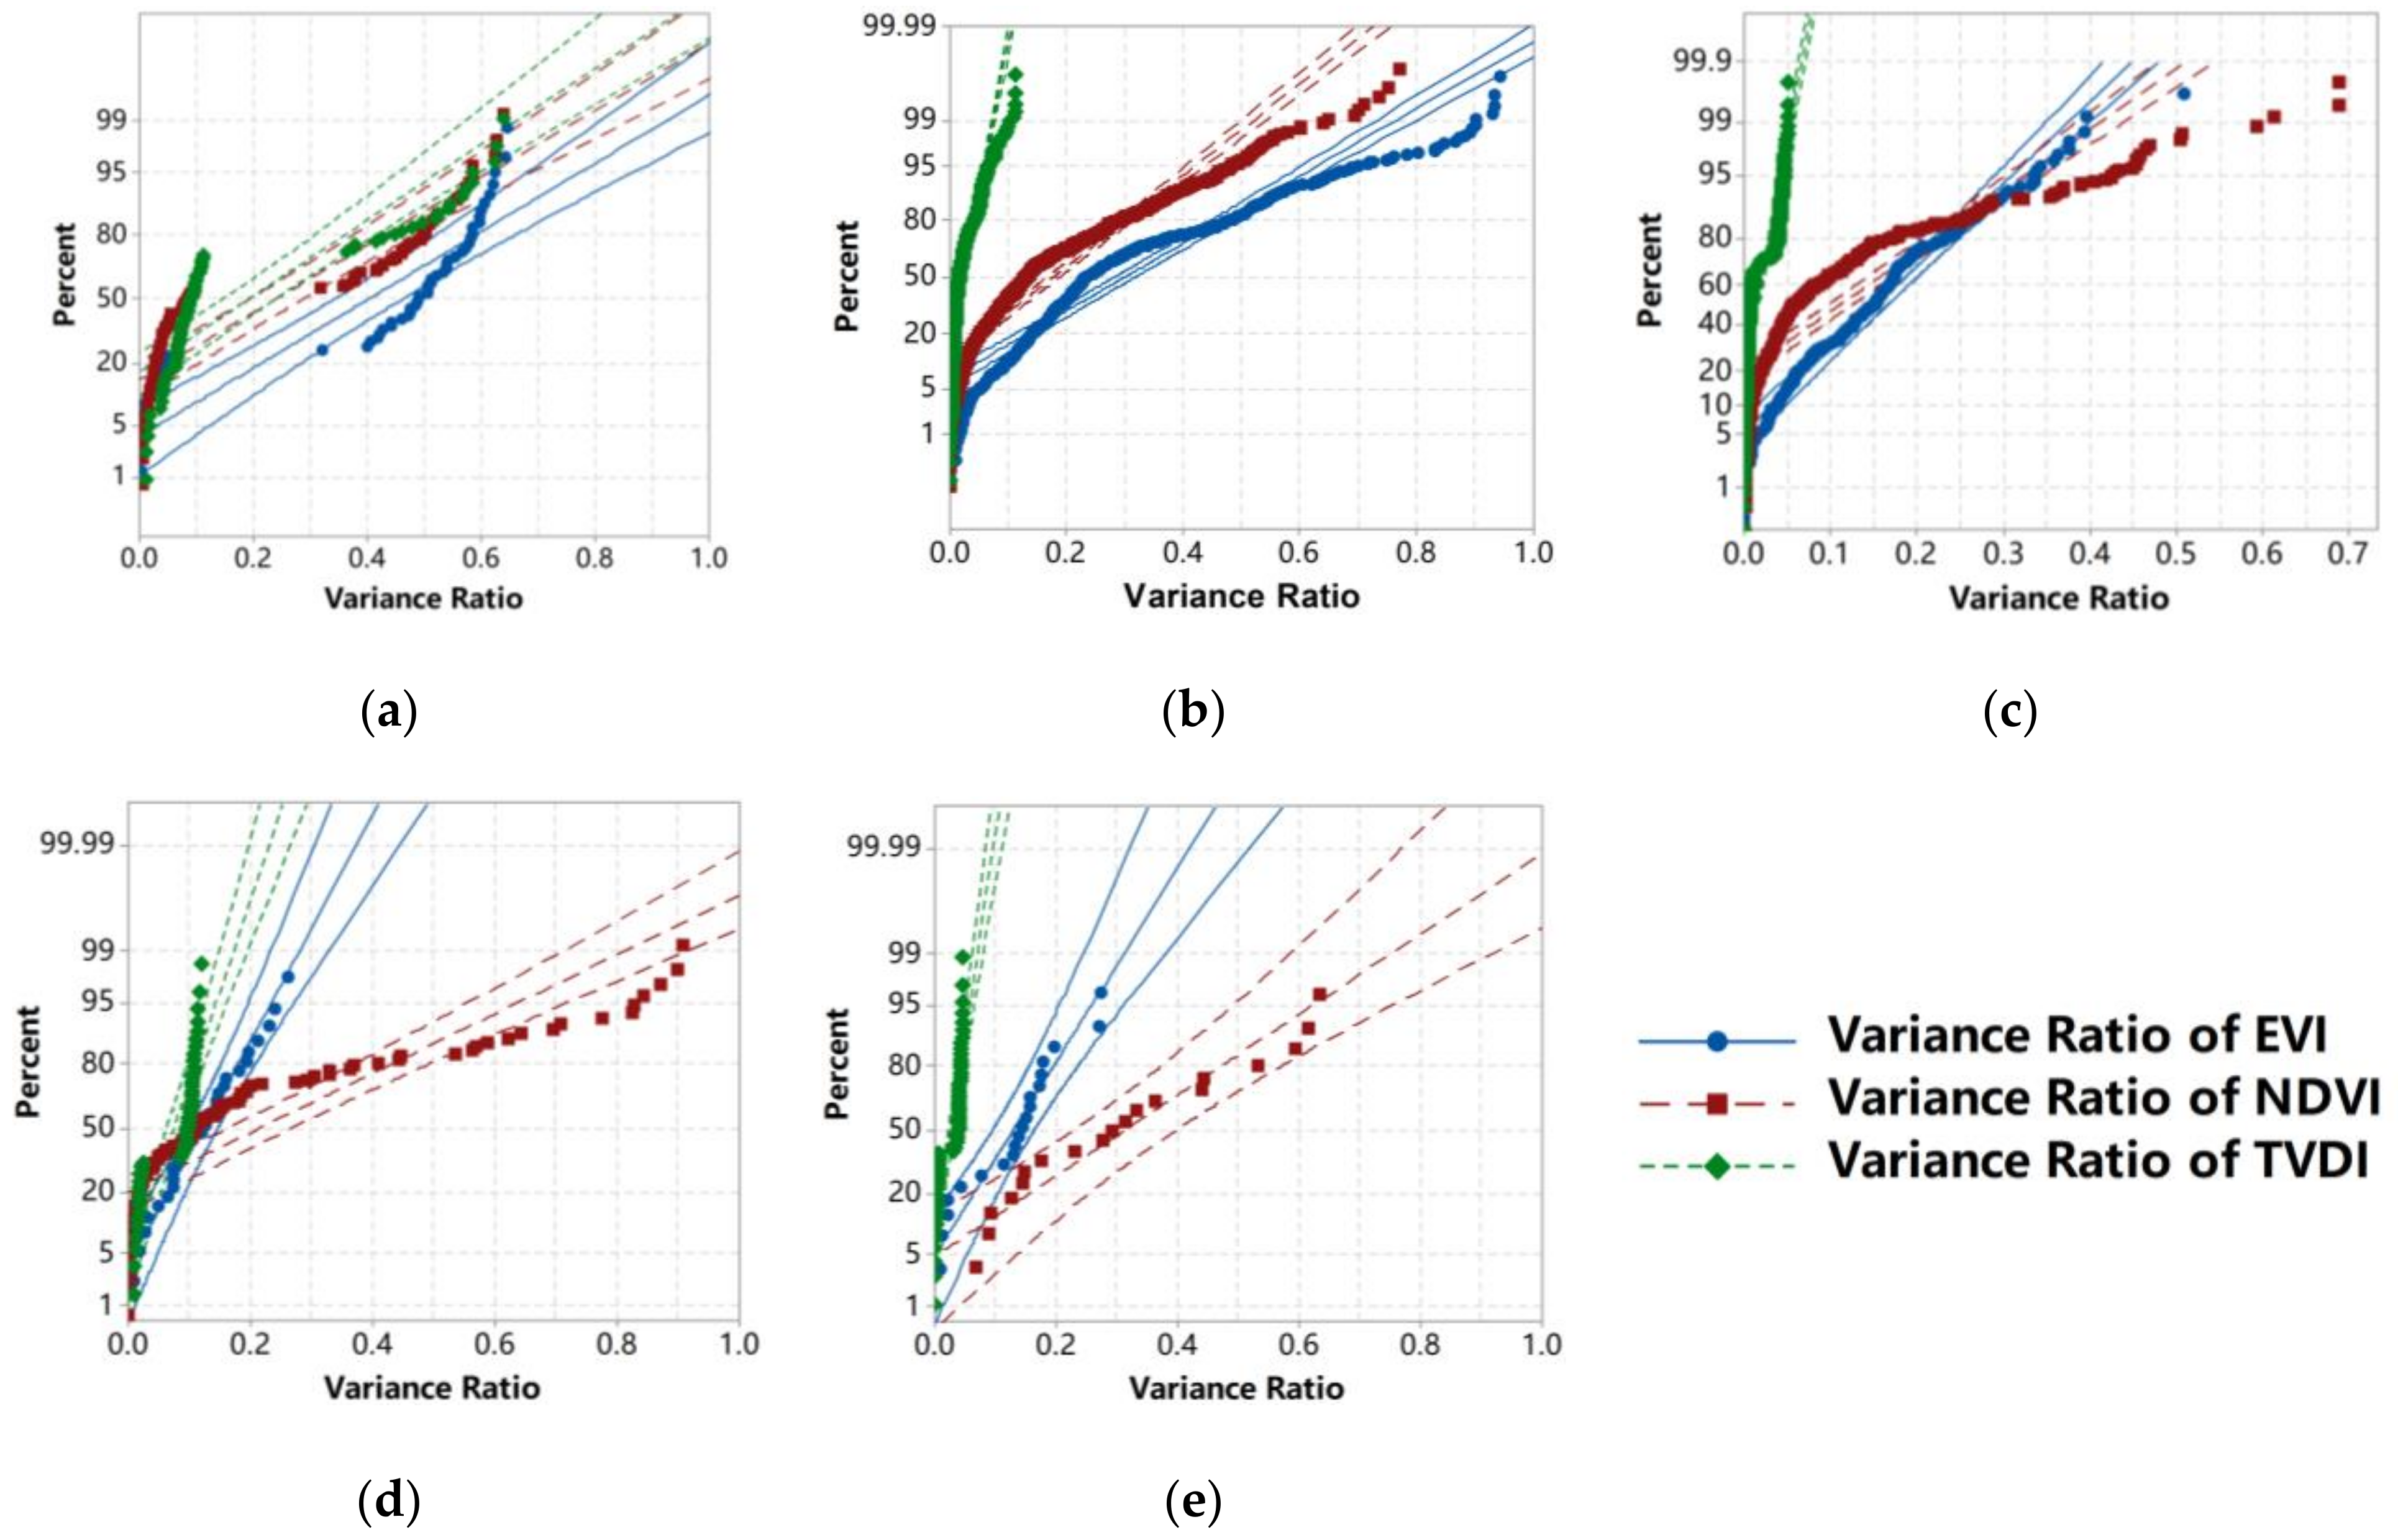
- (1)
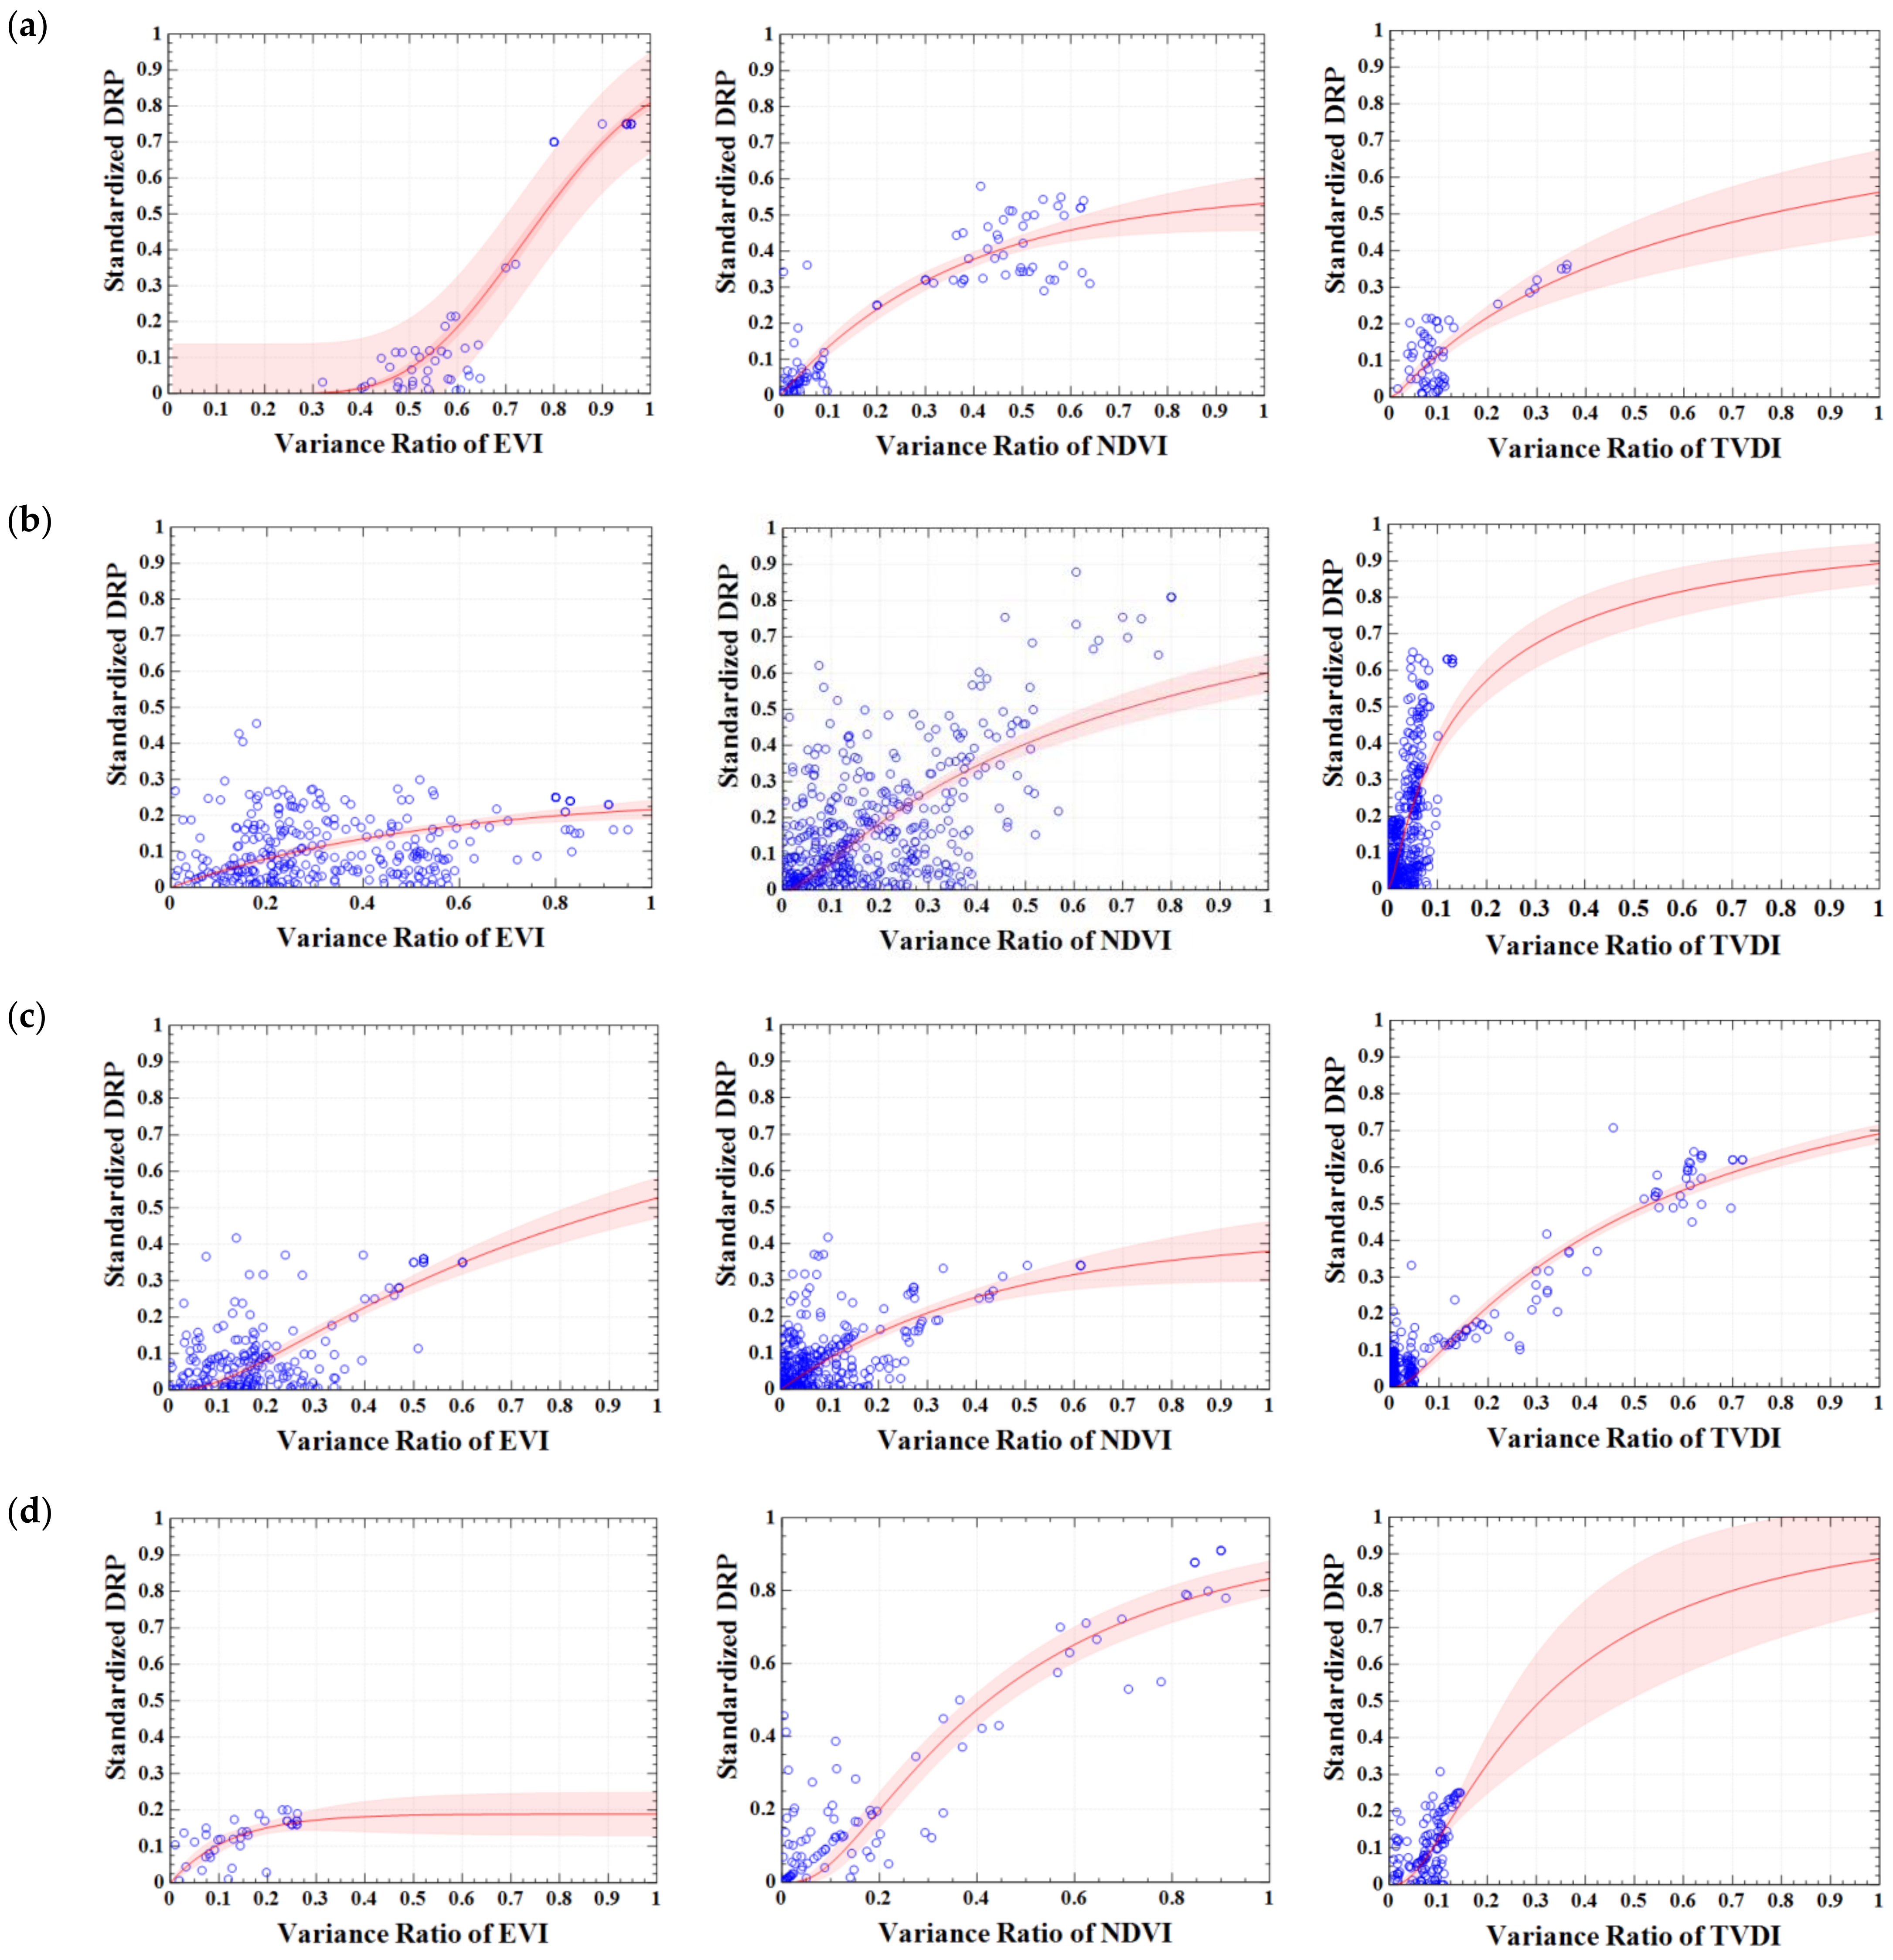
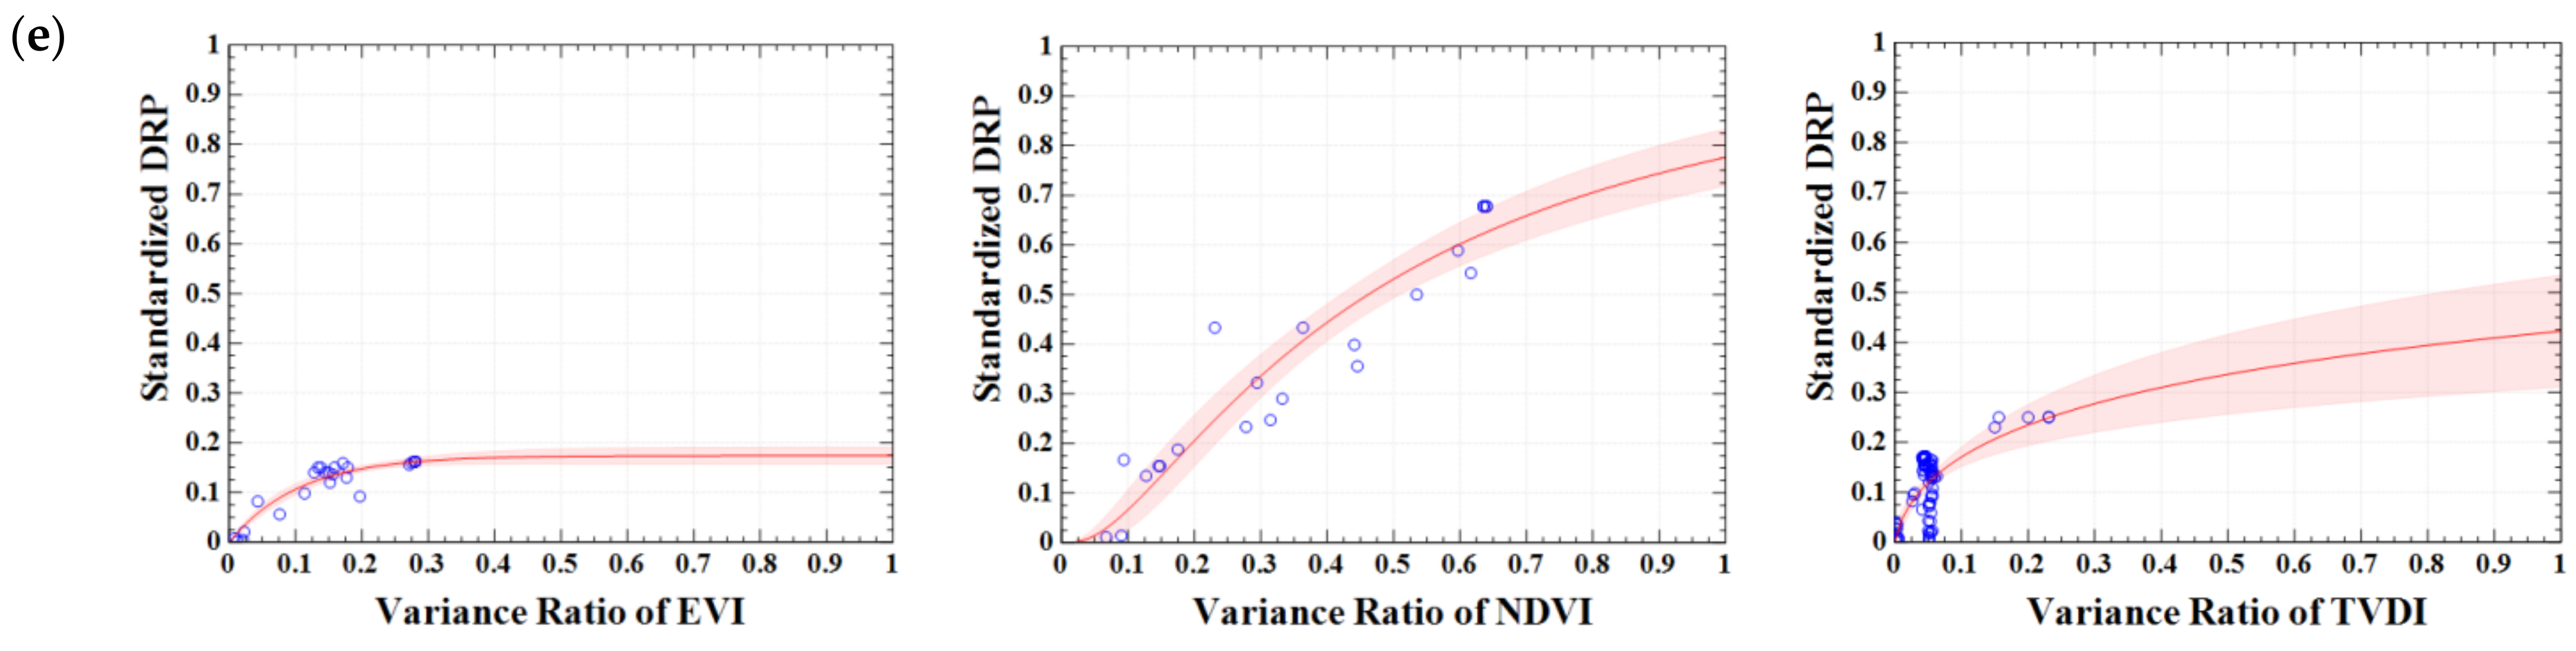
- In general, Most NDVI and TVDI variance ratios are concentrated between 0 and ~0.15, and most EVI variance ratios are concentrated between 0.15 and ~0.6.
- (2)
- In terms of the degree of loss, most values are in the range 0 ~ 0.3, with a cumulative proportion of about 90.19%.
- (3)
- The drought vulnerability curve conforms to the distribution rule of the logistic curve. It can be found that the AP region is always a high-risk area with high vulnerability, which should be the focus of drought risk prevention and reduction.
Author Contributions
Funding
Acknowledgments
Conflicts of Interest
References
- Council, A.M.S. Policy statement: Meteorological drought. Bull. Am. Meteorol. Soc. 1997, 78, 847–849. [Google Scholar]
- Jehanzaib, M.; Shah, S.A.; Kim, J.E.; Kim, T.-W. Exploring spatio-temporal variation of drought characteristics and propagation under climate change using multi-model ensemble projections. Nat. Hazards 2022, 1–21. [Google Scholar] [CrossRef]
- Zhou, K.; Wang, Y.; Chang, J.; Zhou, S.; Guo, A. Spatial and temporal evolution of drought characteristics across the Yellow River basin. Ecol. Indic. 2021, 131, 108207. [Google Scholar] [CrossRef]
- Hatfield, J.L.; Prueger, J.H. Value of Using Different Vegetative Indices to Quantify Agricultural Crop Characteristics at Different Growth Stages under Varying Management Practices. Remote Sens. 2010, 2, 562–578. [Google Scholar] [CrossRef]
- Rojas, O.; Vrieling, A.; Rembold, F. Assessing drought probability for agricultural areas in Africa with coarse resolution remote sensing imagery. Remote Sens. Environ. 2011, 115, 343–352. [Google Scholar] [CrossRef]
- Abbas, S.; Nichol, J.E.; Qamer, F.M.; Xu, J. Characterization of Drought Development through Remote Sensing: A Case Study in Central Yunnan, China. Remote Sens. 2014, 6, 4998–5018. [Google Scholar] [CrossRef]
- Guo, H.; Bao, A.; Ndayisaba, F.; Liu, T.; Jiapaer, G.; El-Tantawi, A.M.; De Maeyer, P. Space-time characterization of drought events and their impacts on vegetation in Central Asia. J. Hydrol. 2018, 564, 1165–1178. [Google Scholar] [CrossRef]
- Ye, M.; Qian, Z.H.; Wu, Y.P. Spatiotemporal evolution of the droughts and floods over China. Acta Phys. Sin. 2013, 62, 139203. [Google Scholar]
- Jia, H.; Chen, F.; Zhang, J.; Du, E. Vulnerability Analysis to Drought Based on Remote Sensing Indexes. Int. J. Environ. Res. Public Health 2020, 17, 7660. [Google Scholar] [CrossRef]
- Botterill, L.C.; Hayes, M.J. Drought triggers and declarations: Science and policy considerations for drought risk management. Nat. Hazards 2012, 64, 139–151. [Google Scholar] [CrossRef]
- Chen, F.; Wang, N.; Yu, B.; Wang, L. Res2-Unet, a new deep architecture for building detection from high spatial resolution images. IEEE J. Sel. Top. Appl. Earth Obs. Remote Sens. 2022, 15, 1494–1501. [Google Scholar] [CrossRef]
- Jia, H.; Chen, F.; Zhang, C.; Dong, J.; Du, E.; Wang, L. High emissions could increase the future risk of maize drought in China by 60–70%. Sci. Total Environ. 2022, 852, 158474. [Google Scholar] [CrossRef]
- Carlson, T.N.; Gillies, R.R.; Perry, E.M. A method to make use of thermal infrared temperature and NDVI measurements to infer surface soil water content and fractional vegetation cover. Remote Sens. Rev. 1994, 9, 161–173. [Google Scholar] [CrossRef]
- Sandholt, I.; Rasmussen, K.; Andersen, J. A simple interpretation of the surface temperature/vegetation index space for assessment of surface moisture status. Remote Sens. Environ. 2002, 79, 213–224. [Google Scholar] [CrossRef]
- Karnieli, A.; Agam, N.; Pinker, R.T.; Anderson, M.; Imhoff, M.L.; Gutman, G.G.; Panov, N.; Goldberg, A. Use of NDVI and Land Surface Temperature for Drought Assessment: Merits and Limitations. J. Clim. 2010, 23, 618–633. [Google Scholar] [CrossRef]
- Li, H.; Li, Z.; Chen, Y.; Liu, Y.; Hu, Y.; Sun, F.; Kayumba, P.M. Projected Meteorological Drought over Asian Drylands under Different CMIP6 Scenarios. Remote Sens. 2021, 13, 4409. [Google Scholar] [CrossRef]
- Singh, B.; Singh, D. Agronomic and physiological responses of sorghum, maize and pearl millet to irrigation. Field Crop. Res. 1995, 42, 57–67. [Google Scholar] [CrossRef]
- Chen, F.; Zhang, M.; Guo, H.; Allen, S.; Kargel, J.S.; Haritashya, U.K.; Watson, C.S. Annual 30 m dataset for glacial lakes in High Mountain Asia from 2008 to 2017. Earth Syst. Sci. Data 2021, 13, 741–766. [Google Scholar] [CrossRef]
- Shi, Y. The vulnerability research progress of natural disasters. J. Nat. Disasters 2011, 20, 131–137. [Google Scholar]
- Turner, B.L., II; Kasperson, R.E.; Matson, P.A.; McCarthy, J.J.; Corell, R.W.; Christensen, L.; Eckley, N.; Kasperson, J.X.; Luers, A.; Martello, M.L.; et al. A framework for vulnerability analysis in sustainability science. Proc. Natl. Acad. Sci. USA 2003, 100, 8074–8079. [Google Scholar] [CrossRef]
- Wei, Y.-M.; Fan, Y.; Lu, C.; Tsai, H.-T. The assessment of vulnerability to natural disasters in China by using the DEA method. Environ. Impact Assess. Rev. 2004, 24, 427–439. [Google Scholar] [CrossRef]
- Tschakert, P. Views from the vulnerable: Understanding climatic and other stressors in the Sahel. Glob. Environ. Chang. 2007, 17, 381–396. [Google Scholar] [CrossRef]
- Jia, H.; Chen, F.; Pan, D.; Du, E.; Wang, L.; Wang, N.; Yang, A. Flood risk management in the Yangtze River basin —Comparison of 1998 and 2020 events. Int. J. Disaster Risk Reduct. 2022, 68, 102724. [Google Scholar] [CrossRef]
- Zhou, L.; Wu, J.; Mo, X.; Zhou, H.; Diao, C.; Wang, Q.; Chen, Y.; Zhang, F. Quantitative and detailed spatiotemporal patterns of drought in China during 2001–2013. Sci. Total Environ. 2017, 589, 136–145. [Google Scholar] [CrossRef] [PubMed]
- AghaKouchak, A.; Farahmand, A.; Melton, F.S.; Teixeira, J.; Anderson, M.C.; Wardlow, B.D.; Hain, C.R. Remote sensing of drought: Progress, challenges and opportunities. Rev. Geophys. 2015, 53, 452–480. [Google Scholar] [CrossRef]
- Dutta, D.; Herath, S.; Musiake, K. A mathematical model for flood loss estimation. J. Hydrol. 2003, 277, 24–49. [Google Scholar] [CrossRef]
- Merz, B.; Kreibich, H.; Thieken, A.; Schmidtke, R. Estimation uncertainty of direct monetary flood damage to buildings. Nat. Hazards Earth Syst. Sci. 2004, 4, 153–163. [Google Scholar] [CrossRef]
- Colombi, M.; Borzi, B.; Crowley, H.; Onida, M.; Meroni, F.; Pinho, R. Deriving vulnerability curves using Italian earthquake damage data. Bull. Earthq. Eng. 2008, 6, 485–504. [Google Scholar] [CrossRef]
- Fuchs, S. Susceptibility versus resilience to mountain hazards in Austria—Paradigms of vulnerability revisited. Nat. Hazards Earth Syst. Sci. 2009, 9, 337–352. [Google Scholar] [CrossRef]
- Wilhelmi, O.V.; Wilhite, D.A. Assessing Vulnerability to Agricultural Drought: A Nebraska Case Study. Nat. Hazards 2002, 25, 37–58. [Google Scholar] [CrossRef]
- Yu, B.; Xu, C.; Chen, F.; Wang, N.; Wang, L. HADeenNet: A hierarchical-attention multi-scale deconvolution network for landslide detection. Int. J. Appl. Earth Obs. Geoinf. 2022, 111, 102853. [Google Scholar] [CrossRef]
- Pan, D.H.; Yuan, Y.; Jia, H.C. Rapid assessment of population in drinking water access difficulties because of drought in different regions of China. J. Catastrophology 2014, 29, 34–39. [Google Scholar]
- Wei, Z.; Paredes, P.; Liu, Y.; Chi, W.W.; Pereira, L.S. Modelling transpiration, soil evaporation and yield prediction of soybean in North China Plain. Agric. Water Manag. 2015, 147, 43–53. [Google Scholar] [CrossRef]
- Yan, H.S.; Wan, Y.X.; Yan, X.D.; Xie, Y.R. A study of the temporal and spatial features of dryness & wetness last 500-year period in China. J. Yunnan Univ. 2004, 26, 139–143. [Google Scholar]
- Li, Q.Z.; Yan, N.N.; Zhang, F.F.; Chang, S.; Wu, B. Drought monitoring and its impacts assessment in Southwest China using remote sensing in the Spring of 2010. Acta Geogr. Sin. 2010, 65, 771–780. [Google Scholar]
- Wang, H.; Lin, H.; Liu, D. Remotely sensed drought index and its responses to meteorological drought in Southwest China. Remote Sens. Lett. 2014, 5, 413–422. [Google Scholar] [CrossRef]
- Mu, L.L.; Wu, B.F.; Yan, N.N. Validation of agricultural drought indices and their uncertainty analysis. Bull. Soil Water Conserv. 2007, 27, 119–122. [Google Scholar]
- Salmoral, G.; Rey, D.; Rudd, A.; Margon, P.; Holman, I. A Probabilistic Risk Assessment of the National Economic Impacts of Regulatory Drought Management on Irrigated Agriculture. Earth’s Future 2019, 7, 178–196. [Google Scholar] [CrossRef]
- Yu, B.; Yang, A.; Chen, F.; Wang, N.; Wang, L. SNNFD, spiking neural segmentation network in frequency domain using high spatial resolution images for building extraction. Int. J. Appl. Earth Obs. Geoinf. 2022, 112, 102930. [Google Scholar] [CrossRef]
- Wang, Y.J.; Yan, F. Application of thermal inertia model in high vegetation coverage area for drought monitoring. Arid Land Geogr. 2014, 37, 539–547. [Google Scholar]
- Moran, M.; Clarke, T.; Inoue, Y.; Vidal, A. Estimating crop water deficit using the relation between surface-air temperature and spectral vegetation index. Remote Sens. Environ. 1994, 49, 246–263. [Google Scholar] [CrossRef]
- Kogan, F.N. Global drought and flood-watch from NOAA polar-orbitting satellites. Adv. Space Res. 1998, 21, 477–480. [Google Scholar] [CrossRef]
- Wan, Z.; Wang, P.; Li, X. Using MODIS Land Surface Temperature and Normalized Difference Vegetation Index products for monitoring drought in the southern Great Plains, USA. Int. J. Remote Sens. 2004, 25, 61–72. [Google Scholar] [CrossRef]
- Tang, F.; Wang, L.; Guo, Y.Q.; Fu, M.C.; Huang, N.; Duan, W.S.; Luo, M.; Zhang, J.J.; Li, W.; Song, W.J. Spatio-temporal variation and coupling coordination relationship between urbanisation and habitat quality in the Grand Canal, China. Land Use Policy 2022, 117, 106119. [Google Scholar] [CrossRef]
- Wang, P.X.; Gong, J.Y.; Li, X.W. Vegetation-temperature condition index and its application for drought monitoring. Geomat. Inf. Sci. Wuhan Univ. 2001, 26, 412–418. [Google Scholar]
- Menenti, M.; Jia, L. Observing the response of the land surface to climate variability by time series analysis of satellite observations. J. Remote Sens. 2016, 20, 946–957. [Google Scholar]
- Jia, H.; Wang, J.; Cao, C.; Pan, D.; Shi, P. Maize drought disaster risk assessment of China based on EPIC model. Int. J. Digit. Earth 2012, 5, 488–515. [Google Scholar] [CrossRef]
- Zhang, M.; Chen, F.; Guo, H.; Yi, L.; Zeng, J.; Li, B. Glacial Lake Area Changes in High Mountain Asia during 1990–2020 Using Satellite Remote Sensing. Research 2022, 2022, 9821275. [Google Scholar] [CrossRef]
- Juha, I.U. The geography of disaster vulnerability in megacities—A theoretical framework. Appl. Geogr. 1998, 1, 7–16. [Google Scholar]
- United Nations Development Programme (UNDP). A Global Report: Reducing Disaster Risk: A Challenge for Development; UNDP, Bureau for Crisis Prevention and Recovery: New York, NY, USA, 2004; pp. 1–161. [Google Scholar]
- Dilley, M.; Deichmann, U.; Chen, R.S. Natural Disaster Hotspots: A Global Risk Analysis; World Bank Publications: Washington, DC, USA, 2005; pp. 1–12. [Google Scholar]


| Data Set | Sub-Data Set | Data Source | Years |
|---|---|---|---|
| Historical disaster data | Drought event data, 1176 counties, for the five regions in China | National Disaster Reduction Center of the Ministry of Emergency Management of China | 2009–2013 |
| Remote sensing indices data for drought | MODIS vegetation indices, LST (land surface temperature) | https://ladsweb.modaps.eosdis.nasa.gov accessed on 21 January 2022. | 2009–2013 |
| Basic geographic data | County administrative division boundaries, rivers, etc. | China National Basic Geographic Information Center | 2015 |
| Year | Start Time | End Time | Duration/Day | Occurrence Season | Affected Area/Province | Average NDVI during Drought Period | Average EVI during Drought Period | Average TVDI during Drought Period | Average Rainfall during Drought Period | Population with Difficulty in Drinking Water/10,000 Persons |
|---|---|---|---|---|---|---|---|---|---|---|
| 2009 | 21 June 2009 | 16 August 2009 | 56 | Summer drought | Liaoning | 0.48 | 0.49 | 0.15 | 0.95 | 120.49 |
| 1 July 2009 | 30 September 2009 | 91 | Drought from summer to autumn | Hunan | 0.65 | 0.42 | 0.15 | 0.94 | 170.62 | |
| 12 July 2009 | 14 September 2009 | 64 | Drought from summer to autumn | Guangxi, Guizhou | 0.68 | 0.48 | 0.16 | 1.29 | 226.69 | |
| 1 July 2009 | 31 August 2009 | 61 | Summer drought | Gansu, Ningxia, Inner Mongolia, Shanxi, Jilin | 0.47 | 0.24 | 0.14 | 0.65 | 278.13 | |
| 2 February 2009 | 26 June 2009 | 144 | Drought from winter, spring to summer | Heilongjiang, Gansu, Ningxia | 0.20 | 0.18 | 0.15 | 0.38 | 131.12 | |
| 2010 | 1 July 2009 | 2 February 2010 | 216 | Drought from summer, autumn, to winter | Guangxi, Guizhou, Yunnan | 0.49 | 0.25 | 0.16 | 0.72 | 837.62 |
| 1 October 2009 | 31 March 2010 | 180 | Drought from winter, spring, to summer | Sichuan, Gansu | 0.21 | 0.12 | 0.14 | 0.18 | 371.79 | |
| 2011 | 31 March 2011 | 26 June 2011 | 117 | Drought from spring to summer | Gansu, Inner Mongolia, Ningxia | 0.19 | 0.11 | 0.15 | 0.19 | 252.65 |
| 7 April 2011 | 25 May 2011 | 48 | Spring drought | Hunan, Jiangsu, Jiangxi | 0.49 | 0.29 | 0.14 | 1.37 | 276.03 | |
| 1 April 2011 | 12 July 2011 | 102 | Drought from spring to summer | Sichuan, Guizhou, Yunnan | 0.45 | 0.33 | 0.15 | 1.09 | 708.21 | |
| 2012 | 25 June 2012 | 12 August 2012 | 37 | Summer drought | Hubei | 0.65 | 0.41 | 0.15 | 0.97 | 116.97 |
| 3 December 2011 | 18 February 2012 | 77 | Winter drought | Yunnan | 0.52 | 0.25 | 0.16 | 0.28 | 476.02 | |
| 2013 | 12 July 2013 | 13 August 2013 | 32 | Summer drought | Guizhou | 0.48 | 0.44 | 0.15 | 1.03 | 80.15 |
| 12 July 2013 | 29 August 2013 | 48 | Summer drought | Hunan | 0.70 | 0.47 | 0.15 | 1.19 | 33.48 | |
| 28 July 2013 | 24 September 2013 | 58 | Drought from summer to autumn | Jiangxi, Hubei | 0.58 | 0.48 | 0.14 | 1.23 | 453.24 | |
| 13 September 2013 | 18 December 2013 | 96 | Drought from autumn to winter | Sichuan, Yunnan | 0.52 | 0.31 | 0.14 | 0.18 | 709.68 | |
| 1 October 2013 | 18 February 2014 | 140 | Drought from autumn to winter | Gansu | 0.11 | 0.14 | 0.18 | 0.07 | 115.37 |
| Statistical Parameters | Sub-Region | EVI | NDVI | TVDI |
|---|---|---|---|---|
| Standard Error | NW | 0.0696 | 0.0739 | 0.0687 |
| SW | 0.0855 | 0.1481 | 0.1276 | |
| HJ | 0.0838 | 0.0778 | 0.0592 | |
| AP | 0.0432 | 0.01229 | 0.0685 | |
| YR | 0.0164 | 0.0743 | 0.0494 | |
| Coefficient of Determination | NW | 0.9488 | 0.8409 | 0.5021 |
| SW | 0.3515 | 0.3682 | 0.4039 | |
| HJ | 0.5352 | 0.3089 | 0.8809 | |
| AP | 0.4879 | 0.8298 | 0.4588 | |
| YR | 0.8997 | 0.9001 | 0.4829 | |
| Correlation Coefficient | NW | 0.9741 | 0.9171 | 0.7086 |
| SW | 0.5929 | 0.6068 | 0.6355 | |
| HJ | 0.7315 | 0.5558 | 0.9386 | |
| AP | 0.6985 | 0.9109 | 0.6774 | |
| YR | 0.9486 | 0.9487 | 0.6949 |
Disclaimer/Publisher’s Note: The statements, opinions and data contained in all publications are solely those of the individual author(s) and contributor(s) and not of MDPI and/or the editor(s). MDPI and/or the editor(s) disclaim responsibility for any injury to people or property resulting from any ideas, methods, instructions or products referred to in the content. |
© 2023 by the authors. Licensee MDPI, Basel, Switzerland. This article is an open access article distributed under the terms and conditions of the Creative Commons Attribution (CC BY) license (https://creativecommons.org/licenses/by/4.0/).
Share and Cite
Jia, H.; Chen, F.; Du, E.; Wang, L. Drought Vulnerability Curves Based on Remote Sensing and Historical Disaster Dataset. Remote Sens. 2023, 15, 858. https://doi.org/10.3390/rs15030858
Jia H, Chen F, Du E, Wang L. Drought Vulnerability Curves Based on Remote Sensing and Historical Disaster Dataset. Remote Sensing. 2023; 15(3):858. https://doi.org/10.3390/rs15030858
Chicago/Turabian StyleJia, Huicong, Fang Chen, Enyu Du, and Lei Wang. 2023. "Drought Vulnerability Curves Based on Remote Sensing and Historical Disaster Dataset" Remote Sensing 15, no. 3: 858. https://doi.org/10.3390/rs15030858
APA StyleJia, H., Chen, F., Du, E., & Wang, L. (2023). Drought Vulnerability Curves Based on Remote Sensing and Historical Disaster Dataset. Remote Sensing, 15(3), 858. https://doi.org/10.3390/rs15030858