Abstract
As drought vulnerability assessment is fundamental to risk management, it is urgent to develop scientific and reasonable assessment models to determine such vulnerability. A vulnerability curve is the key to risk assessment of various disasters, connecting analysis of hazard and risk. To date, the research on vulnerability curves of earthquakes, floods and typhoons is relatively mature. However, there are few studies on the drought vulnerability curve, and its application value needs to be further confirmed and popularized. In this study, on the basis of collecting historical disaster data from 52 drought events in China from 2009 to 2013, three drought remote sensing indexes were selected as disaster-causing factors; the affected population was selected to reflect the overall disaster situation, and five typical regional drought vulnerability curves were constructed. The results showed that (1) in general, according to the statistics of probability distribution, most of the normalized difference vegetation index (NDVI) and the temperature vegetation drought index (TVDI) variance ratios were concentrated between 0 and ~0.15, and most of the enhanced vegetation index (EVI) variance ratios were concentrated between 0.15 and ~0.6. From a regional perspective, the NDVI and EVI variance ratio values of the northwest inland perennial arid area (NW), the southwest mountainous area with successive years of drought (SW), and the Hunan Hubei Jiangxi area with sudden change from drought to waterlogging (HJ) regions were close and significantly higher than the TVDI variance ratio values. (2) Most of the losses (drought at-risk populations, DRP) were concentrated in 0~0.3, with a cumulative proportion of about 90.19%. At the significance level, DRP obeys the Weibull distribution through hypothesis testing, and the parameters are optimal. (3) The drought vulnerability curve conformed to the distribution rule of the logistic curve, and the line shape was the growth of the loss rate from 0 to 1. It was found that the arid and ecologically fragile area in the farming pastoral ecotone (AP) region was always a high-risk area with high vulnerability, which should be the focus of drought risk prevention and reduction. The study reduces the difficulty of developing the vulnerability curve, indicating that the method can be widely used to other regions in the future. Furthermore, the research results are of great significance to the accurate drought risk early warning or whether to implement the national drought disaster emergency rescue response.
1. Introduction
Drought is one of the most common agricultural natural disasters in the world. It is characterized by frequent occurrence and long-term persistence [1,2]. Drought refers to the phenomenon of water shortage caused by the imbalance of income and expenditure or supply and demand of water resources due to the reduction of precipitation [3,4]. Due to China’s vast territory, diverse topographic and geomorphic features, and large climate differences, the occurrence of natural disasters often presents different characteristics in space [5,6,7,8]. The characteristics of disasters can manifest as multiple disasters in one place, that is, multiple disasters coexisting in the same area, such as drought-fire-vegetation degradation-living environment deterioration; they can also appear as the same disaster in many places, that is, the same natural disaster occurring in different regions, such as the same drought occurring in many places in a period of time; or they can manifest as different disasters in different places, that is, different natural disasters occurring in different regions at the same time, such as waterlogging in the south and drought in the north, or waterlogging in the north and drought in the south. In China, most natural disasters originate from climate change and meteorological disasters. The meteorological disasters caused by climate change account for more than 70% of the total losses from all natural disasters [9]. Drought is the most serious meteorological disaster in China, and its large-scale distribution makes it harmful to a wide range of people. Once drought happens, it will have a large-scale and long-term impact [10,11,12].
The research on drought vulnerability mainly focuses on the formation mechanism, regional vulnerability assessment, and vulnerability zoning of drought disaster-affected bodies. Relevant assessment methods include traditional statistical reporting methods, disaster assessment based on various drought indexes, vulnerability assessment based on disaster-affected bodies, and disaster assessment based on historical cases. Assessment based on drought indexes can be subdivided into the assessment of remote sensing drought indexes (e.g., ATI, CWSI, AVI, and VTCI) [13,14,15] and the assessment of non-remote sensing drought indexes (e.g., SPI and Palmer) [16]. The basic idea is to establish various drought indexes, determine the drought threshold on this basis, and then divide the crop planting area into different disaster levels; thus, the area of affected crops is finally calculated [17,18]. Most drought risk assessment methods are to multiply the loss rate under the intensity of a certain consistent disaster factor by the number of disaster-affected bodies exposed within its influence range. The core and difficulty in risk assessment is to build vulnerability curves [19]. The purpose of assessing drought vulnerability [20,21] is to minimize disaster losses, give early warning, or launch a national natural disaster emergency response as necessary. In practical work, disaster rapid assessment is an important part of risk assessment of drought disaster. In the absence of timely disaster data, a preliminary judgment is given to facilitate the organization of post-disaster relief work in advance.
The quantitative analysis of vulnerability is mainly to quantify the system factors leading to regional drought and its impact, using an integrated assessment model. From the perspective of vulnerability assessment scales of drought disaster-affected bodies, the assessment is mainly concentrated on small- and medium-sized scales, and there is little research on the dynamic change of drought vulnerability in different regions [22].
Most Chinese scholars pay more attention to the northern region when studying the spatial and temporal distribution characteristics of drought. The change rate of meteorological drought has been on the rise in the past 50 years in China [23,24]. Under the background of increasing extreme weather events, precipitation in southern China shows a weak increasing trend, and temperature is increasing significantly [25]. Due to the difference of disaster-prone environments in different regions, the types and disaster-causing intensity of extreme climate events are also different, especially in China, which is affected by its monsoon climate and has a vast land area with obvious regional differentiation. The economic and social development levels of different regions are different, leading to varied drought-resistance investment. Therefore, the mechanism of drought formation and the degree of drought in different regions are very different. Five regions—the northwest inland perennial arid area (NW), the arid and ecologically fragile area in farming pastoral ecotone (AP), the high-temperature and summer drought area in the middle and lower reaches of the Yangtze River (YR), the southwest mountainous area with successive years of drought (SW), and the Hunan Hubei Jiangxi area with sudden changes from drought to waterlogging (HJ)—basically cover the main types of drought in China.
Compared with system vulnerability, measuring individual vulnerability is more accurate. The vulnerability curve mainly describes the relationship between a series of intensities and the affected degree of various disaster-affected bodies, which is expressed in the form of tables or curves. A vulnerability curve is the key to risk assessment of various disasters, connecting analysis of hazard and risk. To date, the research on vulnerability curves of earthquakes, floods and typhoons is relatively mature [26,27,28,29]. However, there are few studies on the drought vulnerability curve, and its application value needs to be further confirmed and popularized. The disaster loss curve reflects the overall vulnerability characteristics at the regional scale through the vulnerability of disaster-affected individuals [30]. In the face of disaster-affected individuals, problems such as the rough and weak operability of vulnerability assessment results are fundamentally solved.
Research on the vulnerability assessment of drought disaster-affected bodies, which is mainly qualitative and semi-quantitative, is relatively scarce, and the research accuracy is low. Because there is no standardized disaster loss investigation and assessment system, it is difficult to obtain disaster data and build a mature and practical vulnerability curve database. Therefore, building vulnerability curve models under different regional drought intensities is an important topic and trend of current research. To date, most studies are limited to the applicability of individual drought indexes in individual regions. In this study, three drought remote sensing monitoring indexes are selected as disaster-causing factors. To tie in with the natural disaster statistics system, the drought at-risk populations (DRP) is selected to represent the loss. Agricultural drought relates to agricultural production. The people with difficulties in drinking water concerned in this study can reflect the scope and degrees of drought impact on agriculture. Therefore, agricultural drought was discussed in our study. Based on a large number of historical cases of drought events, the quantitative function relationship between disaster intensity and loss is quantitatively fitted, and vulnerability loss curves of different regions are constructed.
The purposes of this study are as follows: (1) to explore the differences of drought monitoring by three remote sensing drought indexes from the whole country and sub-regions; (2) to analyze the distribution patterns of disaster loss from the perspective of probability; and (3) to fit the vulnerability curves in each region to determine which drought index is more suitable to indicate vulnerability under the same conditions.
2. Materials and Methods
2.1. Study Area
China is one of the major arid countries in the world (Figure 1). The arid and semi-arid areas in the country are mainly distributed in the western region of China, and account for about half of its total land area, of which the arid and semi-arid areas in the northwest account for about 83% of the land area of the region [31].
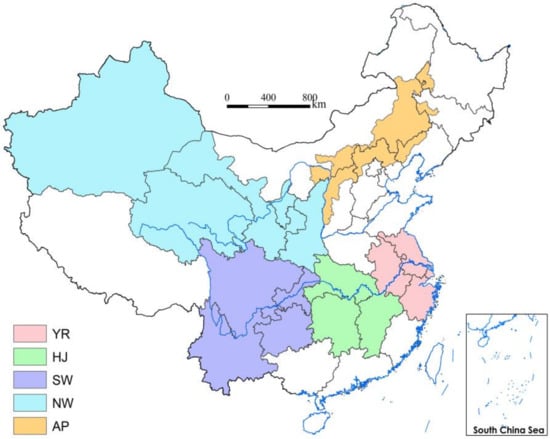
Figure 1.
Location of the study area.
- The northwest inland perennial arid area (NW): the climatic characteristics are mainly characterized by scarce precipitation, sparse vegetation, large surface evaporation, severe agricultural water deficit, and frequent drought disasters [32].
- The arid and ecologically fragile area in farming pastoral ecotone (AP): With the rapid decline of annual rainfall in western China, the climate type has changed from semi-humid and semi-arid to an arid climate zone, and the natural landscape has changed from forest grassland and dry grassland to semi-desert grassland, thus forming the farming pastoral transition zone [33]. The basic factor promoting the transition of agriculture and animal husbandry is drought and water shortage.
- High-temperature and summer drought area in the middle and lower reaches of the Yangtze River (YR): With developed agriculture and a dense population, this region is one of the most economically developed regions in China, and also a representative region of socially dependent water shortage [34]. It is dominated by continuous drought in summer and autumn, especially in midsummer. High temperature and little rain have a serious impact on grain production and even crop failure.
- The southwest mountainous area with successive years of drought (SW): Due to the intensification of El Niño and the thermal impact of the Qinghai Tibet Plateau, extreme precipitation events in southwest China are increasing, which aggravates the drought risk there [35]. In recent years, drought in Southwest China has become more serious. For example, five provinces (districts and cities) in Southwest China suffered from a historically rare drought from September 2009 to May 2010. It led to the destruction of regional agriculture, society and ecology [36].
- The Hunan Hubei Jiangxi area with sudden change from drought to waterlogging (HJ): Affected by monsoon precipitation and the change of the subtropical high pressure in the western Pacific Ocean, this region is a typical area with frequent drought and flood disasters [37]. During the occurrence and development of drought and flood, not only will each have an impact on people’s production, life, and natural ecosystems, but also the rapid change of drought and flood will cause the superimposed loss of both factors, which is more serious than a single drought or flood disaster.
2.2. Materials
Based on the needs of drought vulnerability analysis, this paper collects a series of basic data required for the study (Table 1). The basic data mainly include historical disaster data and drought index data. The historical drought event data include process data recorded by 1176 counties in total for 52 drought events in 2009–2013, reported by the Chinese government (Table 2). After a drought, the national emergency response will be started according to the number of people affected by the drought. Considering the integrity and continuity of the data, our research focuses on the drought-affected population. The 2009–2013 MOD13Q1 and MODIS11A2 data were downloaded from NASA’s official website. Using the Google Earth Engine (GEE) platform, the MOD13Q1 and MODIS11A2 were each processed according to the relevant scale factor, and the image data within the study area were clipped and downloaded according to a vector boundary map of the study area. Other data were provided by the China National Basic Geographic Information Center.

Table 1.
Datasets used in this study.

Table 2.
Statistics of historical drought event data and remote sensing monitoring indicators.
2.3. Methods
A drought disaster database can provide decision support for disaster risk management. Multiple drought cases are integrated to form a digital drought disaster regional information system with spatial and temporal correlation, so as to realize the auxiliary research on the temporal and spatial differentiation and transfer pattern of drought systems. The hazard indicators are used to reflect the intensities and characteristics of the disaster, mainly including the occurrence time, the spatial scope of the disaster impact, and the disaster intensity. The disaster indicator system is used to evaluate the potential losses, reflecting economic or property losses. A disaster event includes the description of the attribute information and loss indicators. Based on the National Standard for Statistical Indicators of Natural Disasters, the drought disaster indicator selected in this study is DRP. In this study, disaster events are sorted, images are reprogrammed using MRT (MODIS Reprojection Tool), and images of the same date are spliced, cropped, and calculated in combination with ENVI, ARCGIS, and vector files.
The NDVI index has the advantage of using satellite data to monitor the vegetation health related to drought events, with very high resolution and large spatial coverage. The disadvantage is that it is greatly affected by the soil background, which has lower sensitivity to high vegetation area. EVI can minimize the impact of vegetation canopy background and maintain high sensitivity under dense vegetation conditions. The disadvantage is that the stress of plant canopy may be caused by factors other than drought, and it is difficult to identify using EVI only. The advantage of TVDI is that it combines visible and near infrared data, has clear physical meaning and is easy to operate. It does not rely on any atmospheric or surface data or any special land surface model. The disadvantage is that the applicability in different climatic regions will vary due to different vegetation conditions and soil temperatures. Each index has its own advantages and disadvantages. Taking data availability into consideration primarily, the above three indexes are selected in this study. The GEE platform is used to directly read the MODIS dataset for NDVI and EVI downloading, sampling, and clipping. TVDI, namely, the temperature vegetation drought index, is mainly applicable to building NDVI-LST space. Among them, NDVI is sometimes replaced by the enhanced vegetation index (EVI), which is often used to study the role of TVDI in drought monitoring in different actual regions. For the calculation formula of TVDI, one can refer to [38].
A statistic is a function of a sample. It is well known that the cumulative distribution function (CDF) of a random variable X, or just a distribution function of X, evaluated at x, is the probability that X will take a value less than or equal to x. If a scalar conforms to the continuous distribution, CDF gives the area under the probability density function (PDF) from negative infinity to x. For multivariate random variables, we can use CDFs to describe their distribution [39]. In probability theory and mathematical statistics, a probability distribution is the mathematical function that provides the probabilities of occurrence of different possible results for an event. A probability distribution is a mathematical description of the probabilities of events, subsets of the sample space, which can be described in various forms. On this basis, the probability density and cumulative probability function are used to statistically analyze the distribution of drought loss data.
Vulnerability can typically reflect the damage or loss of exposure by hazard. On the whole, we can estimate the loss by reported statistical historical event data. Population vulnerability of drought is estimated by the statistical population with difficulties in drinking water and population exposure. Finally, the three remote sensing drought index data and DRP are fitted with the vulnerability curves and analyzed in different regions. Each vulnerability curve is applied to each region to map the drought-affected population risk (Figure 2).
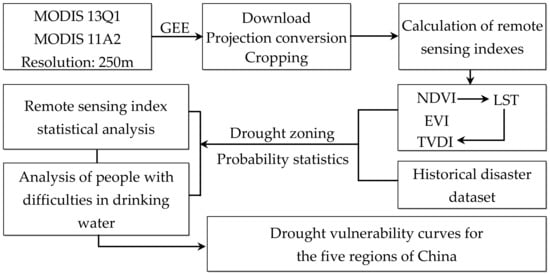
Figure 2.
Flow chart of the methodology of this research.
3. Results
3.1. Monitoring Drought by Remote Sensing Index
To reveal the pattern of drought disaster, this paper uses PDF and CDF to perform the mathematical description on NDVI, EVI, and TVDI variance ratio indicators (Figure 3). N in this study represents the number of data excluding the abnormal value of drought index variance ratio and corresponding loss of zero (DRP = 0). We found that most NDVI variance ratios are concentrated between 0 and ~0.15, and the cumulative proportion is 56.72%, of which the cumulative probability of 0~0.05 is 44.35%, and the cumulative probability of more than 0.60 is 5.65%. For the EVI variance ratio, we can see that most EVI variance ratios are concentrated between 0.15 and ~0.6, and the cumulative proportion is about 63.19%, of which the cumulative probability of 0.15~0.4 is 58.26%, and the cumulative probability of more than 0.75 is 4.05%. In addition, for the TVDI variance ratio, we can see that most TVDI variance ratios are concentrated between 0 and ~0.15, with a cumulative proportion of about 77.97%, of which the cumulative probability of 0~0.08 is 68.36%, and the cumulative probability of more than 0.45 is 3.67%. From Figure 3, the degree and scope of drought reflected by NDVI and TVDI index are not as obvious as EVI. In the period of vigorous vegetation growth, NDVI quickly saturates with the increase in leaf area. Therefore, NDVI has lower sensitivity to high vegetation area. TVDI is calculated based on LST and NDVI, which is closely related to land surface parameters and vegetation coverage. Therefore, the NDVI and TVDI vegetation indexes reflect a close drought degree. EVI can minimize the impact of vegetation canopy background and maintain high sensitivity under dense vegetation conditions. It will be noted that Figure 3 shows the overall situation of multi-year drought events in all typical regions, which may be related to the spatial-temporal differences in soil moisture, soil temperature, land surface temperature, and vegetation conditions.
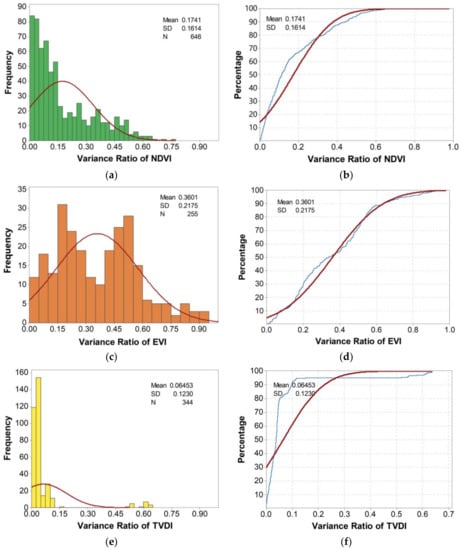
Figure 3.
Probability density and cumulative probability function (a) PDF for NDVI; (b) CDF for NDVI; (c) PDF for EVI; (d) CDF for EVI; (e) PDF for TVDI; (f) CDF for TVDI.
It can be seen from Figure 4 that the NDVI and EVI variance ratio values of NW, SW, and HJ are close and significantly higher than the TVDI variance ratio values. However, the high NDVI variability of the AP and YR regions is greater than EVI, and still significantly higher than the TVDI variance ratio.
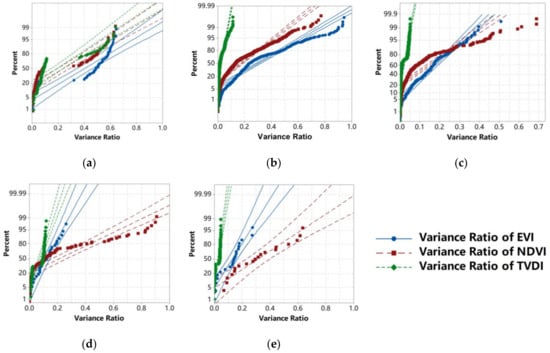
Figure 4.
Probability plot of variance ratio of NDVI, EVI, and TVDI in sub-regions of China: (a) NW; (b) SW; (c) HJ; (d) AP; and (e) YR.
3.2. DRP Analysis
The population index with DRP was used to reflect the overall disaster situation of drought. DRP data standardization is to eliminate the impact of multi-source data units. As a part of probability and statistics, parameter estimation is associated with obtaining information about features of stochastic processes, random variables, and systems on the basis of samples.
The properties include Lognormal, Exponential, Gamma, and Weibull distribution forms; the estimation parameters and probability distribution map (Figure 5) of DRP are obtained. We find that the p value of Exponential, Gamma, and Weibull distribution is greater than 0.05, except Lognormal. For AD values, the order is Lognormal (2.397) > Exponential (0.552) > Gamma (0.412) > Weibull (0.377). At the significance level, DRP obeys the Weibull distribution through hypothesis testing, and the parameters are optimal.
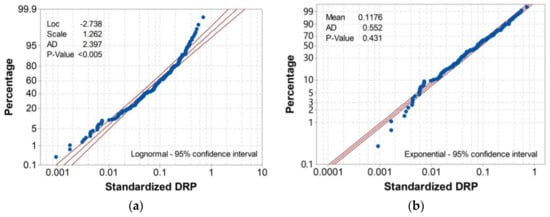
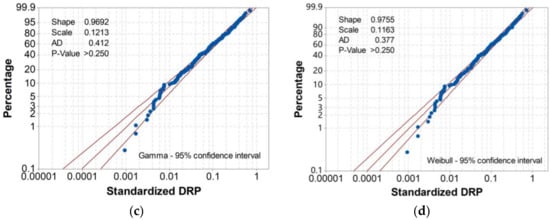
Figure 5.
Probability plot of DRP. (a) Lognormal > 95% confidence interval; (b) Exponential > 95% confidence interval; (c) Gamma > 95% confidence interval; (d) Weibull > 95% confidence interval.
Most of the losses (drought at-risk populations) are concentrated in 0~0.3, a cumulative proportion is up to 90.19%, the proportion of 0~0.15 is 78.26%; the cumulative probability of 0.3~0.45 is about 7.84%, and the cumulative probability of more than 0.5 is 1.17% (Figure 6). It can be seen that the drought has a certain impact on the population, of which about 80% of the population with difficulty in drinking water due to drought are below 0.25.
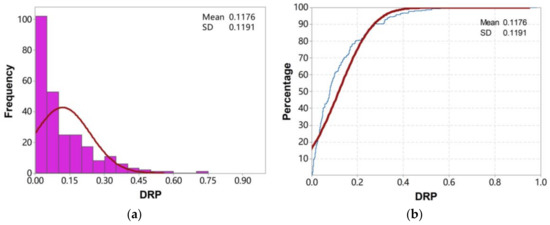
Figure 6.
Probability density and cumulative probability of the standardized DRP: (a) Probability density; and (b) Cumulative probability.
3.3. Vulnerability Analysis
The drought vulnerability curve is established to reflect the overall vulnerability characteristics of a homogeneous region. From a regional perspective, the drought vulnerability curves for the five regions were constructed (Figure 7). The drought vulnerability curve conforms to the distribution rule of the Logistic curve, and the line shape is the growth of the loss rate from 0 to 1.
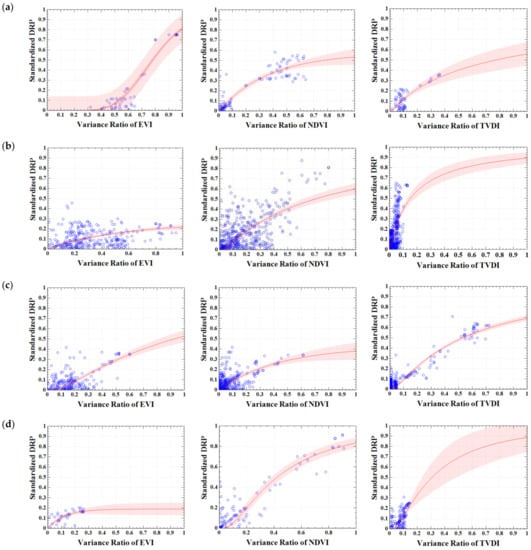

Figure 7.
Vulnerability curves for the five regions of China: (a) NW; (b) SW; (c) HJ; (d) AP; and (e) YR.
It can be seen from Figure 7 that the EVI variance ratio of the fixed horizontal axis is 0.5, and the DRP loss rate of each region is compared: the drought loss rate is 0.05–0.1 in NW; 0.15–0.2 in SW; 0.25–0.3 in HJ; 0.2–0.25 in AP; and 0.18 in YR (close to 0.2). Therefore, the drought vulnerability in each subarea from highest to lowest is HJ > AP > YR > SW > NW. Similarly, the fixed horizontal axis NDVI variance ratio is 0.5, and the DRP loss rate of each region is compared: the drought loss rate is 0.4–0.45 in NW; 0.4–0.42 in SW; 0.25–0.3 in HJ; 0.55–0.6 in AP; and 0.5–0.55 in YR. Therefore, the vulnerability of drought in each subarea from highest to lowest is AP > YR > NW > SW > HJ. When the horizontal axis TVDI variable rate is 0.5, the drought loss rate is 0.35–0.4 in NW; 0.75–0.8 in SW; 0.45–0.5 in HJ; 0.65–0.7 in AP; and 0.3–0.35 in YR. Therefore, the drought vulnerability of each subarea from highest to lowest is SW > AP > HJ > NW > YR.
Although the vulnerability fitted by different remote sensing indexes is quite different, it can be found that the AP region is always a high-risk area with high vulnerability, which should be the focus of drought risk prevention and reduction.
The statistical parameters of the vulnerability curve of the five sub-regions are summarized in Table 3. When comparing the coefficient of determination (R2) between the different vulnerability curves, in case of the same event, for AP and YR, the NDVI is more suitable for fitting vulnerability than that based on EVI and TVDI. For the NW area, EVI is more suitable for fitting vulnerability, with a higher accuracy. For the SW and HJ areas, TVDI is more suitable for fitting vulnerability than NDVI and EVI.

Table 3.
Statistical parameters of fitting vulnerability curves of five sub-regions.
4. Discussion
4.1. Regional Applicability of Remote-Sensed Drought Index
The traditional drought monitoring and vulnerability analysis are mostly based on the observation records of meteorological stations. In this study, multiple drought remote sensing monitoring indexes are selected as the disaster-causing factors to realize the quantitative characterization of large-scale drought conditions. The advantages of establishing a drought index based on remote sensing technology include the continuity of a large range of spatial data, the availability of relevant data in areas with sparse or non-existent ground stations, the high playback rate of data acquisition, the ability to review and analyze historical data, and meaningful historical drought analysis and modeling [40].
A large number of drought index remote sensing models developed at present provide the possibility of drought monitoring at the regional scale. However, these indexes are also subject to different restrictions in practical applications. The selection and application of drought indicators should be judged according to the actual conditions of the monitoring area, the appropriate time scale, and the practicality [41,42,43,44]. For example, simple drought indexes such as NDVI and EVI can be calculated by combining different bands of remote sensing images, and they can be used for long time series analysis. However, the expression of drought is not intuitive, as it cannot directly express distribution and intensity, and it is vulnerable to various noises from remote sensing images. Another type is the drought index obtained by the two-dimensional scatter method, such as TVDI. Because it is difficult to completely process all kinds of noise in remote sensing images, and also because it does not take into account the impacts of regional climate and ecology, the two-dimensional scatter map is highly unstable; thus, the precision of the drought index calculated is also unstable, and it is difficult to conduct a more accurate drought analysis of long time series. Therefore, for the spatial and temporal distribution characteristics of the same drought event (e.g., duration, impact range, and intensity), different drought indexes will give different results [45,46]. Therefore, it is of great scientific significance to study the regional applicability of different drought indexes. In addition, it should also be considered that different drought indexes have different thresholds, and the threshold of the same drought index in different regions may also need to be adjusted.
4.2. Vulnerability Curves Analysis
With the intensification of the global drought trend, extreme drought events have occurred frequently in recent years, which have attracted global attention [47]. China is a country with frequent drought disasters. The severe drought situation has brought challenges to drought relief and disaster reduction, and there is a need to shift from crisis management to risk management. The vulnerability reflects the sensitivity of populations in different regions to droughts: low vulnerability illustrates that a severe drought may not cause catastrophic losses, while in areas of high vulnerability, even a light or medium drought could easily lead to catastrophic losses. It is urgent to develop scientific and reasonable assessment models to determine the vulnerability.
The vulnerability assessment of intensity loss (rate)—mainly through post-disaster investigation, experimental simulation, and other methods—builds the relationship between the intensity parameters of different disaster-causing factors and the losses, and is usually expressed as a table or curve [48,49]. It is a widely used vulnerability quantitative research method. The assessment results are more accurate than those of indicator methods, but they only represent the measurement of the vulnerability of absolute physical quantities, ignoring a societal assessment of economic and environmental vulnerability as well as regional disaster response, prevention, and mitigation capabilities. Multivariate vulnerability curves have been completed by The United Nations Development Programme (UNDP) taking different social vulnerability factors into account, including urbanization rate, social development index, GDP, and so on [50]. The vulnerability of disaster-affected bodies can be divided into population, social economy, residential buildings, agricultural economic land, and public infrastructure. This paper only studies the population suffering from drought and drinking water difficulties, which can be improved to study the multiple factors as much as possible on the basis of available data.
Mortality-related risks and economic risk resulting from six categories of natural hazards are considered in the Hotspots index. Its designers analyzed the vulnerability by calculating the loss rates for each hazard from historical records from 1981 to 2000 acquired from the Emergency Events Database [51]. A weak point of the Hotspots index is that the vulnerability curves of economic losses and mortality at a national level are fitted in this project, which causes inadequate accuracy with respect to the evaluation result for states or counties with large area and prominent environmental differences. What we have improved is that our results provide a scientific basis for national and local governments to take effective measures by showing spatial differences at a smaller scale—the regional scale.
The vulnerability results obtained via quantitative assessment methods usually represent the quantitative relationship, and the results are often of physical significance. Quantitative evaluation methods include statistical fitting, machine learning, and model simulation. On the basis of field investigation, expert experience, statistical analysis, computer simulation, and other technical means further improve the accuracy of the evaluation model. For a single disaster, the result is usually a vulnerability curve; when two disaster-causing factors act on the same disaster-affected body, a three-dimensional vulnerability surface can be drawn. The horizontal axes (x-axis and y-axis) of the vulnerability surface are the intensities of two different disaster-causing factors, and the vertical axis (z-axis) represents the damage level or damage percentage of the disaster-affected body. Using the vulnerability matrix, the vulnerability surface transforms the discrete and discontinuous relationship into a continuous relationship through computer fitting. In the future, multi-hazard vulnerability surfaces could be further studied based on machine learning algorithms.
5. Conclusions
Vulnerability is characterized by increasing the sensitivity of individuals, communities, assets, or systems to hazardous impacts. On the basis of collecting historical disaster data from 52 drought events in China from 2009 to 2013, this study constructs the vulnerability curves of typical drought regions in China, and systematically compares the regional applicability of different drought indexes. The key conclusions of this paper are as follows:
- (1)
- In general, Most NDVI and TVDI variance ratios are concentrated between 0 and ~0.15, and most EVI variance ratios are concentrated between 0.15 and ~0.6.
- (2)
- In terms of the degree of loss, most values are in the range 0 ~ 0.3, with a cumulative proportion of about 90.19%.
- (3)
- The drought vulnerability curve conforms to the distribution rule of the logistic curve. It can be found that the AP region is always a high-risk area with high vulnerability, which should be the focus of drought risk prevention and reduction.
Author Contributions
Conceptualization, F.C. and L.W.; methodology, F.C. and E.D.; validation, L.W.; formal analysis, L.W. and H.J.; writing—original draft preparation, E.D. and H.J.; writing—review and editing, F.C., L.W., H.J. and E.D.; supervision, L.W.; funding acquisition, L.W. and H.J. All authors have read and agreed to the published version of the manuscript.
Funding
This research was funded by the Strategic Priority Research Program of the Chinese Academy of Sciences (XDA19030101) and the National Natural Science Foundation of China (42171078).
Acknowledgments
The authors would like to thank the editors and the three anonymous reviewers for their constructive comments and advice.
Conflicts of Interest
The authors declare no conflict of interest.
References
- Council, A.M.S. Policy statement: Meteorological drought. Bull. Am. Meteorol. Soc. 1997, 78, 847–849. [Google Scholar]
- Jehanzaib, M.; Shah, S.A.; Kim, J.E.; Kim, T.-W. Exploring spatio-temporal variation of drought characteristics and propagation under climate change using multi-model ensemble projections. Nat. Hazards 2022, 1–21. [Google Scholar] [CrossRef]
- Zhou, K.; Wang, Y.; Chang, J.; Zhou, S.; Guo, A. Spatial and temporal evolution of drought characteristics across the Yellow River basin. Ecol. Indic. 2021, 131, 108207. [Google Scholar] [CrossRef]
- Hatfield, J.L.; Prueger, J.H. Value of Using Different Vegetative Indices to Quantify Agricultural Crop Characteristics at Different Growth Stages under Varying Management Practices. Remote Sens. 2010, 2, 562–578. [Google Scholar] [CrossRef]
- Rojas, O.; Vrieling, A.; Rembold, F. Assessing drought probability for agricultural areas in Africa with coarse resolution remote sensing imagery. Remote Sens. Environ. 2011, 115, 343–352. [Google Scholar] [CrossRef]
- Abbas, S.; Nichol, J.E.; Qamer, F.M.; Xu, J. Characterization of Drought Development through Remote Sensing: A Case Study in Central Yunnan, China. Remote Sens. 2014, 6, 4998–5018. [Google Scholar] [CrossRef]
- Guo, H.; Bao, A.; Ndayisaba, F.; Liu, T.; Jiapaer, G.; El-Tantawi, A.M.; De Maeyer, P. Space-time characterization of drought events and their impacts on vegetation in Central Asia. J. Hydrol. 2018, 564, 1165–1178. [Google Scholar] [CrossRef]
- Ye, M.; Qian, Z.H.; Wu, Y.P. Spatiotemporal evolution of the droughts and floods over China. Acta Phys. Sin. 2013, 62, 139203. [Google Scholar]
- Jia, H.; Chen, F.; Zhang, J.; Du, E. Vulnerability Analysis to Drought Based on Remote Sensing Indexes. Int. J. Environ. Res. Public Health 2020, 17, 7660. [Google Scholar] [CrossRef]
- Botterill, L.C.; Hayes, M.J. Drought triggers and declarations: Science and policy considerations for drought risk management. Nat. Hazards 2012, 64, 139–151. [Google Scholar] [CrossRef]
- Chen, F.; Wang, N.; Yu, B.; Wang, L. Res2-Unet, a new deep architecture for building detection from high spatial resolution images. IEEE J. Sel. Top. Appl. Earth Obs. Remote Sens. 2022, 15, 1494–1501. [Google Scholar] [CrossRef]
- Jia, H.; Chen, F.; Zhang, C.; Dong, J.; Du, E.; Wang, L. High emissions could increase the future risk of maize drought in China by 60–70%. Sci. Total Environ. 2022, 852, 158474. [Google Scholar] [CrossRef]
- Carlson, T.N.; Gillies, R.R.; Perry, E.M. A method to make use of thermal infrared temperature and NDVI measurements to infer surface soil water content and fractional vegetation cover. Remote Sens. Rev. 1994, 9, 161–173. [Google Scholar] [CrossRef]
- Sandholt, I.; Rasmussen, K.; Andersen, J. A simple interpretation of the surface temperature/vegetation index space for assessment of surface moisture status. Remote Sens. Environ. 2002, 79, 213–224. [Google Scholar] [CrossRef]
- Karnieli, A.; Agam, N.; Pinker, R.T.; Anderson, M.; Imhoff, M.L.; Gutman, G.G.; Panov, N.; Goldberg, A. Use of NDVI and Land Surface Temperature for Drought Assessment: Merits and Limitations. J. Clim. 2010, 23, 618–633. [Google Scholar] [CrossRef]
- Li, H.; Li, Z.; Chen, Y.; Liu, Y.; Hu, Y.; Sun, F.; Kayumba, P.M. Projected Meteorological Drought over Asian Drylands under Different CMIP6 Scenarios. Remote Sens. 2021, 13, 4409. [Google Scholar] [CrossRef]
- Singh, B.; Singh, D. Agronomic and physiological responses of sorghum, maize and pearl millet to irrigation. Field Crop. Res. 1995, 42, 57–67. [Google Scholar] [CrossRef]
- Chen, F.; Zhang, M.; Guo, H.; Allen, S.; Kargel, J.S.; Haritashya, U.K.; Watson, C.S. Annual 30 m dataset for glacial lakes in High Mountain Asia from 2008 to 2017. Earth Syst. Sci. Data 2021, 13, 741–766. [Google Scholar] [CrossRef]
- Shi, Y. The vulnerability research progress of natural disasters. J. Nat. Disasters 2011, 20, 131–137. [Google Scholar]
- Turner, B.L., II; Kasperson, R.E.; Matson, P.A.; McCarthy, J.J.; Corell, R.W.; Christensen, L.; Eckley, N.; Kasperson, J.X.; Luers, A.; Martello, M.L.; et al. A framework for vulnerability analysis in sustainability science. Proc. Natl. Acad. Sci. USA 2003, 100, 8074–8079. [Google Scholar] [CrossRef]
- Wei, Y.-M.; Fan, Y.; Lu, C.; Tsai, H.-T. The assessment of vulnerability to natural disasters in China by using the DEA method. Environ. Impact Assess. Rev. 2004, 24, 427–439. [Google Scholar] [CrossRef]
- Tschakert, P. Views from the vulnerable: Understanding climatic and other stressors in the Sahel. Glob. Environ. Chang. 2007, 17, 381–396. [Google Scholar] [CrossRef]
- Jia, H.; Chen, F.; Pan, D.; Du, E.; Wang, L.; Wang, N.; Yang, A. Flood risk management in the Yangtze River basin —Comparison of 1998 and 2020 events. Int. J. Disaster Risk Reduct. 2022, 68, 102724. [Google Scholar] [CrossRef]
- Zhou, L.; Wu, J.; Mo, X.; Zhou, H.; Diao, C.; Wang, Q.; Chen, Y.; Zhang, F. Quantitative and detailed spatiotemporal patterns of drought in China during 2001–2013. Sci. Total Environ. 2017, 589, 136–145. [Google Scholar] [CrossRef] [PubMed]
- AghaKouchak, A.; Farahmand, A.; Melton, F.S.; Teixeira, J.; Anderson, M.C.; Wardlow, B.D.; Hain, C.R. Remote sensing of drought: Progress, challenges and opportunities. Rev. Geophys. 2015, 53, 452–480. [Google Scholar] [CrossRef]
- Dutta, D.; Herath, S.; Musiake, K. A mathematical model for flood loss estimation. J. Hydrol. 2003, 277, 24–49. [Google Scholar] [CrossRef]
- Merz, B.; Kreibich, H.; Thieken, A.; Schmidtke, R. Estimation uncertainty of direct monetary flood damage to buildings. Nat. Hazards Earth Syst. Sci. 2004, 4, 153–163. [Google Scholar] [CrossRef]
- Colombi, M.; Borzi, B.; Crowley, H.; Onida, M.; Meroni, F.; Pinho, R. Deriving vulnerability curves using Italian earthquake damage data. Bull. Earthq. Eng. 2008, 6, 485–504. [Google Scholar] [CrossRef]
- Fuchs, S. Susceptibility versus resilience to mountain hazards in Austria—Paradigms of vulnerability revisited. Nat. Hazards Earth Syst. Sci. 2009, 9, 337–352. [Google Scholar] [CrossRef]
- Wilhelmi, O.V.; Wilhite, D.A. Assessing Vulnerability to Agricultural Drought: A Nebraska Case Study. Nat. Hazards 2002, 25, 37–58. [Google Scholar] [CrossRef]
- Yu, B.; Xu, C.; Chen, F.; Wang, N.; Wang, L. HADeenNet: A hierarchical-attention multi-scale deconvolution network for landslide detection. Int. J. Appl. Earth Obs. Geoinf. 2022, 111, 102853. [Google Scholar] [CrossRef]
- Pan, D.H.; Yuan, Y.; Jia, H.C. Rapid assessment of population in drinking water access difficulties because of drought in different regions of China. J. Catastrophology 2014, 29, 34–39. [Google Scholar]
- Wei, Z.; Paredes, P.; Liu, Y.; Chi, W.W.; Pereira, L.S. Modelling transpiration, soil evaporation and yield prediction of soybean in North China Plain. Agric. Water Manag. 2015, 147, 43–53. [Google Scholar] [CrossRef]
- Yan, H.S.; Wan, Y.X.; Yan, X.D.; Xie, Y.R. A study of the temporal and spatial features of dryness & wetness last 500-year period in China. J. Yunnan Univ. 2004, 26, 139–143. [Google Scholar]
- Li, Q.Z.; Yan, N.N.; Zhang, F.F.; Chang, S.; Wu, B. Drought monitoring and its impacts assessment in Southwest China using remote sensing in the Spring of 2010. Acta Geogr. Sin. 2010, 65, 771–780. [Google Scholar]
- Wang, H.; Lin, H.; Liu, D. Remotely sensed drought index and its responses to meteorological drought in Southwest China. Remote Sens. Lett. 2014, 5, 413–422. [Google Scholar] [CrossRef]
- Mu, L.L.; Wu, B.F.; Yan, N.N. Validation of agricultural drought indices and their uncertainty analysis. Bull. Soil Water Conserv. 2007, 27, 119–122. [Google Scholar]
- Salmoral, G.; Rey, D.; Rudd, A.; Margon, P.; Holman, I. A Probabilistic Risk Assessment of the National Economic Impacts of Regulatory Drought Management on Irrigated Agriculture. Earth’s Future 2019, 7, 178–196. [Google Scholar] [CrossRef]
- Yu, B.; Yang, A.; Chen, F.; Wang, N.; Wang, L. SNNFD, spiking neural segmentation network in frequency domain using high spatial resolution images for building extraction. Int. J. Appl. Earth Obs. Geoinf. 2022, 112, 102930. [Google Scholar] [CrossRef]
- Wang, Y.J.; Yan, F. Application of thermal inertia model in high vegetation coverage area for drought monitoring. Arid Land Geogr. 2014, 37, 539–547. [Google Scholar]
- Moran, M.; Clarke, T.; Inoue, Y.; Vidal, A. Estimating crop water deficit using the relation between surface-air temperature and spectral vegetation index. Remote Sens. Environ. 1994, 49, 246–263. [Google Scholar] [CrossRef]
- Kogan, F.N. Global drought and flood-watch from NOAA polar-orbitting satellites. Adv. Space Res. 1998, 21, 477–480. [Google Scholar] [CrossRef]
- Wan, Z.; Wang, P.; Li, X. Using MODIS Land Surface Temperature and Normalized Difference Vegetation Index products for monitoring drought in the southern Great Plains, USA. Int. J. Remote Sens. 2004, 25, 61–72. [Google Scholar] [CrossRef]
- Tang, F.; Wang, L.; Guo, Y.Q.; Fu, M.C.; Huang, N.; Duan, W.S.; Luo, M.; Zhang, J.J.; Li, W.; Song, W.J. Spatio-temporal variation and coupling coordination relationship between urbanisation and habitat quality in the Grand Canal, China. Land Use Policy 2022, 117, 106119. [Google Scholar] [CrossRef]
- Wang, P.X.; Gong, J.Y.; Li, X.W. Vegetation-temperature condition index and its application for drought monitoring. Geomat. Inf. Sci. Wuhan Univ. 2001, 26, 412–418. [Google Scholar]
- Menenti, M.; Jia, L. Observing the response of the land surface to climate variability by time series analysis of satellite observations. J. Remote Sens. 2016, 20, 946–957. [Google Scholar]
- Jia, H.; Wang, J.; Cao, C.; Pan, D.; Shi, P. Maize drought disaster risk assessment of China based on EPIC model. Int. J. Digit. Earth 2012, 5, 488–515. [Google Scholar] [CrossRef]
- Zhang, M.; Chen, F.; Guo, H.; Yi, L.; Zeng, J.; Li, B. Glacial Lake Area Changes in High Mountain Asia during 1990–2020 Using Satellite Remote Sensing. Research 2022, 2022, 9821275. [Google Scholar] [CrossRef]
- Juha, I.U. The geography of disaster vulnerability in megacities—A theoretical framework. Appl. Geogr. 1998, 1, 7–16. [Google Scholar]
- United Nations Development Programme (UNDP). A Global Report: Reducing Disaster Risk: A Challenge for Development; UNDP, Bureau for Crisis Prevention and Recovery: New York, NY, USA, 2004; pp. 1–161. [Google Scholar]
- Dilley, M.; Deichmann, U.; Chen, R.S. Natural Disaster Hotspots: A Global Risk Analysis; World Bank Publications: Washington, DC, USA, 2005; pp. 1–12. [Google Scholar]
Disclaimer/Publisher’s Note: The statements, opinions and data contained in all publications are solely those of the individual author(s) and contributor(s) and not of MDPI and/or the editor(s). MDPI and/or the editor(s) disclaim responsibility for any injury to people or property resulting from any ideas, methods, instructions or products referred to in the content. |
© 2023 by the authors. Licensee MDPI, Basel, Switzerland. This article is an open access article distributed under the terms and conditions of the Creative Commons Attribution (CC BY) license (https://creativecommons.org/licenses/by/4.0/).