

A Modified 2-D Notch Filter Based on Image Segmentation for RFI Mitigation in Synthetic Aperture Radar


Abstract
:1. Introduction
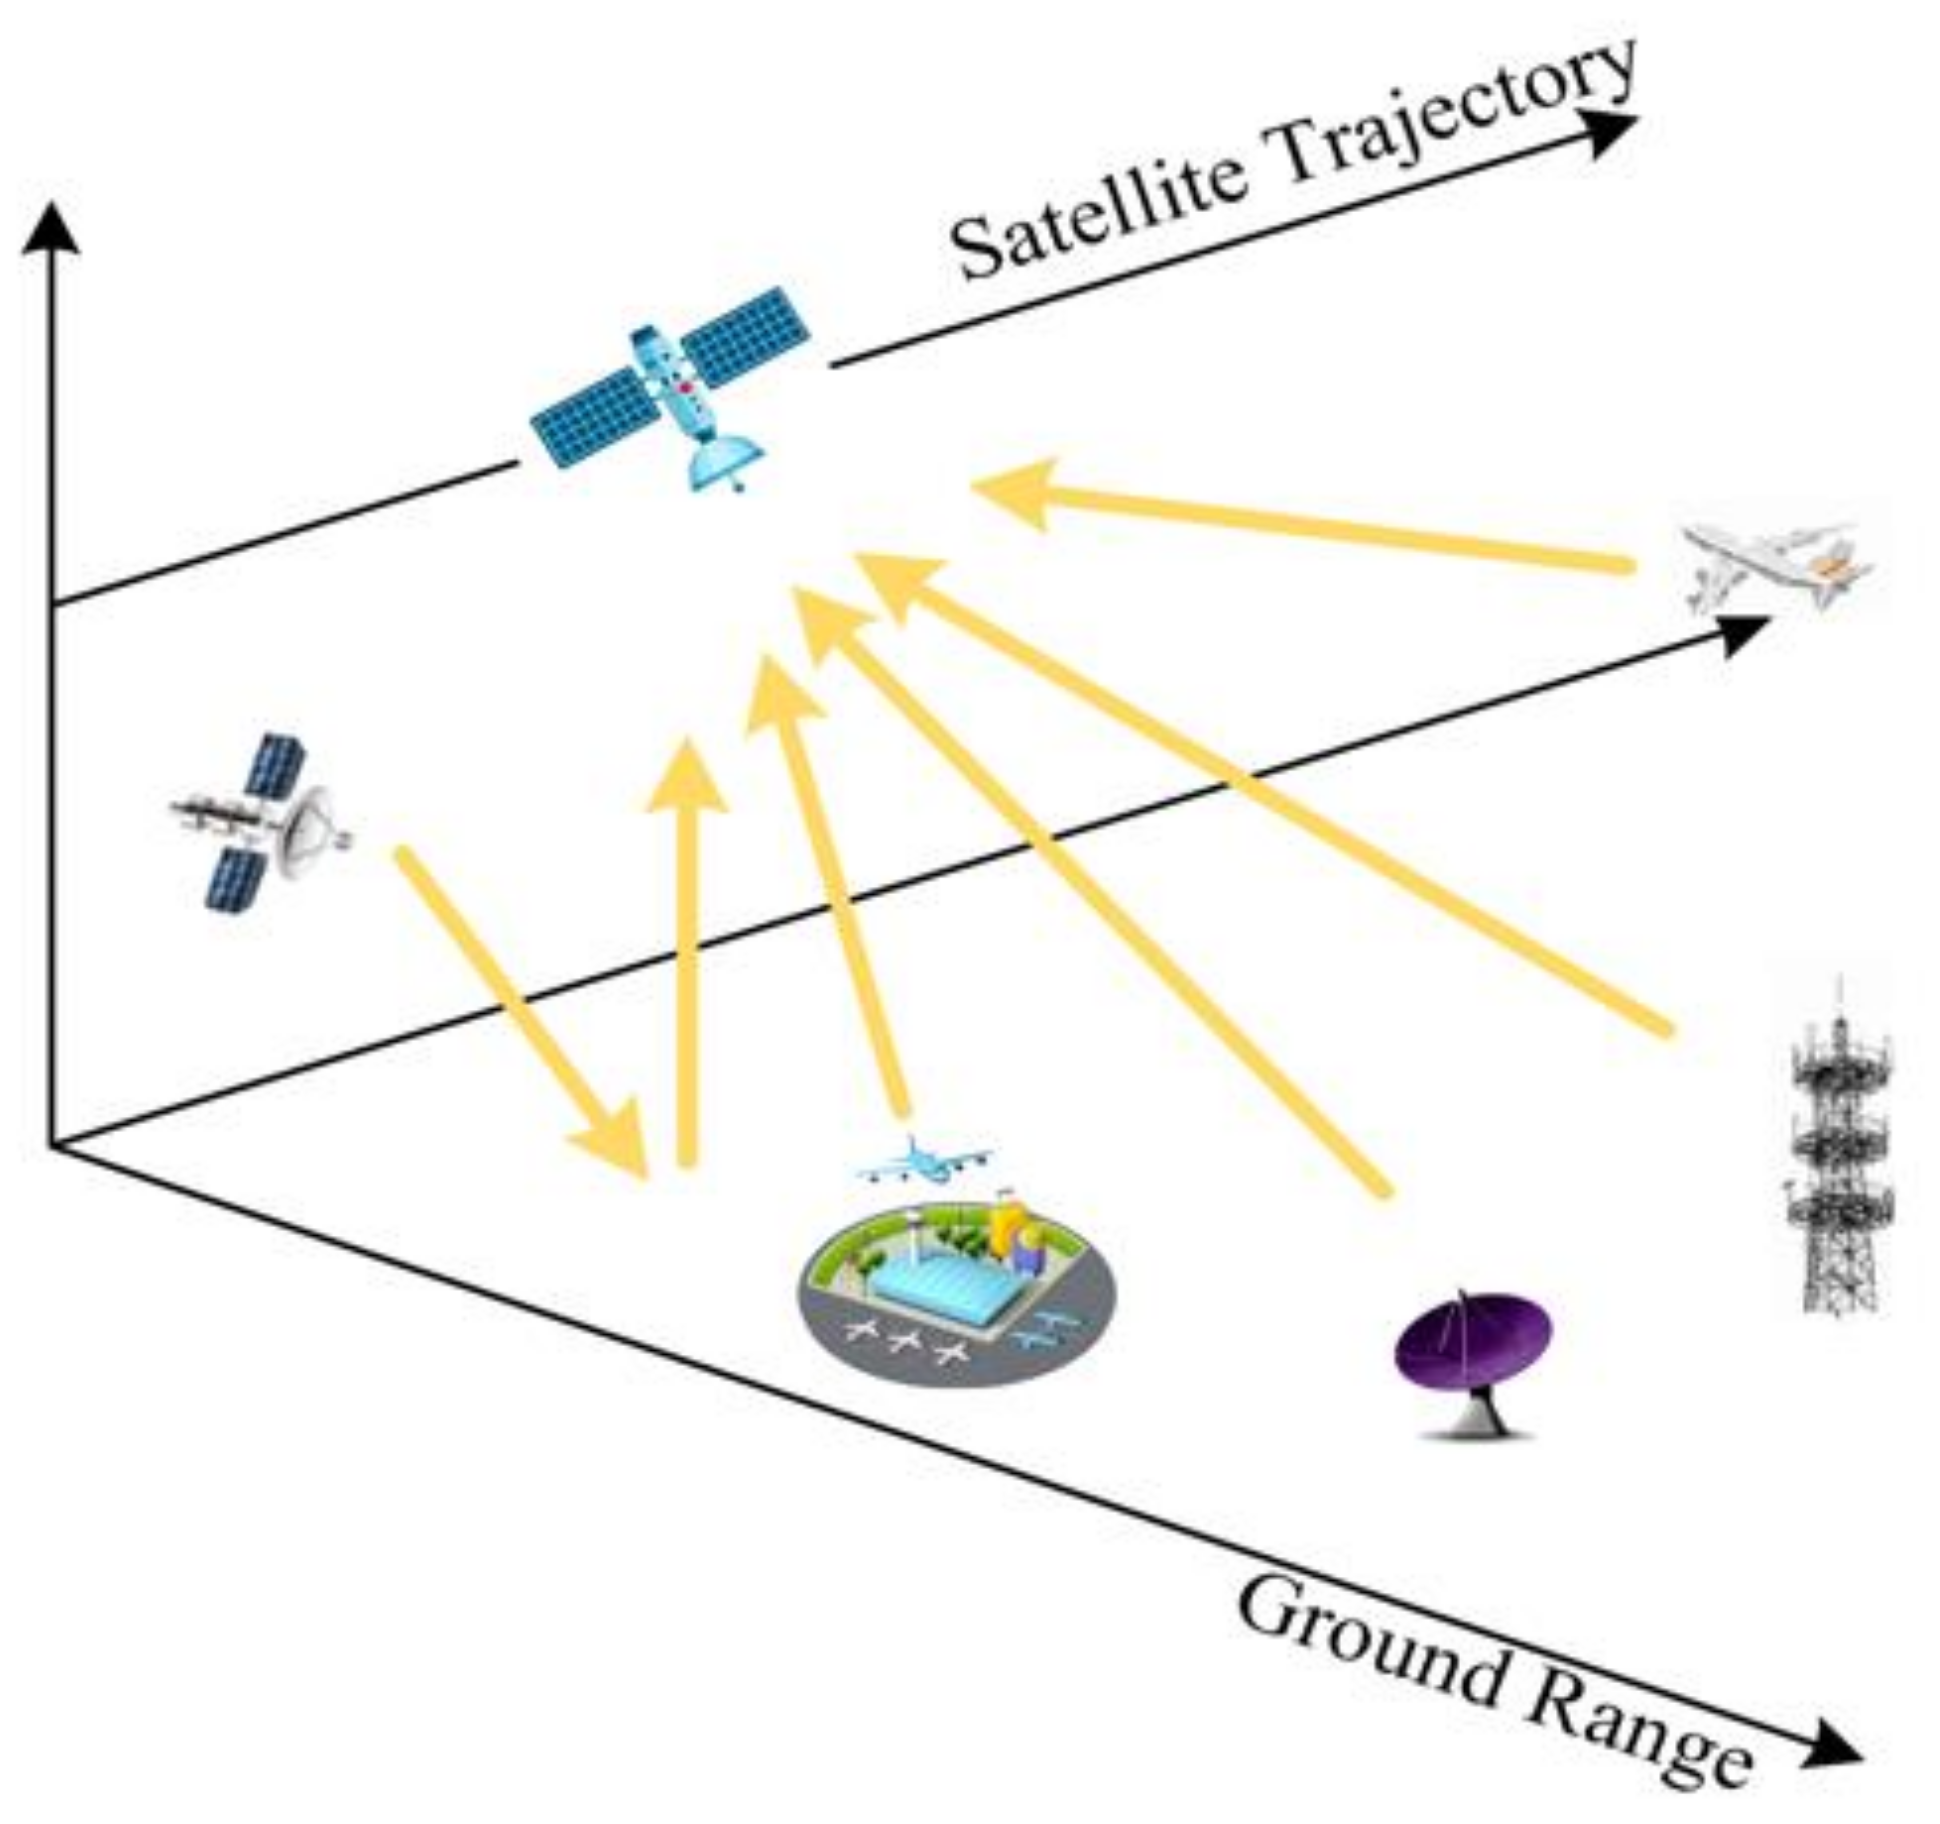
1.1. Background
1.2. Previous Work of Notch Method
1.3. Main Contributions of This Paper
- The method proposed combines the image segmentation technology with RFI mitigation to accurately extract the contour of the useful signals with interference, which is more conducive to protecting the useful signals without interference.
- The GSVT-based LRSD model was performed to further extract the useful signals contained in the RFI signals. The proposed method effectively improves the protection ability of the useful signals compared with the traditional notch filtering method.
- The superiority of the proposed method was verified by simulation experiments and measured data experiments. The proposed method can effectively mitigate RFI and protect the useful signals, whether there are RFI with a single source or multiple sources.
2. Model and Related Work
2.1. Signal Model of RFI
2.2. Theory of FNF
2.3. Low-Rank Characteristics of RFI
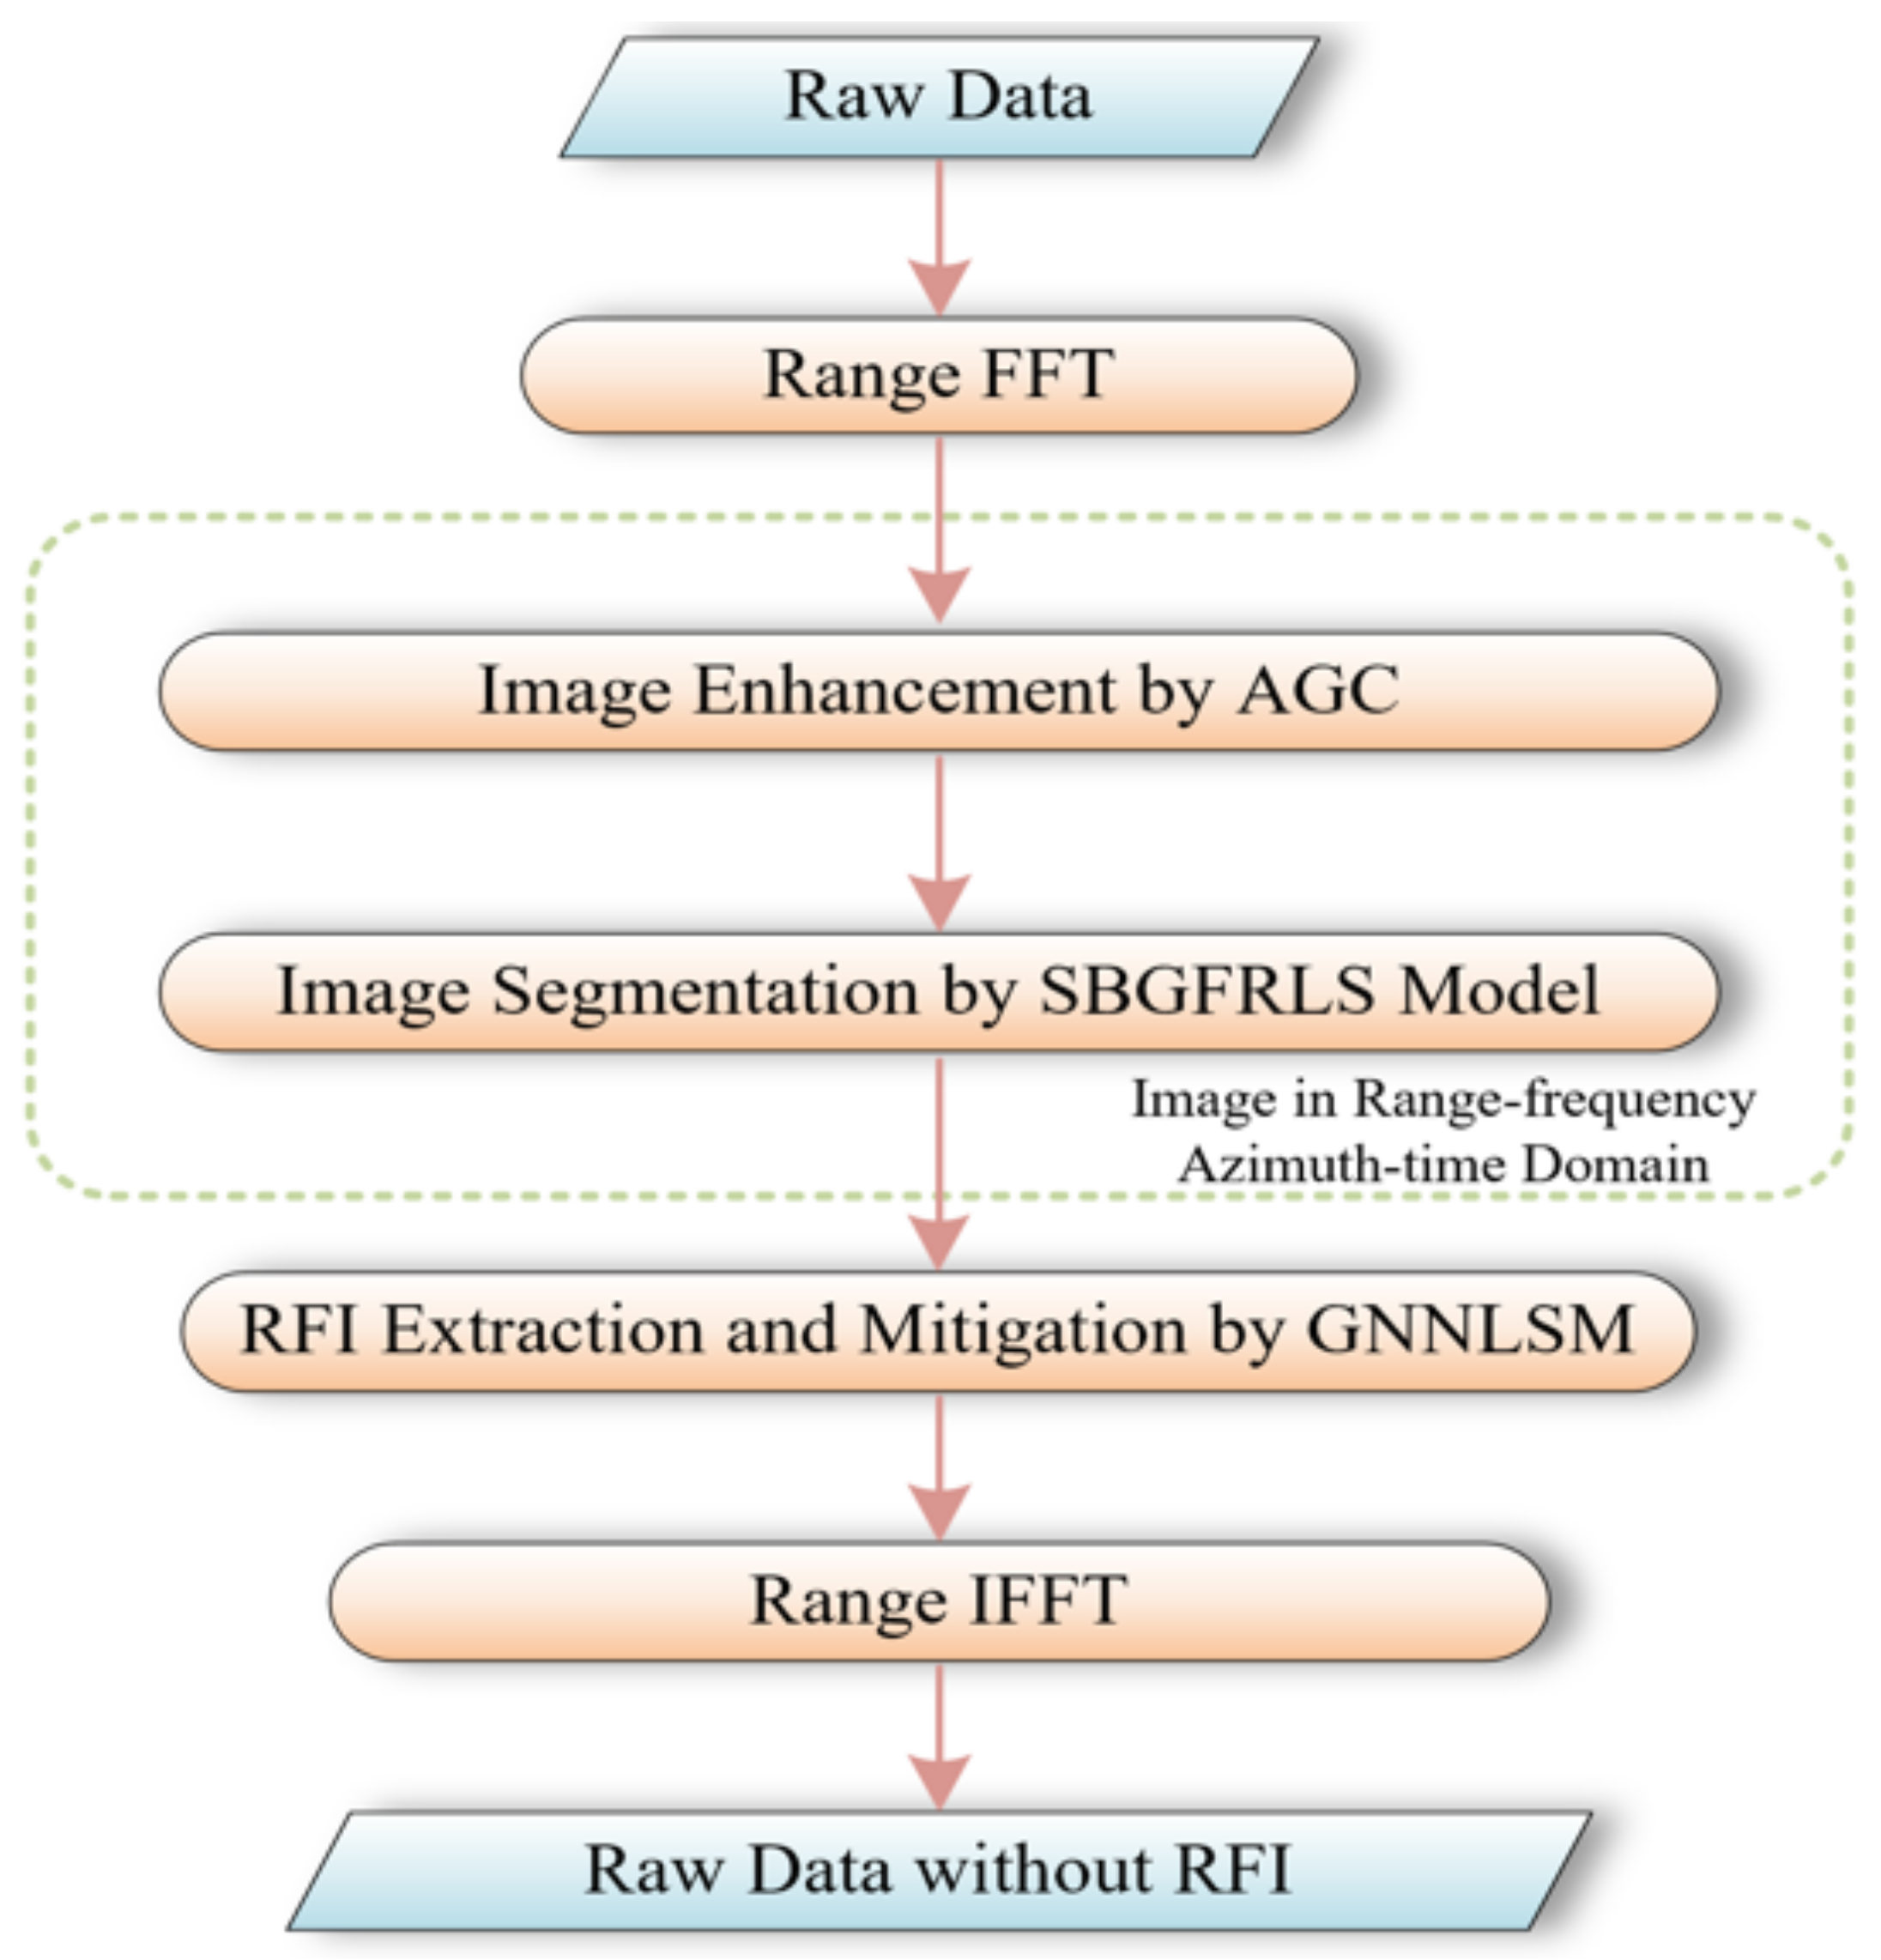
3. Methodology
3.1. Image Enhancement by AGC
3.2. Image Segmentation by the SBGFRLS Model
3.3. RFI Extraction by GSVT
| Algorithm 1. A Modified 2-D Notch Filter Based on Image Segmentation |
| Input: |
| Initialization: , , , , the starting point , , , and the iteration index |
| Enhancement and Segmentation in Image |
| Update L: Update S: Update Y: |
| Update : |
| Terminate or set: and returen to Update L. |
| Extraction of RFI: |
| Restore the useful signals: |
| Output: |
4. Experimental Results
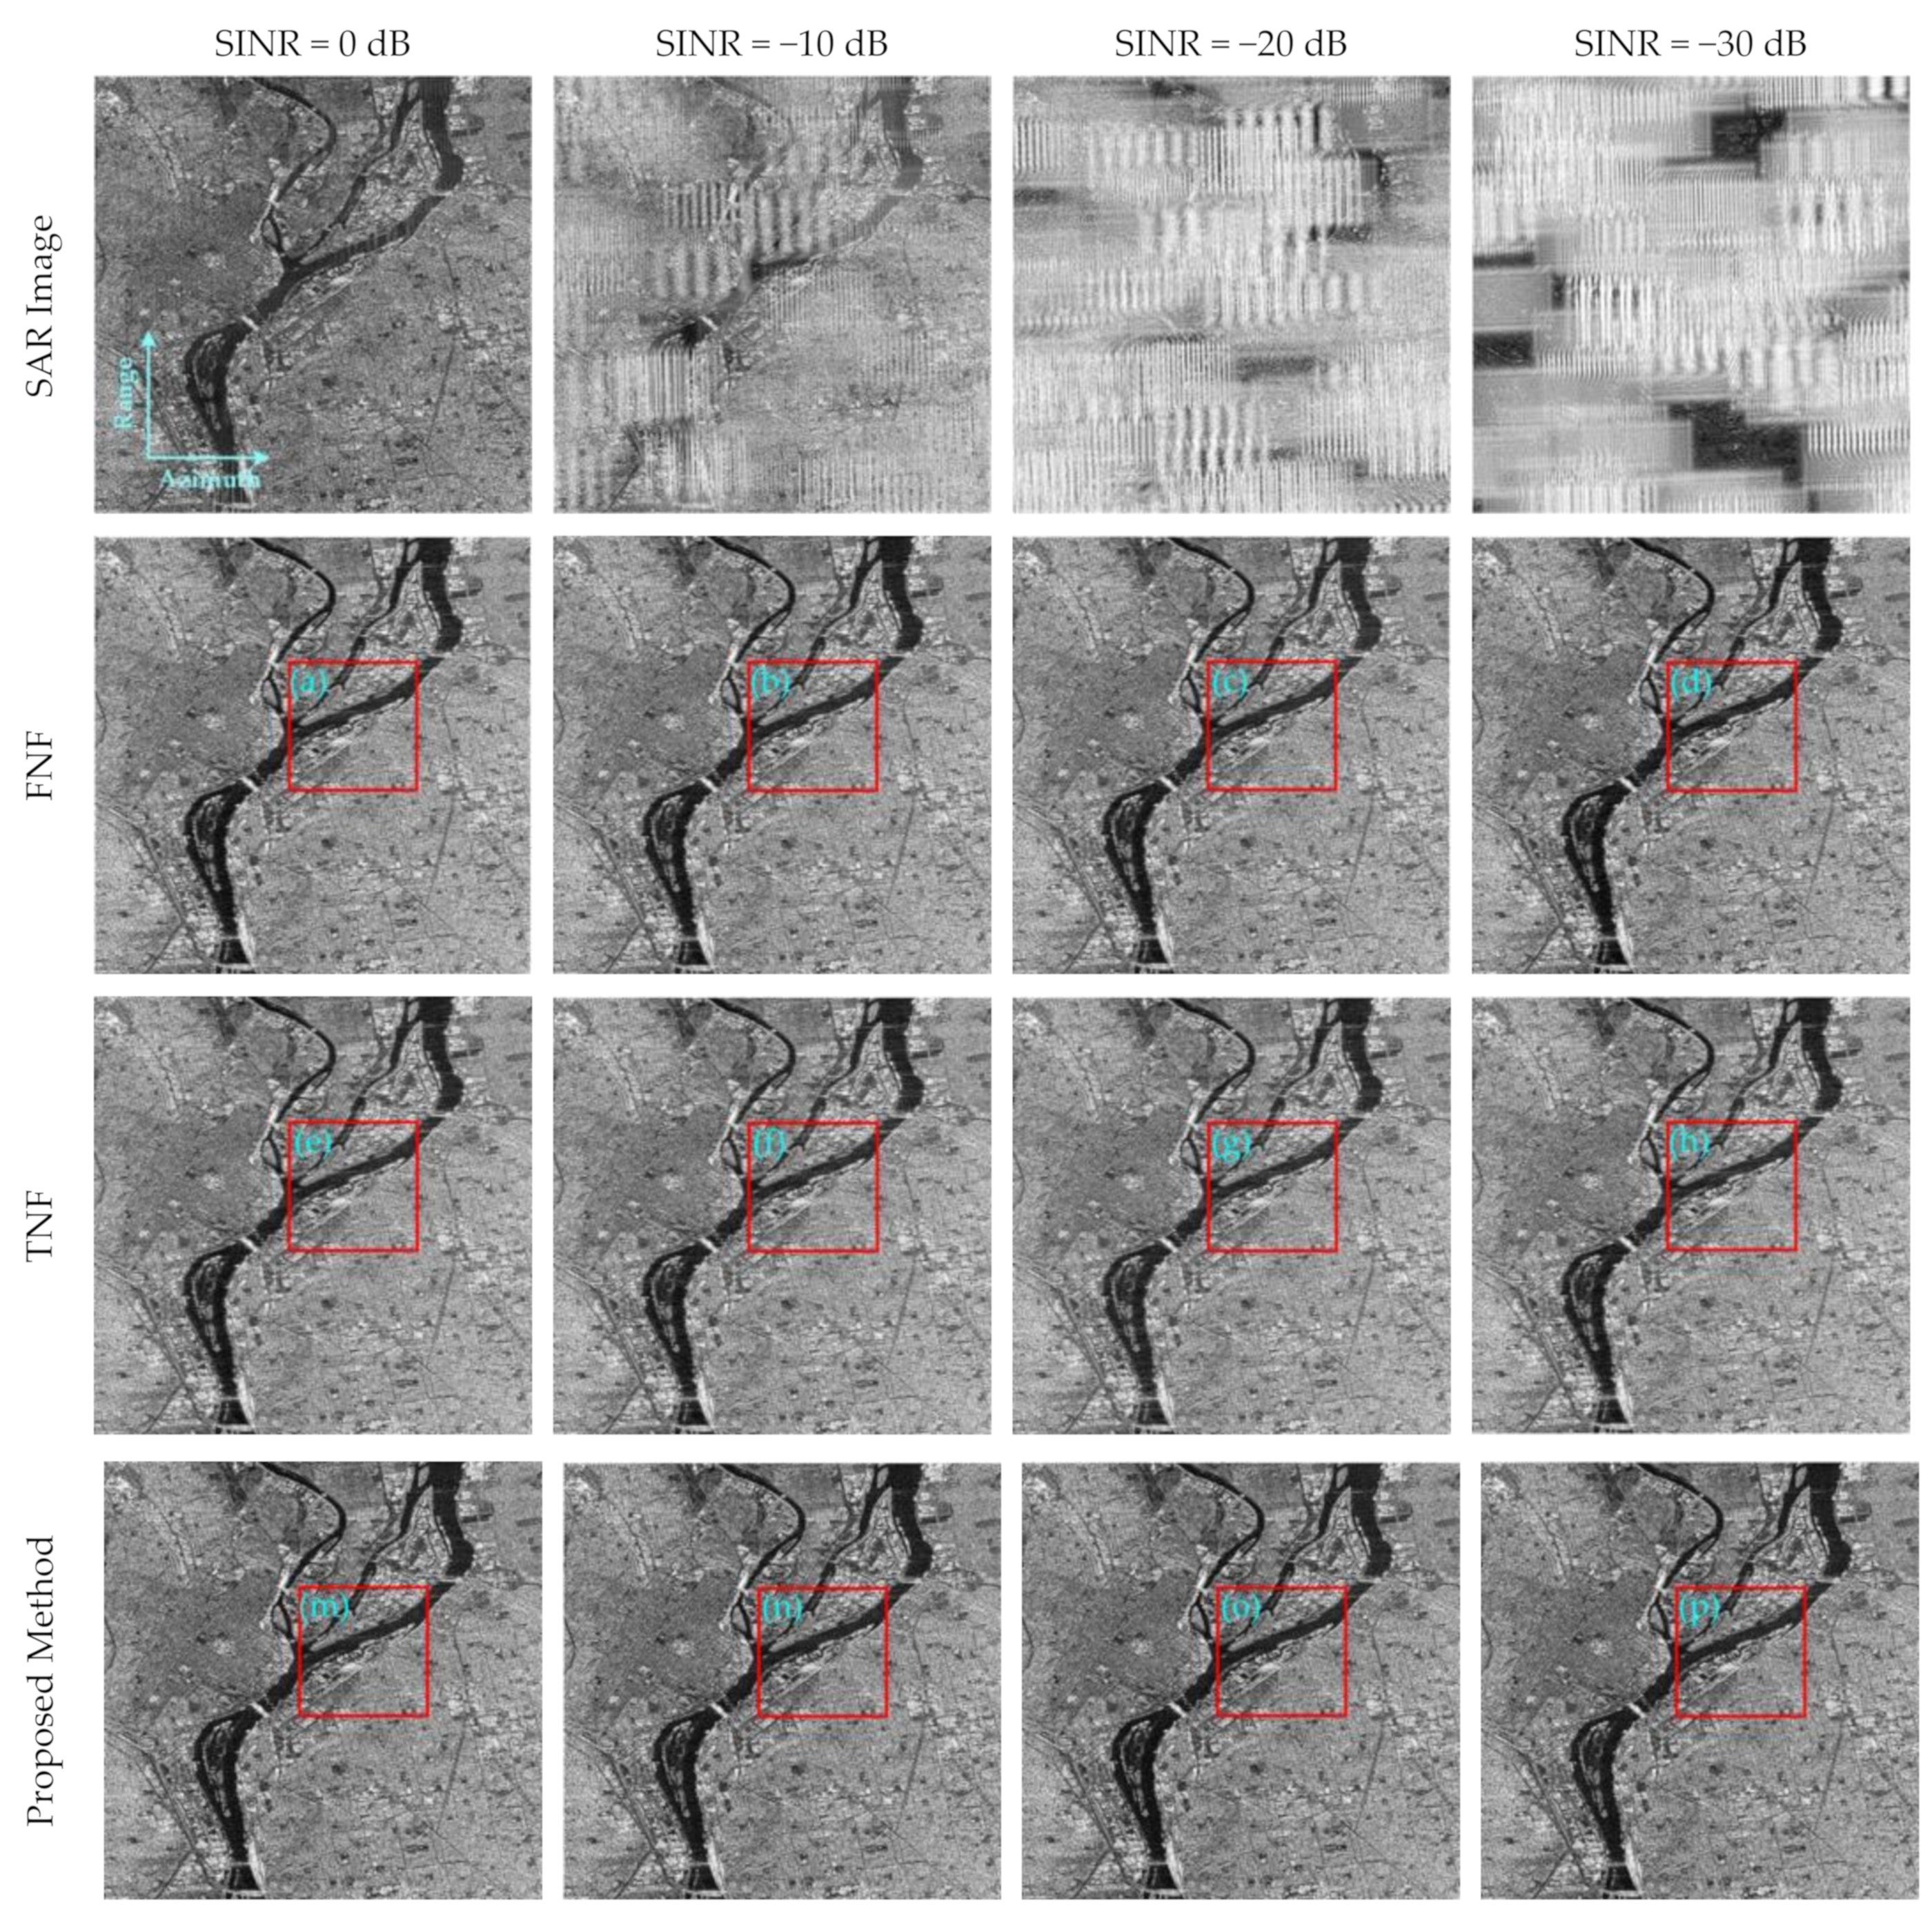
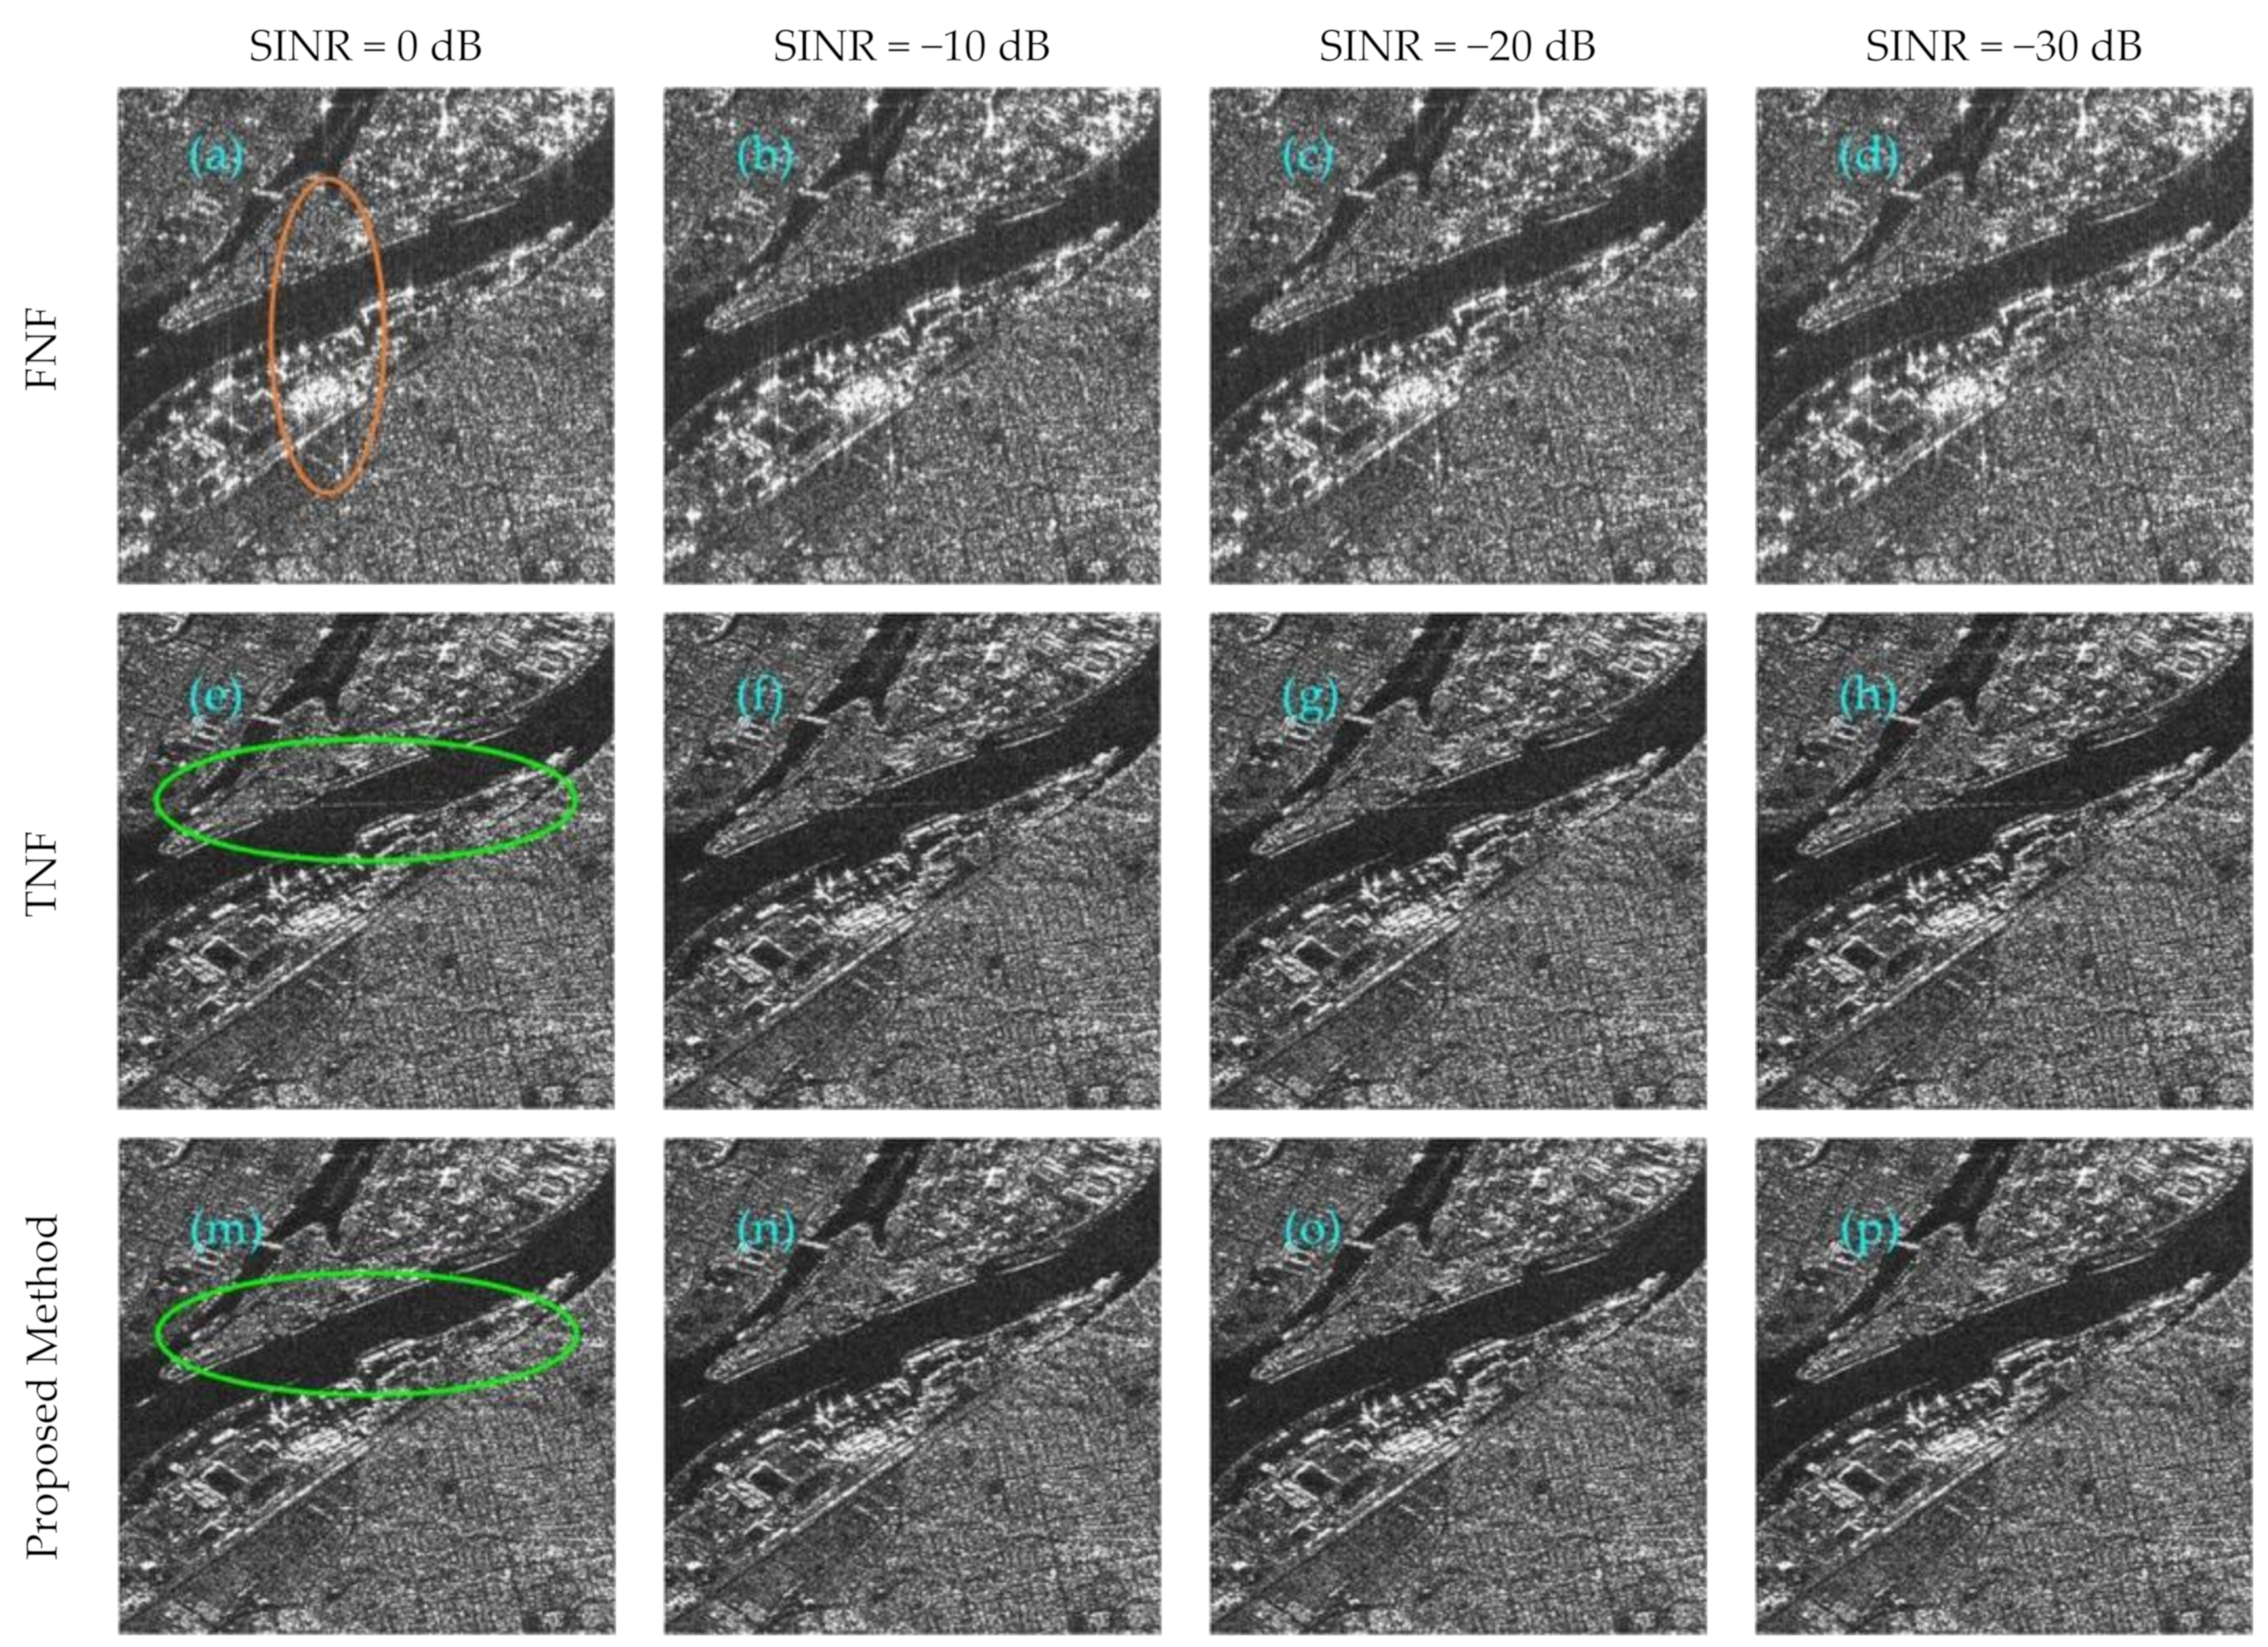
4.1. Experimental Results of Simulation
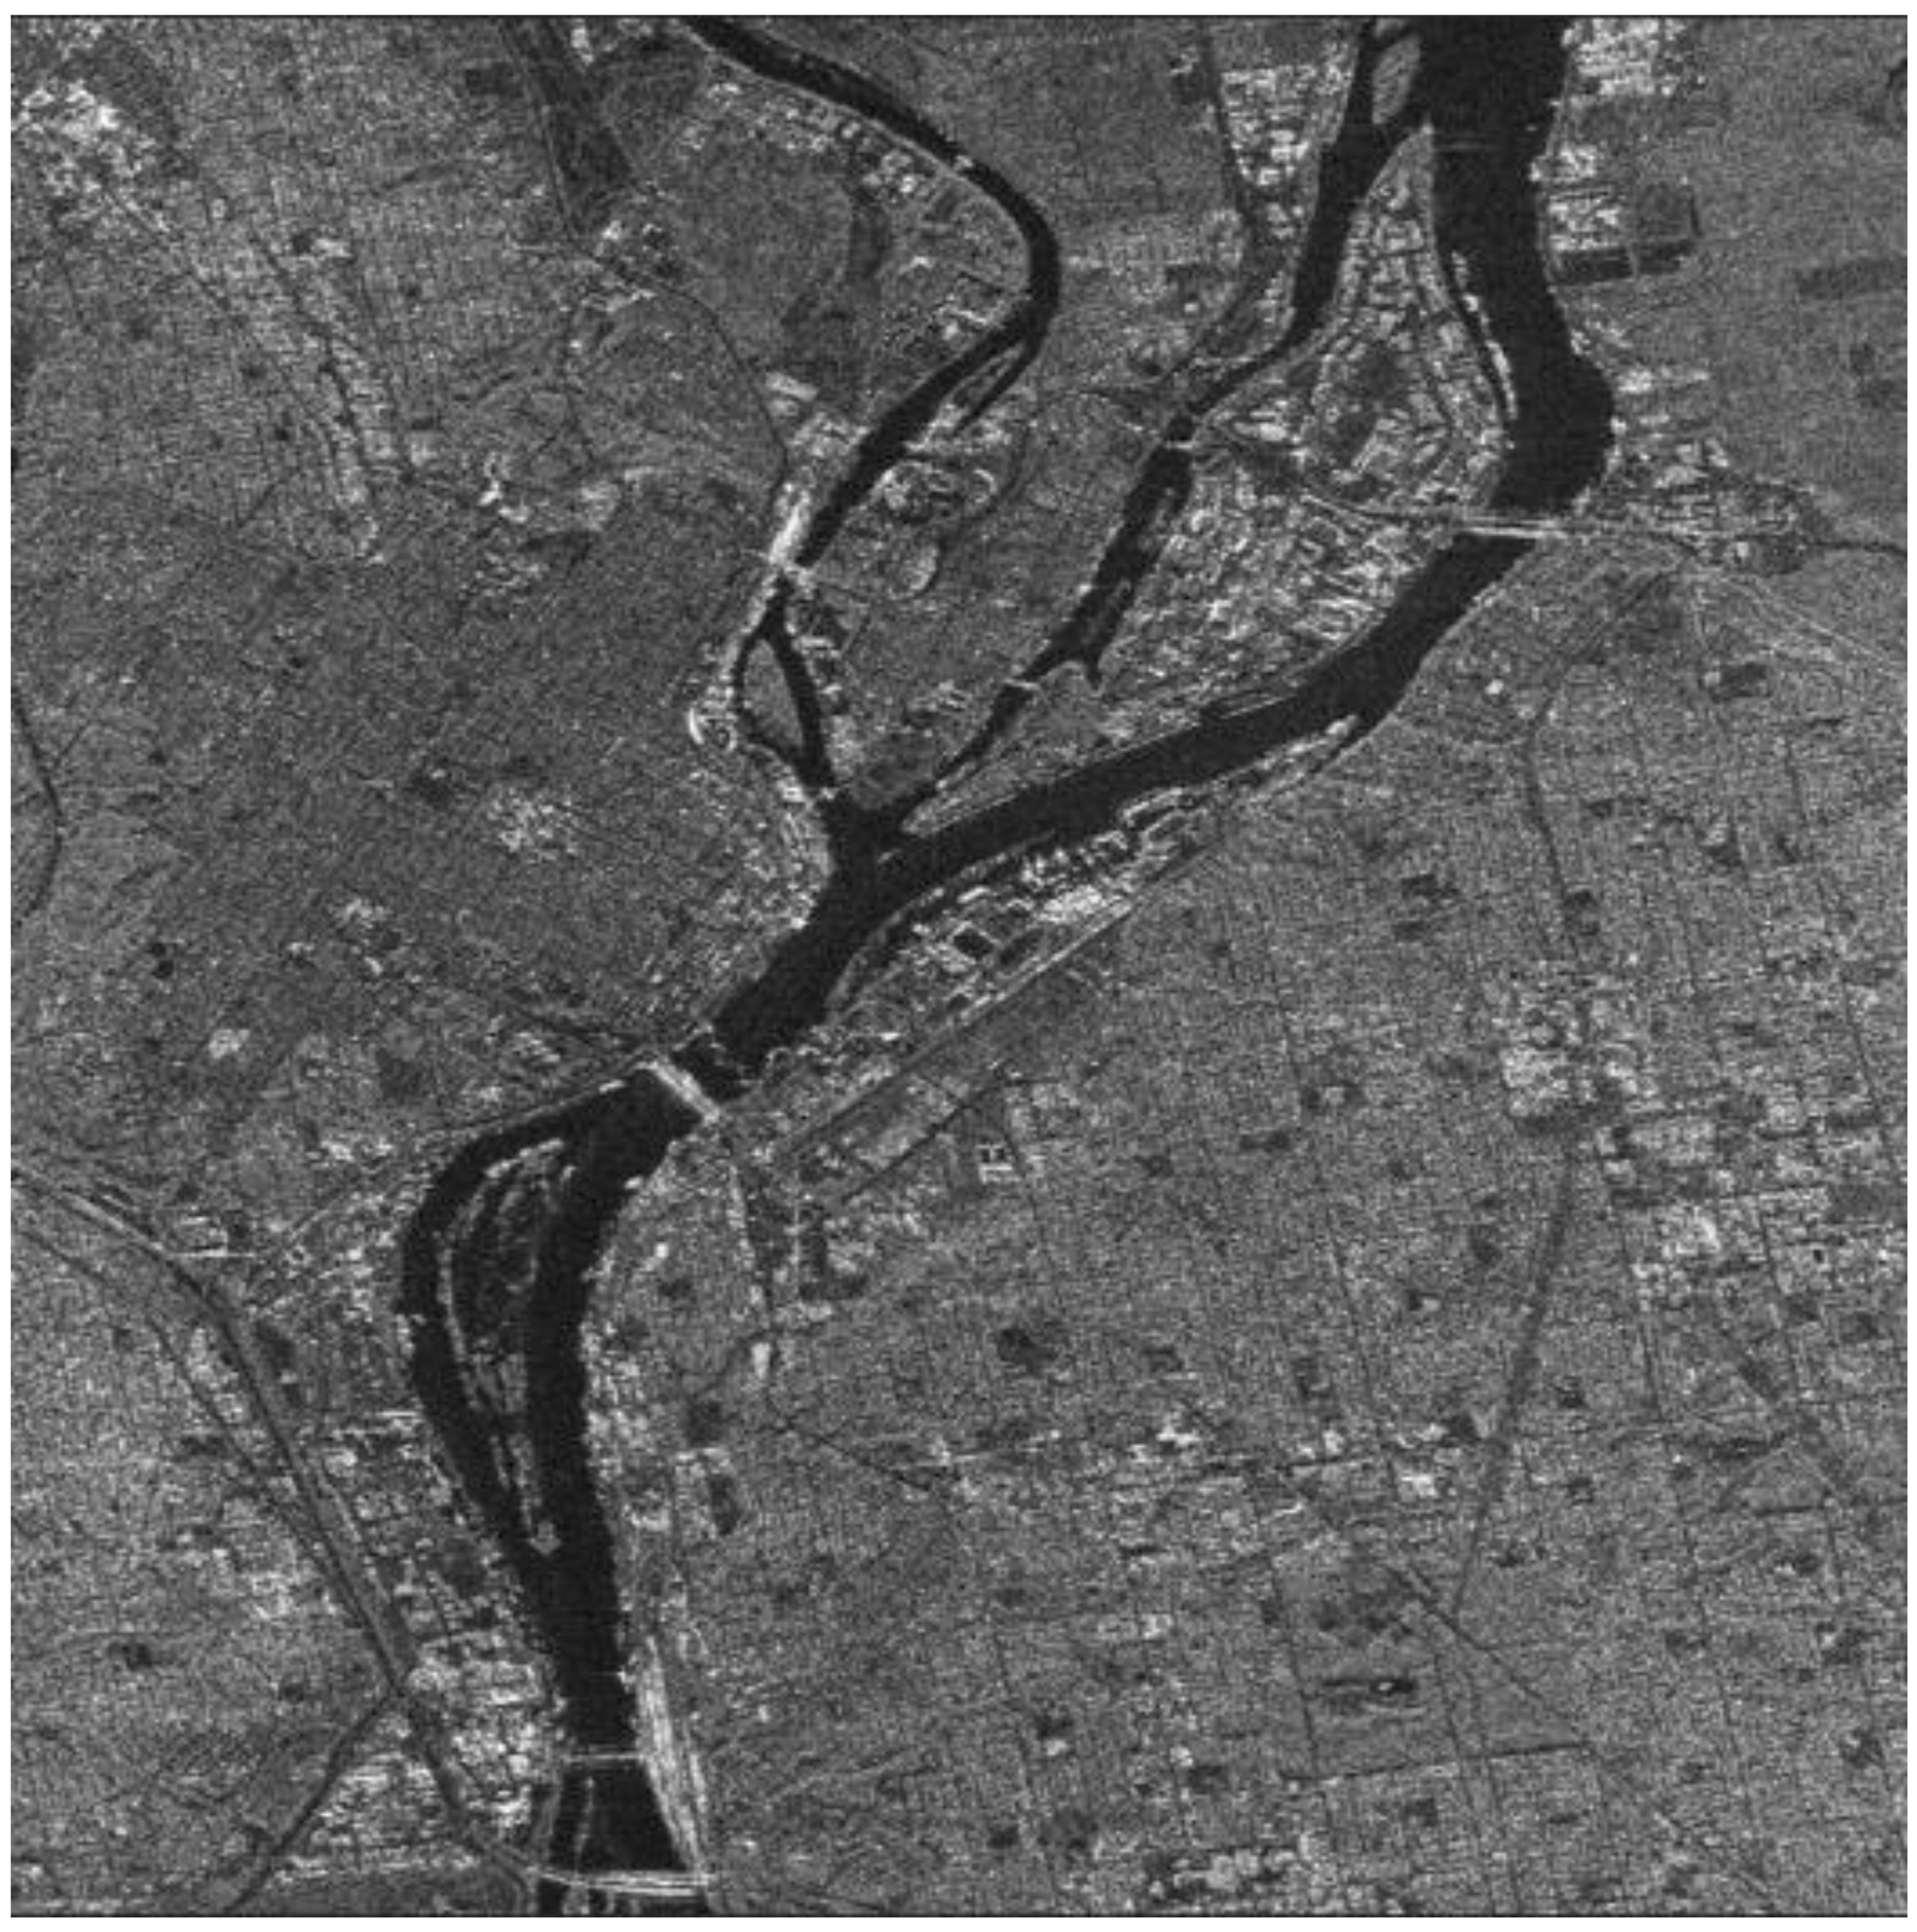
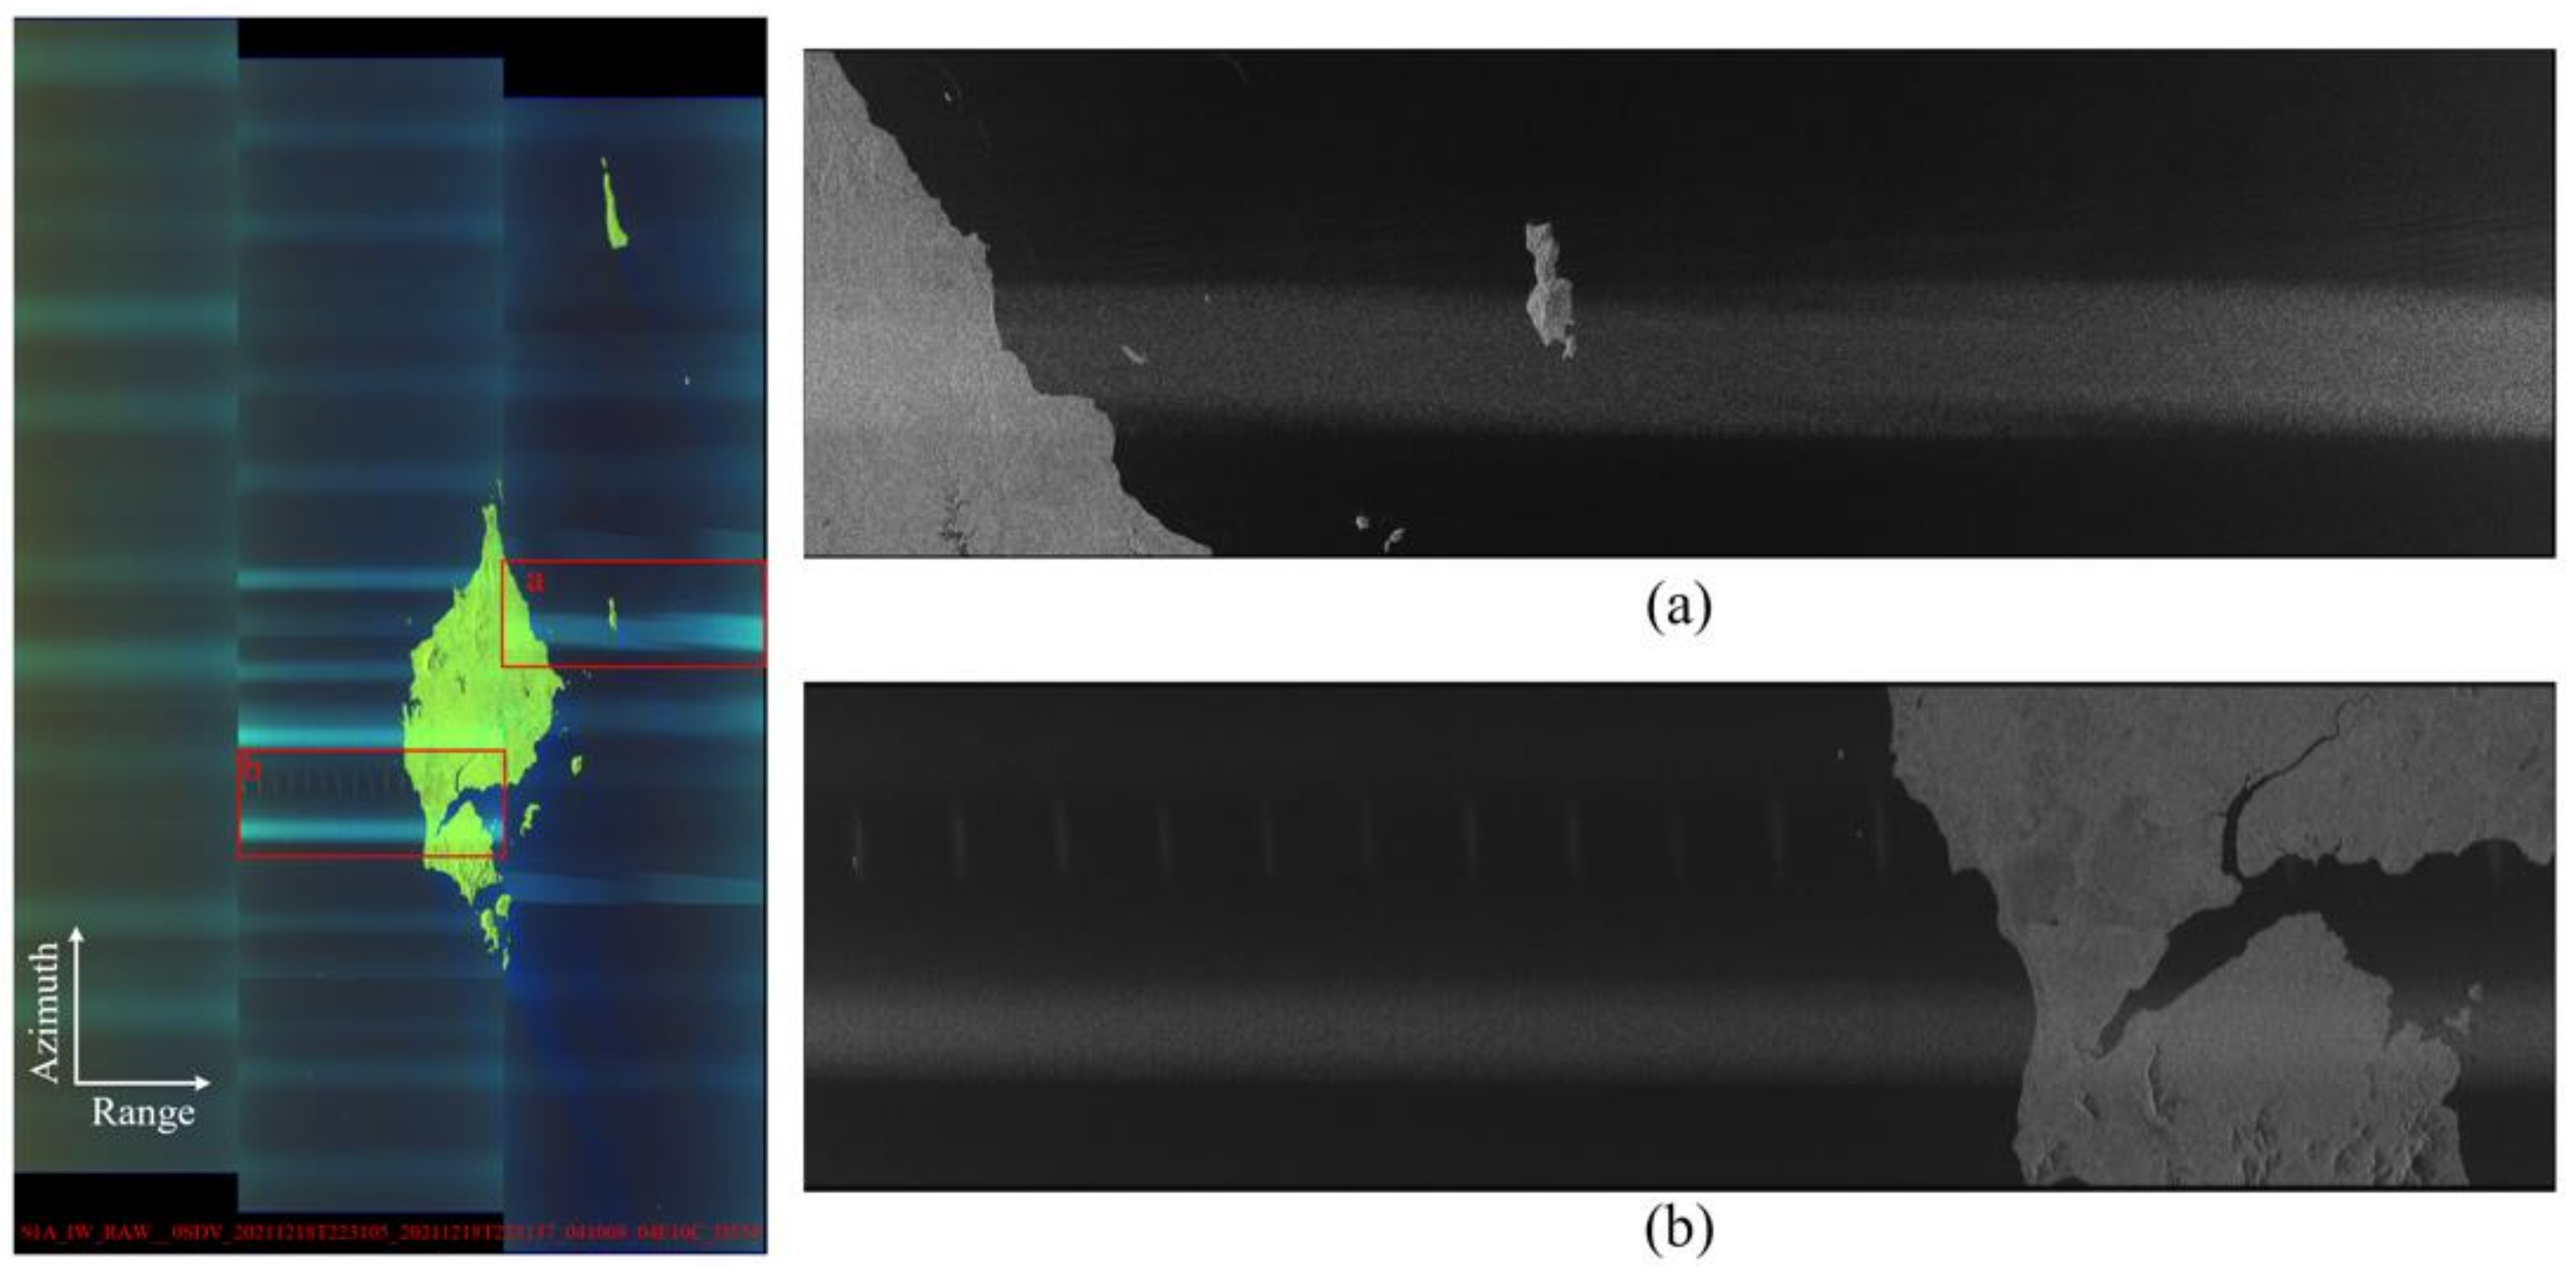
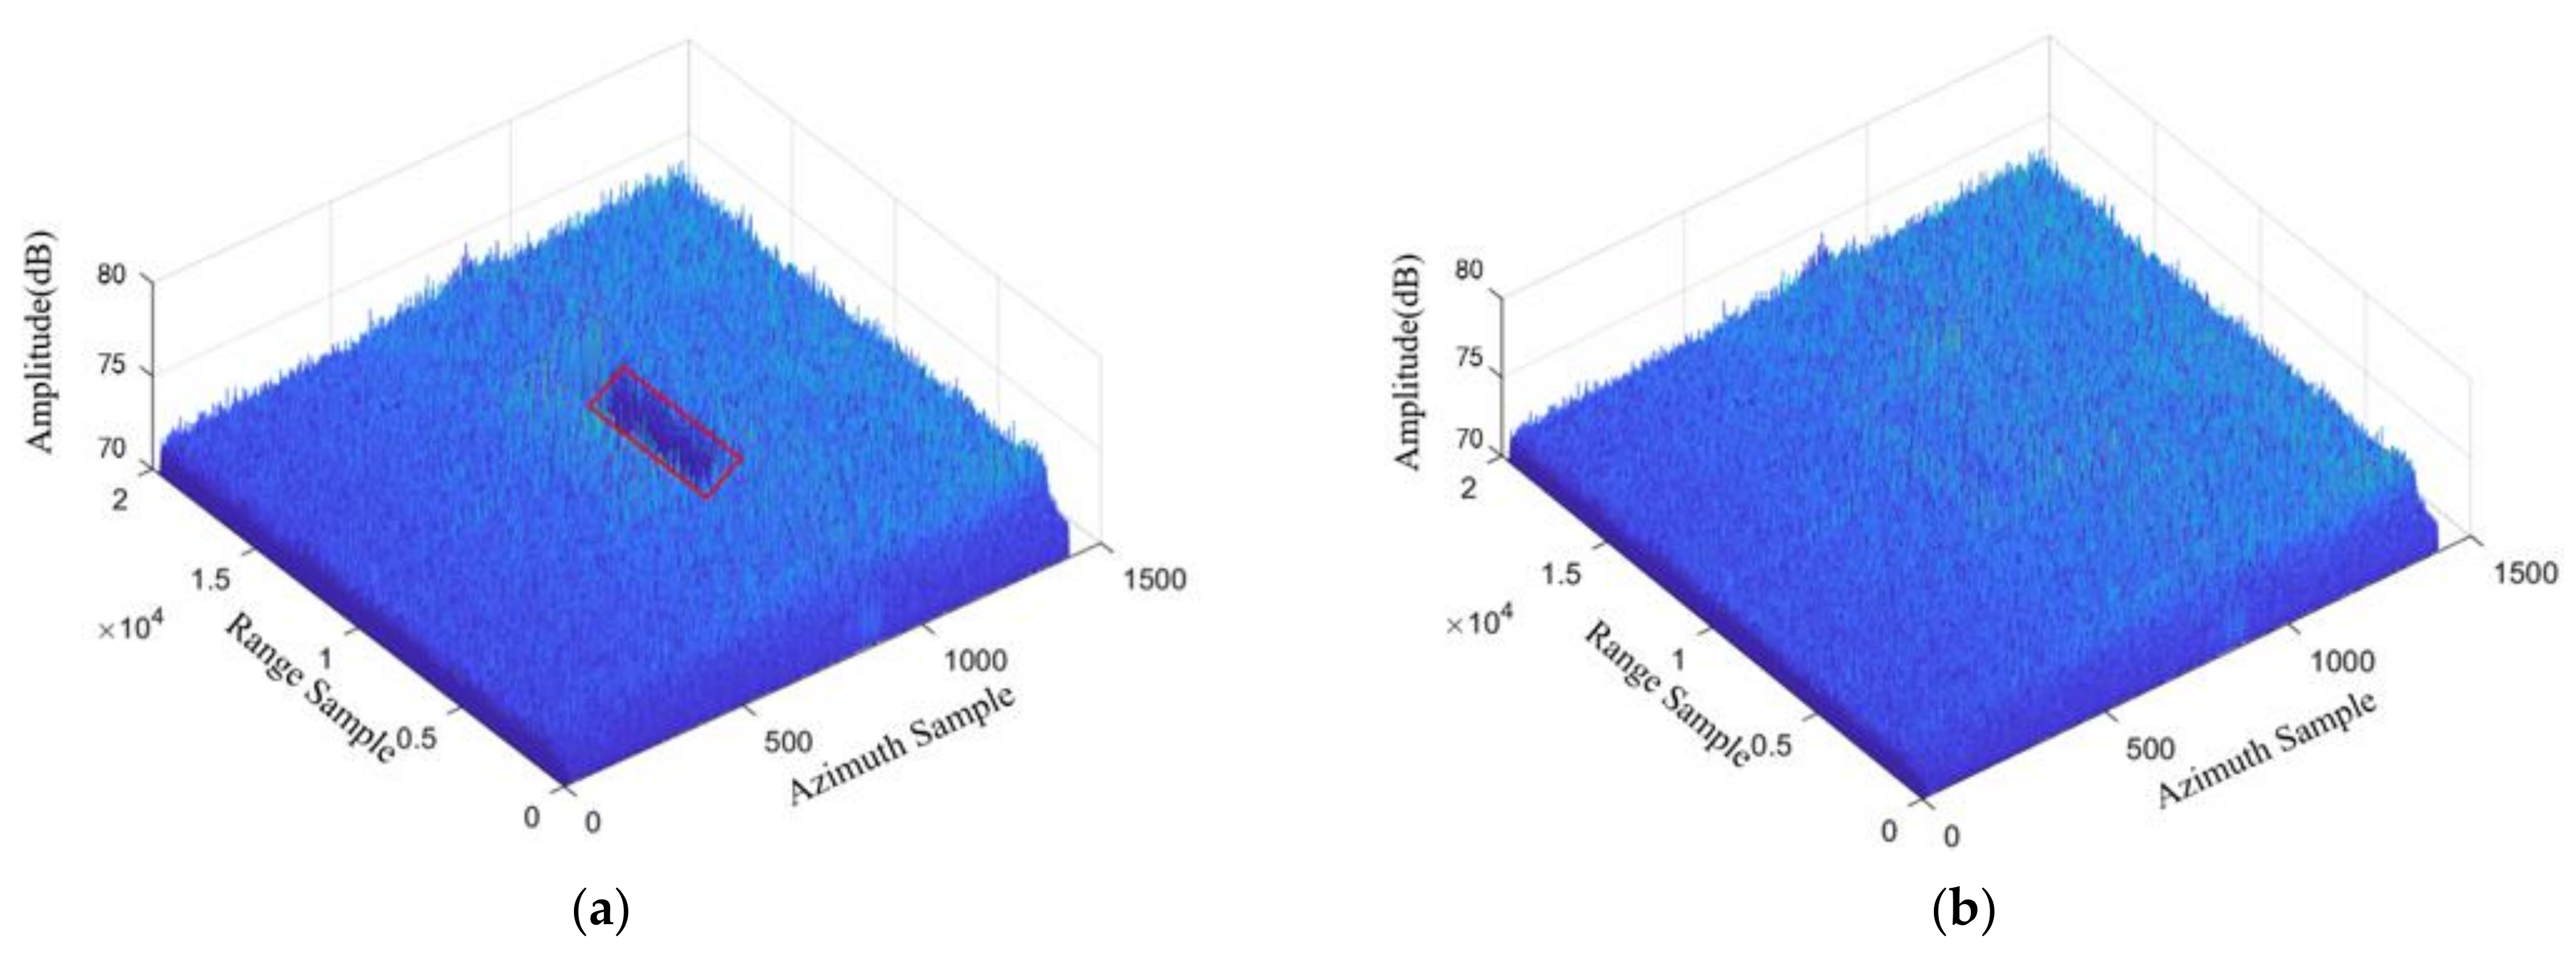
4.2. Experimental Results of Measured Data
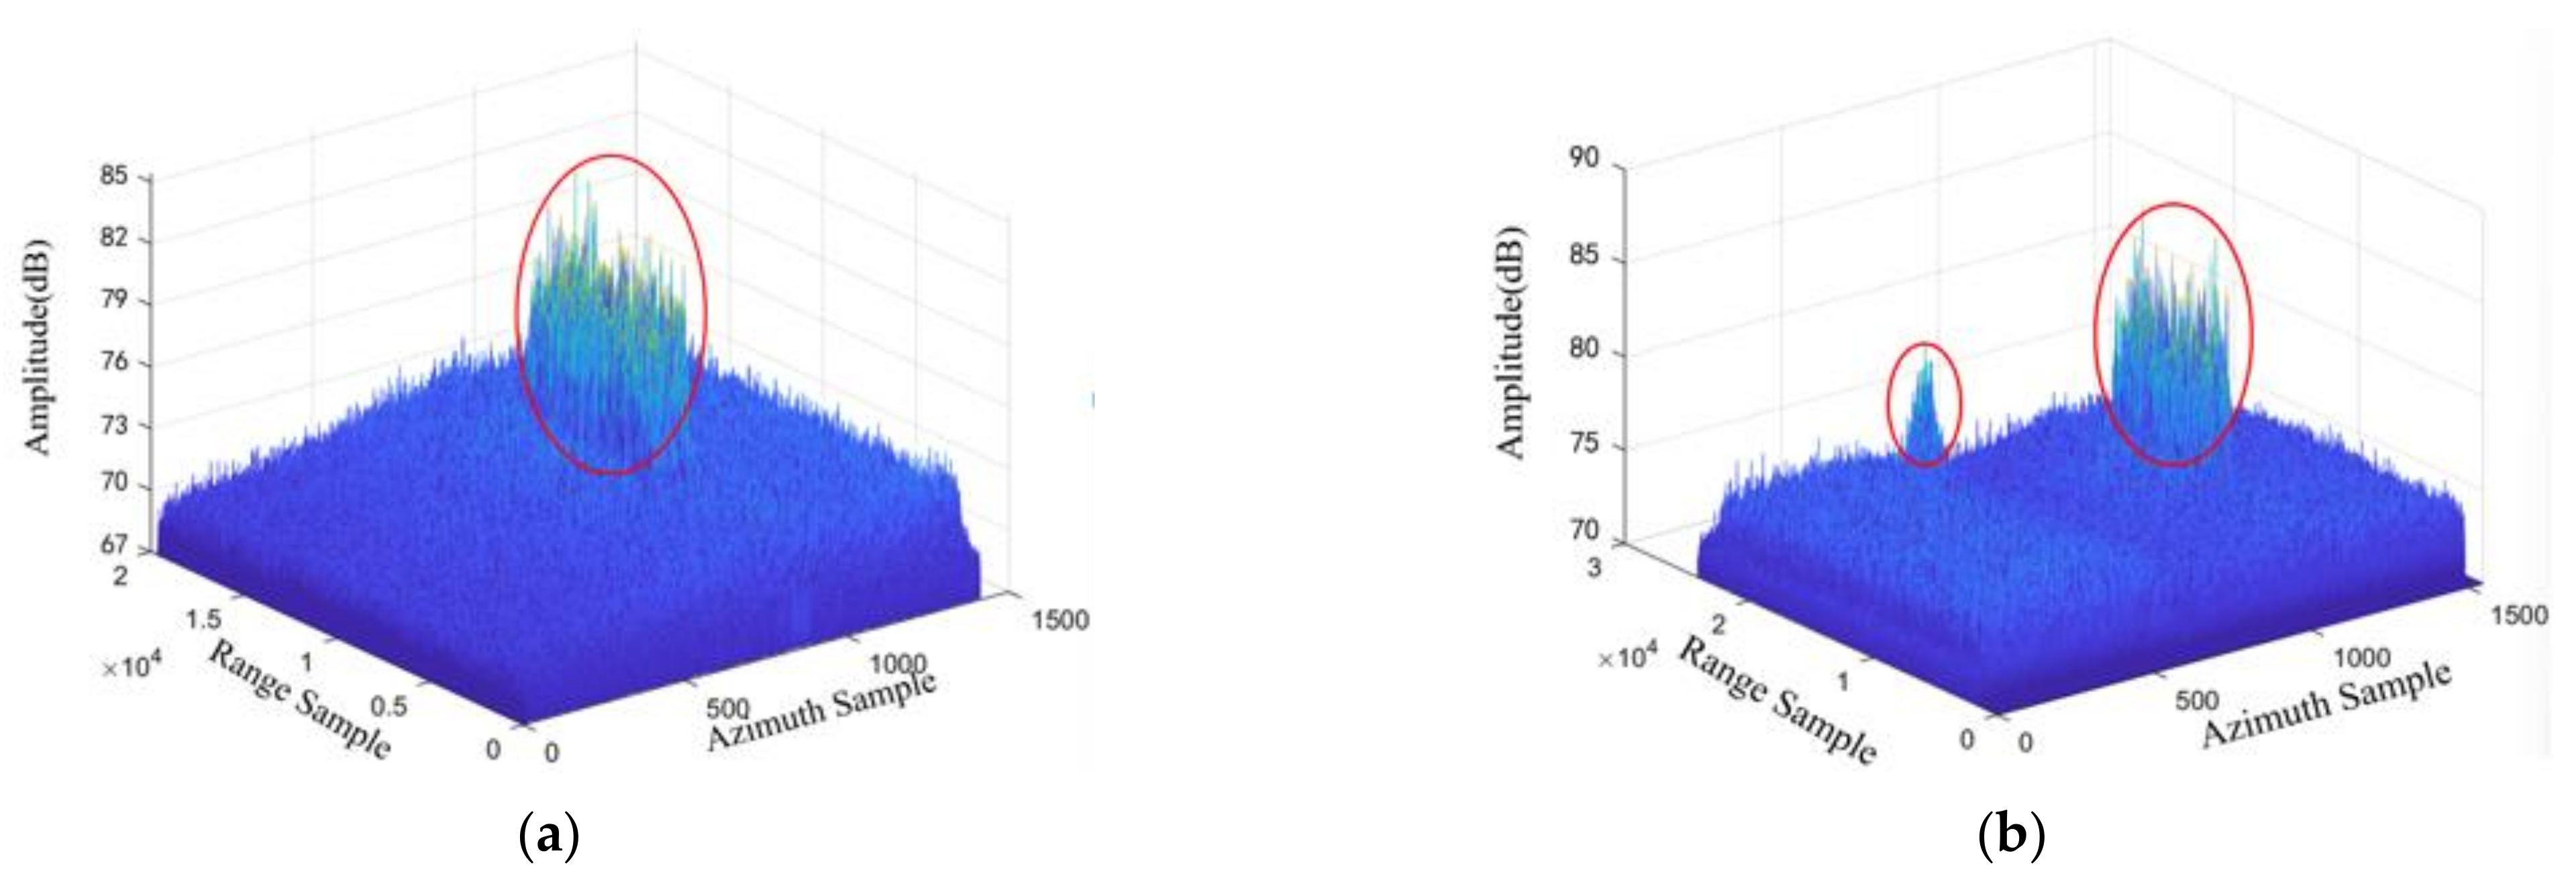
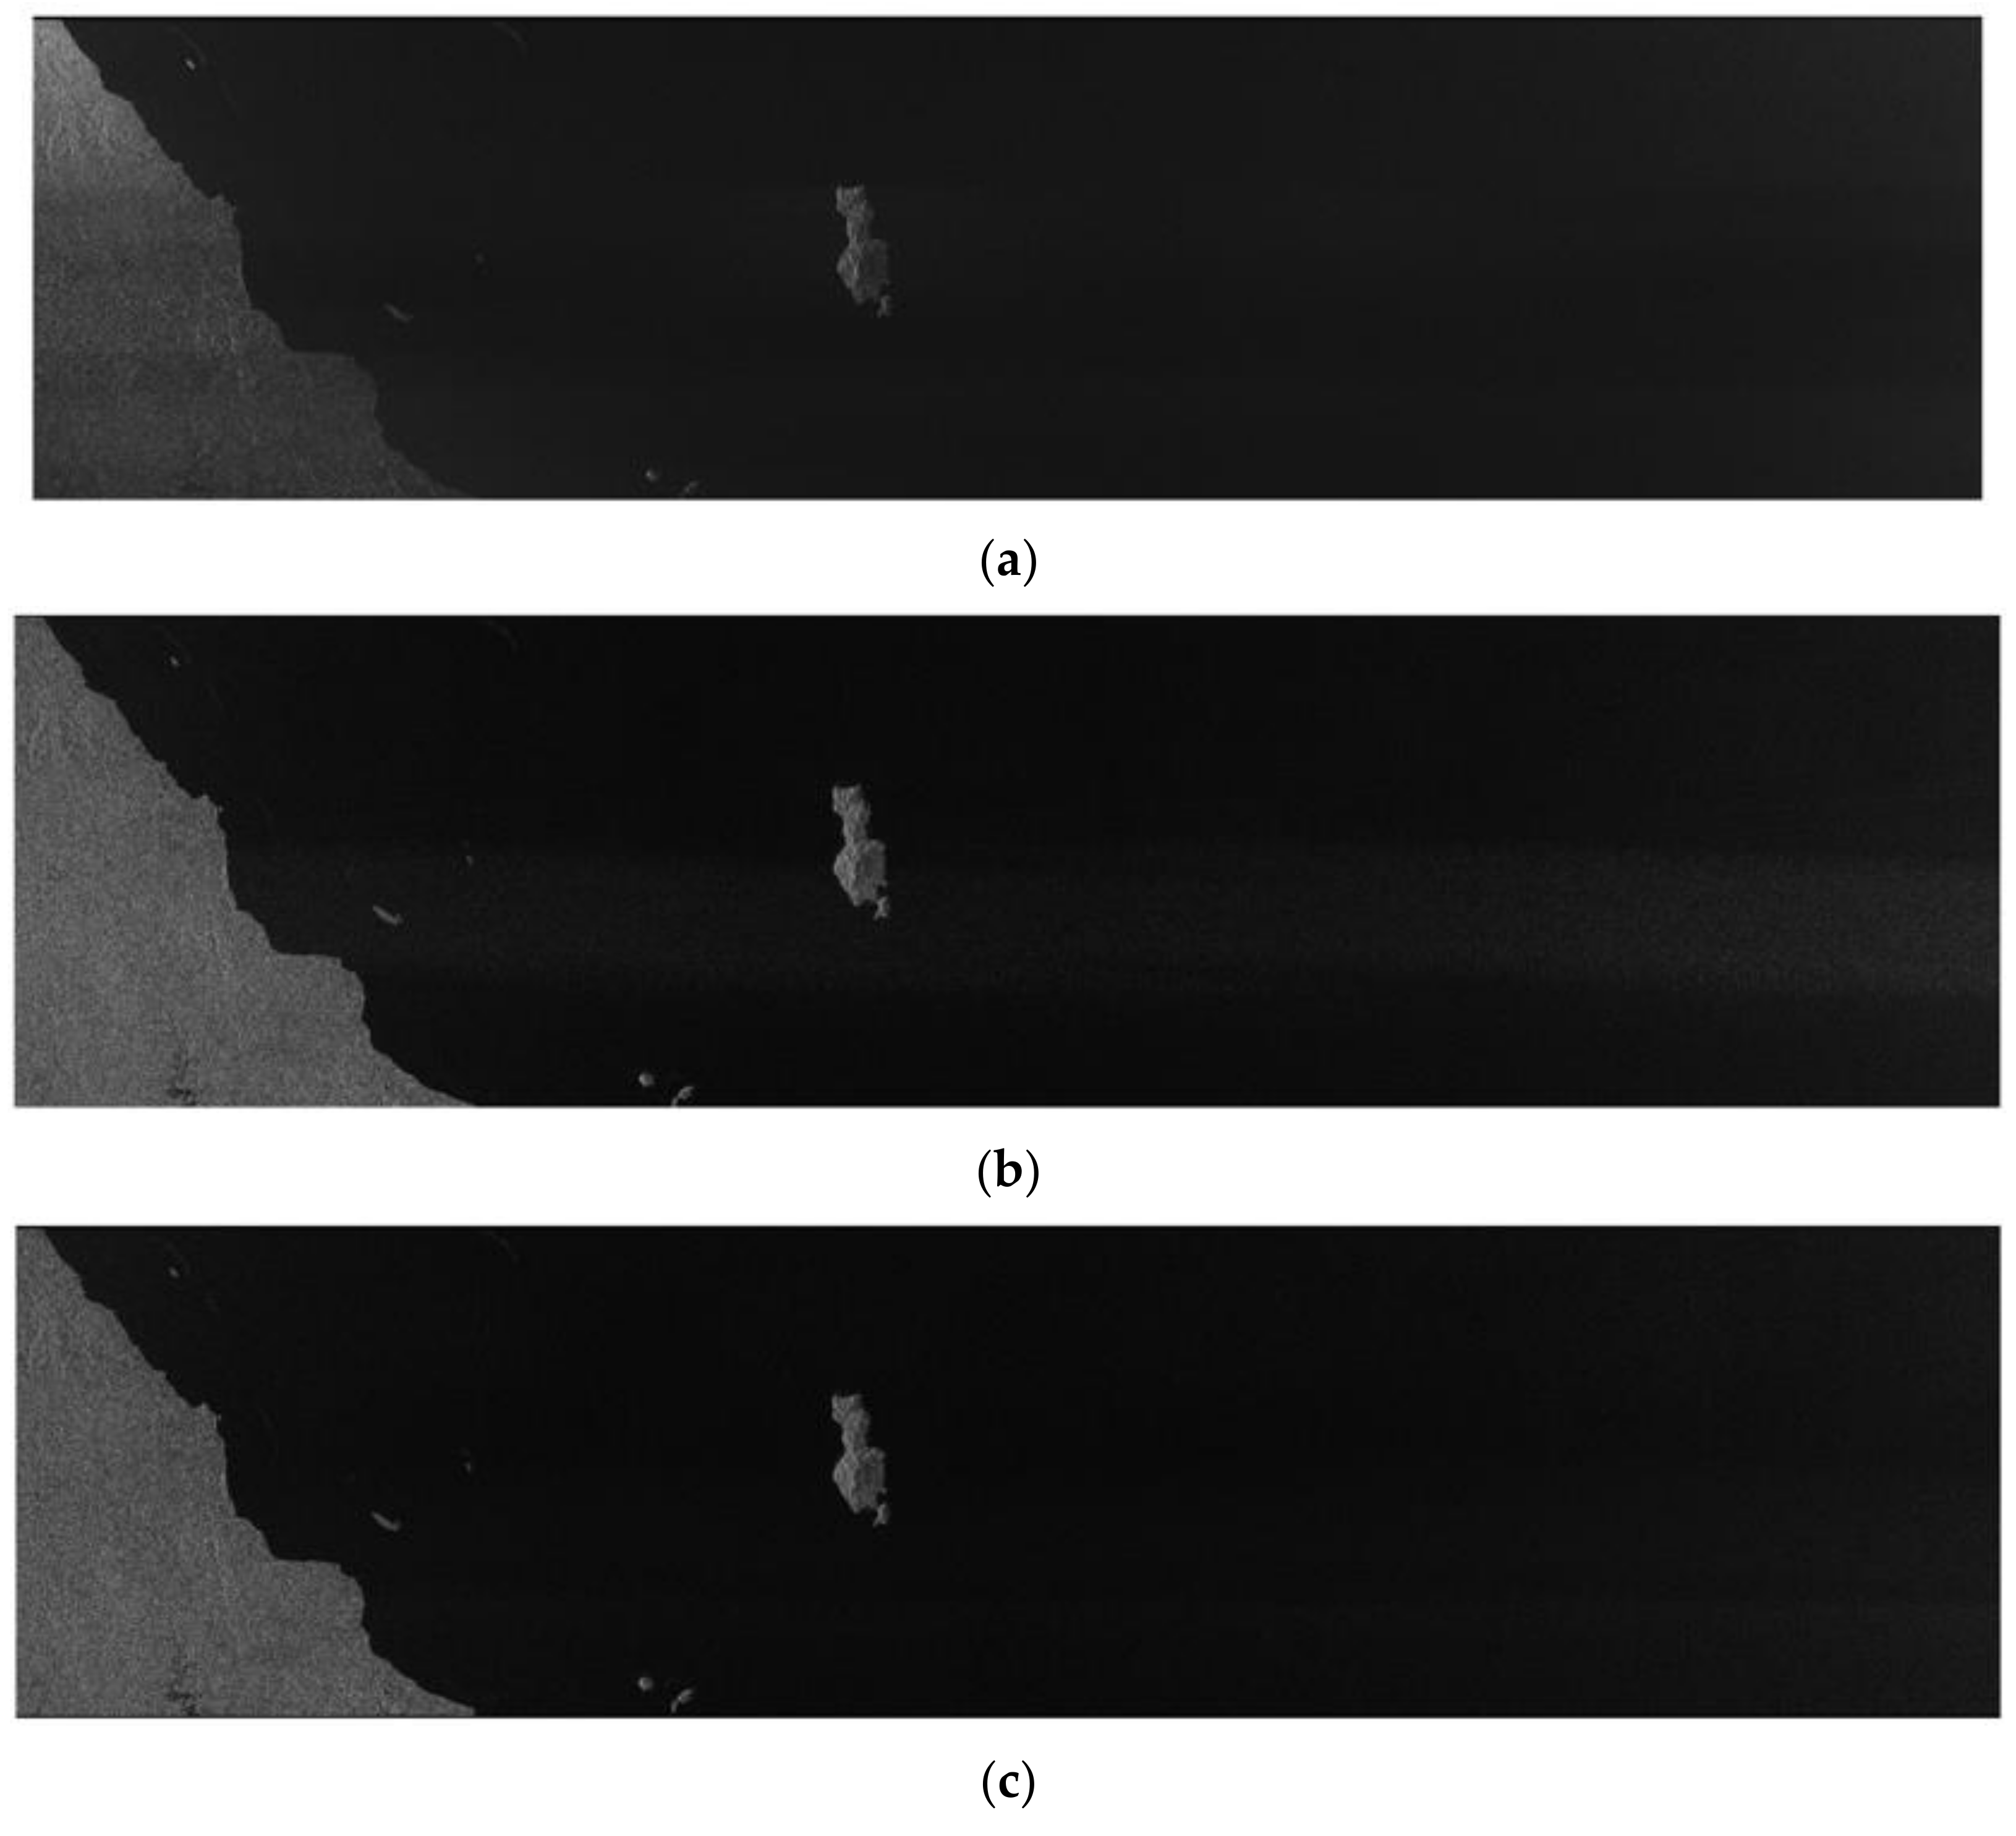
4.2.1. Experimental Results Based on Measure Data Contain RFI with Single Source
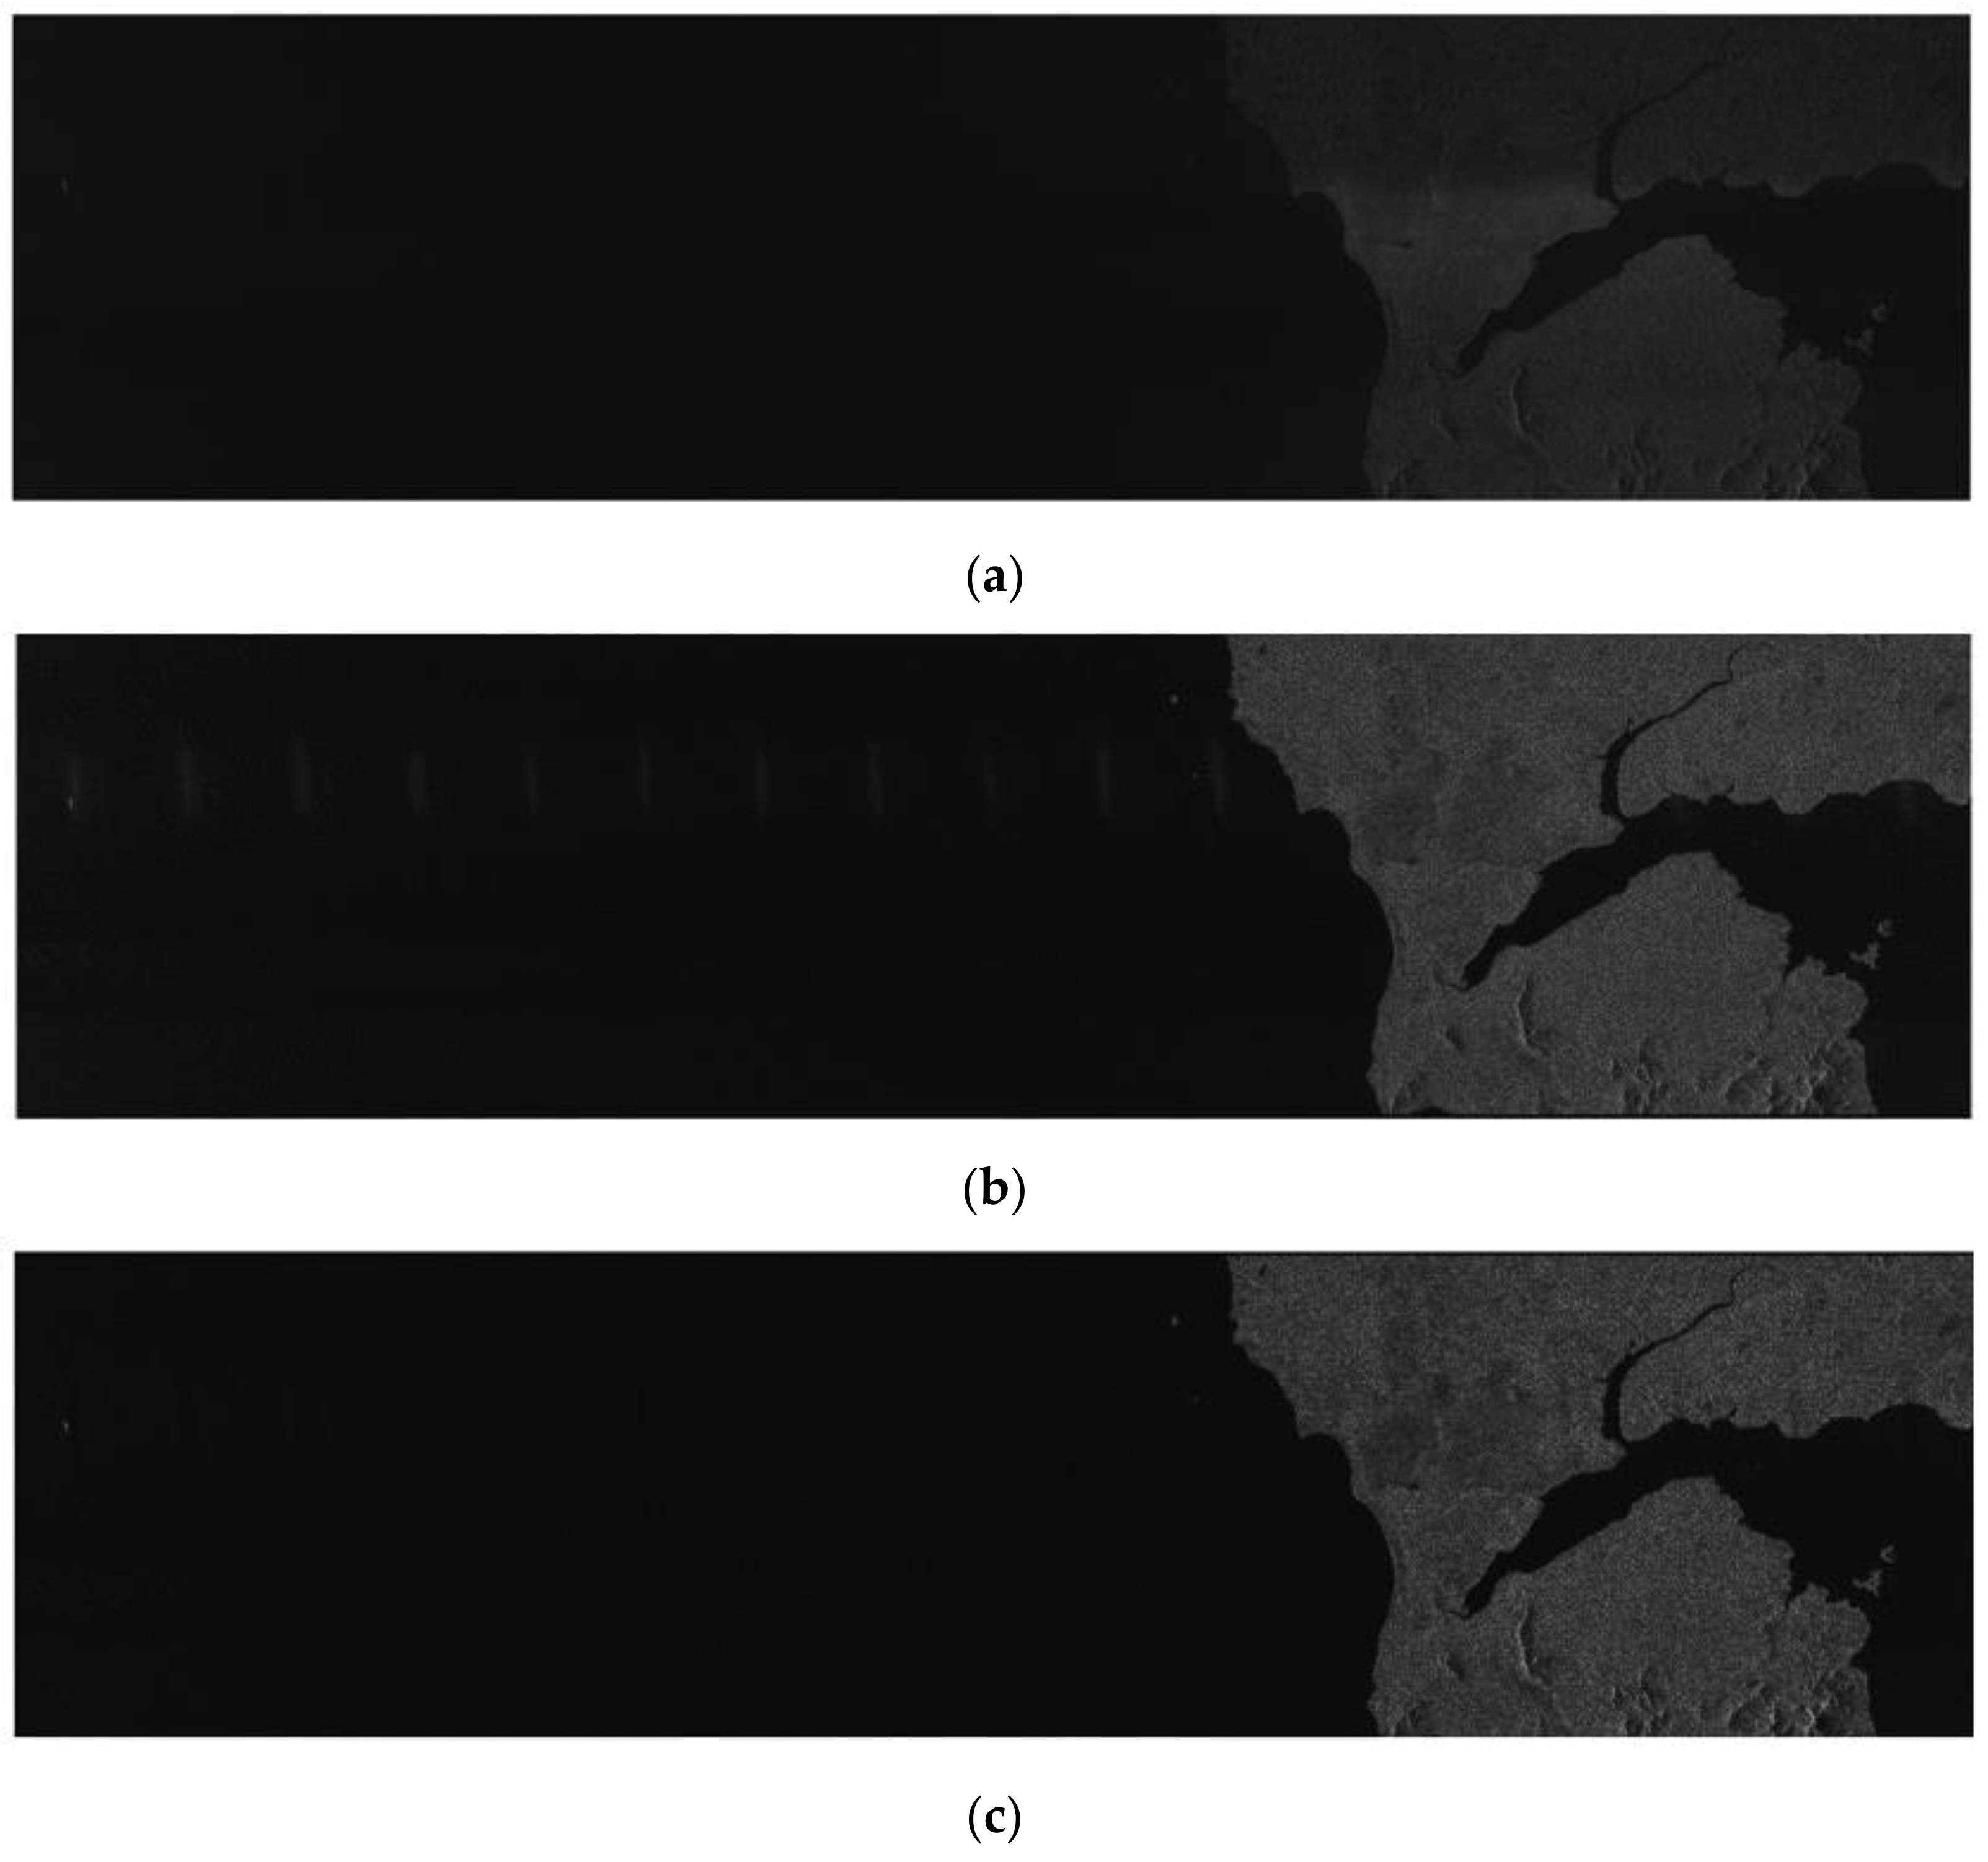
4.2.2. Experimental Results Based on Measurement Data Containing RFI with Multiple Sources
5. Discussion
6. Conclusions
Author Contributions
Funding
Institutional Review Board Statement
Informed Consent Statement
Data Availability Statement
Acknowledgments
Conflicts of Interest
References
- Zhang, B.; Xu, G.; Zhou, R.; Zhang, H.; Hong, W. Multi-channel Back-projection Algorithm for mmWave Automotive MIMO SAR Imaging with Doppler-division Multiplexing. IEEE J. Sel. Top. Signal Process. 2022, 1–13. [Google Scholar] [CrossRef]
- Xu, G.; Zhang, B.; Yu, H.; Chen, J.; Xing, M.; Hong, W. Sparse Synthetic Aperture Radar Imaging from Compressed Sensing and Machine Learning: Theories, Applications and Trends. IEEE Geosci. Remote Sens. Mag. 2022, 2–40. [Google Scholar] [CrossRef]
- Reigber, A.; Scheiber, R.; Jager, M.; Prats-Iraola, P.; Hajnsek, I.; Jagdhuber, T.; Papathanassiou, K.P.; Nannini, M.; Aguilera, E.; Baumgartner, S. Very-High-Resolution Airborne Synthetic Aperture Radar Imaging: Signal Processing and Applications. Proc. IEEE 2013, 101, 759–783. [Google Scholar] [CrossRef]
- Peng, B.; Peng, B.; Zhou, J.; Xie, J.; Liu, L. Scattering Model Guided Adversarial Examples for SAR Target Recognition: Attack and Defense. IEEE Trans. Geosci. Remote Sens. 2022, 60, 5236217. [Google Scholar] [CrossRef]
- Peng, B.; Peng, B.; Zhou, J.; Xia, J.; Liu, L. Speckle-Variant Attack: Toward Transferable Adversarial Attack to SAR Target Recognition. IEEE Geosci. Remote Sens. Lett. 2022, 19, 4509805. [Google Scholar] [CrossRef]
- Moreira, A.; Prats-Iraola, P.; Younis, M.; Krieger, G.; Hajnsek, I.; Papathanassiou, K.P. A tutorial on Synthetic Aperture Radar. IEEE Geosci. Remote Sens. Mag. 2013, 1, 6–43. [Google Scholar] [CrossRef]
- Deng, Y.; Yu, W.; Zhang, H.; Wang, W.; Liu, D.; Wang, R. Forthcoming Spaceborne SAR Development. J. Radars 2020, 9, 1. [Google Scholar]
- Zhou, F.; Tao, M. Research on Methods for Narrow-Band Interference Suppression in Synthetic Aperture Radar Data. IEEE J. Sel. Top. Appl. Earth Obs. Remote Sens. 2015, 8, 3476–3485. [Google Scholar] [CrossRef]
- Li, N.; Lv, Z.; Guo, Z. Observation and Mitigation of Mutual RFI Between SAR Satellites: A Case Study Between Chinese GaoFen-3 and European Sentinel-1A. IEEE Trans. Geosci. Remote Sens. 2022, 60, 5112819. [Google Scholar] [CrossRef]
- Li, N.; Lv, Z.; Guo, Z. Pulse RFI Mitigation in Synthetic Aperture Radar Data via a Three-Step Approach: Location, Notch, and Recovery. IEEE Trans. Geosci. Remote Sens. 2022, 60, 5225617. [Google Scholar] [CrossRef]
- Lv, Z.; Zhang, H.; Li, N.; Guo, Z. A Two-Step Approach for Pulse RFI Detection in SAR Data. In Proceedings of the 2021 IEEE Sensors, Sydney, Australia, 3 October–3 November 2021; pp. 1–4. [Google Scholar]
- Lv, Z.; Li, N.; Guo, Z.; Zhao, J. Detection and Mitigation of Mutual RFI in C-band SAR: A Case Study of Chinese GaoFen-3. In Proceedings of the 2021 IEEE Radar Conference (RadarConf21), Atlanta, GA, USA, 7–14 May 2021; pp. 1–5. [Google Scholar]
- Su, J.; Tao, H.; Tao, M.; Wang, L.; Xie, J. Narrow-band Interference Suppression via RPCA-Based Signal Separation in Time–Frequency Domain. IEEE J. Sel. Top. Appl. Earth Obs. Remote Sens. 2017, 10, 5016–5025. [Google Scholar] [CrossRef]
- Chen, B.; Lv, Z.; Lu, P.; Shu, G.; Huang, Y.; Li, N. Extension and Evaluation of SSC for Removing Wideband RFI in SLC SAR Images. Remote Sens. 2022, 14, 4294. [Google Scholar] [CrossRef]
- Han, W.; Bai, X.; Fan, W.; Wang, L.; Zhou, F. Wideband Interference Suppression for SAR via Instantaneous Frequency Estimation and Regularized Time-Frequency Filtering. IEEE Trans. Geosci. Remote Sens. 2022, 60, 5208612. [Google Scholar] [CrossRef]
- Huang, Y.; Wen, C.; Chen, Z.; Chen, J.; Liu, Y.; Li, J.; Hong, W. HRWS SAR Narrowband Interference Mitigation Using Low-Rank Recovery and Image-Domain Sparse Regularization. IEEE Trans. Geosci. Remote Sens. 2022, 60, 5217924. [Google Scholar] [CrossRef]
- Huang, Y.; Liao, G.; Li, J.; Xu, J. Narrowband RFI suppression for SAR system via fast implementation of joint sparsity and low-rank property. IEEE Trans. Geosci. Remote Sens. 2018, 56, 2748–2761. [Google Scholar] [CrossRef]
- Huang, Y.; Liao, G.; Xiang, Y.; Zhang, Z.; Li, J.; Nehorai, A. Reweighted nuclear norm and reweighted Frobenius norm minimizations for narrowband RFI suppression on SAR system. IEEE Trans. Geosci. Remote Sens. 2019, 57, 5949–5962. [Google Scholar] [CrossRef]
- Huang, Y.; Liao, G.; Zhang, Z.; Xiang, Y.; Li, J.; Nehorai, A. Fast narrowband RFI suppression algorithms for SAR systems via matrix-factorization techniques. IEEE Trans. Geosci. Remote Sens. 2019, 57, 250–262. [Google Scholar] [CrossRef]
- Huang, Y.; Liao, G.; Zhang, L.; Xiang, Y.; Li, J.; Nehorai, A. Efficient narrowband RFI mitigation algorithms for SAR systems with reweighted tensor structures. IEEE Trans. Geosci. Remote Sens. 2019, 57, 9396–9409. [Google Scholar] [CrossRef]
- Huang, Y.; Liao, G.; Xu, J.; Li, J. Narrowband RFI suppression for SAR system via efficient parameter-free decomposition algorithm. IEEE Trans. Geosci. Remote Sens. 2018, 56, 3311–3322. [Google Scholar] [CrossRef]
- Zhang, H.; Huang, Y.; Li, J.; Chen, Z.; Cai, L.; Hong, W. Time-Varying RFI Mitigation for SAR Systems via Graph Laplacian Clustering Techniques. IEEE Geosci. Remote Sens. Lett. 2022, 60, 4010805. [Google Scholar] [CrossRef]
- Braunstein, M.; Ralston, J.; Sparrow, D. Signal Processing Approaches to Radio Frequency Interference (RFI) Suppression. In Proceedings of the SPIE 2230, Algorithms for Synthetic Aperture Radar Imagery, Orlando, FL, USA, 9 June 1994; pp. 190–208. [Google Scholar]
- Zhang, S.; Xing, M.; Guo, R.; Zhang, L.; Bao, Z. Interference Suppression Algorithm for SAR Based on Time-Frequency Transform. IEEE Trans. Geosci. Remote Sens. 2011, 49, 3675–3779. [Google Scholar] [CrossRef]
- Yang, H.; He, Y.; Du, Y.; Zhang, T.; Yin, J.; Yang, J. Two-Dimensional Spectral Analysis Filter for Removal of LFM Radar Interference in Spaceborne SAR Imagery. IEEE Trans. Geosci. Remote Sens. 2022, 60, 1–16. [Google Scholar] [CrossRef]
- Fan, W.; Zhou, F.; Rong, P.; Yao, X. Interference Mitigation for Synthetic Aperture Radar Using Deep Learning. In Proceedings of the Asia-Pacific Conference on Synthetic Aperture Radar, Xiamen, China, 26–29 November 2019; pp. 1–6. [Google Scholar]
- Lu, X.; Su, W.; Yang, J.; Gu, H.; Zhang, H.; Yu, W.; Yeo, T. Radio Frequency Interference Suppression for SAR via Block Sparse Bayesian Learning. IEEE J. Sel. Top. Appl. Earth Obs. Remote Sens. 2018, 11, 4835–4847. [Google Scholar] [CrossRef]
- Zhou, F.; Xing, M.; Bao, Z. Narrow Band Interference Suppression for SAR Using Eigen-Subspace Based Filtering. J. Electron. Inf. Technol. 2005, 27, 767–770. [Google Scholar]
- Zhou, F.; Tao, M.; Bai, X.; Liu, J. Narrowband interference suppression for SAR based on independent component analysis. IEEE Trans. Geosci. Remote Sens. 2013, 51, 4952–4960. [Google Scholar] [CrossRef]
- Zhou, F.; Xing, M.; Bai, X.; Sun, G.; Bao, Z. Narrowband interference suppression for SAR based on complex empirical mode decomposition. IEEE Geosci. Remote Sens. Lett. 2009, 6, 423–427. [Google Scholar] [CrossRef]
- Tao, M.; Zhou, F.; Liu, J.; Liu, Y.; Zhang, Z.; Bao, Z. Narrow-band interference mitigation for SAR using independent subspace analysis. IEEE Trans. Geosci. Remote Sens. 2014, 52, 5289–5301. [Google Scholar]
- Yang, H.; Li, K.; Li, J.; Du, Y.; Yang, J. BSF: Block Subspace Filter for Removing Narrowband and Wideband Radio Interference Artifacts in Single-Look Complex SAR Images. IEEE Trans. Geosci. Remote Sens. 2022, 60, 5211916. [Google Scholar] [CrossRef]
- Zhang, H.; Min, L.; Lu, J.; Chang, J.; Guo, Z.; Li, N. An Improved RFI Mitigation Approach for SAR Based on Low-Rank Sparse Decomposition: From the Perspective of Useful Signal Protection. Remote Sens. 2022, 14, 3278. [Google Scholar] [CrossRef]
- Shang, R.; Lin, J.; Jiao, L.; Li, Y. SAR Image Segmentation Using Region Smoothing and Label Correction. Remote Sens. 2020, 12, 803. [Google Scholar] [CrossRef]
- Nguyen, L.H.; Tran, T.D. Efficient and Robust RFI Extraction Via Sparse Recovery. IEEE J. Sel. Top. Appl. Earth Obs. Remote Sens. 2016, 9, 2104–2117. [Google Scholar] [CrossRef]
- Liu, H.; Li, D. RFI Suppression Based on Sparse Frequency Estimation for SAR Imaging. IEEE Geosci. Remote Sens. Lett. 2016, 13, 63–67. [Google Scholar] [CrossRef]
- Ding, Y.; Fan, W.; Zhang, Z.; Zhou, F.; Lu, B. Radio Frequency Interference Mitigation for Synthetic Aperture Radar Based on the Time-Frequency Constraint Joint Low-Rank and Sparsity Properties. Remote Sens. 2022, 14, 775. [Google Scholar] [CrossRef]
- Xu, W.; Xing, W.; Fang, C.; Huang, P.; Tan, W. RFI Suppression Based on Linear Prediction in Synthetic Aperture Radar Data. IEEE Geosci. Remote Sens. Lett. 2021, 18, 2127–2131. [Google Scholar] [CrossRef]
- Cazzaniga, G.; Guarnieri, A. Removing RF Interferences from P-band Airplane SAR Data. In Proceedings of the 1996 International Geoscience and Remote Sensing Symposium, Lincoln, NE, USA, 31 May 1996; pp. 1845–1847. [Google Scholar]
- Buckreuss, S.; Horn, R. E-SAR P-band SAR Subsystem Design and RF-interference Suppression. In Proceedings of the 1998 IEEE International Geoscience and Remote Sensing Symposium, Seattle, WA, USA, 6–10 July 1998; pp. 466–468. [Google Scholar]
- Meyer, F.; Nicoll, J.; Doulgeris, A. Correction and Characterization of Radio Frequency Interference Signatures in L-band Synthetic Aperture Radar Data. IEEE Trans. Geosci. Remote Sens. 2013, 51, 4961–4972. [Google Scholar] [CrossRef]
- Koitsoudis, T.; Lovas, L. RF interference suppression in ultrawideband radar receivers. In Proceedings of the Spies Symposium on Oe/aerospace Sensing and Dual Use Photonics, Orlando, FL, USA, 5 June 1995; Volume 2487, pp. 107–118. [Google Scholar]
- Le, C.; Hensley, S.; Chapin, E. Removal of RFI in wideband radars. International Geoscience and Remote Sensing Symposium. In Proceedings of the IEEE International Geoscience and Remote Sensing Symposium, Seattle, WA, USA, 6–10 July 1998; pp. 2032–2034. [Google Scholar]
- Le, C.; Hensley, S.; Chapin, E. Adaptive filtering of RFI in wideband SAR signals. In Proceedings of the 7th Annual JPL AirSAR Workshop, Pasadena, CA, USA; 1998; pp. 41–50. [Google Scholar]
- Potsis, A.; Reigber, A.; Papathanassiou, K. A phase preserving method for RF interference suppression in P-band synthetic aperture radar interferometric data. In Proceedings of the IEEE 1999 International Geoscience and Remote Sensing Symposium, Hamburg, Germany, 28 June–2 July 1999; pp. 2655–2657. [Google Scholar]
- Luo, X.; Ulander, L.; Askne, J.; Smith, G.; Frolind, P. RFI suppression in ultra-wideband SAR systems using LMS filters in frequency domain. Electron. Lett. 2001, 37, 241–243. [Google Scholar] [CrossRef]
- Harcke, L.; Le, C. AirMOSS P-band RF interference experience. In Proceedings of the IEEE Radar Conference, Cincinnati, OH, USA, 19–23 May 2014; pp. 761–764. [Google Scholar]
- Vu, V.; Sjögren, T.; Pettersson, M.; Håkansson, L.; Gustavsson, A.; Ulander, L. RFI suppression in ultrawideband SAR using an adaptive line enhancer. IEEE Geosci. Remote Sens. Lett. 2010, 7, 694–698. [Google Scholar] [CrossRef]
- Smith, T.; Hill, R.; Hayward, S.; Yates, G.; Blake, A. Filtering approaches for interference suppression in low-frequency SAR. IEE Proc. -Radar Sonar Navig. 2006, 153, 338–344. [Google Scholar] [CrossRef]
- ITU-R Recommendation RS. Mitigation Technique to Facilitate the Use of the 1215–1300 MHz Band by the Earth Exploration-satelite Service and the Space Research Service. Available online: https://www.itu.int/rec/R-REC-RS.1749/en (accessed on 2 November 2006).
- Nabil, H.; Chen, J.; Kamel, H. Bidirectional Notch Filter for Suppressing Pulse Modulated Radio-Frequency-Interference in SAR Data. In Proceedings of the 2014 IEEE International Geoscience and Remote Sensing Symposium, Quebec City, QC, Canada, 13–18 July 2014; pp. 1136–1139. [Google Scholar]
- Feng, J.; Zheng, H.; Deng, Y.; Gao, D. Application of Subband Spectral Cancellation for SAR Narrow-Band Interference Suppression. IEEE Geosci. Remote Sens. Lett. 2012, 9, 190–193. [Google Scholar] [CrossRef]
- Reigber, A.; Ferrofamil, L. Interference suppression in synthesized SAR images. IEEE Geosci. Remote Sens. Lett. 2005, 2, 45–49. [Google Scholar] [CrossRef]
- Doerry, A. Apodized RFI Filtering of Synthetic Aperture Radar Images. Available online: https://www.osti.gov/servlets/purl/1204095 (accessed on 17 January 2023).
- Natsuaki, R.; Motohka, T.; Watanabe, M.; Shimada, M.; Suzuki, S. An Autocorrelation-Based Radio Frequency Interference Detection and Removal Method in Azimuth-Frequency Domain for SAR Image. IEEE J. Sel. Top. Appl. Earth Obs. Remote Sens. 2017, 10, 5736–5751. [Google Scholar] [CrossRef]
- Li, N.; Lv, Z.; Guo, Z.; Zhao, J. Time-Domain Notch Filtering Method for Pulse RFI Mitigation in Synthetic Aperture Radar. IEEE Geosci. Remote Sens. Lett. 2021, 19, 1–5. [Google Scholar] [CrossRef]
- Wu, W.; Xiao, Y.; Lin, J.; Ma, L.; Khorasani, K. An Efficient Filter Bank Structure for Adaptive Notch Filtering and Applications. IEEE Trans. Audio Speech Lang. Process. 2021, 29, 3226–3241. [Google Scholar] [CrossRef]
- Huang, H.; Cheng, F.; Chiu, Y. Efficient Contrast Enhancement Using Adaptive Gamma Correction with Weighting Distribution. IEEE Trans. Image Process. 2013, 22, 1032–1041. [Google Scholar] [CrossRef]
- Kass, M.; Witkin, A.; Terzopoulous, D. Snakes: Active Contour Models. In Proceedings of the 1st International Conference on Computer Vision, London, UK, 1 October 1987; pp. 259–268. [Google Scholar]
- Liu, Y.; Ren, M.; Zhu, L.; Hu, X. Synthetic Aperture Radar Image Segmentation Method Based on Active Contour Model. Sci. Technol. Eng. 2019, 19, 221–227. [Google Scholar]
- Oveis, A.; Giusti, E.; Ghio, S.; Marco, M. Moving and Stationary Targets Separation in SAR Signal Domain Using Parallel Convolutional Autoencoders with RPCA Loss. In Proceedings of the IEEE Radar Conference, New York, NY, USA, 21–25 March 2022; pp. 1–6. [Google Scholar]
- Guo, Y.; Liao, G.; Li, J.; Chen, X. A Novel Moving Target Detection Method Based on RPCA for SAR Systems. IEEE Trans. Geosci. Remote Sens. 2020, 58, 6677–6690. [Google Scholar] [CrossRef]
- Yang, Z.; Fan, L.; Yang, Y.; Yang, Z.; Gui, G. Generalized Singular Value Thresholding Operator Based Nonconvex Low-rank and Sparse Decomposition for Moving Object Detection. J. Frankl. Inst. 2019, 356, 10138–10154. [Google Scholar] [CrossRef]


| Parameters | Values |
|---|---|
| Bandwidth of RFI | 1 MHz |
| Carrier frequency of RFI | 5.305 GHz |
| Pulse bandwidth | 30 MHz |
| Pulse width | 41.74 |
| Sampling frequency | 32.317 MHz |
| Slant range | 988,647 m |
| Efficient velocity | 7000 m/s |
| PRF | 1256.98 Hz |
| Carrier frequency | 5.300 GHz |
| Method | FNF | TNF | Proposed Method | |
|---|---|---|---|---|
| Metric | ||||
| RMSE | SINR = 0 dB | 0.2168 | 0.1904 | 0.1578 |
| SINR = −10 dB | 0.2486 | 0.2089 | 0.2041 | |
| SINR = −20 dB | 0.2746 | 0.2594 | 0.2374 | |
| SINR = −30 dB | 0.3462 | 0.2896 | 0.2805 |
| Method | FNF | TNF | Proposed Method | |
|---|---|---|---|---|
| Metric | ||||
| Gray Level Entropy | 1.8533 | 2.5791 | 3.0041 | |
| Average Gradient | 2149.4930 | 2498.4109 | 2603.4083 | |
| Method | FNF | TNF | Proposed Method | |
|---|---|---|---|---|
| Metric | ||||
| Gray Level Entropy | 1.7385 | 2.3163 | 2.9481 | |
| Average Gradient | 1989.8290 | 2246.9515 | 2551.1923 | |
Disclaimer/Publisher’s Note: The statements, opinions and data contained in all publications are solely those of the individual author(s) and contributor(s) and not of MDPI and/or the editor(s). MDPI and/or the editor(s) disclaim responsibility for any injury to people or property resulting from any ideas, methods, instructions or products referred to in the content. |
© 2023 by the authors. Licensee MDPI, Basel, Switzerland. This article is an open access article distributed under the terms and conditions of the Creative Commons Attribution (CC BY) license (https://creativecommons.org/licenses/by/4.0/).
Share and Cite
Fu, Z.; Zhang, H.; Zhao, J.; Li, N.; Zheng, F. A Modified 2-D Notch Filter Based on Image Segmentation for RFI Mitigation in Synthetic Aperture Radar. Remote Sens. 2023, 15, 846. https://doi.org/10.3390/rs15030846
Fu Z, Zhang H, Zhao J, Li N, Zheng F. A Modified 2-D Notch Filter Based on Image Segmentation for RFI Mitigation in Synthetic Aperture Radar. Remote Sensing. 2023; 15(3):846. https://doi.org/10.3390/rs15030846
Chicago/Turabian StyleFu, Zewen, Hengrui Zhang, Jianhui Zhao, Ning Li, and Fengbin Zheng. 2023. "A Modified 2-D Notch Filter Based on Image Segmentation for RFI Mitigation in Synthetic Aperture Radar" Remote Sensing 15, no. 3: 846. https://doi.org/10.3390/rs15030846
APA StyleFu, Z., Zhang, H., Zhao, J., Li, N., & Zheng, F. (2023). A Modified 2-D Notch Filter Based on Image Segmentation for RFI Mitigation in Synthetic Aperture Radar. Remote Sensing, 15(3), 846. https://doi.org/10.3390/rs15030846