Abstract
Quantifying the urban supply and demand of carbon sequestration services is an important prerequisite for achieving global carbon neutrality goals. However, the spatiotemporal patterns for balancing the supply and demand of carbon sequestration services in urban agglomerations remain unclear. In this study, NPP/VIIRS nighttime light data were used to identify the carbon sequestration service demand and were then combined with the carbon sequestration service supply to analyze the spatiotemporal patterns of supply and demand for carbon sequestration services in the Harbin-Changchun urban agglomeration (HCUA) in Northeast China. Our results indicate that both the supply and demand of carbon sequestration services showed increasing trends from 2012 to 2020 in the HCUA. The regions with increasing supply and demand trends were mainly located in the eastern mountainous and western urban areas, respectively. The total supply and demand of carbon sequestration services in the HCUA were 2080.3 Mt·C yr−1 and 433.6 Mt·C yr−1, respectively. Carbon surpluses (supply > demand) were found in most areas (98%), although particularly in the southeastern mountainous region. However, with rapid urbanization, in most cities, the supply–demand ratio decreased from 2012 to 2020, and the proportion of carbon deficit regions showed a continuous increase, which was mainly distributed in newly developed urban areas. The low supply–high demand (L-H) pattern showed significant spatial mismatching for supply and demand in the HCUA. The proportion of regions with the L-H pattern also showed a rapidly increasing trend from 2012 to 2020, indicating a more obvious carbon deficit trend in the future. This study provides important guidelines for formulating effective policies for energy consumption and carbon sequestration to combat global warming under China’s rapid urbanization.
1. Introduction
Since the 21st century, large-scale energy consumption has led to a sharp increase in carbon emissions, and the over-exploitation of land has affected ecosystem structures and processes, which have had severe negative biological, environmental, and economic impacts such as global warming, biodiversity loss, a decrease in agricultural productivity, etc. [1,2,3,4]. Carbon sequestration capacity is the most important terrestrial ecosystem service for decreasing CO2 [5]. The supply–demand pattern of carbon sequestration services reflects the carbon balance of regional terrestrial ecosystems from the perspective of carbon sources and sinks [6] and is closely related to the strategic goal of achieving carbon neutrality in China. Urban areas are hotspots for human–nature conflicts and are also significant sources of carbon emissions. In addition, the increase in impervious surfaces during rapid urbanization could weaken the carbon sequestration capacity of ecosystems [7,8,9], which may worsen the gradual imbalance between the supply and demand of carbon sequestration services [10]. Therefore, the scientific quantification of urban supply and demand for carbon sequestration services can provide important support for the dynamic changes in carbon balance [11,12]. Moreover, it can provide the government with a scientific reference to optimize land-use patterns and develop energy-saving and CO2 emission reduction policies to achieve carbon neutrality.
Since the 1990s, most scholars have focused on the concept, structure, function, and research framework of carbon supply [13]. Many studies on carbon supply have mainly analyzed the spatiotemporal characteristics of carbon sequestration services and their driving mechanisms based on net primary productivity (NPP) data from MODIS remote sensing or CASA models [14,15,16,17]. Some studies have mapped the spatial distribution of supply and demand for carbon sequestration services separately, but the time span of their study was only one year [18,19], and few studies have combined carbon supply with the demand of carbon sequestration services and detected the changes in spatiotemporal patterns of the carbon supply–demand, which could result in the inability to accurately manage and restore ecosystems in areas where supply and demand are out of balance.
The scientific quantification of carbon demand is an important prerequisite to understanding the balance between supply and demand patterns of carbon sequestration services. The demand of carbon sequestration services is mostly measured by the products of population density and carbon emissions per capita [20,21,22,23], which considers carbon emissions from the perspective of population. However, it does not comprehensively consider various carbon emission sources, resulting in an underestimation of carbon emissions, and it could cause the relationship between the supply and demand of carbon sequestration services to deviate from reality. To accurately estimate carbon demand (CO2 emissions) at different spatial and temporal scales, many carbon emission products such as the Carbon Emission Accounting and Datasets (CEADs), Multi-resolution Emissions Inventory for China, and Emissions Database for Global Atmospheric Research have been widely introduced globally [24]. However, these statistical data can only provide values of CO2 emissions for large scales, such as national, provincial, or city administrative scales, and are rarely used for studies on gridded scales because of their limited spatial resolutions [25,26]. With the development of satellite technology, nighttime light data have been widely used for CO2 emission estimation, but satellite data also have several limitations. For example, NPP-VIIRS data have high gain settings that produce considerable background noise and other problems that affect the accuracy of CO2 emission estimation [27,28]. Therefore, designing a scientific and accurate method for estimating carbon emissions using nighttime light data is an important scientific issue for carbon supply–demand research.
In addition, China aims to achieve carbon neutrality before 2060, and information on the supply and demand of carbon sequestration services is very important for achieving carbon neutrality [29,30]. Urban agglomeration is a core spatial morphology that continuously promotes the concentrations of population and economy among neighboring cities and is an important spatial form of current urbanization. However, under rapid urbanization, the supply and demand pattern of carbon sequestration services in urban agglomerations is still not well understood. Therefore, to promote high-quality and low-carbon city development, exploring the spatial and temporal patterns of supply and demand for carbon sequestration services at the urban agglomeration scale is of great scientific significance.
The Harbin-Changchun urban agglomeration (HCUA), located in the temperate region of northeastern China, is a typical industrial urban area and is experiencing rapid urbanization. In this study, NPP data were obtained to present the carbon supply, and spatiotemporal carbon emissions were calculated by using the NPP/VIIRS nighttime light data and the city’s fuel-related energy statistical data. The objectives of this study were to: (1) analyze the spatiotemporal characteristics of the carbon supply pattern, (2) develop a model for estimating the carbon demand using NPP/VIIRS nighttime light data and investigate the changes in the carbon demand patterns of the urban agglomeration, and (3) explore the dynamic patterns of supply and demand of carbon sequestration services to answer the scientific question of “Could CO2 emissions be offset by ecosystem CO2 sequestration in the HCUA under China’s rapid urban expansion?”. In addition, we analyzed the inner mechanisms that promote the spatial and temporal changes of this supply and demand pattern in conjunction with land-use change trends, with the aim of providing recommendations for the formulation of low-carbon development strategies under China’s rapid urbanization.
2. Methods
2.1. Study Area
The HCUA is an important national and regional urban agglomeration in northeast China and is an important industrial base and food production area in China [31]. The HCUA consists of 10 prefecture-level cities and one autonomous prefecture, with a total area of approximately 51,100 square kilometers (Figure 1a). Based on its elevation, the HCUA has three landform types: plains (41.9%) in the southeast region, hills (39.1%) in the central region, and mountains (19%) in the southeast region (Figure 1c). Previously, the HCUA consisted mainly of farmlands in the northwest and woodlands in the southeast, with proportions of approximately 55% and 36%, respectively. Grasslands were sparsely distributed in several cities in the western part of the agglomeration, with a proportion of approximately 2%. Impervious surfaces were mainly clustered in the developed urban areas in the western part of the agglomeration, with a proportion of approximately 5% (Figure 1b). By the end of 2018, the resident population in the HCUA was approximately 46 million, with an urbanization rate of 58.8% in 2018 [31]. With the rapid advancement of urbanization in China, the regional economy and urban population in the HCUA have continued to grow, with a population growth rate of approximately 15% and a total GDP growth rate of approximately 48% from 2013 to 2020. This growth may cause a decline in ecological services and an increasing imbalance between ecological supply and demand.
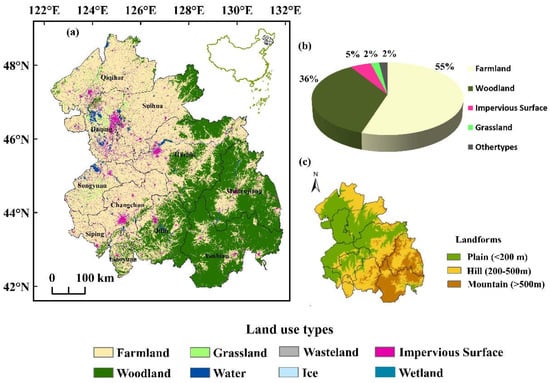
Figure 1.
(a) The land-use type and (b) distribution and (c) landforms of the study area.
2.2. Carbon Sequestration Services Supply: Net Primary Productivity (NPP)
NPP is the amount of organic dry matter produced by green plants per unit of time and area after deducting self-oxygenated respiration; it reflects the carbon sequestration capacity of the ecosystem, which is a common indicator of carbon sequestration service supply [32]. In this study, NPP data were obtained from MOD17A3 data (MODIS remote sensing images) products with a spatial resolution of 500 m × 500 m (Table 1) from NASA’s official website (https://search.earthdata.nasa.gov/ (accessed on 20 July 2022.)). The data were synthesized by summing the net photosynthesis (PSN) data (MOD17A2) at a temporal resolution of eight days, where the PSN data were the difference between the gross primary productivity (GPP) and maintenance respiration (MR). The data were preprocessed according to the synthesized NPP data, and the average daily NPP data were calculated based on the number of MOD17A2 data products (47 frames) for each year, because the starting date of the vegetation growing season (DOY) was distributed between 130–150 and the ending date between 260–280 in the Northeast Plain region [33]. A total of 23 frames were selected between the vegetation growing season (4.7–10.7), spanning 182 days, and the product of the daily average NPP and the number of days in the growing season in the Northeast Plains were used as the annual NPP data.

Table 1.
The basic information of data.
2.3. Carbon Sequestration Services Demand: Estimation of Pixel-Based CO2 Emissions
From the perspective of carbon neutrality, the carbon sequestration services demand is affected by CO2 emissions. An increase in carbon emissions results in an increase in the demand of carbon sequestration services. Therefore, the spatial carbon emissions data were adopted to quantify carbon demand in our study, and they were obtained by fitting the nighttime light data to CO2 emissions data from the energy consumption of each city. Remote sensing images, with a spatial resolution of 500 m × 500 m, for NPP/VIIRS nighttime light data [34] were obtained from the Colorado School of Mines (http://eogdata.mines.edu/products/vnl/ (accessed on 5 July 2022.)), and the annual data chosen for the study were synthesized from monthly data. The CO2 emissions from energy consumption in each city were obtained from the CEADs (http://www.ceads.net.cn/ (accessed on 10 July 2022.)), which were estimated with high accuracy using the IPCC inventory method [35,36].
The remote sensing image of the NPP/VIIRS nighttime light for carbon sequestration services demand had problems that needed corrections, and these included background noise [24], high value anomalies caused by transient light sources [37,38], and sharp fluctuations in the brightness values of urban areas [39]. The images were preprocessed orderly by background noise removal, brightness anomaly removal, and logarithmic transformation to improve the fitting accuracy of the carbon emissions data [27,40]. The carbon emissions estimation models were then established by using the total NPP/VIIRS Digital Number (DN) and the CO2 emissions from the energy consumption of 11 cities from 2012 to 2017. The CO2 emissions of each county (transformation of spatial scale to city level) were used to compare with the CO2 emissions from energy consumption fitted to verify the fitting accuracy. The CO2 emissions from energy consumption were then multiplied by the mass fraction of carbon in CO2 molecules (0.273) to obtain the final carbon emission data.
2.4. The Supply–Demand Pattern of Carbon Sequestration Services
2.4.1. Supply–Demand Ratio (SDR)
The SDR of carbon sequestration services can quantitatively describe the balance between regional supply and demand and reveal the distribution of carbon surplus and deficit [41]. The calculation formula is as follows:
where SDR is the supply–demand ratio for ecosystem services; S and D are the supply and demand for ecosystem services, respectively; Smax and Dmax are the maximum values of supply and demand, respectively. SDR > 0 indicates a supply surplus, SDR < 0 indicates a supply deficit, and SDR = 0 indicates a balance between supply and demand.
2.4.2. Spatial Matching Patterns of Carbon Sequestration Services
The z-score standardization was used to standardize the supply and demand of ecosystem services [42], with supply and demand plotted on the x-axis and y-axis, respectively, and then divided into four spatial matching patterns based on 4 quadrants: high supply–high demand (H–H), low supply–low demand (L–L), low supply–high demand (L–H), and high supply–low demand (H–L). The calculation is expressed as follows:
where x is the standardized supply and demand for each grid cell; is the supply and demand for the i-th grid cell; is the mean of the supply and demand for each grid cell; s is the standard deviation of the supply and demand for each grid cell; n is the total number of grid cells.
3. Results
3.1. Spatiotemporal Characteristics of Carbon Sequestration Services Supply and Demand
The supply of carbon sequestration services was equally divided into 5 levels based on the distribution range of supply and demand (Table 2). Overall, the supply of carbon sequestration services showed significant spatial heterogeneity, with a distribution pattern of “high in the southeast and low in the northwest” (Figure 2). The distribution of supply was closely related to the elevation and land-use types of the HCUA.

Table 2.
Five levels of supply and demand.
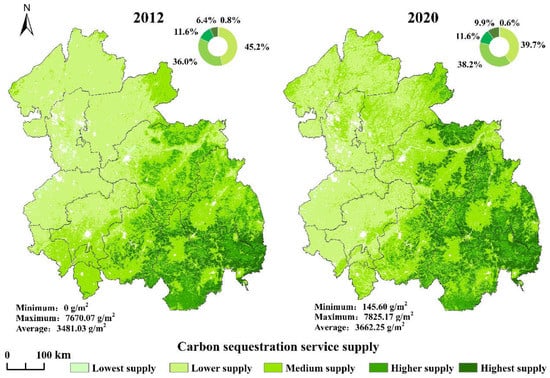
Figure 2.
The spatial and temporal patterns of carbon sequestration service supply.
The total supply of carbon sequestration services in the HCUA was 2015.3 Mt·C yr−1 in 2012, 2105.4 Mt·C yr−1 in 2017, and 2120.2 Mt·C yr−1 in 2020. The supply increased, with the average supply increasing from 3481.03 g·C/m2 in 2012 to 3662.25 g·C/m2 in 2020. The proportion of regions with lower supply decreased from 45.2% in 2012 to 39.7% in 2020. Meanwhile, the proportion of regions with higher and the highest supply increased from 18% to 21.5% from 2012 to 2020, indicating that the supply capacity of carbon sequestration services increased. The regions with a decreasing supply were mainly distributed in the south agroforestry ecotone, whereas the areas with an increasing supply were mainly distributed in the southeast mountainous area, indicating that the changes of supply were influenced by a combination of elevation and land-use types (Figure 2). In addition, the vegetation on mountains with higher elevation were less affected by human activities, causing an increase in supply, whereas the lower elevation areas might have been positively or negatively impacted by human activities, thus causing uncertainty in the supply change trend.
A linear model was established between the NPP/VIIRS DN and the CO2 emissions from energy consumption, as shown in Figure 3a. In addition, a comparison of the CEADS county CO2 emissions and the fitted CO2 emissions in the HCUA (Figure 3b) showed that the model can be used for the spatial estimation of carbon emissions, with a high accuracy of 76%. The lower demand areas were widely distributed, accounting for approximately 97.2% of the total area, indicating that the demand of carbon sequestration services was dominated by lower demand. The demand areas of the other types were mainly concentrated as patches within the western developed urban areas, with a total average proportion of approximately 2.8% (Figure 4). The total demand of carbon sequestration services in the HCUA was 308.9 Mt·C yr−1 in 2012, 461.9 Mt·C yr−1 in 2017, and 529.9 Mt·C yr−1 in 2020. Overall, the demand of carbon sequestration services increased, with an average pixel value of 145.69 g·C/m2 in 2012 to 249.88 g·C/m2 in 2020. Regions with the highest demand expanded in the western developed urban areas, with the proportion of regions increasing by 0.2% (from 0.1% to 0.3%) from 2012 to 2020 (Figure 4). The regions with increasing demand were mainly located in city centers and their surrounding areas in the western plain with low elevation (Figure 4).
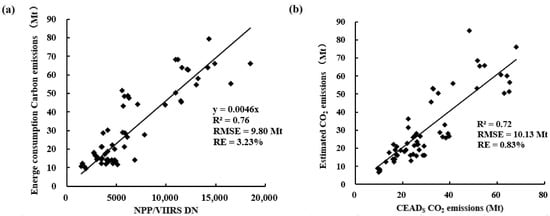
Figure 3.
(a) Fitting model of energy consumption carbon emissions and (b) accuracy verification.
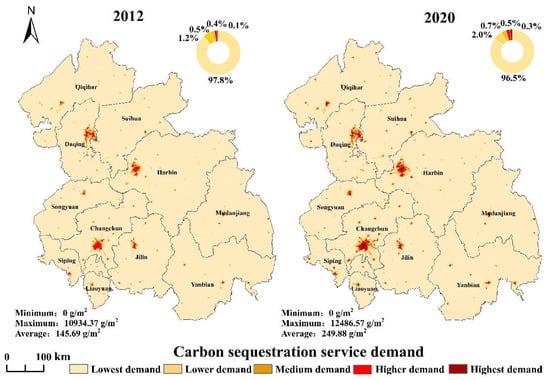
Figure 4.
The spatial and temporal patterns of carbon sequestration service demand.
The lowest supply of carbon sequestration services was found in agricultural plains, accounting for 44.8% of the total area. The regions with the highest supply were mainly in the mountainous woodland areas, and the regions with medium supply were mainly in hills bordered by woodlands and farmlands, the supply increased with increasing elevation (Figure 5a). By contrast, we found that the demand decreased with increasing elevation (Figure 5c). The proportion of regions with higher and highest demand decreased from plains to hills to mountains (Figure 5d).
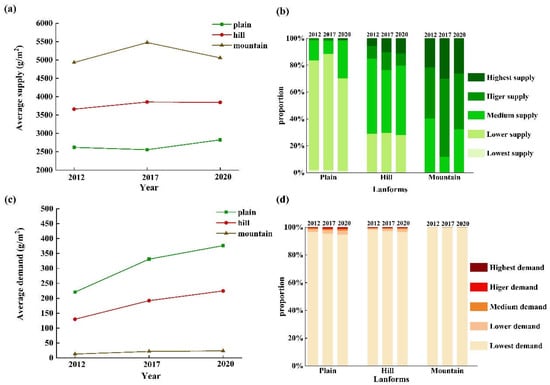
Figure 5.
(a,b) The temporal variations of the average and frequency for the supply and (c,d) demand in different landforms from 2012 to 2020.
3.2. Spatial and Temporal Characteristics of the Supply–Demand Pattern
Supply and demand were characterized by significant spatial heterogeneity among the different cities (Figure 6a). In most cities, the supply was much higher than the demand. The average annual supply ranged from 2550 g·C/m2 in higher supply cities to 550 g·C/m2 in lower supply cities, whereas the average annual demand in higher and lower demand cities was approximately 555 g·C/m2 and 80 g·C/m2, respectively. From 2012 to 2020, the supply either increased, decreased, or stabilized in each city, whereas the demand increased in all cities, and the average annual rate of demand increase was approximately 14.8 g·C/m2·a−1 (Figure 6b).
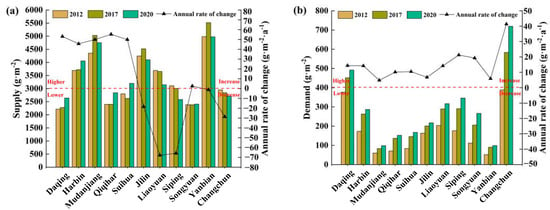
Figure 6.
Supply (a) and demand (b) and their annual rate of change in each city.
Most regions in the HCUA had a carbon surplus, with an average proportion of 98.5% (Figure 7). In the carbon surplus regions, the SDR in the southeast region was higher than that in the northwest region. The areas with an SDR between 0 and 0.3 were mainly located in the northwest plains of the HCUA, with an average proportion of 48.2%. Areas with an SDR from 0.3 to 0.6 were mainly located in the hills and mountains in the southeast, with an average of 41.6%, and areas with an SDR > 0.6 were mainly located in the mountains in the southeast, with an average of 8.8%, indicating that most of the areas in the HCUA had a low or medium carbon surplus, and the SDR increased as elevation increased. The distribution of areas with a carbon deficit was consistent with the distribution of the higher and highest demand, mainly concentrated as patches in developed urban areas, and a few carbon deficit areas were distributed as points in each city, with a total proportion of 1.5%. The SDR of carbon sequestration services decreased from 2012 to 2020, with the average SDR decreasing from 0.36 in 2012 to 0.34 in 2020. The carbon surplus areas gradually decreased, with the high SDR (SDR > 0.3) areas showing the most obvious decrease. In contrast, the carbon deficit areas gradually increased. From 2012 to 2020, the proportion of areas with an SDR of < 0 increased by 0.6% and those with an SDR of 0 to 0.3 increased by 1%, whereas those with an SDR of 0.3 to 0.6 decreased by 2%, indicating that the level of carbon surplus in the HCUA decreased and tended to change to a carbon deficit.
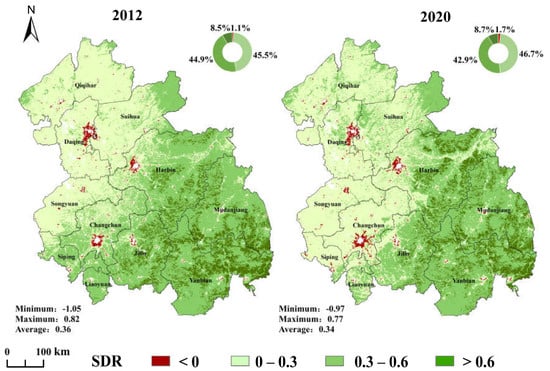
Figure 7.
The spatial and temporal patterns of the carbon sequestration service supply–demand ratio.
The SDR showed significant spatial heterogeneity among the different cities (Figure 8a). The average SDR ranged from 0.23 to 0.44, indicating that the current carbon budgets in the HCUA were sufficient. However, some regions still had carbon deficits (SDR < 0), particularly those in the western urban areas. In addition, we found that the proportion of carbon deficit areas decreased as elevation increased (Figure 8b) in the order of plains (2.3%), hills (0.9%), and mountains (0.05%).
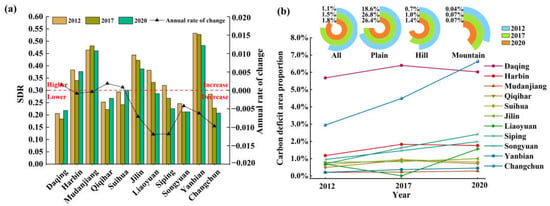
Figure 8.
(a) The supply–demand ratio and their annual rate of change; (b) the temporal variations of the carbon deficit area proportion in each city and landforms from 2012 to 2020.
The SDR of most cities decreased, indicating an increasing imbalance between the supply and demand of carbon sequestration services in the HCUA. The carbon deficit areas in the HCUA tended to increase, from 1.1% in 2012 to 1.8% in 2020, and the carbon deficit areas of most cities increased annually, with the largest increase reaching 4.0% in Changchun from 2012 to 2020, particularly for cities in the western plains. Changchun is an important industrial base in northeast China, and has experienced rapid economic development in recent years. However, the type of economic development was industrialized development, which mainly relied on the traditional automotive industry, equipment manufacturing industry, and other industries that require large amounts of energy consumption, but the industrial structure has not been adjusted in time, leading to excessive emissions of carbon dioxide and a significant expansion of carbon deficit areas. Moreover, the proportion of regions with carbon deficit increased more in plains than in hills and mountains (Figure 8b).
The spatial matching pattern of supply and demand occurred mainly as the L–L pattern, with a proportion of 52.7% and 50.4% in 2012 and 2020, respectively (Figure 9). The L–L pattern was mainly distributed in the northwestern agricultural region and a small proportion was distributed as patches or points in the southeast region. The proportion of regions with H–H patterns were the smallest, with 1.1% and 1.2% in 2012 and 2020, respectively.
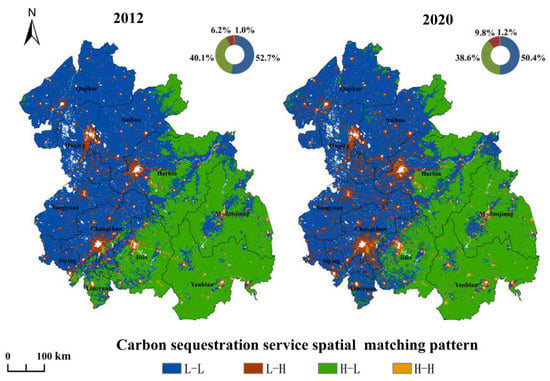
Figure 9.
The spatial matching pattern of supply and demand.
Supply and demand presented significant spatial mismatching with the L–H and H–L patterns. The L–H pattern was mainly distributed as patches in the western developed urban areas. The proportion of regions with the L–H pattern increased obviously from 6.2% in 2012 to 9.8% in 2020. The H–L pattern was mainly distributed in the southeast mountainous regions. The proportion of regions with the H–L pattern decreased from 40.1% in 2012 to 38.7% in 2020. Overall, the areas with spatial mismatching between supply and demand gradually increased from 2012 to 2020.
4. Discussion
4.1. The Spatial and Temporal Pattern of Supply and Demand
The land-use data for 2012, 2017, and 2020 were based on all the available Landsat SR data on Google Earth Engine (GEE) and were obtained using a random forest classifier, which was used to explore the intrinsic mechanism for the spatiotemporal formation of the supply–demand pattern. The carbon supply and demand were most closely related to land-use types such as farmlands, grasslands, woodlands, and impervious surfaces. The area of farmland and woodland in the HCUA did not change significantly from 2012 to 2020; however, the grassland area decreased while the impervious surface area gradually increased from 2012 to 2020 (Figure 10). Combined with the spatial and temporal patterns of supply and demand for carbon sequestration services, the regions with a high supply were consistent with the distribution characteristics of natural forests in our study area [43]. The land-use types in the northwest region were mainly farmlands and grasslands, and land-use types in the southeast were mainly woodlands. Forests have a higher carbon sequestration capacity than farmlands and grasslands, causing a “high southeast and low northwest” distribution of carbon sequestration service supply. Some cities were affected by the policy of returning farmland to woodland, which increased the area of forests in some cities and restored the ecological functions of forests in ecologically fragile areas, causing an increase in supply. In contrast, other cities were affected by urbanization, which increased the area of impervious surfaces and reduced the area of grasslands or forests, causing a decrease in the supply.
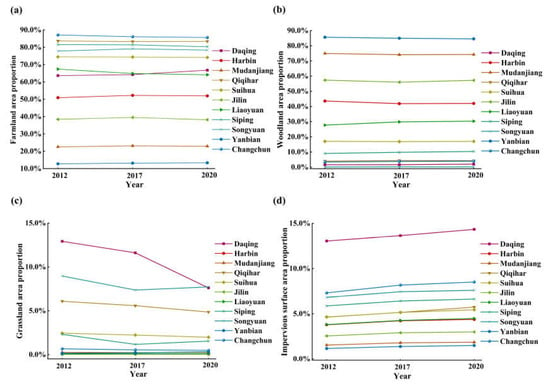
Figure 10.
(a) The temporal variations of farmlands, (b) woodlands, (c) grasslands, and (d) impervious surfaces in each city from 2012 to 2020.
High demand mainly occurred in urban areas, and the land-use type was mainly impervious surface. Low demand mainly occurred in suburban and rural areas, and the land-use type was mainly farmland and woodland. This spatial pattern was consistent with the spatial pattern of economic development [44]. The developed urban areas had higher levels of population, economic development, and urbanization rates. In addition, the levels of energy consumption and industrial activity were higher than other areas and were also influenced by the agglomeration effect of industries, resulting in these areas having a high demand of carbon sequestration services. In recent years, the population and GDP of the HCUA have continued to grow, and the energy consumption pattern cannot be adjusted and optimized over a short time period. While impervious surfaces continued to expand, farmlands and grasslands were continuously being transformed to accommodate urban construction, which led to the growing demand of carbon sequestration services.
The spatial patterns and temporal variations of the carbon surplus and deficit areas were mainly influenced by the spatial distribution patterns of supply and demand for carbon sequestration services, with similar spatial patterns and temporal variations. With the development of the urban economy and the expansion of urban impervious surfaces, human activities resulted in a reduction of vegetation coverage, which in turn led to a decrease in supply and an increase in demand. These results were consistent with a finding that showed an inverse curve between the supply of carbon sequestration services and the level of economic development under increasing urbanization [45], which led to a decrease in the SDR and an increase in the proportion of carbon deficit areas. This condition inevitably exacerbates the spatial imbalance between the supply and demand of carbon sequestration services [46].
4.2. The Spatial Matching Pattern of Supply and Demand
The economic development level and carbon sequestration capacity of vegetation in the northwest region of the HCUA were both low, resulting in the L–L pattern in these regions. The developed urban areas had high levels of economic development, industrialization, and population density, resulting in high carbon emissions. In addition, the increase in concentrated impervious surfaces also caused encroaching on the area of vegetation coverage, which was less effective in carbon sequestration. This resulted in the L–H pattern in areas with low carbon sequestration and high carbon emissions. The H–H pattern was mainly present in the developed urban areas with high vegetation coverage and functioning ecosystems. The southeast region had high forest cover and well-established natural ecological reserves. As ecological barriers in northeast China, forests are effective in absorbing carbon and play an important role in maintaining water and soil and improving micro-climates [47]. In addition, the region had a low population density and small-scale energy and industrial sectors; thus, the natural environment was less affected by human activity, resulting in low carbon emissions, and thus, the southeastern region was dominated by the H–L pattern.
The main types of land-use change in the HCUA were the conversion of woodland, grassland, and farmland into each other. The proportion of land conversion to farmland (50.5%) was higher than the conversion from farmland (33.1%). The conversion types also included the conversion of farmland and grassland to impervious surfaces, with a proportion of 15.1% (Figure 11a). The spatial matching pattern of supply and demand for carbon sequestration services mainly showed negative changes, such as the L–L pattern to the L–H pattern and the H–L pattern to the L–L pattern, with a proportion of 63.4%. Positive changes such as the change in the L–L pattern to the H–L pattern and the L–H pattern to the L–L pattern accounted for 25.2% (Figure 11b). The negative change in the spatial pattern of the region mainly showed a decrease in the supply level and an increase in the demand level. The decrease in the supply level was mainly attributed to two reasons: first, the northeast region of China is the main grain production base. To guarantee China’s food security and protect the red line of arable land, since 2008, China suspended a large-scale project for returning arable land to forest, causing the conversion of other land-use types to farmlands. Because the carbon sequestration capacity of farmlands is not as good as woodlands, this conversion negatively affects vegetation carbon sequestration and the ecological environment. Second, some studies have shown that a CNY 4 trillion investment and large real estate development had a significant negative impact on ecosystem conservation [48]. Although cities were the areas where CO2 emissions were most concentrated, urban impervious surfaces continuously encroached on urban farmlands and forests, and this reduction in vegetation coverage weakened the ability to fix carbon in these areas. In addition, similar results suggested that the significant degradation of ecosystem functioning was occurring in areas with concentrated land development and use [49]. The increase in demand levels was mainly due to increased urbanization, the gradual increase in the consumption of fossil fuels in developed urban areas, and the adoption of the traditional crude economic development model to meet continued economic growth, which caused rapid growth in CO2 emissions. The main reason for the positive change was the increase in the supply level of the spatial pattern of the region. The implementation of the “Wetland Reserve Construction Project” and the “Water into Wetlands Project” in northeast China significantly improved wetland functioning and significantly enhanced vegetation carbon sequestration in wetlands. In addition, in recent years, China has vigorously called for the construction of an ecological civilization, and the construction of urban ecosystems has been steadily promoted, causing an improvement in the urban ecological network.

Figure 11.
(a) Types of change of land-use types and (b) spatial matching pattern of supply and demand; W is for woodland, G is for grassland, F is for farmland, and I is for impervious surface.
4.3. Policy Implications
The carbon sink areas (H–L) were mainly located in the southeastern part of the HCUA, which had a large vegetation coverage but backward economy, such as Mudanjiang and Yanbian, which should appropriately reduce sources and increase sinks while stabilizing ecological benefits, establishing a series of low-carbon industrial chains, and promoting green economic development. Specifically, these areas have abundant natural landscape resources due to the high elevation, and tourism can be developed appropriately to promote local economic development. The government should make full use of the advantages of the local carbon surplus; for example, it can appropriately increase the construction scale of energy-producing enterprises and factories to relieve the pressure of the carbon deficit area. Impervious surface areas increased annually, whereas grassland and woodland areas gradually decreased, indicating that urban construction land expanded in the HCUA, which led to the expansion of carbon source areas (L–H) in the developing urban areas (e.g., Songyuan, Jilin, Liaoyuan, and Siping). Coordination between economic development and ecological environment protection is key to solving the imbalance between the supply and demand of carbon sequestration services and to achieving sustainable urban development. First, we recommend that urban greening construction should be strengthened in these regions, especially in the industrially developed areas, which generally had the highest economic activity, concentrated energy consumption, and carbon emissions; for example, the government can increase land types with good carbon sink capacity, such as woodland, and enhance carbon sink benefits by reorganizing ecological corridors and carbon sink patches. Second, land-use planning should reduce the conversion of areas with high carbon sequestration to construction land to curb the expansion of carbon deficit areas; thus, we should strictly delineate the protection isolation line and buffer zone and form a layout in which farmland, woodland, and grassland are mixed in a reasonable proportion. Third, the government should consider promoting green and low-carbon development policies when driving economic growth; for example, the structure of the energy industry should be reformed and a low-carbon economy should be promoted. A green economy with low energy consumption and low pollution is necessary for coping with global warming. However, coal remains the dominant source of energy for most cities in China [50]. Therefore, to significantly reduce CO2 emissions, energy systems should be optimized, and fossil fuels should be replaced with cleaner and more renewable energy sources, such as natural gas, nuclear power, offshore wind, and hydroelectricity [51]. In addition, we should reduce the proportion of traditional high-energy consumption and high-emissions industries, such as iron and steel, cement, and chemical industries, and vigorously develop clean energy to promote the low-carbon transformation of industries. With the restructuring of energy consumption, the industrial structure should gradually change from high-energy consumption industries to high-tech, knowledge-intensive, and modern service industries. Finally, public consumer behavior, such as the use of high-tech energy-saving products, conductive to a low-carbon and sustainable lifestyle needs to be encouraged [51]. For the two types of mismatched areas (H–L, L–H), the government must establish regional compensation mechanisms and policies based on carbon sequestration services at the intra-city and inter-city levels; it is urgent to establish compensation policies between the southeastern and northwestern cities of the HCUA to achieve the goal of integrated development of the HCUA in the short term. Specifically, the establishment of a CO2 emission market or CO2 offset market could be considered to build in the middle of HCUA to coordinate the carbon budgets among cities.
The L–L pattern was mainly present in the northwest region, such as Qiqihar and Suihua, which was dominated by farmlands that had weak carbon sequestration capacities and fragile ecosystems. The carbon sequestration service demand was also low due to the low level of economic development. For this area, the government should first develop its advantageous industries such as agriculture and combine modern technology to upgrade traditional agriculture that could promote its economic development. Moreover, the government should enhance the construction and management of ecological protection due to its unconcentrated urban architecture to reduce human interference and damage to the natural environment, and ecological protection areas could significantly improve the local carbon sequestration capacity [52]. The H–H pattern was mainly present in the developed urban areas (e.g., Changchun, Daqing, and Harbin). These areas had high levels of economic development and population gathering, and land-use planning and resource allocation were also reasonable. In these areas, the government should control regional population, accelerate the green transformation of regional industries, and design good carbon trading and carbon offsets to establish a demonstration area for the coordinated development of human and land and a well-established carbon tax system, and well-designed carbon trading and carbon offsetting will promote enterprises to innovate technology and adopt cleaner energy to reduce CO2 emissions [53]. The demonstration area should incorporate ecosystem carbon sinks into the carbon trading market and set up legal persons to manage woodlands, grasslands, wetlands, and farmlands to promote the marketization and valorization of carbon sink benefits and enhance the financialization of the carbon market, which could promote the simultaneous enhancement of ecological and socio-economic benefits [54].
5. Conclusions
This study quantified the supply and demand of carbon sequestration services in the HCUA from 2012 to 2020 using remote sensing images at a 500 m spatial resolution scale. We applied the SDR to visualize the supply–demand pattern to further explore the spatial matching pattern of supply and demand. Several conclusions may be derived from our results:
- (1)
- The supply of carbon sequestration services showed a distribution pattern of “high in the southeast with high elevation and low in the northwest with low elevation”. From 2012 to 2020, the supply of carbon sequestration services increased in eastern mountainous areas and decreased in the regions with lower elevation.
- (2)
- The demand of carbon sequestration services was low in the southeast with high elevation and high in the northwest with low elevation. The demand of carbon sequestration services increased, particularly in the western developed urban areas.
- (3)
- Most of the areas had a carbon surplus, and areas in the HCUA with carbon surplus decreased and tended to convert to carbon deficit areas. Under rapid urbanization, the SDR decreased annually and the carbon deficit areas increased continuously, which were mainly distributed as patches in the developed urban areas and its surrounding areas.
- (4)
- The spatial matching pattern of the carbon sequestration services was dominated by the L–L pattern, occurring mainly in the northwest and southeast regions. The L–H pattern showed significant spatial mismatching between supply and demand in the HCUA. The proportion of regions with the L–H pattern increased obviously from 2012 to 2020, and the carbon deficit tended to be more obvious. The results of our study provide important guidelines for the implementation of low-carbon development strategies under China’s rapid urbanization.
Because of limited NPP-VIIRS light data for 2012 to 2020, this study was conducted as a short-term study. A longer-term study of the supply and demand for carbon sequestration services should be undertaken in future studies to explore the changes in spatial and temporal patterns and its driving mechanisms over a longer period and larger area. In addition, the MOD17A3 data product used in this study to reflect the spatial and temporal patterns of NPP had a small range of null values in the built-up areas of the city. In addition, the CO2 emission fittings that were based on nighttime light data only reflected the CO2 emission in the lit areas, and the CO2 in the few unlit areas, where industrial activities were concentrated and population density was high, was ignored or could not be estimated [24]. However, when combined with the characteristics of the nighttime light data and the urban agglomeration, the little CO2 emission that may have existed in unlit areas had little impact on the accuracy of the spatial pattern of demand for carbon sequestration services. If a more detailed analysis needs to be made for a smaller area, such as a city or county, a more scientific and accurate quantification method of CO2 emission should be devised, and NPP in built-up areas should be considered to further improve the quantitative accuracy of the supply and demand of carbon sequestration services in the future.
Carbon sequestration services are mobile and have complex flow processes. When the supply of a region is greater than the demand, a spillover phenomenon often occurs, with supply services for neighboring regions. From the results of this study, we observed that the supply of the carbon sequestration services in the HCUA was significantly higher than the demand, suggesting that there was a certain spillover of carbon sequestration services in this region. The subsequent study should start from the mobility of carbon sequestration services and accurately identify the boundary of supply and demand services; high-resolution remote sensing images and the accurate model can be used to scientifically quantify the flow, flow direction, and flow rate of the service flow and then clarify the specific operation mode of the cascade effect for the flow of carbon sequestration services [55,56].
There are many factors that contribute to the temporal and spatial heterogeneity of carbon sequestration services. From the supply side, meteorological factors such as temperature, precipitation, humidity, etc.; soil factors such as soil organic matter content, soil pH, soil water availability, etc.; and vegetation factors such as tree species and age and the growth time of grassland [57,58,59] all affect the function and growth of vegetation and the carbon sequestration capacity of vegetation. From the demand side, socio-economic factors such as population density, GDP, urbanization rate, etc., and urban form factors [60] such as building density and building height are closely related to carbon emissions from energy consumption. Therefore, exploring the driving mechanisms of the spatial and temporal heterogeneity of supply and demand for carbon sequestration services in urban areas is one of the important aspects of future research, and combining various key factors and their synergistic relationships will help urban areas to formulate effective policies to achieve low-carbon development.
Author Contributions
Conceptualization, W.H. and Z.R.; methodology, W.H., Z.R. and G.B.; software, W.H.; validation, Y.D., Y.G., G.W. and C.W.; formal analysis, W.H., G.B. and Z.R.; data curation, Z.R. and G.B.; writing—original draft preparation, W.H.; writing—review and editing, Z.R. and G.B.; visualization, W.H.; supervision, Z.R.; project administration, Z.R.; funding acquisition, Z.R. and Y.D. All authors have read and agreed to the published version of the manuscript.
Funding
This work was supported by the Youth Innovation Promotion Association of Chinese Academy of Sciences (Grant No. 2020237), the National Natural Science Foundation of China (Grant No. 32130068 and 42171109), Natural Science Foundation of Hainan provinces (grant No. 422QN306), and the Youth Innovation Promotion Association of Chinese Academy of Sciences (Grant No. 2019234).
Data Availability Statement
The data that support the findings of this study are available from the author 1, [W.H], upon reasonable request.
Acknowledgments
With many thanks to my research group members (Northeast Institute of Geography and Agroecology, Chinese Academy of Sciences), Peng Zhang, Zijun Ma and Shengyang Hong, for their revision suggestions.
Conflicts of Interest
The authors declare no conflict of interest.
References
- Coutts, A.; Beringer, J.; Tapper, N. Changing Urban Climate and CO2 Emissions: Implications for the Development of Policies for Sustainable Cities. Urban Policy Res. 2010, 28, 27–47. [Google Scholar] [CrossRef]
- Verburg, P.H.; van de Steeg, J.; Veldkamp, A.; Willemen, L. From land cover change to land function dynamics: A major challenge to improve land characterization. J. Environ. Manag. 2009, 90, 1327–1335. [Google Scholar] [CrossRef]
- Cerretelli, S.; Poggio, L.; Gimona, A.; Yakob, G.; Boke, S.; Habte, M.; Coull, M.; Peressotti, A.; Black, H. Spatial assessment of land degradation through key ecosystem services: The role of globally available data. Sci. Total Environ. 2018, 628–629, 539–555. [Google Scholar] [CrossRef]
- Jeswani, H.K.; Hellweg, S.; Azapagic, A. Accounting for land use, biodiversity and ecosystem services in life cycle assessment: Impacts of breakfast cereals. Sci. Total Environ. 2018, 645, 51–59. [Google Scholar] [CrossRef]
- Piao, S.L.; Yue, C.; Ding, J.Z.; Guo, Z.T. The role of terrestrial ecosystem carbon sink in the goal of “carbon neutrality”. China Sci. Earth Sci. 2022, 52, 1419–1426. [Google Scholar]
- Ma, L.; Liu, H.; Peng, J.; Wu, J. A review of ecosystem services supply and demand. Acta Geogr. Sin. 2017, 72, 1277–1289. [Google Scholar]
- Cong, W.C.; Sun, X.Y. A Study on Carbon Sequestration Capacity Based on GIS and InVEST Model in Rizhao City. Bull. Soil Water Conserv. 2018, 38, 200–205. [Google Scholar]
- Estoque, R.C.; Murayama, Y. Examining the potential impact of land use/cover changes on the ecosystem services of Baguio city, the Philippines: A scenario-based analysis. Appl. Geogr. 2012, 35, 316–326. [Google Scholar] [CrossRef]
- Schroter, M.; Barton, D.N.; Remme, R.P.; Hein, L. Accounting for capacity and flow of ecosystem services: A conceptual model and a case study for Telemark, Norway. Ecol. Indic. 2014, 36, 539–551. [Google Scholar] [CrossRef]
- Yan, Z.; Xia, L.; Xiang, W. Analyzing spatial patterns of urban carbon metabolism: A case study in Beijing, China. Landsc. Urban Plan. 2014, 130, 184–200. [Google Scholar]
- Li, X.; Wu, K.N.; Feng, Z.; Wang, Y.H. Carbon balance in Henan Province from the perspective of carbon sequestration service supply and demand. Acta Geogr. Sin. 2022, 23, 9627–9635. [Google Scholar]
- Burkhard, B.; Kroll, F.; Nedkov, S.; Mueller, F. Mapping ecosystem service supply, demand and budgets. Ecol. Indic. 2012, 21, 17–29. [Google Scholar] [CrossRef]
- Zhai, T.; Wang, J.; Jin, Z.; Qi, Y.; Fang, Y.; Liu, J. Did improvements of ecosystem services supply-demand imbalance change environmental spatial injustices? Ecol. Indic. 2020, 111, 106068. [Google Scholar] [CrossRef]
- Fu, Y.C.; Lu, X.Y.; Zhao, Y.L.; Zeng, X.T.; Xia, L.L. Assessment Impacts of Weather and Land Use/Land Cover (LULC) Change on Urban Vegetation Net Primary Productivity (NPP): A Case Study in Guangzhou, China. Remote Sens. 2013, 5, 4125–4144. [Google Scholar] [CrossRef]
- Neumann, M.; Moreno, A.; Thurnher, C.; Mues, V.; Harkonen, S.; Mura, M.; Bouriaud, O.; Lang, M.; Cardellini, G.; Thivolle-Cazat, A.; et al. Creating a Regional MODIS Satellite-Driven Net Primary Production Dataset for European Forests. Remote Sens. 2016, 8, 554. [Google Scholar] [CrossRef]
- Shang, E.P.; Xu, E.Q.; Zhang, H.Q.; Liu, F. Analysis of Spatiotemporal Dynamics of the Chinese Vegetation Net Primary Productivity from the 1960s to the 2000s. Remote Sens. 2018, 10, 860. [Google Scholar] [CrossRef]
- Potter, C.S.; Randerson, J.T.; Field, C.B.; Matson, P.A.; Vitousek, P.M.; Mooney, H.A.; Klooster, S.A. Terrestrial Ecosystem Production—A Process Model-Based on Global Satellite and Surface Data. Glob. Biogeochem. Cycles 1993, 7, 811–841. [Google Scholar] [CrossRef]
- Baro, F.; Haase, D.; Gomez-Baggethun, E.; Frantzeskaki, N. Mismatches between ecosystem services supply and demand in urban areas: A quantitative assessment in five European cities. Ecol. Indic. 2015, 55, 146–158. [Google Scholar] [CrossRef]
- Larondelle, N.; Lauf, S. Balancing demand and supply of multiple urban ecosystem services on different spatial scales. Ecosyst. Serv. 2016, 22, 18–31. [Google Scholar] [CrossRef]
- Liu, L.C.; Liu, C.F.; Wang, C.; Li, P.J. Supply and demand matching of ecosystem services in loess hilly region: A case study of Lanzhou. Acta Geogr. Sin. 2019, 74, 1921–1937. [Google Scholar]
- Xue, D.; Wang, Z.J.; Li, Y.; Liu, M.X.; Wei, H.J. Assessment of Ecosystem Services Supply and Demand (Mis)matches for Urban Ecological Management: A Case Study in the Zhengzhou-Kaifeng-Luoyang Cities. Remote Sens. 2022, 14, 1703. [Google Scholar] [CrossRef]
- Zhang, P.; Liu, S.; Zhou, Z.; Liu, C.; Xu, L.; Gao, X. Supply and demand measurement and spatio-temporal evolution of ecosystem services in Beijing-Tianjin-Hebei Region. Acta Ecol. Sin. 2021, 41, 3354–3367. [Google Scholar]
- Gonzalez-Garcia, A.; Palomo, I.; Gonzalez, J.A.; Lopez, C.A.; Montes, C. Quantifying spatial supply-demand mismatches in ecosystem services provides insights for land-use planning. Land Use Policy 2020, 94, 104493. [Google Scholar] [CrossRef]
- Luo, Z.; Wu, Y.; Zhou, L.; Sun, Q.; Yu, X.; Zhu, L.; Zhang, X.; Fang, Q.; Yang, X.; Yang, J.; et al. Trade-off between vegetation CO2 sequestration and fossil fuel-related CO2 emissions: A case study of the Guangdong-Hong Kong-Macao Greater Bay Area of China. Sustain. Cities Soc. 2021, 74, 103195. [Google Scholar] [CrossRef]
- Han, P.F.; Lin, X.H.; Zeng, N.; Oda, T.; Zhang, W.; Liu, D.; Cai, Q.X.; Crippa, M.; Guan, D.B.; Ma, X.L.; et al. Province-level fossil fuel CO2 emission estimates for China based on seven inventories. J. Clean. Prod. 2020, 277, 123377. [Google Scholar] [CrossRef]
- Jing, Q.N.; Bai, H.T.; Luo, W.; Cai, B.F.; Xu, H. A top-bottom method for city-scale energy-related CO2 emissions estimation: A case study of 41 Chinese cities. J. Clean. Prod. 2018, 202, 444–455. [Google Scholar] [CrossRef]
- Shi, K.; Yu, B.; Huang, Y.; Hu, Y.; Yin, B.; Chen, Z.; Chen, L.; Wu, J. Evaluating the Ability of NPP-VIIRS Nighttime Light Data to Estimate the Gross Domestic Product and the Electric Power Consumption of China at Multiple Scales: A Comparison with DMSP-OLS Data. Remote Sens. 2014, 6, 1705–1724. [Google Scholar] [CrossRef]
- Elvidge, C.D.; Baugh, K.; Zhizhin, M.; Hsu, F.C.; Ghosh, T. VIIRS night-time lights. Int. J. Remote Sens. 2017, 38, 5860–5879. [Google Scholar] [CrossRef]
- Yang, L.W.; Dong, L.Q.; Zhang, L.W.; He, B.Y.; Zhang, Y.Q. Quantitative assessment of carbon sequestration service supply and demand and service flows: A case study of the Yellow River Diversion Project South Line. Resour Sci. 2019, 41, 557–571. [Google Scholar]
- Zhang, M.; Wang, K.; Liu, H.; Wang, J.; Zhang, C.; Yue, Y.; Qi, X. Spatio-Temporal Variation and Impact Factors for Vegetation Carbon Sequestration and Oxygen Production Based on Rocky Desertification Control in the Karst Region of Southwest China. Remote Sens. 2016, 8, 102. [Google Scholar] [CrossRef]
- Zhang, M.X.; Jing, X.Y.; Liu, S. The high quality development and spatial-temporal evolution of Harbin-Chang Urban agglomeration. Spec. Zone Econ. 2022, 4, 66–70. [Google Scholar]
- Field, C.B.; Behrenfeld, M.J.; Randerson, J.T.; Falkowski, P. Primary production of the biosphere: Integrating terrestrial and oceanic components. Science 1998, 281, 237–240. [Google Scholar] [CrossRef]
- Qiu, Y.; Fan, D.Q.; Zhao, X.S.; Sun, W.B. Spatio-temporal Changes of NPP and Its Responses to Phenology in Northeast China. Geogr. Geo-Inf. Sci. 2017, 33, 21–27. [Google Scholar]
- Elvidge, C.D.; Zhizhin, M.; Ghosh, T.; Hsu, F.; Taneja, J. Annual Time Series of Global VIIRS Nighttime Lights Derived from Monthly Averages: 2012 to 2019. Remote Sens. 2021, 13, 922. [Google Scholar] [CrossRef]
- Shan, Y.; Guan, D.; Zheng, H.; Ou, J.; Li, Y.; Meng, J.; Mi, Z.; Liu, Z.; Zhang, Q. Data Descriptor: China CO2 emission accounts 1997–2015. Sci. Data 2018, 5, 1–14. [Google Scholar] [CrossRef]
- Liu, Z.; Guan, D.; Wei, W.; Davis, S.J.; Ciais, P.; Bai, J.; Peng, S.; Zhang, Q.; Hubacek, K.; Marland, G.; et al. Reduced carbon emission estimates from fossil fuel combustion and cement production in China. Nature 2015, 524, 335–338. [Google Scholar] [CrossRef]
- Shi, K.; Huang, C.; Yu, B.; Yin, B.; Huang, Y.; Wu, J. Evaluation of NPP-VIIRS night-time light composite data for extracting built-up urban areas. Remote Sens. Lett. 2014, 5, 358–366. [Google Scholar] [CrossRef]
- Guan, J.Y.; Li, D.; Wang, Y.F.; Wang, X.Q. DMSP-OLS and NPP-VIIRS night light image correction in China. Bull. Surv. Mapp. 2021, 0, 1–8. [Google Scholar]
- Zhao, M.; Zhou, Y.; Li, X.; Zhou, C.; Cheng, W.; Li, M.; Huang, K. Building a Series of Consistent Night-Time Light Data (1992–2018) in Southeast Asia by Integrating DMSP-OLS and NPP-VIIRS. IEEE Trans. Geosci. Remote Sens. 2020, 58, 1843–1856. [Google Scholar] [CrossRef]
- Ma, T.; Zhou, C.; Pei, T.; Haynie, S.; Fan, J. Responses of Suomi-NPP VIIRS-derived nighttime lights to socioeconomic activity in China’s cities. Remote Sens. Lett. 2014, 5, 165–174. [Google Scholar] [CrossRef]
- Chen, J.; Jiang, B.; Bai, Y.; Xu, X.; Alatalo, J.M. Quantifying ecosystem services supply and demand shortfalls and mismatches for management optimisation. Sci. Total Environ. 2019, 650, 1426–1439. [Google Scholar] [CrossRef] [PubMed]
- Xie, Y.C.; Zhang, S.X.; Lin, B.; Zhao, Y.J.; Hu, B.Q. Spatial zoning of county land ecological restoration based on ecosystem service supply and demand in Guangxi counties. J. Nat. Resour. 2020, 35, 217–229. [Google Scholar]
- Chen, F.J.; Sheng, Y.J.; Li, Q.; Guo, Y.; Xu, L.M. Spatial and temporal variations of NPP in terrestrial ecosystems in China during the past 30 years. Sci. Geogr. Sin. 2011, 31, 1409–1414. [Google Scholar]
- Chuai, X.; Feng, J. High resolution carbon emissions simulation and spatial heterogeneity analysis based on big data in Nanjing City, China. Sci. Total Environ. 2019, 686, 828–837. [Google Scholar] [CrossRef] [PubMed]
- Zhang, J.J.; Fu, M.C.; Zeng, H.; Geng, Y.H.; Hassani, F.P. Variations in ecosystem service values and local economy in response to land use: A case study of Wu’an, China. Land Degrad. Dev. 2013, 24, 236–249. [Google Scholar] [CrossRef]
- Wang, S.; Ma, H.; Zhao, Y. Exploring the relationship between urbanization and the eco-environment-A case study of Beijing-Tianjin-Hebei region. Ecol. Indic. 2014, 45, 171–183. [Google Scholar] [CrossRef]
- Wang, J.; Zhai, T.; Lin, Y.; Kong, X.; He, T. Spatial imbalance and changes in supply and demand of ecosystem services in China. Sci. Total Environ. 2019, 657, 781–791. [Google Scholar] [CrossRef]
- Yao, S.M.; Zhang, P.Y.; Yu, C.; Li, G.Y.; Wang, C.X. Theoretical and practical problems of China’s new urbanization. Sci. Geogr. Sin. 2014, 34, 641–647. [Google Scholar]
- Peng, J.; Yang, Y.; Xie, P.; Liu, Y.X. Zoning of green space ecological network construction in Guangdong Province based on ecosystem service supply and demand. Acta Ecol. Sin. 2017, 37, 4562–4572. [Google Scholar]
- Lin, B.; Li, Z. Spatial analysis of mainland cities’ carbon emissions of and around Guangdong-Hong Kong-Macao Greater Bay area. Sustain. Cities Soc. 2020, 61, 102299. [Google Scholar] [CrossRef]
- Zheng, H.; Zhang, Z.; Zhang, Z.; Li, X.; Shan, Y.; Song, M.; Mi, Z.; Meng, J.; Ou, J.; Guan, D. Mapping Carbon and Water Networks in the North China Urban Agglomeration. One Earth 2019, 1, 126–137. [Google Scholar] [CrossRef]
- Gizachew, B.; Solberg, S.; Puliti, S. Forest Carbon Gain and Loss in Protected Areas of Uganda: Implications to Carbon Benefits of Conservation. Land 2018, 7, 138. [Google Scholar] [CrossRef]
- Lin, B.; Jia, Z. How does tax system on energy industries affect energy demand, CO2 emissions, and economy in China? Energy Econ. 2019, 84, 104496. [Google Scholar] [CrossRef]
- Fu, B.J.; Lv, N.; Lv, Y.H. Strengthening ecosystem management is helpful for achieving the carbon neutrality goal. Bull. Chin. Acad. Sci. 2022, 37, 1529–1533. [Google Scholar]
- Zhang, C.; Li, J.; Zhou, Z.-X.; Liu, X.-F. Research progress on the cascade effect of ecosystem service. Chin. J. Appl. Ecol. 2021, 32, 1633–1642. [Google Scholar]
- Serna-Chavez, H.M.; Schulp, C.J.E.; van Bodegom, P.M.; Bouten, W.; Verburg, P.H.; Davidson, M.D. A quantitative framework for assessing spatial flows of ecosystem services. Ecol. Indic. 2014, 39, 24–33. [Google Scholar] [CrossRef]
- Nowak, D.J.; Greenfield, E.J.; Hoehn, R.E.; Lapoint, E. Carbon storage and sequestration by trees in urban and community areas of the United States. Environ. Pollut. 2013, 178, 229–236. [Google Scholar] [CrossRef]
- Huh, K.Y.; Deurer, M.; Sivakumaran, S.; McAuliffe, K.; Bolan, N.S. Carbon sequestration in urban landscapes: The example of a turfgrass system in New Zealand. Aust. J. Soil Res. 2008, 46, 610–616. [Google Scholar] [CrossRef]
- Bazame, H.C.; Althoff, D.; Filgueiras, R.; Calijuri, M.L.; de Oliveira, J.C. Modeling the Net Primary Productivity: A Study Case in the Brazilian Territory. J. Indian Soc. Remote Sens. 2019, 47, 1727–1735. [Google Scholar] [CrossRef]
- Hankey, S.; Marshall, J.D. Impacts of urban form on future US passenger-vehicle greenhouse gas emissions. Energy Policy 2010, 38, 4880–4887. [Google Scholar] [CrossRef]
Disclaimer/Publisher’s Note: The statements, opinions and data contained in all publications are solely those of the individual author(s) and contributor(s) and not of MDPI and/or the editor(s). MDPI and/or the editor(s) disclaim responsibility for any injury to people or property resulting from any ideas, methods, instructions or products referred to in the content. |
© 2023 by the authors. Licensee MDPI, Basel, Switzerland. This article is an open access article distributed under the terms and conditions of the Creative Commons Attribution (CC BY) license (https://creativecommons.org/licenses/by/4.0/).