Abstract
Semantic segmentation of remote sensing (RS) images, which is a fundamental research topic, classifies each pixel in an image. It plays an essential role in many downstream RS areas, such as land-cover mapping, road extraction, traffic monitoring, and so on. Recently, although deep-learning-based methods have shown their dominance in automatic semantic segmentation of RS imagery, the performance of these existing methods has relied heavily on large amounts of high-quality training data, which are usually hard to obtain in practice. Moreover, human-in-the-loop semantic segmentation of RS imagery cannot be completely replaced by automatic segmentation models, since automatic models are prone to error in some complex scenarios. To address these issues, in this paper, we propose an improved, smart, and interactive segmentation model, DRE-Net, for RS images. The proposed model facilitates humans’ performance of segmentation by simply clicking a mouse. Firstly, a dynamic radius-encoding (DRE) algorithm is designed to distinguish the purpose of each click, such as a click for the selection of a segmentation outline or for fine-tuning. Secondly, we propose an incremental training strategy to cause the proposed model not only to converge quickly, but also to obtain refined segmentation results. Finally, we conducted comprehensive experiments on the Potsdam and Vaihingen datasets and achieved 9.75% and 7.03% improvements in compared to the state-of-the-art results, respectively. In addition, our DRE-Net can improve the convergence and generalization of a network with a fast inference speed.
1. Introduction
With the implementation of increasingly growing Earth observation programs, remote sensing (RS) images have been explosively developing, and we have entered an age of big RS data [1]. Semantic segmentation of RS images is a fundamental research topic, and it plays an essential role in application fields such as traffic monitoring [2], road extraction [3,4], and land resource management [5]. With the prevalence of deep-learning-based methods, automatic semantic segmentation of RS imagery [6,7] has achieved impressive performance on public benchmarks. However, the superior performance of these deep-learning-based methods relies heavily on the quantity and quality of the annotated data, while acquiring high-quality mask-level annotations of RS images is quite expensive and time-consuming. Moreover, the human-in-the-loop semantic segmentation of RS images cannot be entirely replaced by automatic segmentation models, since automatic models are prone to error in some complex scenarios. At this point, we propose an improved, smart, and interactive segmentation model to relieve the burden of work for humans when performing RS image segmentation. The proposed model can also be regarded as a smart tool for generating high-quality pixel-wise annotated labels for deep-learning-based semantic segmentation models.
Interactive segmentation [8] aims to alleviate the burden on the user by reducing the time and effort required during the interaction process. Unlike semantic segmentation, which outputs masks of predefined categories, interactive segmentation can output the desired masks in a directed manner based on the interaction information embedded in the user interactions and the semantic information of the object itself. It introduces human intervention, which makes it possible to artificially control the output of the algorithm and refine the existing masks through several human–computer interactions (such as mouse clicks), as shown in Figure 1. Hence, it has critical applications in image editing [9,10], mask-level annotations [11,12,13], medical image analysis [14], etc.

Figure 1.
An overview of a click-based interactive segmentation system. “pc” and “nc” stand for positive (green points in RS images) and negative (red points in RS images) clicks placed by a human for foreground and background selection, respectively. Users can obtain the desired high-quality masks with just a few simple clicks.
Common interactive segmentation methods allow users to select objects or refine masks with bounding boxes [15,16], scribbles [17,18], polar points [19,20], and clicks [8,21]. Due to their fixed shapes, bounding boxes cannot accurately distinguish between foreground and background. Due to their special locations, polar points raise the difficulty of user interaction. Moreover, since most objects in RS images appear as blocks and bars, clicks can give explicit interaction information to a model in a more straightforward and simpler way than scribbles can. Thus, we focus on click-based interactive segmentation for remote sensing images and aim to make the network achieve the desired accuracy with fewer clicks (rate of convergence—RoC [8]) while enabling the accuracy to gradually increase with user clicks (convergence—CG [12]), which is essential for the annotation and refinement processes, respectively. In addition, we should take inference latency into account to make quick responses for users.
Several methods of interactive segmentation have been explored, but there are limitations to them for the RS image segmentation task. Firstly, most existing methods [22,23,24] treat all user clicks indiscriminately. However, the primary purpose of early interactions is to segment outlines; thus, we should enlarge the influence of each click to obtain a high-precision mask more quickly for a high rate of convergence (RoC). Later interactions are intended to fine-tune local details; therefore, we should weaken the influence of clicks to prevent the convergence (CG) deterioration problem caused by overshoot or ambiguity. An undifferentiated coding method cannot provide information about the range of influence in an RS image segmentation task. As a result, the performance of these methods is limited in each interaction and heavily depends on the extracted semantic information of the object. Secondly, when training an interactive segmentation model, we need to sample a random number of clicks to simulate the different stages of the interaction process. However, the existing training strategy causes the performance of the network to be influenced by the expectation of the number of clicks generated during the training process. A larger expectation implies more learning materials for the middle/late stages, leading to limited performance in early interactions. Such a training strategy cannot improve the RoC and CG performance at the same time, which is a hindrance for the network in effectively learning the influences of interactions from different stages.
In this paper, we propose a dynamic radius-encoding (DRE) algorithm. It encodes the influence range of each interaction into DRE feature maps. Inspired by the RITM [22], we construct the DRE-Net with a simple yet effective module for telling the network the different influences of each click. We design an incremental training strategy that teaches the network to quickly converge in the early interactions first, and then supplement it with knowledge of fine-tuning in the middle/late stages. The proposed model maintains a friendly inference speed.
Our contributions can be summarized as follows:
- •
- We propose a novel interactive segmentation model for RS images, DRE-Net, which encodes the influence range of each click into feature maps. To the best of our knowledge, this is the first work to consider the potential intentions of interactions in the interactive segmentation of RS images.
- •
- We design a two-stage incremental training strategy that can balance the performance in terms of the rate of convergence (RoC) and convergence (CG), thus allowing the network to converge faster and ensuring a steady increase in accuracy.
- •
- We demonstrate the effectiveness and advantages of the proposed method through comprehensive experiments. Our method outperforms the state-of-the-art results on two common benchmarks.
The rest of this paper is organized as follows. The related work is shown in Section 2. Section 3 presents the details of our DRE-Net architecture and the incremental training strategy. The materials and results are shown in Section 4 and Section 5, respectively. In Section 6 and Section 7, a discussion and the conclusion are presented.
2. Related Work
2.1. Interactive Segmentation
Early studies regarded interactive segmentation as an optimization problem. Their methods can be roughly divided into boundary-based algorithms [25,26] and region-based algorithms [27,28]. Boundary-based methods cut out the object by optimizing an evolving curve that users provide to enclose the boundary. As a classical boundary-based algorithm, the intelligent Scissor [29] uses graph theory to deal with the information provided by edge-discontinuous structures. However, boundary-based methods can take much effort when dealing with complex and high-resolution objects. In contrast, region-based methods allow users to sparsely indicate the foreground and background. Such algorithms expand the region according to the continuity of pixels and, thus, segment the object. For example, Rand Walks [27] gradually expanded the region of each seed by calculating the transition probability based on the similarity of pixels. However, it is difficult for region-based methods to deal with shadowy areas, low-contrast edges, and ambiguous areas. In general, since only low-level semantic information of images can be extracted, these traditional algorithms usually require a great number of interactions from users.
iFCN [8] was the first deep-learning-based interactive segmentation work. It adopted an FCN [30] that was used in semantic segmentation for interactive segmentation and proposed a training strategy that is widely used in subsequent works. Based on reinforcement learning (RL), SeedNet [31] intelligently introduced additional clicks to reduce the number of clicks required from users. However, these generated clicks were often not critical. Enhancing the semantic information of an object could achieve the same performance. Therefore, many subsequent works focused on segmenting improvements. RIS-Net [22] determined local regions with positive and negative click pairs, and it adopted multi-scale global contextual information to augment each local region to improve the feature representation. To reduce the large computations for local prediction in RIS-Net, FocalClick [24] involved the design of a coarse-to-fine scheme and introduced a sub-network to refine the local region cropped from the latest click. In addition, many works improved the performance by enhancing the interaction information. To make user interactions directly impact the prediction, TSLFN [32] and 99%AccuracyNet [33] proposed a late-fusion structure to extract deep features from images and user interactions from two streams. To further enhance the influence of interactive information in the network, EdgeFlow [21] proposed an early–late fusion structure and designed a coarse-to-fine network based on object edges. To improve the convergence (CG) of the network, BRS [23] proposed a backpropagating refinement scheme based on unconstrained L-BFGS to correct the mislabeled pixels. f-BRS [12] was a work based on BRS. It introduced an auxiliary set of parameters for optimization and was an order of magnitude faster than BRS. RITM [22] introduced the previous mask into the input of the network, thus making it possible to modify the preexisting mask, and it achieved excellent results without any additional optimization schemes.
Most previous works did not consider the different influences of interactions and treated all clicks without discrimination, which made the networks heavily depend on the extracted semantic information. Therefore, adding extra interaction information holds the potential for improving the performance of a network on RS images in complex scenarios. In this paper, we design a differential disk encoding method to add this prior information.
2.2. Incremental Learning
The purpose of our training was to improve the performance of the network in terms of both the rate of convergence (RoC) and convergence (CG), which are related to incremental learning. Incremental learning was designed to address the problem of catastrophic forgetting [34] in model training, which allows a model to absorb new knowledge while maintaining or even optimizing old abilities. The classical regularization-based methods include feature extraction [35,36], fine-tuning [37,38], and joint training [39,40]. Feature extraction methods keep the shared weights unchanged and only train the head introduced for the new task with new task images. Such methods perform poorly on new tasks due to the lack of discriminative features extracted by the unchanged shared weights. Fine-tuning methods keep the weights of the heads for original tasks unchanged and train the shared weights and new task head with new task images and a low learning rate. These methods can degrade the performance on previously learned tasks because the shared weights of the backbone are updated without supervision for original tasks [41]. Joint training may be considered as an upper bound for regularization-based methods. It trains the parameters of the backbone and all task heads with all task images. We propose the incremental training strategy for DRE-Net based on the design concept of joint training to improve both the RoC and CG.
3. Methods
In Section 3.1, we first introduce our efficient pipeline and then explain the modules. In Section 3.2, we describe the incremental training strategy proposed for DRE-Net.
3.1. Efficient Pipeline
Interactive segmentation is an iterative process. Before obtaining a desired mask, the user needs to continuously correct the predictions through interactions. Meanwhile, in each iteration, the network needs to predict the mask desired by the user based on the semantic information of the image and the interaction information of the clicks. Our optimization goal is to shorten this process so that the user can obtain higher accuracy with fewer clicks (rate of convergence—RoC) while ensuring that each additional click leads to higher mask accuracy (convergence—CG).
To fully demonstrate the effectiveness of the dynamic radius-encoding algorithm, we kept the framework of the SOTA method (RITM) [22], inserted a DRE module, and adapted the interactive information processing (IIP) module [22,24] to construct our DRE-Net. Its pipeline is shown in Figure 2. The figure shows one single iteration of the interaction process. The user places a new click to refine the previous mask (perhaps, a prediction from the last iteration of the network, an existing mask, or an initialized zero matrix). This click and all of the historical clicks are combined first. Then, the Zoom-In technique focuses the field of view on the region of interest (RoI) by cropping, and the coordinates of the clicks are transformed accordingly. After that, positive/negative clicks are converted into two DRE feature maps (DRE-fMaps) through dynamic radius encoding. Then, the Zoom-In image, Zoom-In mask, and two DRE-fMaps are input into the segmentor to get the Zoom-In prediction. The interactive information embedded in the DRE-fMaps and Zoom-In mask is preprocessed in the interactive information processing (IIP) module. The semantic information of the Zoom-In image is fused with the interaction information after the first conv layer of the segmentor. The final prediction is obtained through the inverse Zoom-In transformation of the Zoom-In prediction. The segmentor is trained with the proposed incremental training strategy.
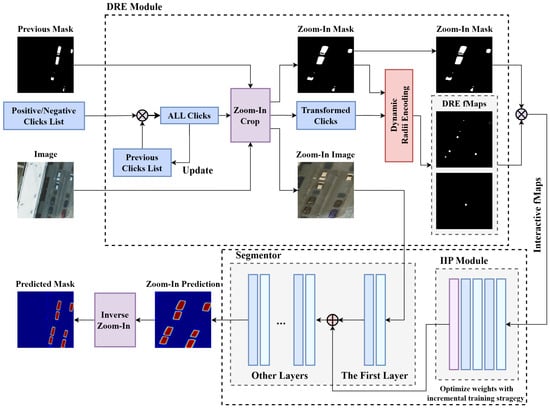
Figure 2.
The pipeline of DRE-Net. The symbols “⊗” and “⊕” indicate concatenation and addition operations, respectively.
3.1.1. Zoom-In
Previous works [25,42] showed that image crops can improve the local details of predictions, which is especially effective for small targets. We adopted the Zoom-In technique proposed by Konstantin Sofiiuk [12] to improve the accuracy of the interactive segmentation.
As shown in Figure 3, we kept a 40% margin to preserve the context when cropping with the bounding box. We extended the Zoom-In region if subsequent positive clicks were outside the bounding box. Since the position of the click on the Zoom-In image changed, its coordinates needed to be accordingly transformed. The final prediction was obtained with an inverse Zoom-In transformation on the output of the segmentor.
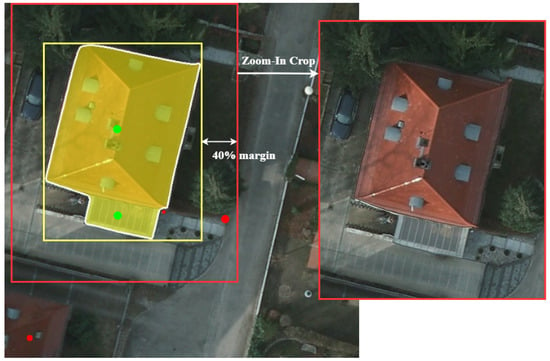
Figure 3.
Example of the Zoom-In technique applied to remote sensing images. The green and red points stand for positive and negative clicks, respectively. The yellow bounding box is determined by the extreme points of the previous mask.
3.1.2. Dynamic Radius Encoding
Before being input into the neural network, the location information of clicks needs to be converted from 2D coordinates into interaction feature maps. Standard encoding methods include distance transformation, Gaussian maps, and binary disks with fixed radii centered on each click, as shown in Figure 4. Both distance transformation and Gaussian maps have an impact on the whole interaction feature map, which tends to make the network confused [22]. Disk encoding, which locally affects the interaction feature map, is the most promising method [21,22,43]. Therefore, we propose our approach based on disk encoding.
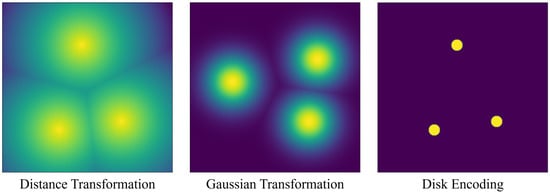
Figure 4.
Visualization of three common click-encoding methods. Distance transformation calculates the Euclidean distance between pixels and clicks, while Gaussian transformation makes a Gaussian distribution centered on each click. Disk encoding uses a binary disk with a defined radius.
To tell the neural network about the different influences of each interaction, we need to solve two problems: (1) how to distinguish the clicks from different stages and (2) how to represent the clicks from different stages. Note that we define the middle/late stages as the iterations in which the accuracy is close to the convergence value. First, since users commonly click at the center of a mislabeled region, the more the user tends to fine-tune, the closer the placed clicks are to the edge of the object. However, the object is a posteriori for the network, and thus, we reflect the different interaction periods with the minimum distance of the click from the edge of the previous mask instead of the object. For the second problem, an exciting conclusion from LSIS [43] inspired us. It showed that in the second interaction, the accuracy of the model encoded with disk10 (disk encoding with a radius of 10 pixels) was slightly higher than that with disk5 (disk encoding with a radius of 5 pixels). In contrast, the opposite result was obtained in the fourth interaction when the accuracy was close to the convergence value, i.e., when it was fine-tuning. Based on these two observations, we propose that a click near the edge of the previous mask indicates that the user is fine-tuning, and thus, we can use a smaller radius to weaken its influence to prevent the CG deterioration problem. At the same time, when a click is far from the boundary of the previous mask, it means that the accuracy of the mask is not high enough, and appropriately increasing the influence of this interaction with a larger radius is beneficial for improving the performance in terms of the RoC. Therefore, we propose the dynamic radius-encoding (DRE) algorithm, which uses the minimum distance of a click from the edge of the previous mask to distinguish among different influences, and it indicates the influences of interactions with different coding radii.
The pseudocode of the DRE algorithm is shown in Algorithm 1. First, we get the edge maps of the binary mask with a Laplace filter. Then, we convert the clicks into distance maps through a distance transformation, from which all minimum distances are calculated. The radius-mapping function maps each minimum distance to the encoding radius of the corresponding click. After the disk transformation, the disk maps of all positive/negative interactions are merged to get two DRE-fMaps.
| Algorithm 1: Dynamic Radius Encoding |
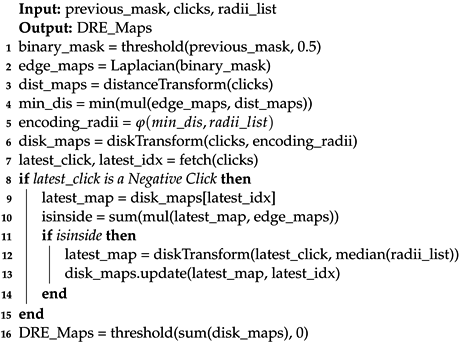 |
Positive and negative interactions cannot be encoded in exactly the same way. The purpose of the positive interactions is to expand the region of the previous mask, so they only appear outside the mask. However, the purpose of negative interactions is to correct mislabeled regions, so they can be placed outside the mask to indicate regions of disinterest or inside the mask to key out local features. When a click is located inside, the minimum distance computed from the previous mask does not truly reflect the influence of this interaction. As shown in Figure 5, when the user is keying off the rooftop of the house, the true minimum distance should be calculated with the location of the latest negative click and the edge of the rooftop. Since the information about the rooftop is unknown in this iteration, we set the radius as the mid-value to avoid unsuitable influences. It is worth noting that the encoding radii will be updated in each iteration. Therefore, when lying outside the mask, the radius of this negative click will be automatically adjusted in the next iteration.
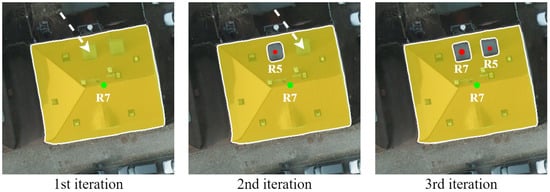
Figure 5.
Visualization of the automatic update of the radii. “R7” means that the click is encoded with a radius of 7 pixels. The green and red points stand for positive and negative clicks, respectively. The radius is fixed to the mid-value when keying and will be updated in the next iteration. So, the radius of the negative click is 5 pixels in the 2nd iteration and is updated to 7 pixels in the 3rd iteration.
3.1.3. Radius-Mapping Function
The radius-mapping function is designed artificially. We divide the influence into three classes and use three radii to indicate them. We denote the function , which uses radii of 7, 5, and 3 as . In this paper, we define as a segmentation function and provide a method for determining the mapping interval. We count the frequency of minimum distances for each iteration when training our model on the Potsdam dataset, as shown in Figure 6. We find that the distribution is stable and consider it related to the segmentor and the dataset. When the segmentor works well on the training set, the energy of the distribution will mainly be concentrated in the low-value interval.
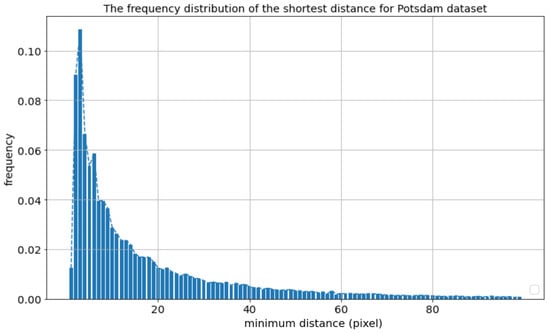
Figure 6.
Distribution of the minimum distance with HRNet32-OCR [44] as the backbone on the Potsdam dataset. We sampled the clicks generated in each corrective sampling segmentation.
To cause the network to better learn the influence during training, the mapping function should match the distribution on the training set. Our design concept is to divide the minimum distance into three levels according to its energy distribution. At the same time, we should expand the interval of the large radius as much as possible to enhance the performance in terms of the RoC.
Based on Figure 6, we define as Equation (1). All of the experiments in this paper used the same interval division of the minimum distance. To explore the effect of the absolute value of the radii, we set up another mapping function with the combination of radii of 5, 3, and 1 (). It is worth mentioning that the previous mask was initialized as a zero matrix at the first click. The DRE algorithm will handle this case with the largest radius. That is, we enhanced the influence of the first click by default to improve the RoC, which is consistent with the idea of FCA-Net [11]. As shown in Figure 7, clicks far from the previous mask have a larger radius, and those that are closer have a smaller radius.

Figure 7.
An example for disk encoding and DRE. The green and red points stand for positive and negative clicks, respectively. All clicks in disk encoding are encoded with the same radius, while the clicks close to the mask boundary have a smaller encoding radius in DRE. Through such a differentiated encoding method, we tell the network the different influences of each click and achieve higher accuracy with the same number of clicks.
3.1.4. Segmentor
Semantic segmentation and interactive segmentation tasks are similar in terms of network structure. The critical difference is that interactive segmentation requires inputting and processing additional feature maps. Therefore, there is no need to design a segmentation network from scratch. Instead, it makes sense to rely on time-tested segmentors and focus on the design of the interaction part [22]. From this perspective, the segmentor in our pipeline can be any effective network [45,46] in semantic segmentation.
In this paper, we used HRNet32-OCR [44], which is widely used in interactive segmentation, as the segmentor. To reduce the impact of the pretrained segmentor on the weights, we followed RITM [22] in fusing the image information and interaction information after the first conv layer of the segmentor. We used the IIP module to adjust the channel and scale of the interactive feature maps. We adapted the architecture of the IIP module for HRNet32-OCR, as shown in Figure 8. This design allowed us to set the learning rate of the segmentor and IIP module separately, thus minimizing the influence on the pretrained model. This also constitutes a virtuous circle in which interactive segmentation accelerates the acquisition of annotated data for semantic segmentation, and semantic segmentation provides a mature network architecture for interactive segmentation.
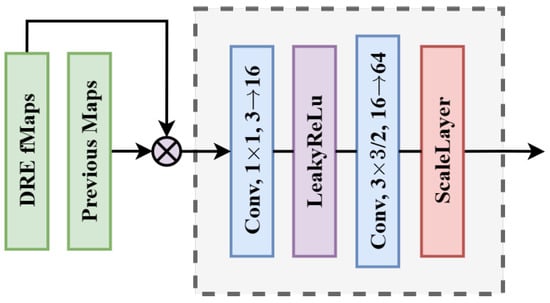
Figure 8.
The architecture of the IIP module for HRNet32-OCR [44]. “Conv, 3 × 3/2, 16→64” means a 3 × 3 conv layer with , , and . The ScaleLayer divides each element of the feature maps by a learnable parameter k.
3.2. Incremental Training Strategy
To make the network not only converge quickly, but also obtain refined segmentation results, we propose an incremental training strategy. Interactive segmentation is an iterative process in which users adjust the predictions by continuously adding interactive information. Through training, the network should output high-precision masks in each iteration to shorten the whole process. To achieve this, the network should see various stages in iterations during training. Therefore, before being input into the network, each image will sample a random number of clicks to simulate different interaction stages.
A computer can simulate user clicks during training through random sampling and corrective sampling. Random sampling generates clicks at random locations, while corrective sampling places clicks at the center of the largest mislabeled region. Recent works [22,24] used iterative sampling strategies to train their models. They first generated m () positive/negative clicks at once through random sampling for initialization, and then iterated n () times to correct the initialized mask through corrective sampling segmentation. The network was trained at the last iteration, and the total number of clicks was random, from 1 to , as shown in Figure 9b. The thresholds and are the hyperparameters.
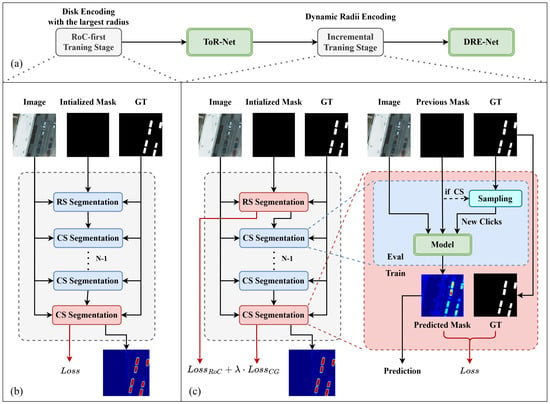
Figure 9.
(a) Procedure of the incremental training strategy. It includes (b) the RoC-first training stage and (c) the incremental training stage. Both stages use the segmentor described in Section 3.1.4 with different click-encoding methods. We call the result of the RoC-first training stage ToR-Net (the model trained on the largest radius). The training strategy of the RoC-first training stage is consistent with those in recent works [22,24]. “RS” and “CS” in (b,c) stand for “random sampling” and “corrective sampling”, respectively.
However, this training strategy cannot improve the RoC and CG performance at the same time. As the threshold grows, the expectation of the number of clicks generated during training also increases, which means that there are more training materials for the middle/late stages. This makes the network tend to learn knowledge about fine-tuning and, thus, reduces the influence of clicks. As a result, the RoC of the network is limited, i.e., the performance in the early stages is degraded. On the contrary, if the threshold is small, the network will perform poorly in the middle/late interactions or even cause underfitting due to the lack of a complete understanding of the objects during training. In a word, the previous training strategy cannot train specifically for interactions of different purposes, which hinders the network’s effective learning of the influence information.
With the advantage that DRE-Net distinguishes among different interactions, we designed a two-stage incremental training strategy based on the idea of joint training [39,40]. First, we ignore the CG of the network and make it perform better in terms of the RoC by training on the largest radius in the radius-mapping function. We call this process and the result the RoC-first training stage and the ToR model, respectively. Then, we insert the DRE module into the ToR model and add knowledge of fine-tuning to the network while maintaining its RoC performance through the incremental training stage, as shown in Figure 9.
3.2.1. RoC-First Training Stage
The purpose of the RoC-first training stage is to make the network trust the clicks encoded with the largest radius and, thus, enlarge their influence range to improve the RoC in the early stages. The training strategy of this stage is consistent with those in previous works [22,24], as shown in Figure 9.
To achieve this, we studied different hyperparameters for training and found that the threshold for random sampling, the threshold for corrective sampling, and the minimum area of objects () all affected the RoC. However, the effects of thresholds and had a certain randomness, which made the results inconvenient to control. Therefore, we improved the RoC by increasing the value of . A larger area of the ground truth meant a broader target region, and the network could enlarge the influence of clicks more confidently and output high-precision predictions earlier. In the RoC-first training stage, we used the disk-encoding method with the largest radius in the radius-mapping function to enlarge its influence and set . We called the training result (the model was trained on a radius of 7 pixels with ). (Experimental proofs are shown in Section 5.5.)
3.2.2. Incremental Training Stage
The purpose of the incremental training stage was to teach the network the information embedded in medium/small radii to improve the convergence of while maintaining its RoC performance. The was set to zero at this time.
Random sampling segmentation was used to initialize the mask, at which time the DRE-Net would encode all clicks with the largest radius by default. Therefore, we could train this iteration as a way to maintain the RoC of , as shown in Figure 9. In the following n corrective sampling segmentations, DRE-Net adjusted the radius according to the previous mask. In addition, Figure 6 shows that most clicks were very close to the mask in these n iterations. Therefore, it was appropriate to consider the nth corrective sampling segmentations as the learning materials for fine-tuning. In short, the incremental training stage trained two iterations for each sample, which was intended to improve the performance in terms of the RoC and CG, respectively.
3.2.3. Loss Function
To make the network focus on learning hard samples, we supervised the RoC-first training stage and incremental training stage with the normalized focal loss [47]. It was calculated as Equation (2). The symbol stands for the confidence of the prediction at position (), and the tunable parameter smoothly increases the weight of hard samples in the normalized focal loss.
In the incremental training stage, the loss consisted of two parts. We call the loss from the random sampling segmentation and the loss from the corrective sampling segmentation . Then, the total loss can be denoted as Equation (3). The hyperparameter is a scaling factor used to balance the performance in terms of the RoC and CG.
4. Materials
4.1. Datasets
We conducted comprehensive experiments on ISPRS datasets. These consisted of the Potsdam and Vaihingen datasets with six categories (buildings, cars, impervious surfaces, trees, low vegetation, and clutter). The Potsdam dataset contained 38 remote sensing images with a resolution of 5 cm and a size of . Removing one erroneous mask, we divided the Potsdam dataset into 3700 patches with a size of and obtained a training set and test set in a ratio of after random shuffling. The Vaihingen dataset was composed of 33 tiles with a resolution of 9 cm and different sizes. We cropped the images to a size of and divided the dataset with a ratio of . Note that we used RGB images in our experiments. The specific configuration is shown in Table 1.

Table 1.
Statistics of the datasets, including the resolution, size, image number, and mask number.
Interactive semantic segmentation is a two-class segmentation problem. The network should output the ground-truth mask of a specific object. In our experiments, we regarded each instance-level mask from one image as a segmentation mask to construct the sample set, as shown in Figure 10.
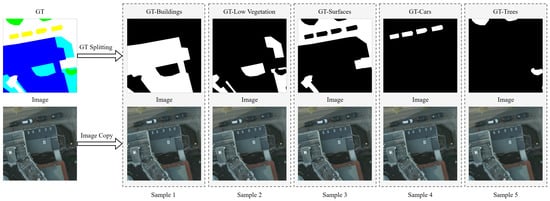
Figure 10.
Visualization of the process of constructing a sample set with image truth pairs.
4.2. Evaluation Metric
In order to make a fair comparison, we followed a widely used sampling strategy [11,23,24] to simulate the clicks during the evaluation. For the first click, the click would be placed at the center of the ground-truth mask, and all other clicks would be placed at the center of the largest mislabeled region of the previous mask.
We adopted (average number of clicks required to reach target the IoU of 85%/90%) to evaluate the rate of convergence (RoC) of different methods. It can be computed as in Equation (4).
where N is the number of the mask and the indicates the number of clicks required for the ith prediction to reach the IoU k. We limited the number of clicks to 20 when comparing the RoC, as in previous works, and we used (the number of failures to reach the target IoU of 85%/90% within 20 clicks) to evaluate the generalizability. This can be formulated as in Equation (5).
where N is the number of the mask and the . means that the accuracy of the ith prediction fails to reach the IoU of k within 20 clicks.
Following f-BRS [12], we evaluated the convergence (CG) by comparing the mean IoU@k curves (mean IoU with respect to the number of clicks) of different methods. In addition, the SPC (seconds per click) and time (the total time to process the whole dataset) were used to evaluate the inference speed.
4.3. Implementation Details
During training, images were randomly resized with a scale from to . Then, we randomly cropped the images from the Potsdam dataset to a size of and those from the Vaihingen dataset to a size of . In addition, we used flipping and random changes in brightness, contrast, and RGB values as augmentations. We limited the number of positive/negative clicks to 24, which was shared by the clicks from random sampling and corrective sampling.
We used the Adam optimizer with and and set the batch size to 16. In the RoC-first training stage, the initial learning rate of the IIP module was set to , and the learning rate of the segmentor was set to . We trained the model for 200 epochs with , and the learning rate was decreased by five times on the 50th, 100th, and 150th epochs. In the incremental training stage, the initial learning rate was set five times lower than that in the RoC-first training stage. We trained for 100 epochs with , and the learning rate was decreased by five times in the 50th and 75th epochs.
4.4. Compared Models
We compared our method with several others:
- •
- BRS [23]: This introduces a backpropagating refinement strategy to correct mislabeled locations by updating the interactive maps at the inference phase.
- •
- RGB-BRS [12]: This updates the input image to correct mislabeled locations based on an unconstrained L-BFGS optimizer and, thus, improves the CG of the model.
- •
- f-BRS [12]: This model corrects mislabeled locations by adjusting an auxiliary set of parameters introduced in the last several layers of the network. It requires running forward and backward passes only through a small part of the network and, thus, improves the inference speed.
- •
- FocalClick [24]: This is a coarse-to-fine method that obtains a coarse prediction through a segmentor and uses a sub-network to refine the local region in which the latest click is placed.
- •
- RITM [22]: This model feeds the previous mask into the network and uses the disk encoding with a radius of five pixels and the iterative training strategy shown in Figure 9b.
Among them, BRS, RGB-BRS, and f-BRS, which aim to improve the CG by correcting mislabeled regions, use a backpropagating refinement strategy during inference. To make a fair comparison, we implemented them with the framework of RITM, as in our method.
5. Results
This section summarizes the main findings of this work. The results of the study mainly include comparisons of the rate of convergence (RoC), convergence (CG), generalizability, inference speed, and ablation studies.
5.1. RoC Analysis
To compare the rates of convergence of different methods for the interactive segmentation of remote sensing images, we compared the and of six methods with the same segmentor (HRNet32-OCR [44]), as shown in Table 2 and Table 3.

Table 2.
Comparison of the and on the Potsdam dataset. (The best is bolded and the runner-up is underlined).

Table 3.
Comparison of the and on the Vaihingen dataset. (The best is bolded and the runner-up is underlined).
It can be seen that, for all samples in the Potsdam dataset, our method achieved 13.7% and 9.8% improvements in the and , respectively. On the Vaihingen dataset, DRE-Net achieved 12.5% and 7.0% improvements in the and , respectively. Meanwhile, our DRE-Net was able to improve the NoC performance in each category. This indicates that the overall improvement of our DRE-Net was not a result of overfitting to some specific classes, but an improvement that fit all classes. In addition, DRE-Net was more effective in boosting hard samples with weak semantics, i.e., trees and low vegetation, than easy samples, i.e., buildings, cars, and surfaces. The near-effectiveness of -Net and -Net illustrated that the absolute values of the radii in the radius-mapping function weakly affected the prior information. The models could recognize the influences of different radii by learning the relative relationships of the radius values.
Figure 11 shows the mean IoU@k curves of the different methods. BRS, RGB-BRS, and f-BRS changed the direction of the curve when the prediction accuracy was close to the convergence value, which affected the RoC performance of the network. In contrast, our method achieved fast convergence and steadily rising curves in all experimental configurations. In addition, Figure 11 shows that the effect of DRE-Net on improving the rate of convergence was more significant in the early stage. When the prediction accuracy was close to the convergence value of the segmentor, the gain in the rate of convergence became smaller.

Figure 11.
Mean IoU@k curves for the Potsdam dataset and Vaihingen dataset.
5.2. CG Analysis
According to the rules described in Section 4.2, we used 100 clicks in succession on each sample through a computer simulation. The final mean IoU@k curves are shown in Figure 12.

Figure 12.
Comparison of the CG on the surface category in the Potsdam and Vaihingen datasets. A smoothly rising curve shows better CG performance.
Figure 12 shows large oscillations in the early stages of the mean IoU@k curves of f-BRS. These large oscillations meant that the predictions always failed to match the desires of the user during the interaction process. The oscillations of RITM were not significant in the early interactions. Still, there was a seriously steep drop in accuracy starting from the 70th click in the Potsdam dataset and the 40th in the Vaihingen dataset. This drop meant that when the mask accuracy was high enough, each adjustment by the user only worsened the mask, which was detrimental to the refinement of an existing high-accuracy mask. Like FocalClick, BRS, and RGB-BRS, our method maintained an upward trend accompanied by slight oscillations at any stage of the iterations and achieved a smoothly rising mean IoU@k curve.
5.3. Inference Speed and Generalizability Analysis
Following f-BRS [12], we evaluated the inference speed by measuring the seconds per click (SPC) and the total time evaluated for each dataset (time), as shown in Table 4. All of the experiments were completed with an Intel(R) Xeon(R) E5-2650 v4 2.20GHz Processo and an RTX 1080Ti.

Table 4.
Evaluation results for the metric and the inference speed on the Potsdam dataset and Vaihingen dataset. indicates the number of failures to reach the target IoU of 85%/90% within 20 clicks. SPC indicates the average running time in seconds per click, and the time measures the total running time taken to process a dataset. (The best is bolded and the runner-up is underlined).
BRS and RGB-BRS needed to pass forward and backward through the whole network multiple times. The enormous computational budgets led to their slow inference speed, which increased the time cost of annotation in practical applications. f-BRS optimized some intermediate parameters in the network instead of the input. Therefore, it showed a faster inference speed than that of BRS and RGB-BRS and reached the same level as FocalClick. The inference speed of DRE-Net and RITM was the fastest. The average inference delay per click was about 0.100 seconds, which was one-tenth of that of BRS and RGB-BRS. This proved that our DRE module is computationally friendly and slightly impacts the inference speed of the network.
As shown in Table 4, our method could achieve high-precision segmentation of more targets within 20 clicks. This proved that our method is not the result of overfitting to specific objects, but an overall improvement in the RoC and generalizability of the network.
5.4. Comprehensive Comparison
After comparing the convergence (RoC), convergence (CG), generalizability, and inference speed, the final comprehensive comparison results are shown in Table 5. In summary, BRS and RGB-BRS sacrificed the RoC performance and inference speed for a better CG performance. f-BRS improved the inference speed but degraded the CG performance. FocalClick was weak in terms of the RoC, while CG problems existed in RITM. The proposed DRE-Net showed superior performance for all four metrics.

Table 5.
Comprehensive comparison of the different methods.
To intuitively show the effectiveness of our approach, we visualized the interaction process of all test samples in a single image, as shown in Figure 13. Due to the expansion of the area in the early stages, our approach effectively reduced the requirement for subsequent interactions. As an example, for the low vegetation category (row 9 in Figure 13), our method covered the area that was not yet selected by the user in the second interaction (column 2 in Figure 13), thus reducing the number of subsequent clicks needed there. In addition, due to the overshoot caused by the unsuitable influence, RITM required multiple positive and negative click pairs to repeatedly adjust local details in the middle/late interactions. As shown in row 2 and column 4 of Figure 13, RITM required two negative clicks and one positive click to refine the corner of the building in the mask, while our method made it with only one negative click encoded with a small radius. This demonstrated that providing extra interaction information to the network could effectively improve its performance, especially for objects/regions with weak semantic information. The images in the red block in Figure 13 show the CG deterioration problem. When the user fine-tuned the mask, accuracy degradation was common for RITM, while our method could continuously improve the prediction accuracy with user interactions.
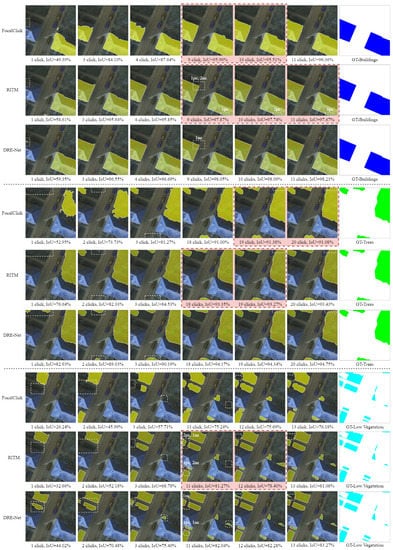
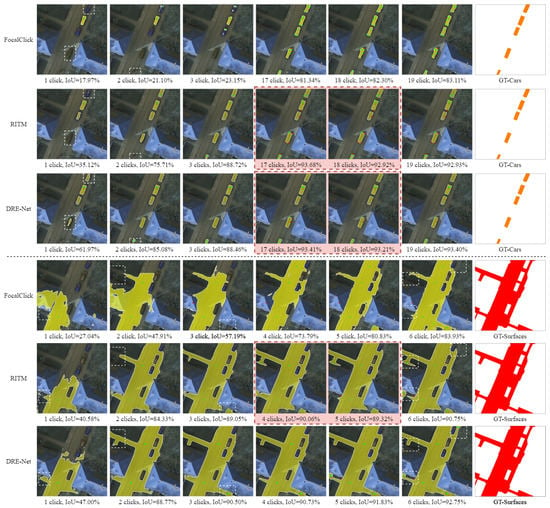
Figure 13.
Visualization of the interaction process for FocalClick [24], RITM [22], and our method. The green and red points stand for positive and negative clicks, respectively. The clicks were generated according to the rules described in Section 4.2, and their coding radii are presented. We changed the colors of ground-truth masks (cars and surfaces) to show them clearly. The images in the red block show the CG deterioration problem. The abbreviation “1pc, 2nc” indicates one positive and two negative clicks in the white block. Our method achieved high accuracy earlier while ensuring the CG of the network.
5.5. Ablation Studies
In Table 6 and Figure 14 and Figure 15, we discuss the effectiveness of the DRE module and the incremental training strategy. We took RITM as the baseline. When only the DRE module was added, the influence information embedded in DRE fMaps was not effectively learned. Therefore, the RoC performance was improved, while there was still a CG deterioration problem. Since the incremental training strategy alleviated the problem of unbalanced training materials, it could improve the RoC of the baseline model. However, without distinguishing clicks, the baseline model could not separate the different stages during interactions, leading to limited generalizability and CG performance. The incremental training strategy provided specific training materials for different interactions and, thus, fully exploited the potential of DRE-Net. Therefore, the model was optimal when the DRE module and the incremental training strategy were used together. In addition, our method did not introduce any additional weights to the network, which was strong proof of its effectiveness.

Table 6.
RoC ablation results for the Potsdam and Vaihingen datasets. The abbreviations “BS” and “IT” indicate the baseline and incremental training strategy, respectively. (The best is bolded and the runner-up is underlined).

Figure 14.
RoC ablation results for the Potsdam and Vaihingen datasets. The abbreviations “BS” and “IT” indicate the baseline and incremental training strategy, respectively.

Figure 15.
CG ablation results for the surface category in the Potsdam and Vaihingen datasets. The abbreviations “BS” and “IT” indicate the baseline and incremental training strategy, respectively. A smoothly rising curve shows better CG performance.
Table 7 shows the problem of the previous training strategy and the effectiveness of the RoC-first training stage and incremental training stage. Firstly, as the threshold increased, the mIoU under each click in the iterations showed a rising and then falling trend, which was most evident on the first click. This training strategy made it difficult to improve the performance of the network in all iterations, and we could only obtain a limited result by adjusting the threshold .

Table 7.
Test results on the Potsdam dataset under different thresholds and different hyperparameters . stands for the model trained on a radius of 7 pixels and . mIoU@k represents the mean intersection over union (IoU) between the predictions and ground-truth masks at the kth iteration. (The best is bolded).
Secondly, it can be seen that increasing the radius value without changing did not work well. However, when was expanded to 8000, the network showed a significant increase in accuracy in the early interactions. Because did not learn how to fine-tune, the decrease in accuracy in the middle/late interactions was as expected. The result () of the RoC-first training stage was consistent with our design intention.
Thirdly, the result (DRE-Net) of the incremental training stage not only outperformed the baseline in all iterations, but also outperformed in the early interactions. This proved that the incremental training stage successfully added the middle/late knowledge to the network. In addition, as middle/late stages may still exist, there are still some constraints for the network in expanding the influences of clicks in the RoC-first training stage. In contrast, in the incremental training stage, with the advantage of the DRE module, we trained the clicks of different purposes with corresponding materials and, thus, fully released the potential of the network.
6. Discussion
The interaction process has the characteristic that, in the early stage, clicks are always located in the center of objects for the outline selection. In contrast, clicks are located near the object edges for the adjustment of details in the middle/late stage. These two stages are contradictory to some extent. In the early stage, the click influence should be enlarged to increase the rate of convergence. In the middle/late stage, the click influence should be weakened to prevent convergence deterioration problems caused by overshoot or unexpected changes in other regions. An undifferentiated encoding method cannot distinguish among different clicks, resulting in limited performance in all stages. This is why our DRE-Net can improve the rate of convergence and the convergence at the same time and why the improvement in the RoC is more significant in the early stage than in the middle/late stage. In addition, the insufficient interactive information in other methods makes the networks heavily dependent on the semantic information extracted from the object. This explains why DRE-Net boosts hard samples with weak semantics more effectively. Lastly, the incremental training strategy makes the network consider the early and middle/late stages simultaneously when updating the model parameters. Therefore, the model can be fully trained through the incremental training strategy, thus improving its performance.
However, there are still some limitations left. On the one hand, the idea that we introduced to determine the mapping interval of the radius-mapping function may not be the optimal solution. There may be a better scheme for determining the mapping interval to make the network learn the prior information through the training set more effectively. On the other hand, determining our radius-mapping function requires the statistical distribution of the training dataset. Therefore, when the training dataset changes, the radius-mapping function should also be accordingly adjusted, which is inconvenient.
7. Conclusions
In this paper, an improved interactive segmentation model for remote sensing images was proposed to make the network output predictable and benefit mask-level annotation and refinement. To improve the rate of convergence (RoC) and convergence (CG) of the network at the same time, we proposed a dynamic radius-encoding (DRE) algorithm to distinguish the purpose of each click. Based on the DRE algorithm, we proposed DRE-Net to tell the network the different influences of each click and make the clicks with different purposes perform their respective roles. We proposed an incremental training strategy that enables the network to be trained sufficiently while considering both the rate of convergence (RoC) and the convergence (CG). The experimental results showed that our method could achieve a state-of-the-art rate of convergence on all categories of the Potsdam and Vaihingen datasets. Our method achieved 13.7% and 12.5% improvements in the , 9.75% and 7.03% improvements in the , 28.22% and 25% improvements in the , and 15.7% and 9.6% improvements in the on the Potsdam dataset and Vaihingen dataset, respectively. Meanwhile, our method is at the optimal level in terms of convergence and convergence speed.
Overall, our method essentially optimizes the trend of the mean IoU@k curve by introducing prior information. However, it does not drastically change the convergence value. We consider that this may be because the interaction information only plays an auxiliary role, and the semantic information extracted by the network determines the convergence value. In future research, we will explore the influences of different segmentors on the performance in the interactive segmentation of remote sensing images and study the possibility of improving the convergence value of the mean IoU@k curve for multi-spectral remote sensing images that hold more semantic information.
Author Contributions
Conceptualization, L.Y. and H.C.; Methodology, L.Y. and H.C.; Software, L.Y.; Validation, L.Y., W.Z. and H.C.; Data Curation, H.C.; Writing—Original Draft Preparation, L.Y.; Writing—Review and Editing, H.C. and S.P.; Supervision, H.C.; Project Administration, H.C. All authors have read and agreed to the published version of the manuscript.
Funding
This work was supported in part by the National NSF of China under grants No.U19A2058, No.41971362, No.41871248, and No.62106276.
Acknowledgments
The authors would like to thank the anonymous referees for their valuable comments and helpful suggestions.
Conflicts of Interest
The authors declare no conflict of interest.
References
- Wang, S.; Cao, J.; Yu, P.S. Deep Learning for Spatio-Temporal Data Mining: A Survey. IEEE Trans. Knowl. Data Eng. 2022, 34, 3681–3700. [Google Scholar] [CrossRef]
- Martinez, R.P.; Schiopu, I.; Cornelis, B.; Munteanu, A. Real-Time Instance Segmentation of Traffic Videos for Embedded Devices. Sensors 2021, 21, 275. [Google Scholar] [CrossRef] [PubMed]
- Chen, H.; Peng, S. SW-GAN: Road Extraction from Remote Sensing Imagery Using Semi-Weakly Supervised Adversarial Learning. Remote Sens. 2022, 14, 4145. [Google Scholar] [CrossRef]
- Shamsolmoali, P.; Zareapoor, M.; Zhou, H.; Wang, R.; Yang, J. Road Segmentation for Remote Sensing Images Using Adversarial Spatial Pyramid Networks. IEEE Trans. Geosci. Remote Sens. 2021, 59, 4673–4688. [Google Scholar] [CrossRef]
- Zhang, C.; Sargent, I.; Pan, X.; Li, H.; Gardiner, A.; Hare, J.S.; Atkinson, P.M. Joint deep learning for land cover and land use classification. Remote Sens. Environ. 2019, 221, 173–187. [Google Scholar] [CrossRef]
- Wang, L.; Li, R.; Zhang, C.; Fang, S.; Duan, C.; Meng, X.; Atkinson, P.M. UNetFormer: An UNet-like Transformer for Efficient Semantic Segmentation of Remote Sensing Urban Scene Imagery. ISPRS J. Photogramm. Remote Sens. 2022, 190, 196–214. [Google Scholar] [CrossRef]
- Wang, L.; Li, R.; Duan, C.; Zhang, C.; Meng, X.; Fang, S. A Novel Transformer based Semantic Segmentation Scheme for Fine-Resolution Remote Sensing Images. IEEE Geosci. Remote Sens. Lett. 2022, 19, 1–5. [Google Scholar] [CrossRef]
- Xu, N.; Price, B.; Cohen, S.; Yang, J.; Huang, T.S. Deep interactive object selection. In Proceedings of the IEEE Conference on Computer Vision and Pattern Recognition (CVPR), Las Vegas, NV, USA, 27–30 June 2016; pp. 373–381. [Google Scholar]
- Cheng, M.M.; Hou, Q.; Zhang, S.H.; Rosin, P.L. Intelligent Visual Media Processing: When Graphics Meets Vision. J. Comput. Sci. Technol. 2017, 32, 110–121. [Google Scholar] [CrossRef]
- Cheng, M.M.; Zhang, F.L.; Mitra, N.J.; Huang, X.; Hu, S.M. RepFinder: Finding approximately repeated scene elements for image editing. Int. Conf. Comput. Graph. Interact. Tech. 2010, 29, 1–8. [Google Scholar] [CrossRef]
- Lin, Z.; Zhang, Z.; Chen, L.Z.; Cheng, M.M.; Lu, S.P. Interactive Image Segmentation with First Click Attention. In Proceedings of the IEEE/CVF Conference on Computer Vision and Pattern Recognition (CVPR), Seattle, WA, USA, 14–19 June 2020; pp. 13339–13348. [Google Scholar]
- Sofiiuk, K.; Petrov, I.A.; Barinova, O.; Konushin, A. F-BRS: Rethinking Backpropagating Refinement for Interactive Segmentation. In Proceedings of the 2020 IEEE/CVF Conference on Computer Vision and Pattern Recognition (CVPR), Seattle, WA, USA, 14–19 June 2020; pp. 8620–8629. [Google Scholar]
- Dupont, C.; Ouakrim, Y.; Pham, Q.C. UCP-Net: Unstructured Contour Points for Instance Segmentation. In Proceedings of the 2021 IEEE International Conference on Systems, Man, and Cybernetics (SMC), Melbourne, Australia, 17–20 October 2021; pp. 3373–3379. [Google Scholar]
- Wang, G.; Zuluaga, M.A.; Li, W.; Pratt, R.; Patel, P.A.; Aertsen, M.; Doel, T.; David, A.L.; Deprest, J.; Ourselin, S.; et al. DeepIGeoS: A Deep Interactive Geodesic Framework for Medical Image Segmentation. IEEE Trans. Pattern Anal. Mach. Intell. 2019, 41, 1559–1572. [Google Scholar] [CrossRef]
- Cheng, M.M.; Prisacariu, V.A.; Zheng, S.; Torr, P.H.S.; Rother, C. DenseCut: Densely Connected CRFs for Realtime GrabCut. Comput. Graph. Forum 2015, 34, 193–201. [Google Scholar] [CrossRef]
- Rother, C.; Kolmogorov, V.; Blake, A. “GrabCut” interactive foreground extraction using iterated graph cuts. ACM Trans. Graph. (TOG) 2004, 23, 309–314. [Google Scholar] [CrossRef]
- Bai, J.; Wu, X. Error-Tolerant Scribbles Based Interactive Image Segmentation. In Proceedings of the IEEE Conference on Computer Vision and Pattern Recognition (CVPR), Columbus, OH, USA, 23–28 June 2014; pp. 392–399. [Google Scholar]
- Freedman, D.; Zhang, T. Interactive graph cut based segmentation with shape priors. In Proceedings of the IEEE Computer Society Conference on Computer Vision and Pattern Recognition (CVPR), San Diego, CA, USA, 20–25 June 2005; pp. 755–762. [Google Scholar]
- Maninis, K.K.; Caelles, S.; Pont-Tuset, J.; Gool, L.V. Deep Extreme Cut: From Extreme Points to Object Segmentation. In Proceedings of the IEEE Conference on Computer Vision and Pattern Recognition (CVPR), Salt Lake City, UT, USA, 18–22 June 2018; pp. 616–625. [Google Scholar]
- Papadopoulos, D.P.; Uijlings, J.; Keller, F.; Ferrari, V. Extreme clicking for efficient object annotation. In Proceedings of the IEEE International Conference on Computer Vision (ICCV), Venice, Italy, 22–29 October 2017; pp. 4930–4939. [Google Scholar]
- Hao, Y.; Liu, Y.; Wu, Z.; Han, L.; Chen, Y.; Chen, G.; Chu, L.; Tang, S.; Yu, Z.; Chen, Z.; et al. EdgeFlow: Achieving Practical Interactive Segmentation with Edge-Guided Flow. In Proceedings of the IEEE/CVF International Conference on Computer Vision (ICCV) Workshops, Montreal, QC, Canada, 11–17 October 2021; pp. 1551–1560. [Google Scholar]
- Sofiiuk, K.; Petrov, I.A.; Konushin, A. Reviving Iterative Training with Mask Guidance for Interactive Segmentation. In Proceedings of the 2022 IEEE International Conference on Image Processing (ICIP), Bordeaux, France, 16–19 October 2022; pp. 3141–3145. [Google Scholar] [CrossRef]
- Jang, W.D.; Kim, C.S. Interactive image segmentation via backpropagating refinement scheme. In Proceedings of the IEEE/CVF Conference on Computer Vision and Pattern Recognition, Long Beach, CA, USA, 15–20 June 2019; pp. 5297–5306. [Google Scholar]
- Chen, X.; Zhao, Z.; Zhang, Y.; Duan, M.; Qi, D.; Zhao, H. FocalClick: Towards Practical Interactive Image Segmentation. In Proceedings of the IEEE/CVF Conference on Computer Vision and Pattern Recognition (CVPR), New Orleans, LA, USA, 19–24 June 2022; pp. 1300–1309. [Google Scholar]
- Liew, J.H.; Wei, Y.; Xiong, W.; Ong, S.H.; Feng, J. Regional Interactive Image Segmentation Networks. In Proceedings of the 2017 IEEE International Conference on Computer Vision (ICCV), Venice, Italy, 22–29 October 2017; pp. 2746–2754. [Google Scholar] [CrossRef]
- Gleicher, M. Image snapping. In Proceedings of the 22nd Annual Conference on Computer Graphics and Interactive Techniques, New York, NY, USA, 15 September 1995; pp. 183–190. [Google Scholar] [CrossRef]
- Grady, L. Random walks for image segmentation. IEEE Trans. Pattern Anal. Mach. Intell. 2006, 28, 1768–1783. [Google Scholar] [CrossRef] [PubMed]
- Bai, X.; Sapiro, G. Geodesic matting: A framework for fast interactive image and video segmentation and matting. Int. J. Comput. Vis. 2009, 82, 113–132. [Google Scholar] [CrossRef]
- Mortensen, E.N.; Barrett, W.A. Intelligent scissors for image composition. In Proceedings of the 22nd Annual conference on Computer Graphics and Interactive Techniques, New York, NY, USA, 15 September 1995; pp. 191–198. [Google Scholar]
- Long, J.; Shelhamer, E.; Darrell, T.; Berkeley, U. Fully Convolutional Networks for Semantic Segmentation. In Proceedings of the IEEE Conference on Computer Vision and Pattern Recognition (CVPR), Boston, MA, USA, 7–12 June 2015; pp. 3431–3440. [Google Scholar]
- Lee, K.M.; Myeong, H.; Song, G. SeedNet: Automatic Seed Generation with Deep Reinforcement Learning for Robust Interactive Segmentation. In Proceedings of the IEEE Conference on Computer Vision and Pattern Recognition (CVPR), Salt Lake City, UT, USA, 18–22 June 2018; pp. 1760–1768. [Google Scholar]
- Hu, Y.; Soltoggio, A.; Lock, R.; Carter, S. A Fully Convolutional Two-Stream Fusion Network for Interactive Image Segmentation. Neural Netw. Off. J. Int. Neural Netw. Soc. 2019, 109, 31–42. [Google Scholar] [CrossRef]
- Forte, M.; Price, B.; Cohen, S.; Xu, N.; Pitié, F. Getting to 99% accuracy in interactive segmentation. arXiv 2020, arXiv:2003.07932. [Google Scholar]
- Kirkpatrick, J.; Pascanu, R.; Rabinowitz, N.C.; Veness, J.; Desjardins, G.; Rusu, A.; Milan, K.; Quan, J.; Ramalho, T.; Grabska-Barwinska, A.; et al. Overcoming catastrophic forgetting in neural networks. Proc. Natl. Acad. Sci. USA. 2017, 114, 3521–3526. [Google Scholar] [CrossRef]
- Donahue, J.; Jia, Y.; Vinyals, O.; Hoffman, J.; Zhang, N.; Tzeng, E.; Darrell, T. DeCAF: A Deep Convolutional Activation Feature for Generic Visual Recognition. Int. Conf. Mach. Learn. 2014, 32, 647–655. [Google Scholar]
- Razavian, A.S.; Azizpour, H.; Sullivan, J.; Carlsson, S. CNN Features off-the-shelf: An Astounding Baseline for Recognition. In Proceedings of the IEEE Conference on Computer Vision and Pattern Recognition (CVPR), Columbus, OH, USA, 23–28 June 2014; pp. 806–813. [Google Scholar]
- Girshick, R.; Donahue, J.; Darrell, T.; Malik, J.; Berkeley, U. Rich feature hierarchies for accurate object detection and semantic segmentation. In Proceedings of the IEEE Conference on Computer Vision and Pattern Recognition (CVPR), Columbus, OH, USA, 23–28 June 2014; pp. 580–587. [Google Scholar]
- Azizpour, H.; Razavian, A.S.; Sullivan, J.; Maki, A.; Carlsson, S. Factors of Transferability for a Generic ConvNet Representation. IEEE Trans. Pattern Anal. Mach. Intell. 2016, 38, 1790–1802. [Google Scholar] [CrossRef] [PubMed]
- Caruana, R. Multitask learning. Mach. Learn. 1997, 28, 41–75. [Google Scholar] [CrossRef]
- Chapelle, O.; Shivaswamy, P.K.; Vadrevu, S.; Weinberger, K.Q.; Zhang, Y.; Tseng, B.L. Boosted multi-task learning. Mach. Learn. 2011, 85, 149–173. [Google Scholar] [CrossRef]
- Li, Z.; Hoiem, D. Learning without Forgetting. IEEE Trans. Pattern Anal. Mach. Intell. 2018, 40, 2935–2947. [Google Scholar] [CrossRef] [PubMed]
- Duan, X.C.Z.Y.Z. Conditional Diffusion for Interactive Segmentation. In Proceedings of the 2021 IEEE/CVF International Conference on Computer Vision (ICCV), Montreal, QC, Canada, 10–17 October 2021; pp. 7345–7354. [Google Scholar]
- Benenson, R.; Popov, S.; Ferrari, V. Large-Scale Interactive Object Segmentation With Human Annotators. In Proceedings of the 2019 IEEE/CVF Conference on Computer Vision and Pattern Recognition (CVPR), Long Beach, CA, USA, 15–20 June 2019; pp. 11692–11701. [Google Scholar]
- Sun, K.; Xiao, B.; Liu, D.; Wang, J. Deep high-resolution representation learning for human pose estimation. In Proceedings of the IEEE/CVF Conference on Computer Vision and Pattern Recognition (CVPR), Long Beach, CA, USA, 15–20 June 2019; pp. 5693–5703. [Google Scholar]
- Zi, W.; Xiong, W.; Hao, C.; Li, J.; Jing, N. SGA-Net: Self-Constructing Graph Attention Neural Network for Semantic Segmentation of Remote Sensing Images. Remote Sens. 2021, 13, 4201. [Google Scholar] [CrossRef]
- Chen, L.C.; Zhu, Y.; Papandreou, G.; Schroff, F.; Adam, H. Encoder-Decoder with Atrous Separable Convolution for Semantic Image Segmentation. In Proceedings of the European Conference on Computer Vision (ECCV), Munich, Germany, 8–14 September 2018; pp. 801–818. [Google Scholar]
- Sofiiuk, K.; Barinova, O.; Konushin, A. AdaptIS: Adaptive Instance Selection Network. In Proceedings of the IEEE/CVF International Conference on Computer Vision (ICCV), Seoul, Republic of Korea, 27 October–2 November 2019; pp. 7355–7363. [Google Scholar]
Disclaimer/Publisher’s Note: The statements, opinions and data contained in all publications are solely those of the individual author(s) and contributor(s) and not of MDPI and/or the editor(s). MDPI and/or the editor(s) disclaim responsibility for any injury to people or property resulting from any ideas, methods, instructions or products referred to in the content. |
© 2023 by the authors. Licensee MDPI, Basel, Switzerland. This article is an open access article distributed under the terms and conditions of the Creative Commons Attribution (CC BY) license (https://creativecommons.org/licenses/by/4.0/).